Abstract
AgBiSe2, which exhibits complex structural phase transition behavior, has recently been considered as a potential thermoelectric material due to its intrinsically low thermal conductivity. In this work, we investigate the crystal structure of Sn-doped AgBiSe2 through powder X-ray diffraction and differential scanning calorimetry measurements. A stable cubic Ag1−x/2Bi1−x/2SnxSe2 phase can be obtained at room temperature when the value of x is larger than 0.2. In addition, the thermoelectric properties of Ag1−x/2Bi1−x/2SnxSe2 (x = 0.2, 0.25, 0.3, 0.35) are investigated, revealing that Ag1−x/2Bi1−x/2SnxSe2 compounds are intrinsic semiconductors with a low lattice thermal conductivity. This work provides new insights into the crystal structure adjustment of AgBiSe2 and shows that Ag1−x/2Bi1−x/2SnxSe2 is a potentially lead-free thermoelectric material candidate.
1. Introduction
As devices that can convert heat and electricity, thermoelectric devices have received significant attention and have become a research hotspot in recent years [1,2,3]. The thermoelectric properties of materials can be evaluated by using the dimensionless quantity ZT. The value of ZT can be calculated with the formula S2σT/(кele + кlatt), where S, σ, T, кele, and кlatt are the Seebeck coefficient, electrical conductivity, temperature, electronic thermal conductivity, and lattice thermal conductivity, respectively. Accordingly, semiconductors with low lattice thermal conductivities have been widely studied and show excellent thermoelectric performance. These semiconductors include Zintl phases [4,5], fast ion conductors [6,7], complex oxides [8,9], and chalcogenides [10].
Ternary chalcogenides with the I-V-VI2 formula (I = Cu, Ag; V = As, Sb, Bi; VI = S, Se, Te) have an intrinsically ultra-low lattice thermal conductivity due to their unique crystal structures [11,12,13]. For example, due to the anharmonicity caused by the repulsion between neighboring chalcogen ions and lone-pair electrons, the lattice thermal conductivity of CuSbS2 is only about 0.5 W·m−1·K−1 at 627 K [14]. In AgSbSe2 and AgSbTe2, the mixing of Ag and Sb atoms can lead to a further decline in lattice thermal conductivity [15,16,17,18]. I-V-VI2 compounds have a wide range of structural diversity. The crystal structure of Cu-containing compounds such as CuSbS2 and CuSbSe2 can be viewed as the stacking of [CuSb(S/Se)2] layers in an AᾹAᾹ-type sequence along the c axis direction [19,20]. AgSbSe2 and AgSbTe2 crystallize in the cubic space group Fmm with disordered Ag and Sb cations [21], while AgBiVI2 (VI = S, Se, Te) compounds exhibit complex temperature-dependent phase transition behavior [22,23,24,25].
AgBiSe2 compound exists in three polymorphs: a disordered cubic phase, an ordered hexagonal phase, and a rhombohedral phase. Their structures are shown in Figure 1. As an n-type semiconductor with poor electrical conductivity, the thermoelectric properties of AgBiSe2 can be enhanced by increasing the charge carrier concentration via doping In, Nb, or Ge at Ag sites [26,27,28] or by doping halogen elements at Se sites [29]. Both experimental and density functional theory calculation results indicate that p-type hexagonal AgBiSe2 can potentially be used in room-temperature thermoelectric applications [30,31]. Additionally, the phase transition temperatures of AgBi1−xSbxSe2 are determined by the doping concentration of Sb [32,33]. Very recently, Br-doped cubic (AgBiSe2)0.7(PbSe)0.3 phase has been proved to be potential material with fine thermoelectric properties in the range from 300 to 800 K [34]. The stable cubic AgBiSe2 phase may potentially exhibit excellent thermoelectric properties due to its intrinsic crystal structures and related electronic structures. The high symmetry can result in energy band degeneracy, and thus lead to high power factor, while the material with disordered atoms usually exhibits ultra-low lattice thermal conductivity [35]. Accordingly, further investigation into methods for achieving a stable cubic AgBiSe2 phase and enhancing its thermoelectric properties are of great interest.
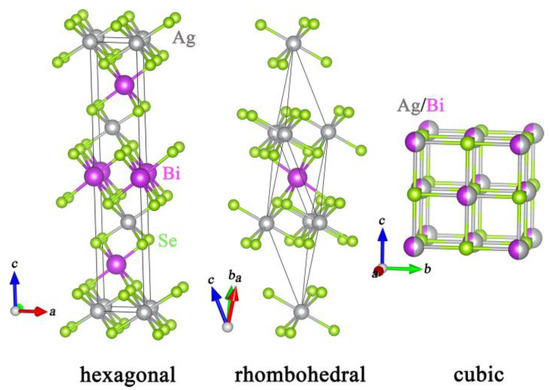
Figure 1.
Crystal structures of the hexagonal, rhombohedral, and cubic phases of AgBiSe2.
Inspired by the research on (AgBiSe2)1−x(PbSe)x, we focus on another IV-A metal and find that a stabilized room-temperature cubic AgBiSe2 phase can also be achieved via Sn substitution. In previous studies, both AgSbSe2 and PbSe have cubic crystal structures, so it is not hard to understand the phase transition behavior in (AgBiSe2)1−x(AgSbSe2)x and (AgBiSe2)1−x(PbSe)x solid solutions [32,33,34]. Herein, although the crystal structure of SnSe is not cubic [36], the solid solution between SnSe and AgBiSe2 has a cubic structure at room temperature. Such a finding indicates that in-depth studies on structural phase transition and its related physical properties are needed. In addition, in this work the thermoelectric properties were also investigated, and the results indicate that Ag1−x/2Bi1−x/2SnxSe2 is a potentially lead-free thermoelectric material with ultra-low lattice thermal conductivity.
2. Materials and Methods
Ag1−x/2Bi1−x/2SnxSe2 samples were prepared via high-temperature solid-state reactions. Stoichiometric amounts of Ag (Alfa, 99.9%), Bi (Aladdin, 99.999%), Sn (Alfa, 99.99%), and Se (Alfa, 99.99%) were cut into small pieces and weighed in an argon-filled glovebox. The elements were mixed and loaded into evacuated silica tubes. The tubes were then heated to 1273 K at a rate of 80 K/h and homogenized at this temperature for 20 h using a programmable furnace. Finally, the tubes were slowly cooled down to room temperature over 20 h. The synthesized ingots were ground into fine powders for use in further measurements.
Powder X-ray diffraction (PXRD) patterns of Ag1−x/2Bi1−x/2SnxSe2 were measured with a step size of 0.02° by using a Bruker D8 Advance X-ray powder diffractometer at room temperature and Cu Kα radiation. Rietveld refinements of AgBiSe2, Ag0.975Bi0.975Sn0.05Se2, and Ag0.95Bi0.95Sn0.10Se2 were performed using Fullprof [37]. Differential scanning calorimetry (DSC) measurements were performed on the polycrystalline powders of Ag1−x/2Bi1−x/2SnxSe2 (35–45 mg) using a NETZSCH STA 449 F3. DSC measurements were taken over a temperature range of 350 K to 650 K. The heating rate was 10 K/min. The microstructure and energy-dispersive spectroscopy (EDS) mapping of Ag0.90Bi0.90Sn0.20Se2 sample were carried out using a Zeiss Sigma 500 field emission scanning electron microscopy (SEM).
Ag1−x/2Bi1−x/2SnxSe2 (x = 0.2, 0.25, 0.3, 0.35) powders were sintered into pellets with high relative densities by using a LABOX-325 spark plasma sintering instrument (Dr. Sinter Land). An axial compressive stress of 40 MPa was applied at 773 K for 7 min under 10 Pa. The Seebeck coefficients and electrical conductivity values at temperatures of 300 K to 773 K were measured using a NETZSCH SBA 458 instrument with a temperature gradient of 4 K across ~8.25 mm. Thermal conductivity was calculated using the standard formula κ = CpDρ, where Cp is the specific heat calculated by the Dulong-Petit law, D is the thermal diffusivity measured using the laser flash method (NETZSCH LFA 457), and ρ is the measured mass density.
3. Results and Discussion
Theoretical diffraction patterns for hexagonal, rhombohedral, and cubic AgBiSe2 are shown in Figure 2a, while Figure 2b shows PXRD patterns for Ag1−x/2Bi1−x/2SnxSe2 (x = 0, 0.1, 0.15, 0.2, 0.25, 0.30, 0.35). The measured diffraction patterns of AgBiSe2 are completely consistent with the theoretical patterns of the hexagonal phase, indicating that the pristine AgBiSe2 is phase pure. The diffraction patterns change with increasing Sn concentration in the Sn-doped compounds. For instance, the (110) diffraction pattern at 43.26° and (018) diffraction pattern at 44.52° become closer with an increasing Sn ratio. Meanwhile, some small patterns such as (003) at 13.5°, (101) at 24.98°, and (006) at 27.18° disappear when x is higher than 0.15. The PXRD patterns for the samples with high Sn concentrations are similar to the theoretical diffraction patterns of cubic AgBiSe2, revealing that a stable cubic phase can be achieved at room temperature via Sn doping. There are no impurity patterns in the measured data, indicating that solid solutions were formed in all the samples. It should be noticed that although the diffraction patterns of Ag0.925Bi0.925Sn0.15Se2 are consistent with the cubic phase, the broad pattern at about 43.82° potentially hints that Ag0.925Bi0.925Sn0.15Se2 is an intermediate phase between the hexagonal and cubic phases. Accordingly, only the thermoelectric properties of cubic Ag1−x/2Bi1−x/2SnxSe2 (x = 0.2, 0.25, 0.3, 0.35) are discussed in this paper.
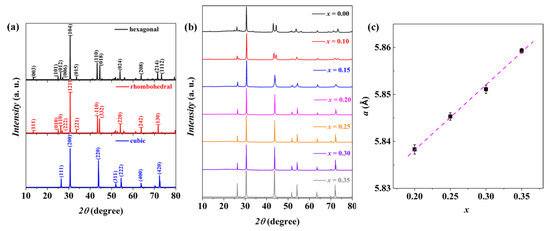
Figure 2.
(a) Theoretical diffraction patterns for hexagonal, rhombohedral, and cubic phase AgBiSe2. Patterns are labeled with their primary crystal indices. (b) Experimental diffraction patterns of Ag1−x/2Bi1−x/2SnxSe2 (x = 0, 0.10, 0.15, 0.20, 0.25, 0.30, 0.35). (c) Calculated lattice parameters (a) from the PXRD results vs. Sn concentration (x). The dashed line indicates the best linear fit of the lattice parameters.
As shown in Figure 2c, the lattice parameters determined from the experimental PXRD patterns increase linearly with increasing Sn concentration. This is consistent with Vegard’s law. In general, variations in the lattice parameter of chalcogenide semiconductors can be explained by ionic radius differences between the intrinsic and doped elements. Since the ionic radius of Sn2+ is difficult to define [38], the increased lattice parameter cannot be directly explained by comparing ionic radii. However, a cubic SnSe phase which crystallizes in a rock salt structure may potentially help understand this change in lattice parameter [39]. The Sn-Se bonding distance in cubic SnSe is about 2.995 Å, much longer than the Ag/Bi-Se distance of 2.916 Å in cubic AgBiSe2. Thus, the ionic radius of Sn2+ in the rock salt structure should be larger than the average ionic radius between Ag+ and Bi3+.
DSC measurements were performed for Ag1−x/2Bi1−x/2SnxSe2 (x = 0, 0.05, 0.10, 0.15, 0.20, 0.25, 0.30) in order to understand the polymorph change at room temperature. The results are shown in Figure 3. For pristine AgBiSe2, one small peak at about 500 K indicates the phase transition from a hexagonal to a rhombohedral phase, while the sharp peak at 586 K represents the transformation to a cubic phase. For Sn-containing materials, the temperature corresponding to the sharp endothermic peak decreases with increasing Sn concentrations. Therefore, the thermal energy required to overcome the potential energy between the hexagonal and cubic phases also decreases. For Ag0.925Bi0.925Sn0.15Se2, a small and flat endothermic peak at about 520 K indicates the existence of the hexagonal phase, consistent with the prior discussion of PXRD data. The finding is interesting since neither AgBiSe2 nor SnSe has a cubic structure at room temperature. Accordingly, in order to understand the phenomenon, detailed analysis of the crystal structures for Ag-V-Se (V = As, Sb, Bi) compounds was performed.
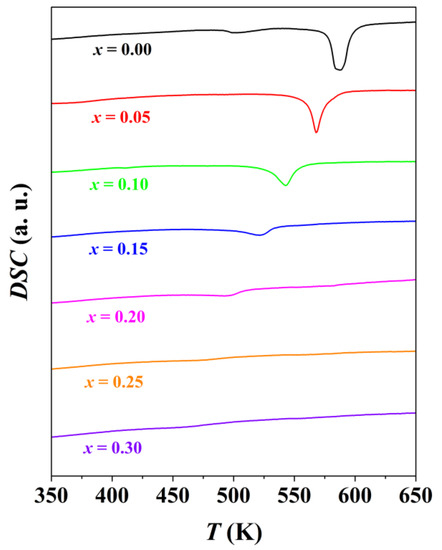
Figure 3.
DSC curves for Ag1−x/2Bi1−x/2SnxSe2 (x = 0, 0.05, 0.10, 0.15, 0.20, 0.25, 0.30) samples in the range of 350 K to 650 K. The endothermic direction is downward in the figure.
AgBiSe2 shows multiple crystal phase transitions with increasing temperature, transforming from ordered hexagonal Pm1 to rhombohedral RmR and then to the disordered rock salt structure [21]. AgSbSe2 is a cubic phase material with mixed Ag and Sb atoms [21], while AgAsSe2 crystallizes in the rhombohedral space group RmH [40]. Although these compounds crystallize in different space groups, their crystal structures are very similar, as shown in Figure 4. It is clear that the difference between Ag-Se and V-Se bonding distances plays a major role in determining the crystal structure of Ag-V-Se materials. In order to describe the bonding distance difference simply, the ratios between average Ag-Se and V-Se bonding distances in octahedrons are shown in the figure. The ratios of ravg(Ag-Se)/ravg(V-Se) for AgBiSe2, AgSbSe2 and AgAsSe2 are 0.95, 1.00, and 1.09, respectively. The ratios affect the Se-As-Se angle directly, and further determine the distortion degree of the octahedral environments. The longer Bi-Se distance in AgBiSe2 leads to a Se-Bi-Se angle of 87.2°. In contrast, the shorter As-Se distance of 2.710 Å in AgAsSe2 results in a larger Se-As-Se angle (92.5°). Accordingly, for AgVSe2 compounds, adjustment of Ag-Se and V-Se distances can change the crystal structure. The Sn-Se bonding distance is longer than the Ag-Se distances but shorter than the Bi-Se distances. In Ag1−x/2Bi1−x/2SnxSe2, the bonding distance difference between Ag/Sn-Se and Bi/Sn-Se decreases with increasing Sn ratio. So the crystal structure of AgBiSe2 can be transformed to cubic phase via Sn doping. The Rietveld refinement results of Ag1−x/2Bi1−x/2SnxSe2 (x = 0, 0.05, 0.10) are consistent with the above analysis. As is shown in Figure S1, the Se-Bi-Se angle increases with increasing x value. Considering that these structures are extremely complex, further experimental studies on the crystal structures of metal-doped AgBiVI2 (VI = S, Se, Te) are still needed.
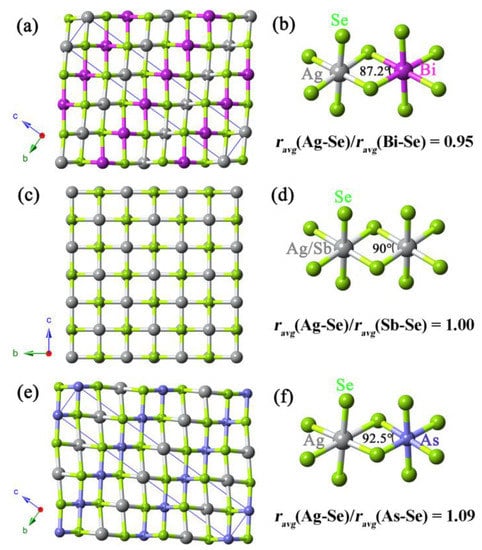
Figure 4.
Ball-and-stick representation of (a) hexagonal AgBiSe2, (c) AgSbSe2, and (e) AgAsSe2. Ball-and-stick views of fragments showing the connection between [AgSe6] and (b) [BiSe6], (d) [SbSe6], and (f) [AsSe6] octahedrons. The ravg(Ag-Se), ravg(Bi-Se), ravg(Sb-Se) and ravg(As-Se) in the figure are average bonding distances of Ag-Se, Bi-Se, Sb-Se and As-Se in octahedrons, respectively.
As shown in Figure S2, there is no obvious pore or crack in the cross-sectional image, suggesting high density of the sintered sample. The distribution for all elements is homogeneous, indicating that the material is phase pure. Figure 5 shows the measured temperature-dependent thermoelectric transport properties of Ag1−x/2Bi1−x/2SnxSe2. Tin doping leads to significant changes in both the Seebeck coefficient and electrical conductivity. Due to the phase transition behaviour, both Seebeck coefficient and electrical conductivity of pristine AgBiSe2 do not change monotonically with increasing temperature. Pristine AgBiSe2 is an intrinsic n-type semiconductor with a negative Seebeck coefficient over the entire measured temperature range. The Seebeck coefficients of the Sn-doped materials are positive at room temperature, indicating that the dominating charge carriers are holes. The room-temperature Seebeck coefficient of Ag0.90Bi0.90Sn0.20Se2 is about +130 μV/K, while that of Ag0.875Bi0.875Sn0.25Se2 increases to about +350 μV/K. A similar carrier type transition behaviour has been observed in AgBi1-xSbxSe2 [33,34]. With increasing temperature, the Seebeck coefficients of the Ag1−x/2Bi1−x/2SnxSe2 samples are converted into n-type negative values. The carrier type change from p-type to n-type can be attributed to the thermally generated extrinsic carriers at high temperatures. The absolute value of the Seebeck coefficients in the high-temperature region decreases with increasing Sn content. With increasing temperature, the electrical conductivity of all materials exponentially increases, indicating that the cubic crystal structure Sn-doped materials are intrinsic semiconductors. As shown in Figure S3, the logarithmic plot of ρ in the high temperature region versus the inverse temperature show linearity. According to the thermal activation model, the energy band gaps for all Sn-doped samples are calculated using the formula ln ρT = Eg/2kBT + f, where Eg is the band gap, T is the absolute temperature, and kB is the Boltzmann constant. The band gaps deduced from thermal activation model for Ag0.90Bi0.90Sn0.20Se2, Ag0.875Bi0.875Sn0.25Se2, Ag0.85Bi0.85Sn0.30Se2 and Ag0.825Bi0.825Sn0.35Se2 are 0.63 eV, 0.47 eV, 0.42 eV and 0.38 eV, respectively. The band gap gradually decreases with the increasing Sn ratio. In addition, in contrast to the changes to the Seebeck coefficients, the electrical conductivity of Ag1−x/2Bi1−x/2SnxSe2 gradually increases with the increasing Sn ratio. It is clear that the carrier type change is related to the doping of Sn. The most likely reason for this phenomenon is that the participation of Sn modifies the intrinsic point defects of Ag1−x/2Bi1−x/2SnxSe2. However, it is very difficult to confirm this conjecture from theoretical calculations or experiment measurements due to the disordered atomic distribution of these materials. The electrical conductivity of Sn-doped AgBiSe2 falls in the range from 110 S/cm to 150 S/cm at 773 K, which is comparable with cubic (AgBiSe2)1−x(PbSe)x [32]. Due to the change of carrier type, an extreme power factor (PF) value is observed at about 373 K. The maximum PF value of the Ag1−x/2Bi1−x/2SnxSe2 materials with p-type transport properties is about 0.8 μW/cm·K2, while Ag0.875Bi0.875Sn0.25Se2 exhibits the maximum n-type PF value of ~1.2 μW/cm·K2 at 773 K.
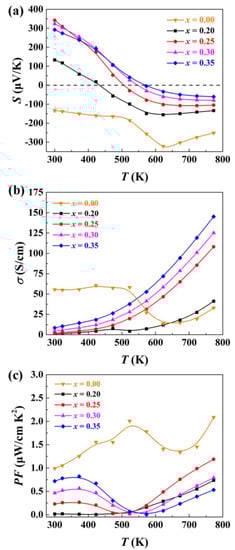
Figure 5.
(a) Seebeck coefficient, (b) electrical conductivity, and (c) power factor of Ag1−x/2Bi1−x/2SnxSe2 samples measured from room temperature to 773 K.
The measured total thermal conductivity of Ag1−x/2Bi1−x/2SnxSe2 samples is shown in Figure 6a. The room temperature thermal conductivity of Ag1−x/2Bi1−x/2SnxSe2 ranges from 0.5–0.6 W/m·K, lower than the measured thermal conductivity of pristine AgBiSe2 due to the enhanced point defect scattering. It should be noticed that the thermal conductivity of Sn-doped samples is inclined to contain less bipolar contribution due to the coexistence of holes and electrons. The thermal conductivity contributed from lattice vibration (κlatt) and bipolar effect (κbip) is calculated by subtracting the electronic thermal conductivity from total thermal conductivity. The electronic thermal conductivity (κele) is estimated by using the formula κele = LσT, where L, σ, and T are the Lorenz factor, electrical conductivity, and absolute temperature, respectively. The Lorenz factors are calculated using a single parabolic band (SPB) model [41]. Considering that Ag1−x/2Bi1−x/2SnxSe2 materials may exhibit multiple band behaviour, so the SPB model can only provide approximate estimates in this work. Figure 6b shows the calculated κlatt + κbip results in the range of 300 K to 773 K. Due to the enhanced point defects scattering, the lattice thermal conductivity of Sn-doped AgBiSe2 is lower than that of pristine AgBiSe2 in the range from 300 K to 523 K. The κlatt + κbip values of Ag0.9Bi0.9Sn0.2Se2, Ag0.875Bi0.875Sn0.25Se2, and Ag0.825Bi0.825Sn0.35Se2 are in the range of 0.45–0.6 W/m·K, while that of Ag0.85Bi0.85Sn0.3Se2 is much lower (only 0.37 W/m·K at 773 K). Such a low thermal conductivity is comparable with previous studies of cubic AgBiSe2 materials [32,33,34]. This ultra-low κlatt + κbip value can be explained by two reasons, namely the increased point defect scattering caused by doping Sn and the increased phonon–phonon scattering with increasing temperature. Figure 7 presents the calculated ZT values of the Ag1−x/2Bi1−x/2SnxSe2 samples. The final ZT values are very low compared with state-of-the-art thermoelectric materials, ranging from 0.06 to 0.14 at 773 K. However, due to the high structural symmetry and low thermal conductivity of these materials, Ag1−x/2Bi1−x/2SnxSe2 can still be viewed as a potential thermoelectric material candidate.
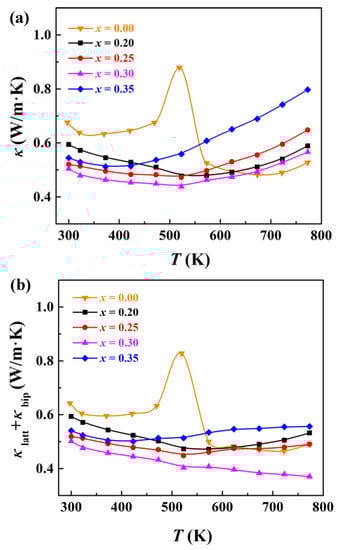
Figure 6.
(a) Thermal conductivity of Ag1−x/2Bi1−x/2SnxSe2 samples measured from room temperature to 773 K, and (b) sum of lattice thermal conductivity and bipolar thermal conductivity.
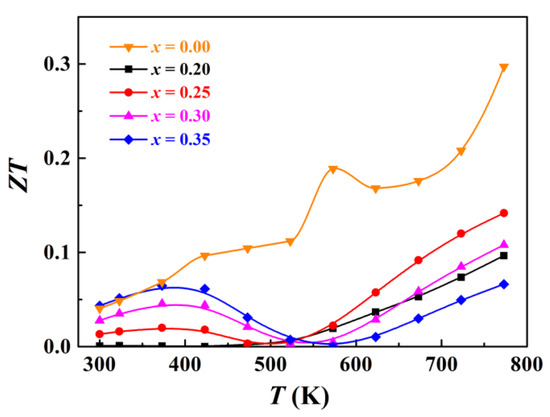
Figure 7.
Temperature dependent ZT values for Ag1−x/2Bi1−x/2SnxSe2.
4. Conclusions
In summary, the polymorph changes and thermoelectric properties of Sn-doped AgBiSe2 were investigated. The room-temperature crystal structure of Ag1−x/2Bi1−x/2SnxSe2 was transformed from a hexagonal structure to a disordered cubic structure when the value of x was larger than 0.20. In addition, the carrier type of Ag1−x/2Bi1−x/2SnxSe2 at room temperature was p-type, in contrast to the the n-type conductivity of pristine AgBiSe2. The electrical conductivity exponentially increased with increasing temperature. The thermal conductivity of Ag1−x/2Bi1−x/2SnxSe2 was ultra-low (in the range of 0.4 to 0.8 W/m·K) over the entire measured temperature range. Due to its high structural symmetry and low thermal conductivity, Ag1−x/2Bi1−x/2SnxSe2 is a potentially lead-free thermoelectric material candidate. However, further in-depth investigation into enhancing the power factor of this material will be necessary.
Supplementary Materials
The following are available online at https://www.mdpi.com/article/10.3390/cryst11091016/s1. Figure S1: SEM image and related EDS mapping; Figure S2: rietveld analysis; Figure S3: ln ρ versus 1/T.
Author Contributions
Conceptualization, X.-C.L.; formal analysis, X.-C.L.; writing—original draft preparation, X.-C.L.; writing—review and editing, X.-C.L. and M.-Y.P. All authors have read and agreed to the published version of the manuscript.
Funding
This research was funded by National Natural Science Foundation of China (grant no. 21601021) and Start-Up Foundation of Shandong Jiaotong University (grant no. BS2018027).
Conflicts of Interest
The authors declare no conflict of interest.
References
- Shi, X.; Chen, L. Thermoelectric materials step up. Nat. Mater. 2016, 15, 691–692. [Google Scholar] [CrossRef]
- Sootsman, J.R.; Chung, D.Y.; Kanatzidis, M.G. New and old concepts in thermoelectric materials. Angew. Chem. Int. Ed. 2009, 48, 8616–8639. [Google Scholar] [CrossRef]
- Zhao, X.; Zhao, L.D. Thermoelectric materials: Energy conversion between heat and electricity. J. Mater. 2015, 1, 92–105. [Google Scholar]
- Liu, K.-F.; Xia, S.-Q. Recent progresses on thermoelectric Zintl phases: Structures, materials and optimization. J. Solid State Chem. 2019, 270, 252–264. [Google Scholar] [CrossRef]
- Brown, S.R.; Kauzlarich, S.M.; Gascoin, F.; Snyder, G.J. Yb14MnSb11: New High Efficiency Thermoelectric Material for Power Generation. Chem. Mater. 2006, 18, 1873–1877. [Google Scholar] [CrossRef]
- Liu, H.; Shi, X.; Xu, F.; Zhang, L.; Zhang, W.; Chen, L.; Li, Q.; Uher, C.; Day, T.; Snyder, G.J. Copper ion liquid-like thermoelectrics. Nat. Mater. 2012, 11, 422–425. [Google Scholar] [CrossRef]
- Bai, H.; Su, X.; Yang, D.; Zhang, Q.; Tan, G.; Uher, C.; Tang, X.; Wu, J. An instant change of elastic lattice strain during Cu2Se phase transition: Origin of abnormal thermoelectric properties. Adv. Funct. Mater. 2021, 31, 2100431. [Google Scholar] [CrossRef]
- Prado-Gonjal, J.; López, C.A.; Pinacca, R.M.; Serrano-Sánchez, F.; Nemes, N.M.; Dura, O.J.; Martínez, J.L.; Fernández-Díaz, M.T.; Alonso, J.A. Correlation between Crystal Structure and Thermoelectric Properties of Sr1−xTi0.9Nb0.1O3−δ Ceramics. Crystals 2020, 10, 100. [Google Scholar] [CrossRef] [Green Version]
- Chen, Y.-X.; Shi, K.-D.; Li, F.; Xu, X.; Ge, Z.-H.; He, J. Highly enhanced thermoelectric performance in BiCuSeO ceramics realized by Pb doping and introducing Cu deficiencies. J. Am. Ceram. Soc. 2019, 102, 5989–5996. [Google Scholar] [CrossRef]
- Valencia-Gálvez, P.; Delgado, D.; López, M.L.; Álvarez-Serrano, I.; Moris, S.; Galdámez, A. AgSn[Bi1−xSbx]Se3: Synthesis, Structural Characterization, and Electrical Behavior. Crystals 2021, 11, 864. [Google Scholar] [CrossRef]
- Hoang, K.; Mahanti, S.D. Atomic and electronic structures of I-V-VI2 ternary chalcogenides. J. Sci. Adv. Mater. Dev. 2016, 1, 51–56. [Google Scholar] [CrossRef] [Green Version]
- Morelli, D.T.; Jovovic, V.; Heremans, J.P. Intrinsically Minimal Thermal Conductivity in Cubic I−V−VI2 Semiconductors. Phys. Rev. Lett. 2008, 101, 035901. [Google Scholar] [CrossRef]
- Skoug, E.J.; Morelli, D.T. Role of Lone-Pair Electrons in Producing Minimum Thermal Conductivity in Nitrogen-Group Chalcogenide Compounds. Phys. Rev. Lett. 2011, 107, 235901. [Google Scholar] [CrossRef] [Green Version]
- Du, B.; Zhang, R.; Chen, K.; Mahajan, A.; Reece, M.J. The impact of lone-pair electrons on the lattice thermal conductivity of the thermoelectric compound CuSbS2. J. Mater. Chem. A 2017, 5, 3249–3259. [Google Scholar] [CrossRef] [Green Version]
- Wang, H.; Li, J.-F.; Zou, M.; Sui, T. Synthesis and transport property of AgSbTe2 as a promising thermoelectric compound. Appl. Phys. Lett. 2008, 93, 202106. [Google Scholar] [CrossRef]
- Liu, X.-C.; Wang, Y.-M.; Qi, M.-L.; Pan, M.-Y. Enhanced thermoelectric properties in Ag-rich AgSbSe2. J. Solid State Chem. 2020, 288, 121454. [Google Scholar] [CrossRef]
- Hong, M.; Chen, Z.-G.; Yang, L.; Liao, Z.-M.; Zou, Y.-C.; Chen, Y.-H.; Matsumura, S.; Zou, J. Achieving zT > 2 in p-Type AgSbTe2−xSex Alloys via Exploring the Extra Light Valence Band and Introducing Dense Stacking Faults. Adv. Energy Mater. 2018, 8, 1702333. [Google Scholar] [CrossRef]
- Guin, S.N.; Chatterjee, A.; Negi, D.S.; Datta, R.; Biswas, K. High thermoelectric performance in tellurium free p-type AgSbSe2. Energy Environ. Sci. 2013, 6, 2603–2608. [Google Scholar] [CrossRef]
- Zhou, J.; Bian, G.; Zhu, Q.; Zhang, Y.; Li, C.; Dai, J. Solvothermal crystal growth of CuSbQ2 (Q = S, Se) and the correlation between macroscopic morphology and microscopic structure. J. Solid State Chem. 2009, 182, 259–264. [Google Scholar] [CrossRef]
- Kyono, A.; Kimata, M. Crystal structures of chalcostibite (CuSbS2) and emplectite (CuBiS2): Structural relationship of stereochemical activity between chalcostibite and emplectite. Am. Mineral. 2005, 90, 162–165. [Google Scholar] [CrossRef]
- Geller, S.; Wernick, J.H. Ternary semiconducting compounds with sodium chloride-like structure: AgSbSe2, AgSbTe2, AgBiS2, AgBiSe2. Acta Crystallogr. 1959, 12, 46–54. [Google Scholar] [CrossRef]
- Pinsker, Z.G.; Imamov, R.M. Electron diffraction study of the compound AgBiTe2. Sov. Phys. Crystallogr. 1964, 9, 277–280. [Google Scholar]
- Glatz, A.C.; Pinella, A. X-ray and neutron diffraction studies of the high-temperature beta-phase of the AgBiSe2/AgBiS2 system. J. Mater. Sci. 1968, 3, 498–501. [Google Scholar] [CrossRef]
- Pringle, G.J.; Thorpe, R.I. Bohdanowiczite, junoite and laitakarite from the Kidd Creek mine, Timmins, Ontario. Can. Mineral. 1980, 18, 353–360. [Google Scholar]
- Bayliss, P. Crystal chemistry and crystallography of some minerals in the tetradymite group. Am. Mineral. 1991, 76, 257–265. [Google Scholar]
- Liu, X.; Jin, D.; Liang, X. Enhanced thermoelectric performance of n-type transformable AgBiSe2 polymorphs by indium doping. Appl. Phys. Lett. 2016, 109, 133901. [Google Scholar] [CrossRef]
- Pan, L.; Bérardan, D.; Dragoe, N. High Thermoelectric Properties of n-Type AgBiSe2. J. Am. Chem. Soc. 2013, 135, 4914–4917. [Google Scholar] [CrossRef]
- Wu, H.-J.; Wei, P.-C.; Cheng, H.-Y.; Deng, J.-R.; Chen, Y.-Y. Ultralow thermal conductivity in n-type Ge-doped AgBiSe2 thermoelectric materials. Acta Mater. 2017, 141, 217–229. [Google Scholar] [CrossRef]
- Guin, S.N.; Srihari, V.; Biswas, K. Promising thermoelectric performance in n-type AgBiSe2: Effect of aliovalent anion doping. J. Mater. Chem. A 2015, 3, 648–655. [Google Scholar] [CrossRef]
- Parker, D.S.; May, A.F.; Singh, D.J. Benefits of Carrier-Pocket Anisotropy to Thermoelectric Performance: The Case of p-Type AgBiSe2. Phys. Rev. Appl. 2015, 3, 064003. [Google Scholar] [CrossRef] [Green Version]
- Li, S.; Feng, Z.; Tang, Z.; Zhang, F.; Cao, F.; Liu, X.; Singh, D.J.; Mao, J.; Ren, Z.; Zhang, Q. Defect Engineering for Realizing p-Type AgBiSe2 with a Promising Thermoelectric Performance. Chem. Mater. 2020, 32, 3528–3536. [Google Scholar] [CrossRef]
- Zhu, H.; Zhao, T.; Zhang, B.; An, Z.; Mao, S.; Wang, G.; Han, X.; Lu, X.; Zhang, J.; Zhou, X. Entropy Engineered Cubic n-Type AgBiSe2 Alloy with High Thermoelectric Performance in Fully Extended Operating Temperature Range. Adv. Energy Mater. 2021, 11, 2003304. [Google Scholar] [CrossRef]
- Sudo, K.; Goto, Y.; Sogabe, R.; Hoshi, K.; Miura, A.; Moriyoshi, C.; Kuroiwa, Y.; Mizuguchi, Y. Doping-Induced Polymorph and Carrier Polarity Changes in Thermoelectric Ag(Bi,Sb)Se2 Solid Solution. Inorg. Chem. 2019, 58, 7628–7633. [Google Scholar] [CrossRef]
- Bernges, T.; Peilstöcker, J.; Dutta, M.; Ohno, S.; Culver, S.P.; Biswas, K.; Zeier, W.G. Local Structure and Influence of Sb Substitution on the Structure–Transport Properties in AgBiSe2. Inorg. Chem. 2019, 58, 9236–9245. [Google Scholar] [CrossRef] [PubMed]
- Li, J.; Pan, Y.; Wu, C.; Sun, F.; Wei, T. Processing of advanced thermoelectric materials. Sci. China Technol. Sci. 2017, 60, 1347–1364. [Google Scholar] [CrossRef]
- Atsushi, O.; Ikuhiko, U. The Crystal Structure of Stannous Selenide SnSe. J. Phys. Soc. Jpn. 1956, 11, 470. [Google Scholar]
- Rodríguez-Carvajal, J. Recent Advances in Magnetic Structure Determination by Neutron Powder Diffraction. Phys. B 1993, 192, 55–69. [Google Scholar] [CrossRef]
- Shannon, R.D. Revised Effective Ionic Radii and Systematic Studies of Interatomie Distances in Halides and Chaleogenides. Acta Cryst. 1976, A32, 751. [Google Scholar] [CrossRef]
- Mariano, A.N.; Chopra, K.L. Polymorphism in some IV-VI compounds induced by high pressure and thin epitaxial growth. Appl. Phys. Lett. 1967, 10, 282–284. [Google Scholar] [CrossRef]
- Voroshilov, Y.V.; Cholovej, M.I.; Potorii, M.V. The X-ray analysis of the combinations AgAsSe2 and Ag3AsSe3. Kristallografiya 1976, 21, 585–586. [Google Scholar]
- May, A.F.; Singh, D.J.; Snyder, G.J. Influence of band structure on the large thermoelectric performance of lanthanum telluride. Phys. Rev. B 2009, 79, 153101. [Google Scholar] [CrossRef]
Publisher’s Note: MDPI stays neutral with regard to jurisdictional claims in published maps and institutional affiliations. |
© 2021 by the authors. Licensee MDPI, Basel, Switzerland. This article is an open access article distributed under the terms and conditions of the Creative Commons Attribution (CC BY) license (https://creativecommons.org/licenses/by/4.0/).