
Photoluminescent Properties of Hydroxyapatite and Hydroxyapatite/Multi-Walled Carbon Nanotube Composites

 ,
,  , , and
Abstract
:
1. Introduction
2. Experimental Methods
2.1. Hydroxyapatite Synthesis
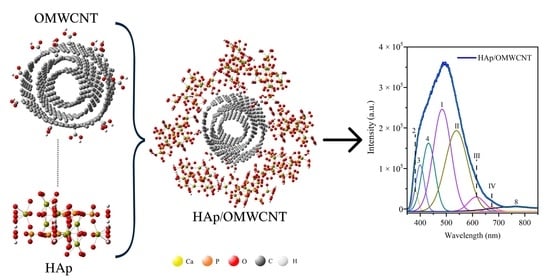
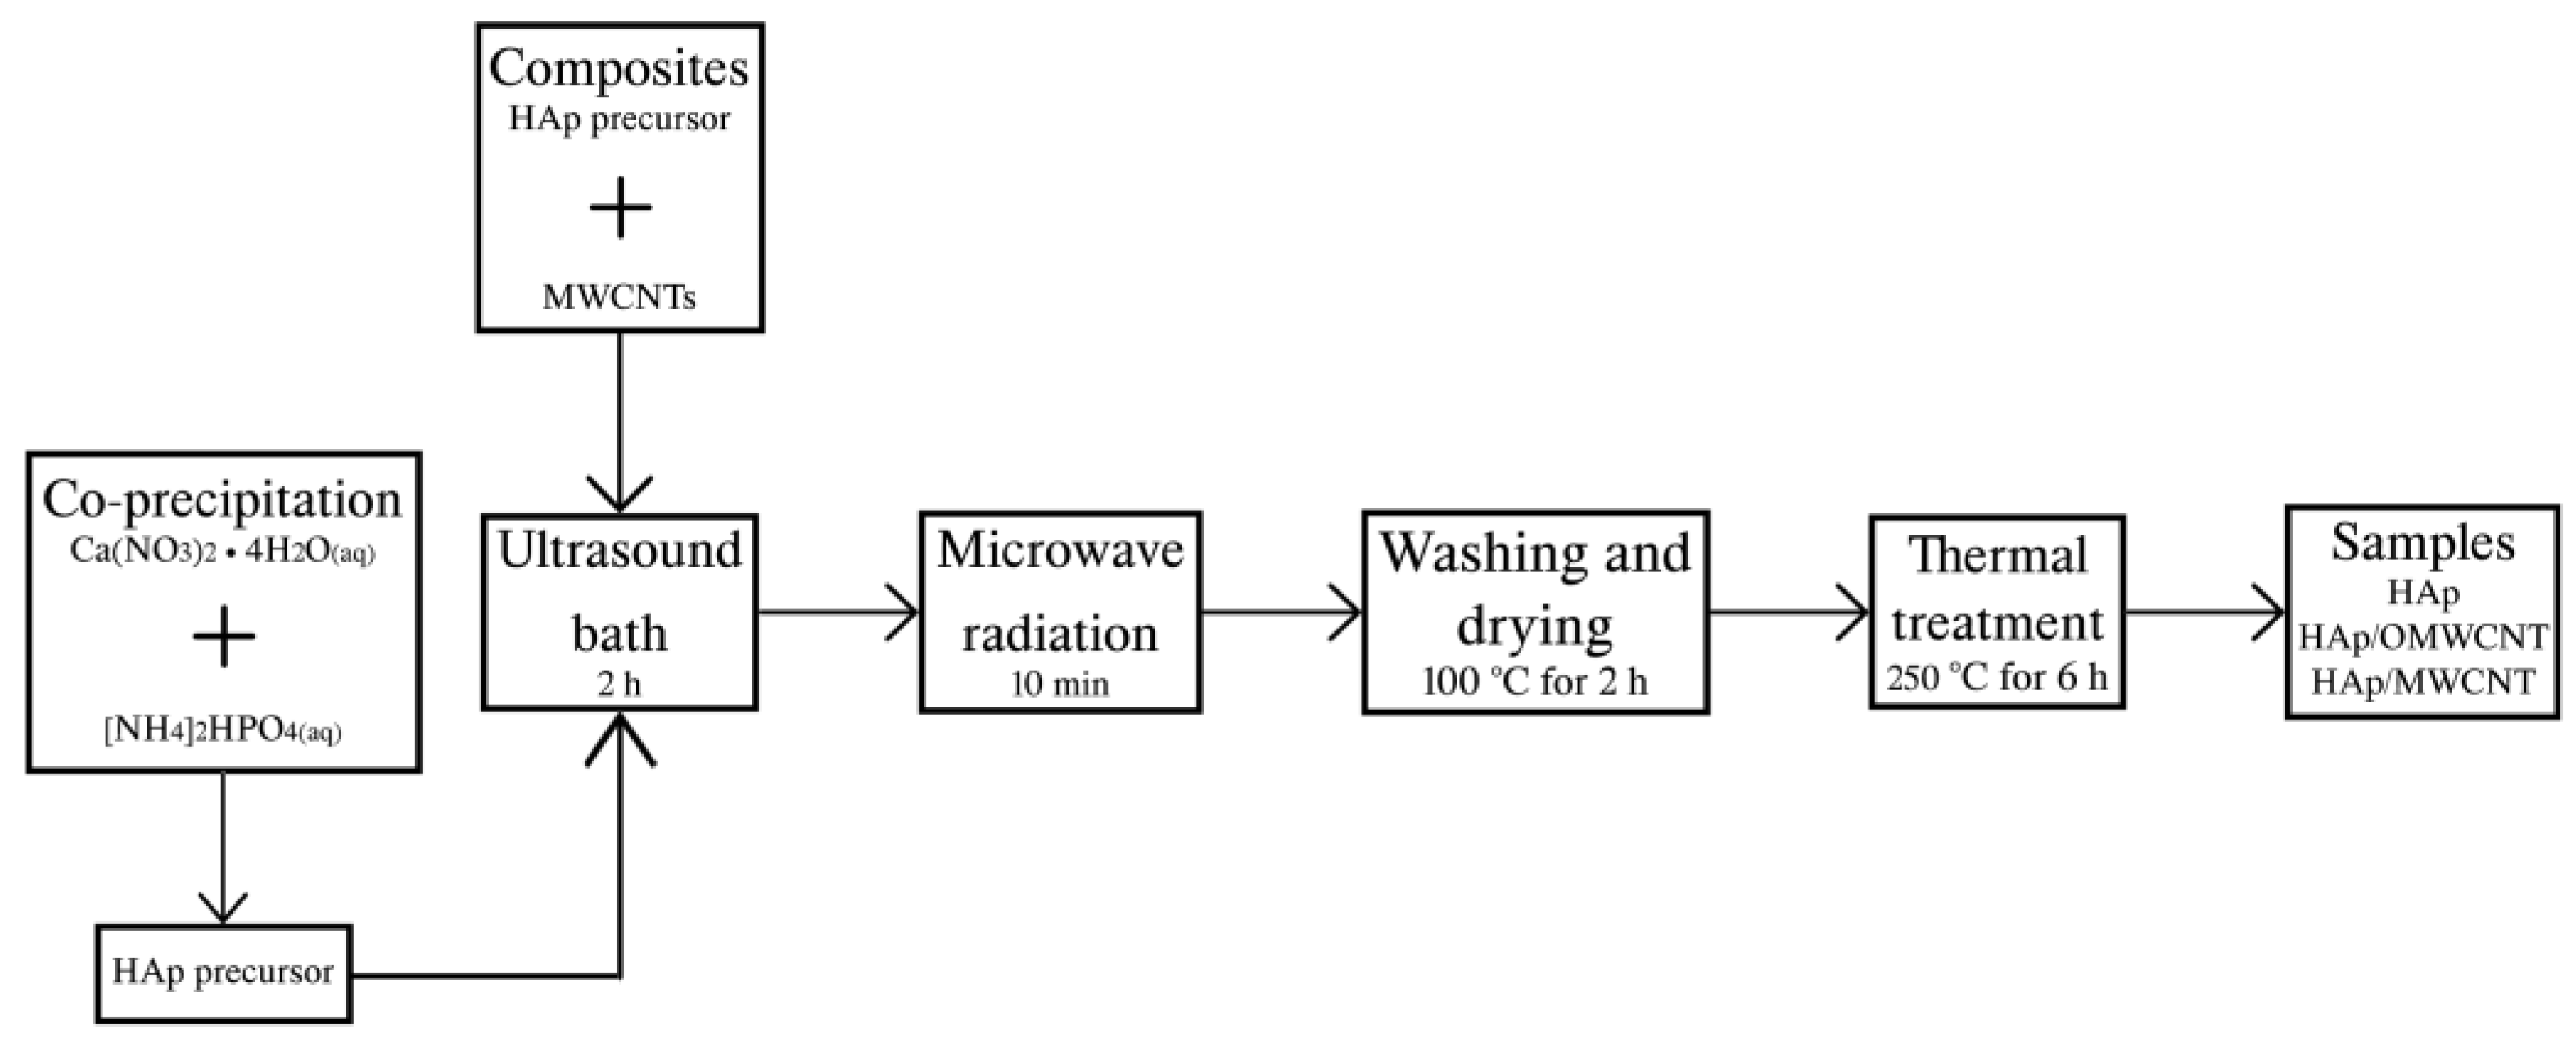
2.2. Composite Preparation
2.3. Characterization
3. Results and Discussion
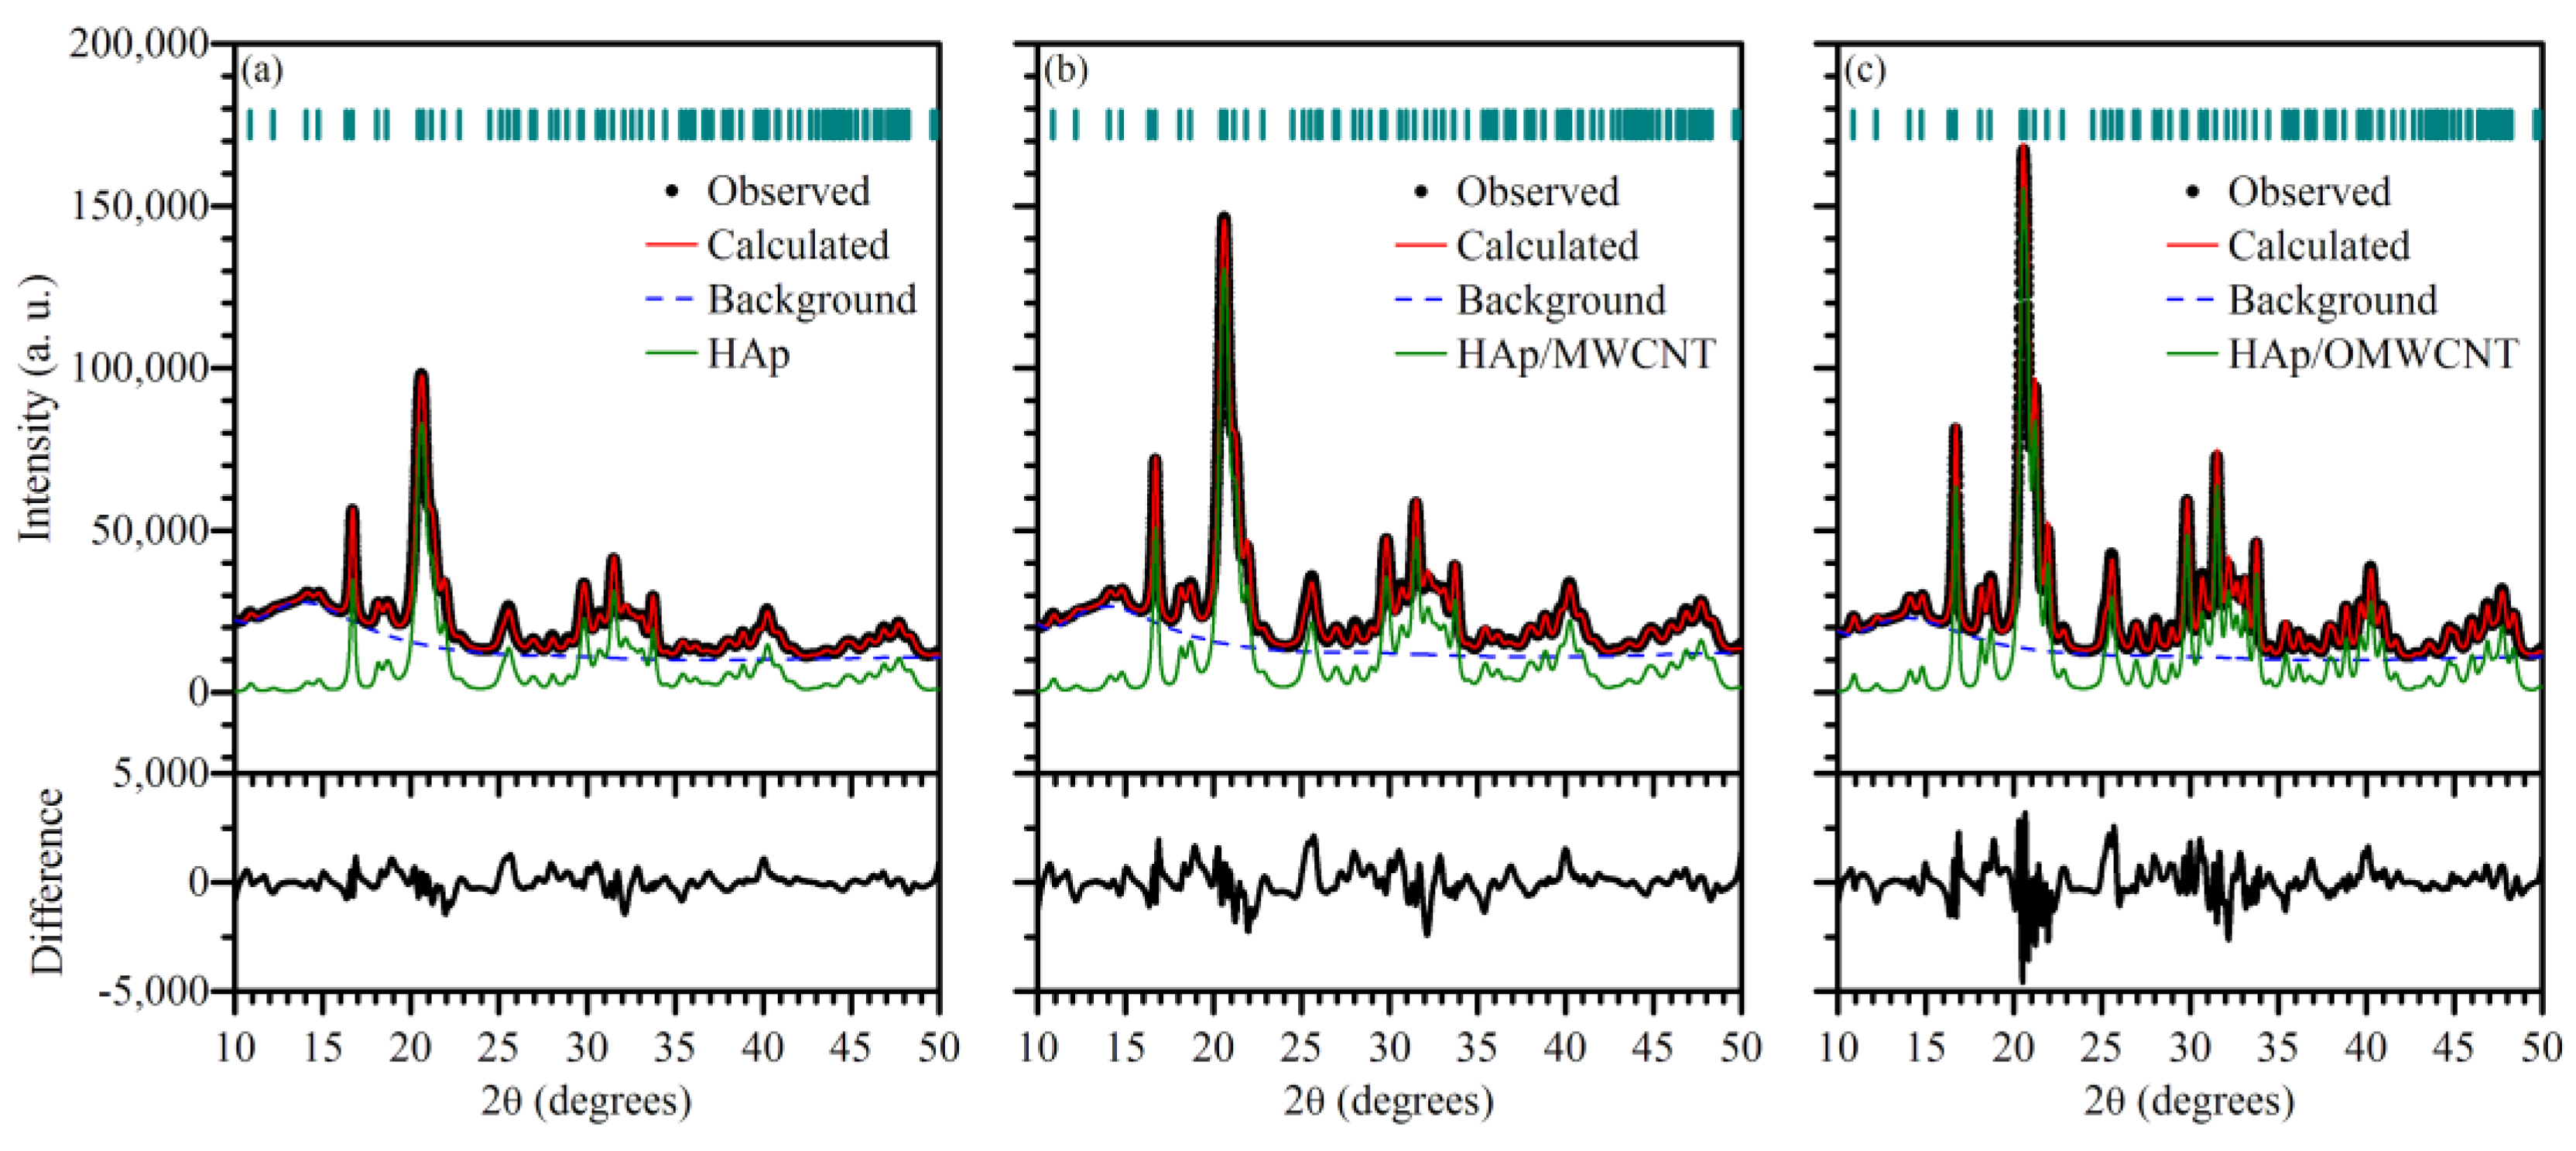
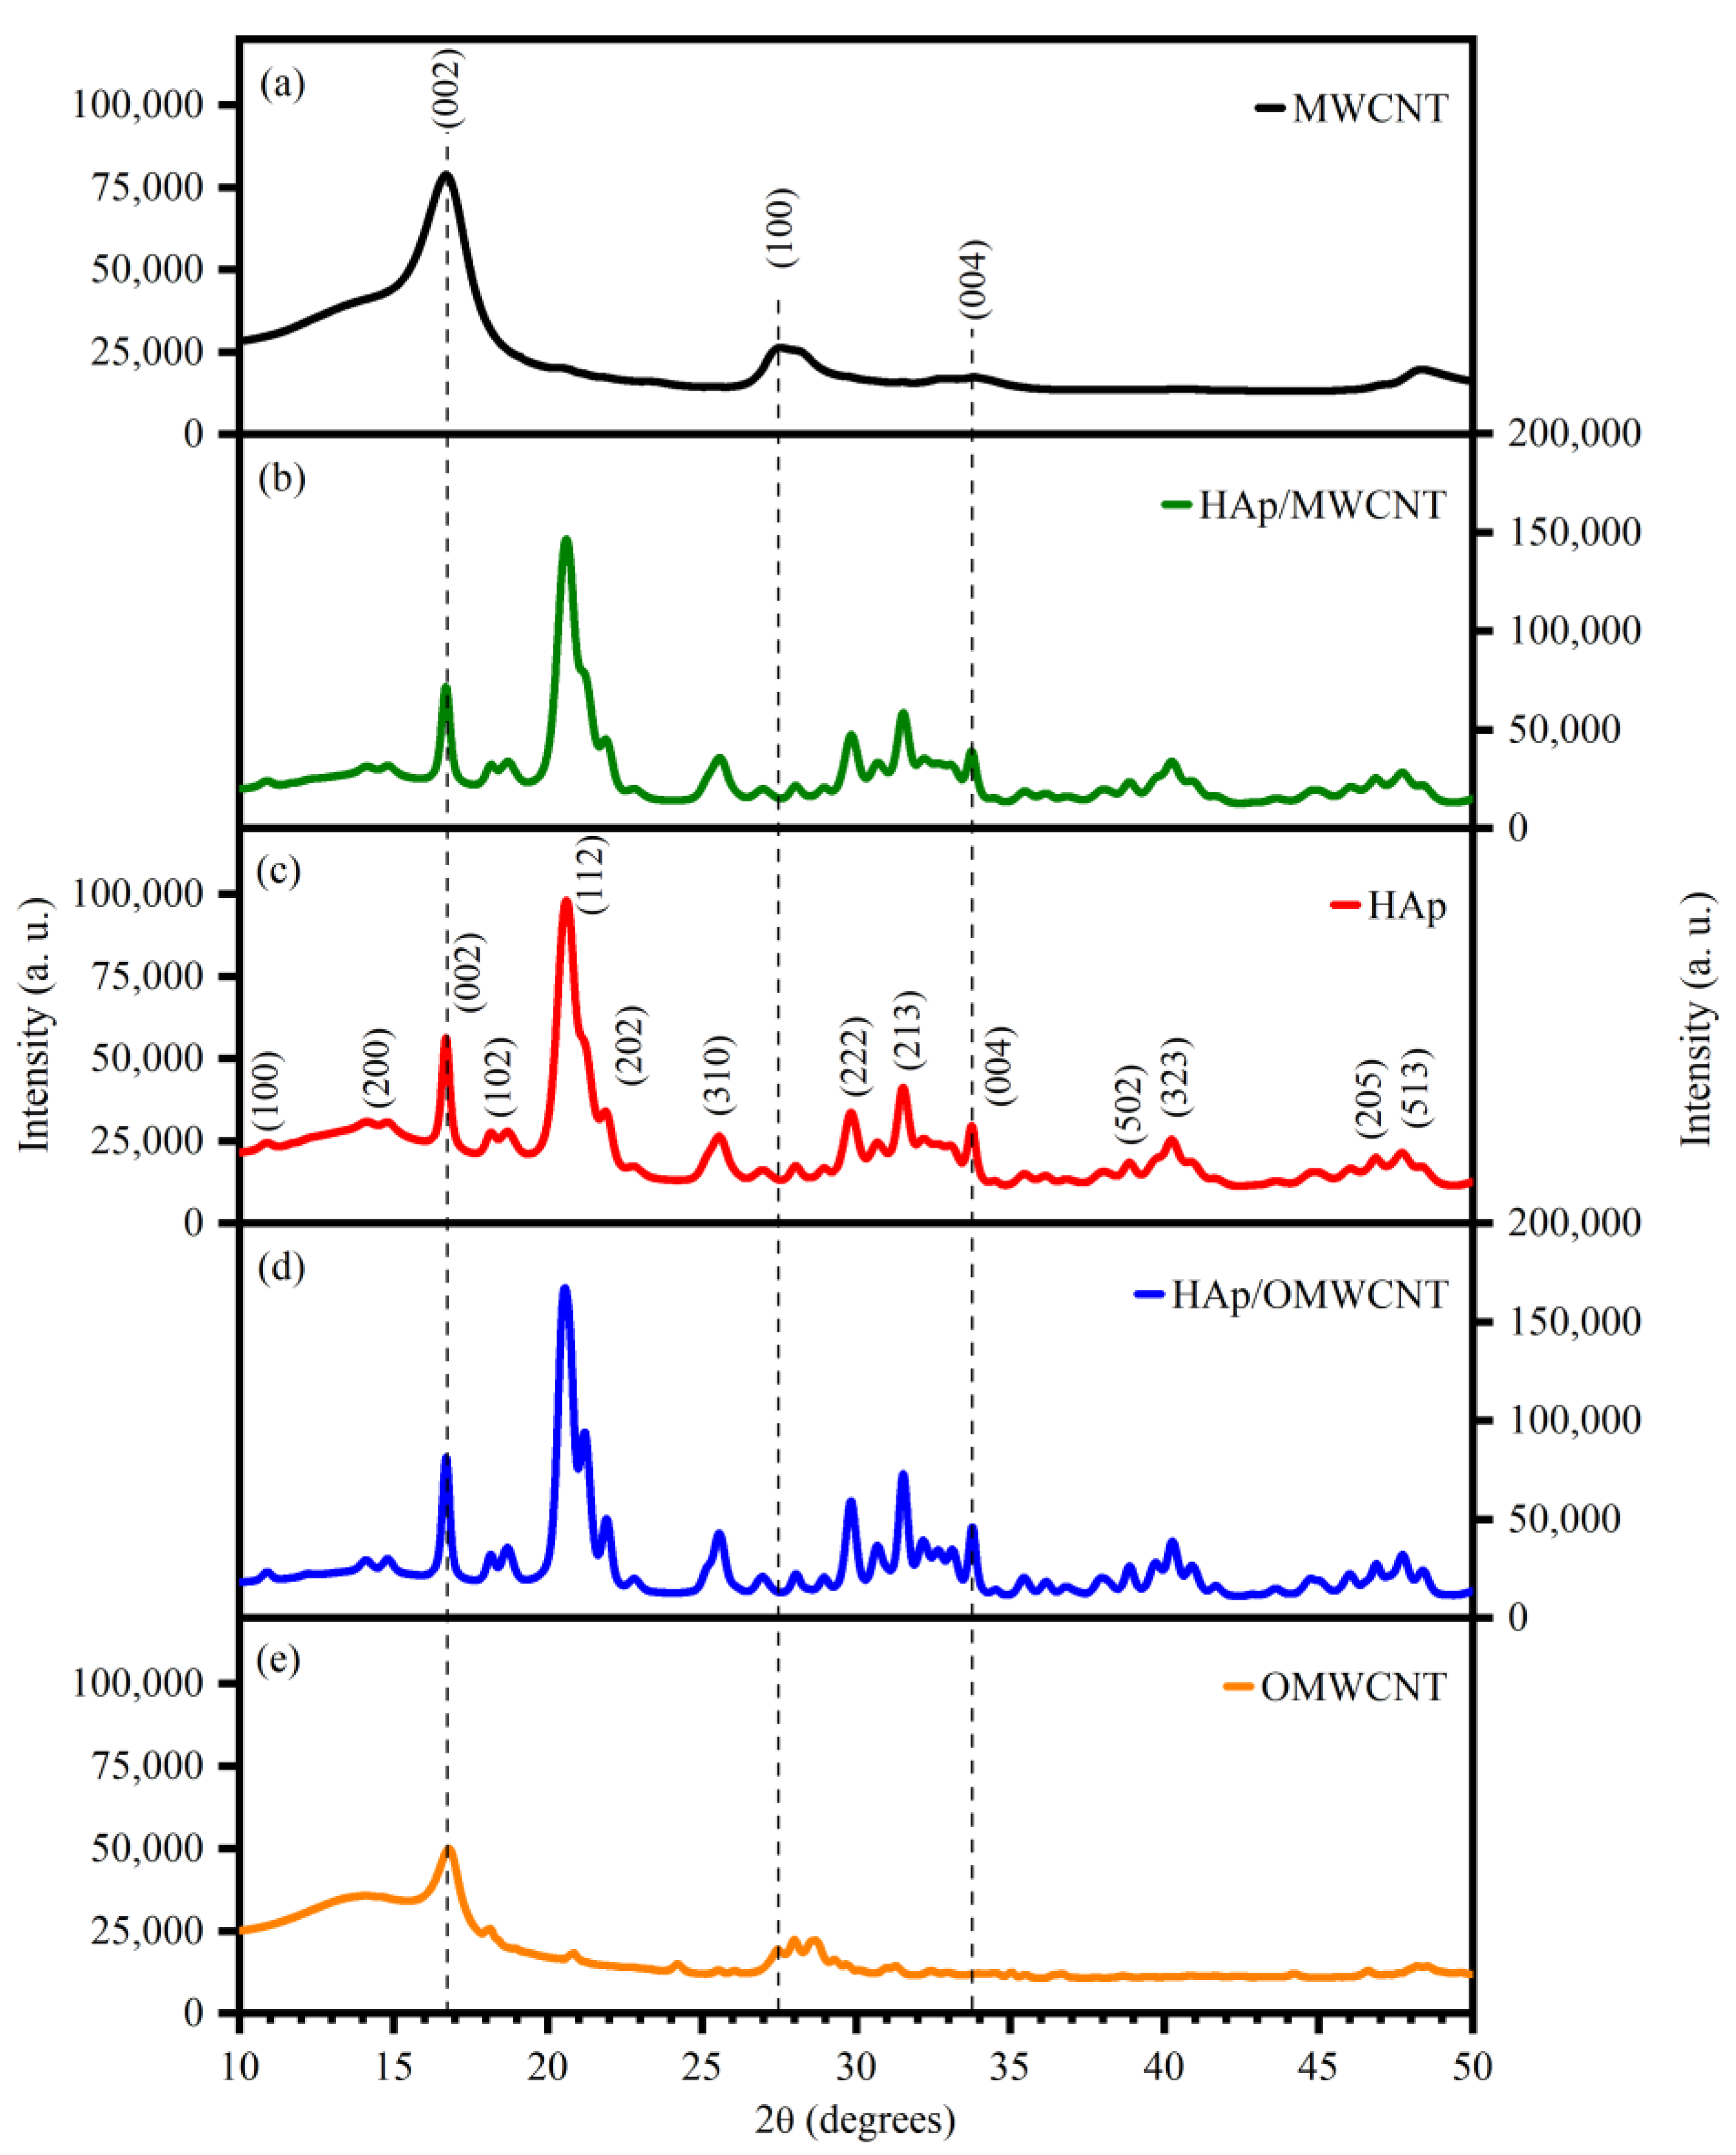
3.1. X-ray Diffraction
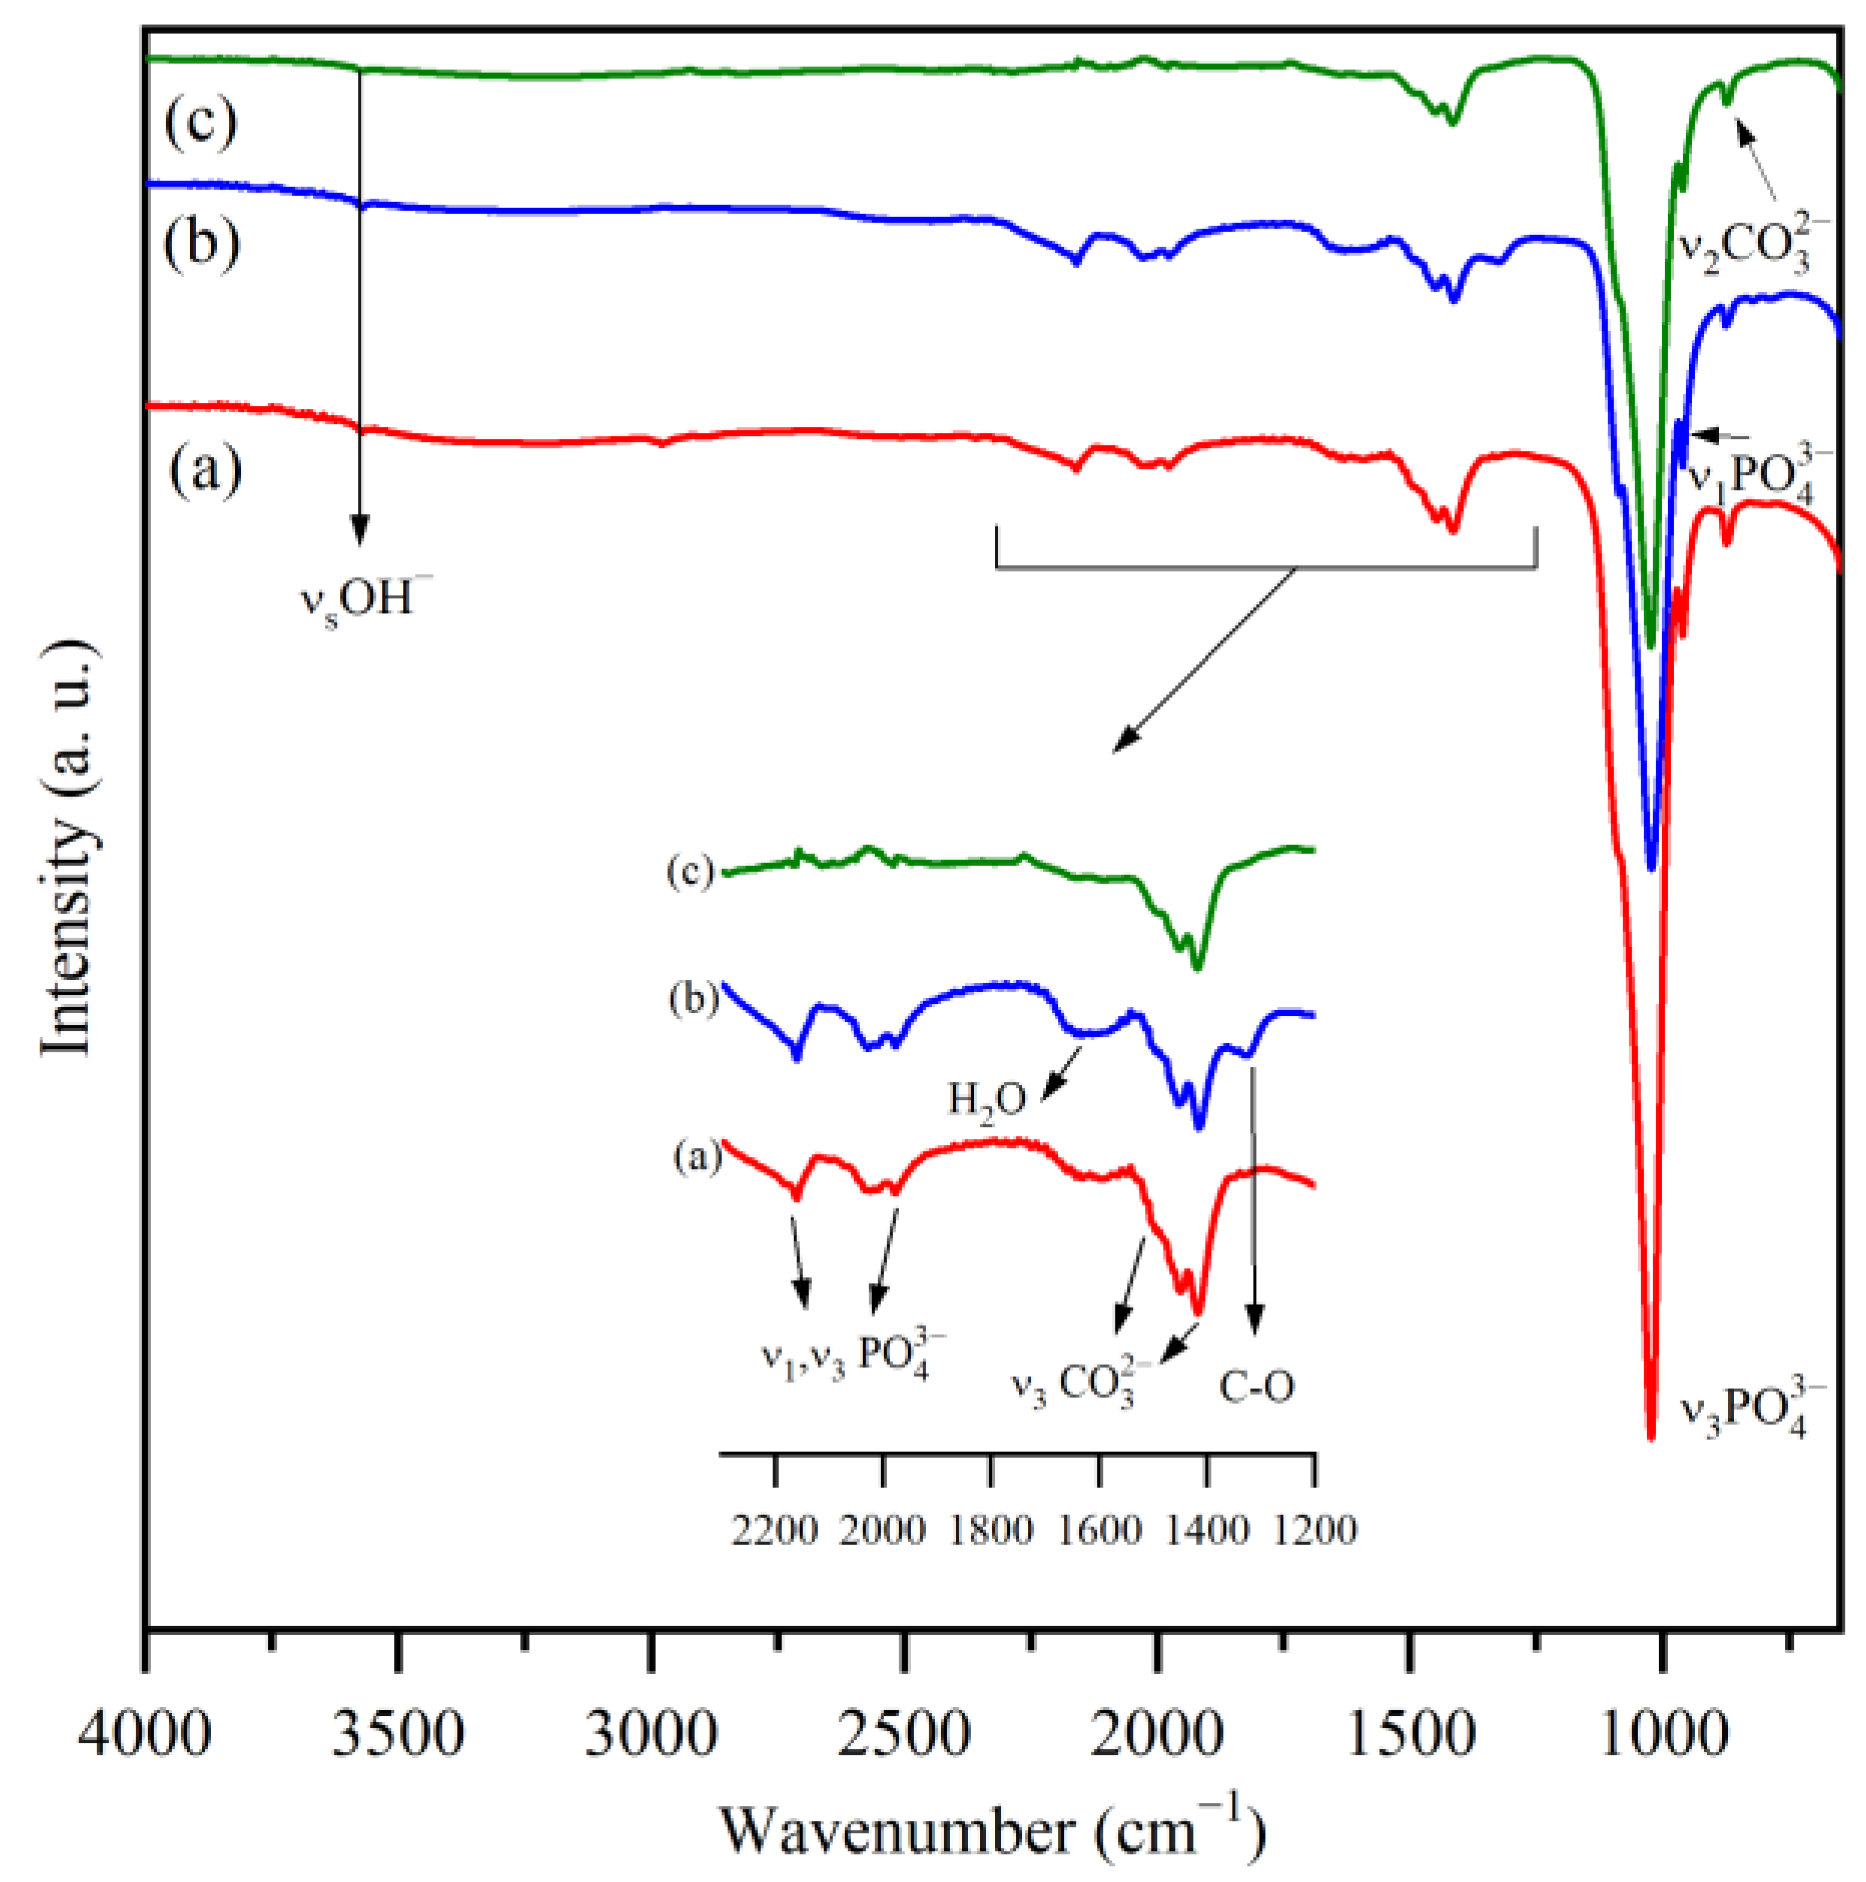
3.2. FTIR Spectroscopy
3.3. Morphological Analysis
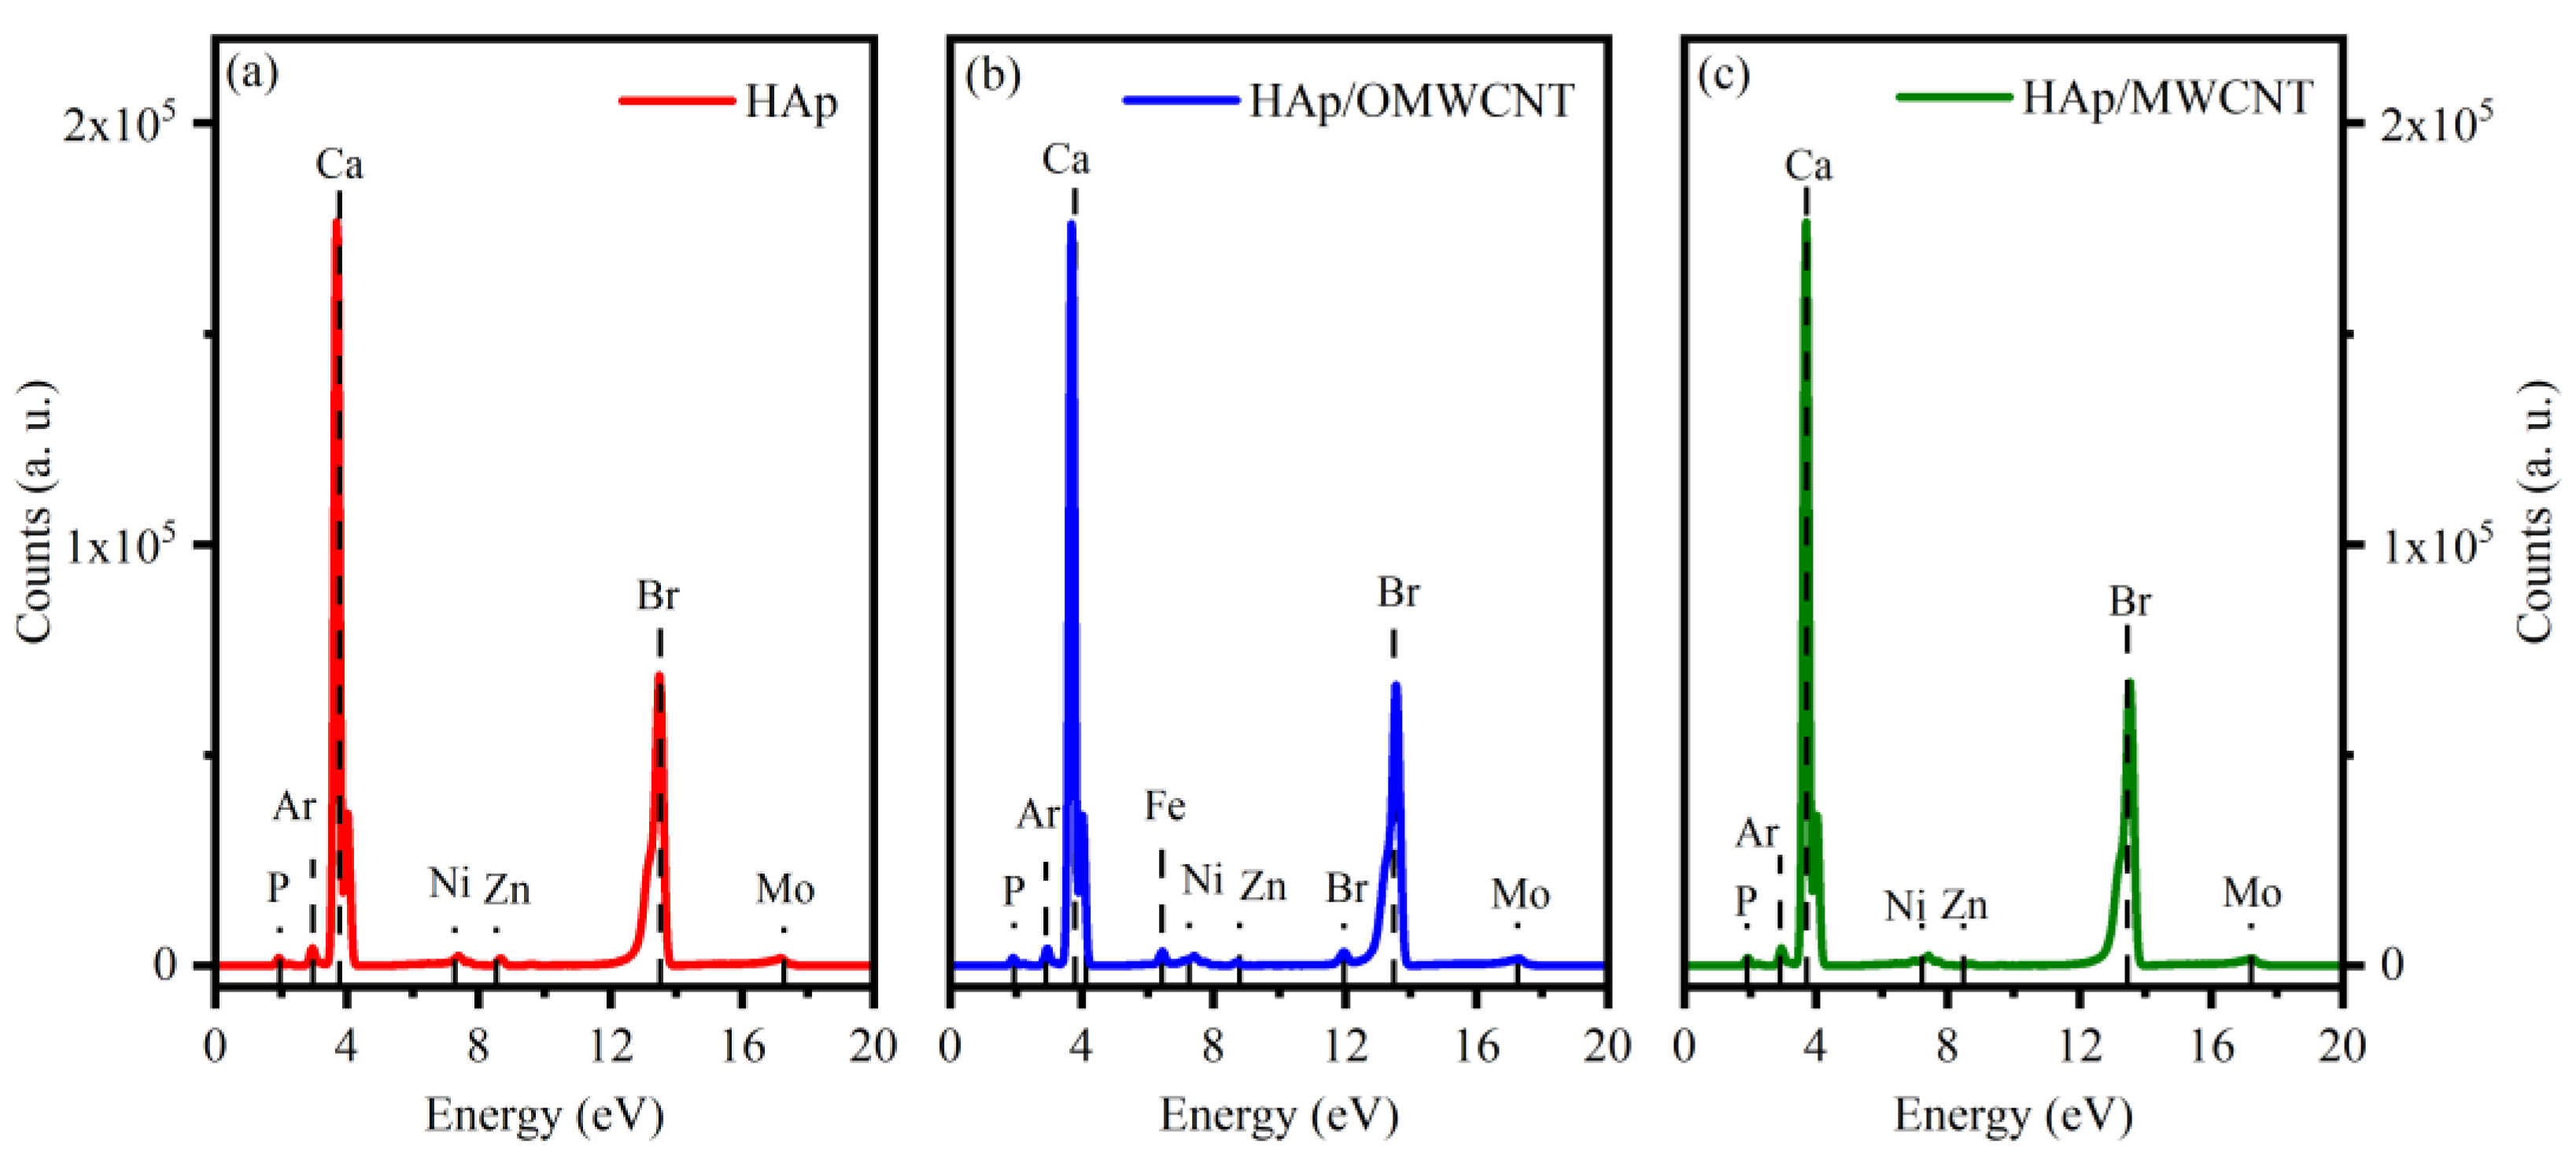
3.4. Compositional Analysis
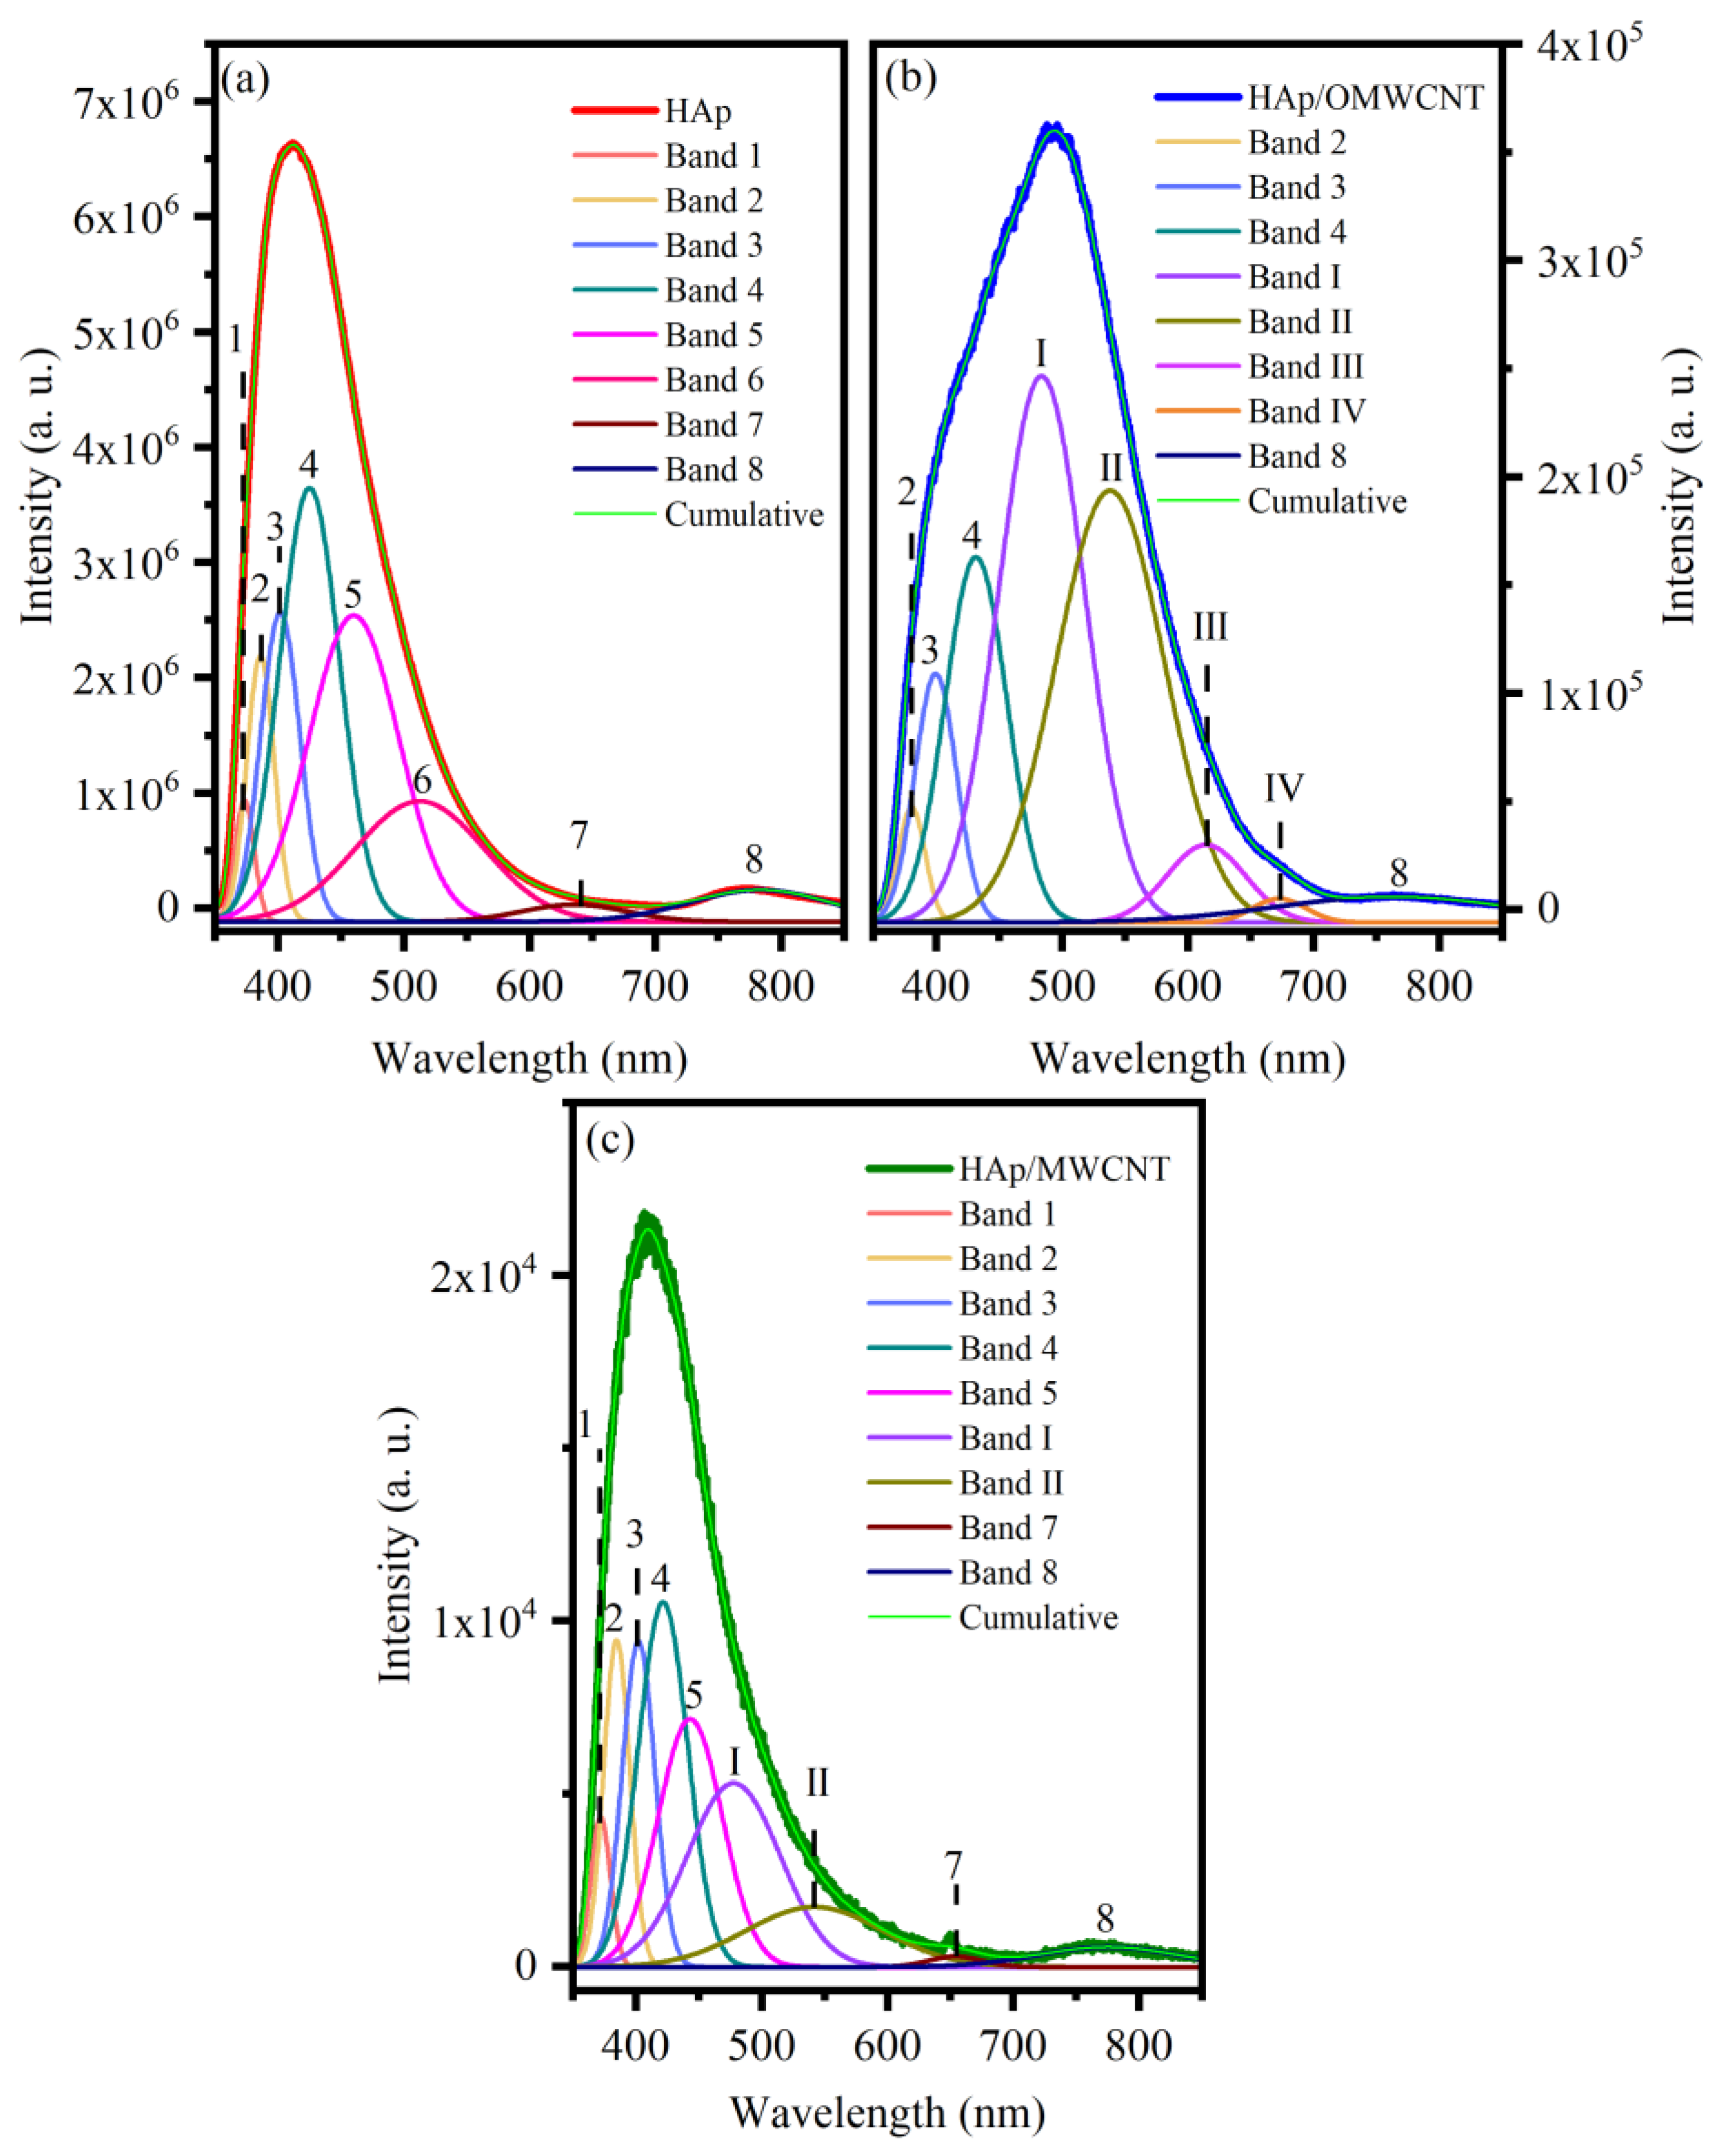
3.5. Photoluminescence Spectroscopy
4. Conclusions
Author Contributions
Funding
Institutional Review Board Statement
Informed Consent Statement
Data Availability Statement
Acknowledgments
Conflicts of Interest
References
- Eliaz, N.; Metoki, N. Calcium Phosphate Bioceramics: A Review of Their History, Structure, Properties, Coating Technologies and Biomedical Applications. Materials 2017, 10, 334. [Google Scholar] [CrossRef] [PubMed] [Green Version]
- Hench, L.L. Bioceramics: From Concept to Clinic. J. Am. Ceram. Soc. 1991, 74, 1487–1510. [Google Scholar] [CrossRef]
- Mcconnell, D. Inorganic constituents in the shell of the living grachiopod Lingula. Geol. Soc. Am. Bull. 1963, 74, 363–364. [Google Scholar] [CrossRef]
- Kramer, J.R. Sea Water: Saturation with Apatites and Carbonates. Science 1964, 146, 637–638. [Google Scholar] [CrossRef]
- Fihri, A.; Len, C.; Varma, R.S.; Solhy, A. Hydroxyapatite: A review of syntheses, structure and applications in heterogeneous catalysis. Coord. Chem. Rev. 2017, 347, 48–76. [Google Scholar] [CrossRef]
- Oulguidoum, A.; Bouiahya, K.; Bouyarmane, H.; Talbaoui, A.; Nunzi, J.-M.; Laghzizil, A. Mesoporous nanocrystalline sulfonated hydroxyapatites enhance heavy metal removal and antimicrobial activity. Sep. Purif. Technol. 2020, 255. [Google Scholar] [CrossRef]
- Zhao, H.Y.; Zhou, H.M.; Zhang, J.X.; Zheng, W.; Zheng, Y.F. Carbon nanotube–hydroxyapatite nanocomposite: A novel platform for glucose/O2 biofuel cell. Biosens. Bioelectron. 2009, 25, 463–468. [Google Scholar] [CrossRef]
- Yang, P.; Yang, P.; Teng, X.; Lin, J.; Huang, L. A novel luminescent mesoporous silica/apatite composite for controlled drug release. J. Mater. Chem. 2011, 21, 5505–5510. [Google Scholar] [CrossRef]
- Rončević, I.Š.; Buzuk, M.; Buljac, M.; Vladislavić, N. The Preparation, Morphological Characterization and Possible Electroanalytical Application of a Hydroxyapatite-Modified Glassy Carbon Electrode. Crystals 2021, 11, 1–14. [Google Scholar]
- Wen, Y.; Li, J.; Lin, H.; Huang, H.; Song, K.; Duan, K.; Guo, T.; Weng, J. Improvement of Drug-Loading Properties of Hydroxyapatite Particles Using Triethylamine as a Capping Agent: A Novel Approach. Crystals 2021, 11, 703. [Google Scholar] [CrossRef]
- Chen, M.; Yoshioka, T.; Ikoma, T. Photoluminescence and doping mechanism of theranostic Eu3+/Fe3+ dual-doped hydroxyapatite nanoparticles. Sci. Technol. Adv. Mater. 2014, 15, 9. [Google Scholar] [CrossRef] [PubMed]
- Mahabole, M.; Bahir, M.; Khairnar, R. Mn blended hydroxyapatite nanoceramic: Bioactivity, Dielectric and Luminescence studies. J. Biomim. Biomater. Tissue Eng. 2013, 18, 43–59. [Google Scholar] [CrossRef]
- Neacsu, I.A.; Stoica, A.E.; Vasile, B.S.; Andronescu, E. Luminescent Hydroxyapatite Doped with Rare Earth Elements for Biomedical Applications. Nanomaterials 2019, 9, 239. [Google Scholar] [CrossRef] [PubMed] [Green Version]
- Paterlini, V.; Bettinelli, M.; Rizzi, R.; El Khouri, A.; Rossi, M.; Della Ventura, G.; Capitelli, F. Characterization and Luminescence of Eu3+- and Gd3+-Doped Hydroxyapatite Ca10(PO4)6(OH)2. Crystals 2020, 10, 806. [Google Scholar] [CrossRef]
- Goloshchapov, D.L.; Savchenko, D.V.; Kashkarov, V.M.; Khmelevskiy, N.O.; Aksenenko, A.Y.; Seredin, P.V. Study of the dependence of the structural defects and bulk inhomogeneities of nanocrystalline hydroxyapatite on the conditions of production using a biological source of calcium. J. Phys. Conf. Ser. 2019, 1400. [Google Scholar] [CrossRef]
- Smith, A.M.; Duan, H.; Mohs, A.M.; Nie, S. Bioconjugated quantum dots for in vivo molecular and cellular imaging. Adv. Drug Deliv. Rev. 2008, 60, 1226–1240. [Google Scholar] [CrossRef] [Green Version]
- Mao, L.-C.; Zhang, X.-Y.; Wei, Y. Recent Advances and Progress for the Fabrication and Surface Modification of AIE-active Organic-inorganic Luminescent Composites. Chin. J. Polym. Sci. 2019, 37, 340–351. [Google Scholar] [CrossRef]
- Avouris, P.; Chen, J. Nanotube electronics and optoelectronics. Mater. Today 2006, 9, 46–54. [Google Scholar] [CrossRef]
- Wang, W.; Zhu, Y.; Watari, F.; Liao, S.; Yokoyama, A.; Omori, M.; Ai, H.; Cui, F. Carbon nanotubes/hydroxyapatite nanocomposites fabricated by spark plasma sintering for bonegraft applications. Appl. Surf. Sci. 2012, 262, 194–199. [Google Scholar] [CrossRef]
- Constanda, S.; Stan, M.S.; Ciobanu, C.S.; Motelica-Heino, M.; Guégan, R.; Lafdi, K.; Dinischiotu, A.; Predoi, D. Carbon Nanotubes-Hydroxyapatite Nanocomposites for an Improved Osteoblast Cell Response. J. Nanomater. 2016, 2016, 1–10. [Google Scholar] [CrossRef] [Green Version]
- Iijima, S. Helical microtubules of graphitic carbon. Nature 1991, 354, 56–58. [Google Scholar] [CrossRef]
- Dresselhaus, M.S.; Avouris, P. Introduction to Carbon Materials Research. In Carbon Nanotubes; Springer: Berlin/Heidelberg, Germany, 2007; Volume 9, pp. 1–9. [Google Scholar]
- Riggs, J.E.; Guo, Z.; Carroll, D.L.; Sun, Y.-P. Strong Luminescence of Solubilized Carbon Nanotubes. J. Am. Chem. Soc. 2000, 122, 5879–5880. [Google Scholar] [CrossRef]
- O’Connell, M.J.; Bachilo, S.M.; Huffman, C.B.; Moore, V.C.; Strano, M.S.; Haroz, E.H.; Rialon, K.L.; Boul, P.J.; Noon, W.H.; Kittrell, C.; et al. Band Gap Fluorescence from Individual Single-Walled Carbon Nanotubes. Science 2002, 297, 593–596. [Google Scholar] [CrossRef] [PubMed] [Green Version]
- Velmurugan, S.; Palanisamy, S.; Yang, T.C.-K.; Gochoo, M.; Chen, S.W. Ultrasonic assisted functionalization of MWCNT and synergistic electrocatalytic effect of nano-hydroxyapatite incorporated MWCNT-chitosan scaffolds for sensing of nitrofurantoin. Ultrason. Sonochem. 2020, 62, 104863. [Google Scholar] [CrossRef] [PubMed]
- Kumar, M.; Kumar, R.; Kumar, S. Synergistic effect of carbon nanotubes and nano-hydroxyapatite on mechanical properties of polyetheretherketone based hybrid nanocomposites. Polym. Polym. Compos. 2020, 1–12. [Google Scholar] [CrossRef]
- Arul Xavier Stango, S.; Vijayalakshmi, U. Synthesis and characterization of hydroxyapatite/carboxylic acid functionalized MWCNTS composites and its triple layer coatings for biomedical applications. Ceram. Int. 2019, 45, 69–81. [Google Scholar] [CrossRef]
- Ma, B.; Zhang, S.; Liu, R.; Qiu, J.; Zhao, L.; Wang, S.; Li, J.; Sang, Y.; Jiang, H.; Liu, H. Prolonged fluorescence lifetime of carbon quantum dots by combining with hydroxyapatite nanorods for bio-applications. Nanoscale 2017, 9, 2162–2171. [Google Scholar] [CrossRef]
- Lahiri, D.; Ghosh, S.; Agarwal, A. Carbon nanotube reinforced hydroxyapatite composite for orthopedic application: A review. Mater. Sci. Eng. C 2012, 32, 1727–1758. [Google Scholar] [CrossRef]
- Barabás, R.; de Souza Ávila, E.; Ladeira, L.O.; Antônio, L.M.; Tötös, R.; Simedru, D.; Bizo, L.; Cadar, O. Graphene Oxides/Carbon Nanotubes–Hydroxyapatite Nanocomposites for Biomedical Applications. Arab. J. Sci. Eng. 2020, 45, 219–227. [Google Scholar] [CrossRef]
- Nguyen, T.T.; Pham, N.T.; Dinh, T.T.M.; Vu, T.T.; Nguyen, H.S.; Tran, L.D. Electrodeposition of Hydroxyapatite-Multiwalled Carbon Nanotube Nanocomposite on Ti6Al4V. Adv. Polym. Technol. 2020, 2020, 1–10. [Google Scholar] [CrossRef] [Green Version]
- Castle, A.B.; Gracia-Espino, E.; Nieto-Delgado, C.; Terrones, H.; Terrones, M.; Hussain, S. Hydroxyl-Functionalized and N-Doped Multiwalled Carbon Nanotubes Decorated with Silver Nanoparticles Preserve Cellular Function. ACS Nano 2011, 5, 2458–2466. [Google Scholar] [CrossRef]
- Gates-Rector, S.; Blanton, T. The Powder Diffraction File: A quality materials characterization database. Powder Diffr. 2019, 34, 352–360. [Google Scholar] [CrossRef] [Green Version]
- Bergmann, J.; Friedel, P.; Kleeberg, R. Extended Software/Methods Development Issue. IUCr Newsl. 1998, 20, 5–8. [Google Scholar]
- Doebelin, N.; Kleeberg, R. Profex: A graphical user interface for the Rietveld refinement program BGMN. J. Appl. Crystallogr. 2015, 48, 1573–1580. [Google Scholar] [CrossRef] [PubMed] [Green Version]
- Ali, N.H.M.; Subuki, I.; Hussain Ismail, M. Synthesized Hydroxyapatite Powder from Clamshell via Chemical Precipitation Method. Adv. Mater. Res. 2014, 911, 72–76. [Google Scholar] [CrossRef]
- Aquilano, D.; Bruno, M.; Rubbo, M.; Massaro, F.R.; Pastero, L. Low Symmetry Polymorph of Hydroxyapatite. Theoretical Equilibrium Morphology of the Monoclinic Ca5(OH)(PO4)3. Cryst. Growth Des. 2014, 14, 2846–2852. [Google Scholar] [CrossRef] [Green Version]
- Gopi, D.; Shinyjoy, E.; Sekar, M.; Surendiran, M.; Kavitha, L.; Sampath Kumar, T.S. Development of carbon nanotubes reinforced hydroxyapatite composite coatings on titanium by electrodeposition method. Corros. Sci. 2013, 73, 321–330. [Google Scholar] [CrossRef]
- Markovic, M.; Fowler, B.O.; Tung, M.S. Preparation and comprehensive characterization of a calcium hydroxyapatite reference material. J. Res. Natl. Inst. Stand. Technol. 2004, 109, 553–568. [Google Scholar] [CrossRef] [PubMed]
- Berzina-Cimdina, L.; Borodajenko, N. Research of calcium phosphates using Fourier Transform Infrarred Spectroscopy. In Infrared Spectroscopy—Materials Science, Engineering and Technology; Theophile, T., Ed.; InTech: London, UK, 2012; pp. 127–134. ISBN 9789535105374. [Google Scholar]
- Machado, T.R.; Sczancoski, J.C.; Beltrán-Mir, H.; Nogueira, I.C.; Li, M.S.; Andrés, J.; Cordoncillo, E.; Longo, E. A novel approach to obtain highly intense self-activated photoluminescence emissions in hydroxyapatite nanoparticles. J. Solid State Chem. 2016, 249, 64–69. [Google Scholar] [CrossRef]
- McConnell, D. Crystal chemistry of hydroxyapatite its relation to bone mineral. Arch. Oral Biol. 1965, 10, 421–431. [Google Scholar] [CrossRef]
- LeGeros, R.Z.; LeGeros, J.P. Dense Hydroxyapatite. In An Introduction to Bioceramics; World Scientific: Singapore, 1993; pp. 139–180. [Google Scholar]
- Zhang, C.; Yang, J.; Quan, Z.; Yang, P.; Li, C.; Hou, Z.; Lin, J. Hydroxyapatite Nano- and Microcrystals with Multiform Morphologies: Controllable Synthesis and Luminescence Properties. Cryst. Growth Des. 2009, 9, 2725–2733. [Google Scholar] [CrossRef]
- Bystrov, V.S.; Piccirillo, C.; Tobaldi, D.M.; Castro, P.M.L.; Coutinho, J.; Kopyl, S.; Pullar, R.C. Oxygen vacancies, the optical band gap (Eg) and photocatalysis of hydroxyapatite: Comparing modelling with measured data. Appl. Catal. B Environ. 2016, 196, 100–107. [Google Scholar] [CrossRef]
- Machado, T.R.; Sczancoski, J.C.; Beltrán-Mir, H.; Li, M.S.; Andrés, J.; Cordoncillo, E.; Leite, E.; Longo, E. Structural properties and self-activated photoluminescence emissions in hydroxyapatite with distinct particle shapes. Ceram. Int. 2017, 44, 236–245. [Google Scholar] [CrossRef]
- Huerta, V.J.; Fernández, P.; Gómez, V.; Graeve, O.A.; Herrera, M. Defect-related luminescence properties of hydroxyapatite nanobelts. Appl. Mater. Today 2020, 21, 100822. [Google Scholar] [CrossRef]
- Rosenman, G.; Aronov, D.; Oster, L.; Haddad, J.; Mezinskis, G.; Pavlovska, I.; Chaikina, M.; Karlov, A. Photoluminescence and surface photovoltage spectroscopy studies of hydroxyapatite nano-Bio-ceramics. J. Lumin. 2007, 122–123, 936–938. [Google Scholar] [CrossRef]
- Koyama, T.; Miyata, Y.; Asaka, K.; Shinohara, H.; Saito, Y.; Nakamura, A. Ultrafast energy transfer of one-dimensional excitons between carbon nanotubes: A femtosecond time-resolved luminescence study. Phys. Chem. Chem. Phys. 2012, 14, 1070–1084. [Google Scholar] [CrossRef] [PubMed]
- Sun, W.; Huang, Z.; Zhang, L.; Zhu, J. Luminescence from multi-walled carbon nanotubes and the Eu(III)/multi-walled carbon nanotube composite. Carbon N. Y. 2003, 41, 1685–1687. [Google Scholar] [CrossRef]


| Sample | Cell Parameters | Unit Cell Volume (nm3) | Crystallite Sizes (nm) | R. M. S. Strain | Rwp | GoF (Rwp/Rexp) | ||
|---|---|---|---|---|---|---|---|---|
| a (nm) | c (nm) | 〈100〉 | 〈001〉 | |||||
| HAp | 0.94373(4) | 0.69093(3) | 0.61536(7) | 10.17(3) | 27.7(3) | 0.310(7) | 1.85 | 2.72 |
| HAp/MWCNT | 0.94331(4) | 0.69095(3) | 0.61483(7) | 10.68(4) | 25.1(3) | 0.362(7) | 2.36 | 3.81 |
| HAp/OMWCNT | 0.94367(2) | 0.69051(2) | 0.61491(5) | 15.74(5) | 30.9(3) | 0.186(6) | 2.56 | 4.00 |
| Band Position (cm−1) | Assignment | Ref. | ||
|---|---|---|---|---|
| HAp | HAp/OMWCNT | HAp/MWCNT | ||
| 3572 | 3572 | 3572 | O−H stretching mode | [39,40] |
| 1978–2187 | 1978–2184 | 1980–2188 | Overtones and combinations of v3 PO43− and v1 PO43− modes | [39,40] |
| 1631 | 1631 | 1590 | Adsorbed water | [39,40] |
| 875 | 875 | 875 | HPO4 mode and substitution types A and B | [39,41] |
| 1462–1512 | 1461–1512 | 1462–1495 | CO32− replacing OH− | [39,41] |
| 1448 | 1452 | 1451 | CO32− replacing PO43− | [39,41] |
| 1416 | 1415 | 1418 | CO32− replacing PO43− | [39,41] |
| - | 1326 | - | stretching mode of -COOH | [38] |
| 1092 | 1088 | 1092 | v3 PO43− mode | [39,40] |
| 1025 | 1024 | 1026 | v3 PO43− mode | [39,40] |
| 962 | 962 | 962 | v1 PO43− mode | [39,40] |
| 876 | 877 | 875 | CO32− mode | [39,41] |
| EDS (at. %) | Ca/P | ||||||||
|---|---|---|---|---|---|---|---|---|---|
| Element | |||||||||
| Sample | Ca | P | O | C | Al | Si | Fe | Br | |
| HAp | 20.83 | 13.24 | 65.93 | - | - | - | - | - | 1.57 |
| HAp/OMWCNT | 12.78 | 6.46 | 35.29 | 45.35 | 0.76 | Traces | Traces | Traces | 1.98 |
| HAp/MWCNT | 12.61 | 7.60 | 35.62 | 44.17 | - | - | - | - | 1.66 |
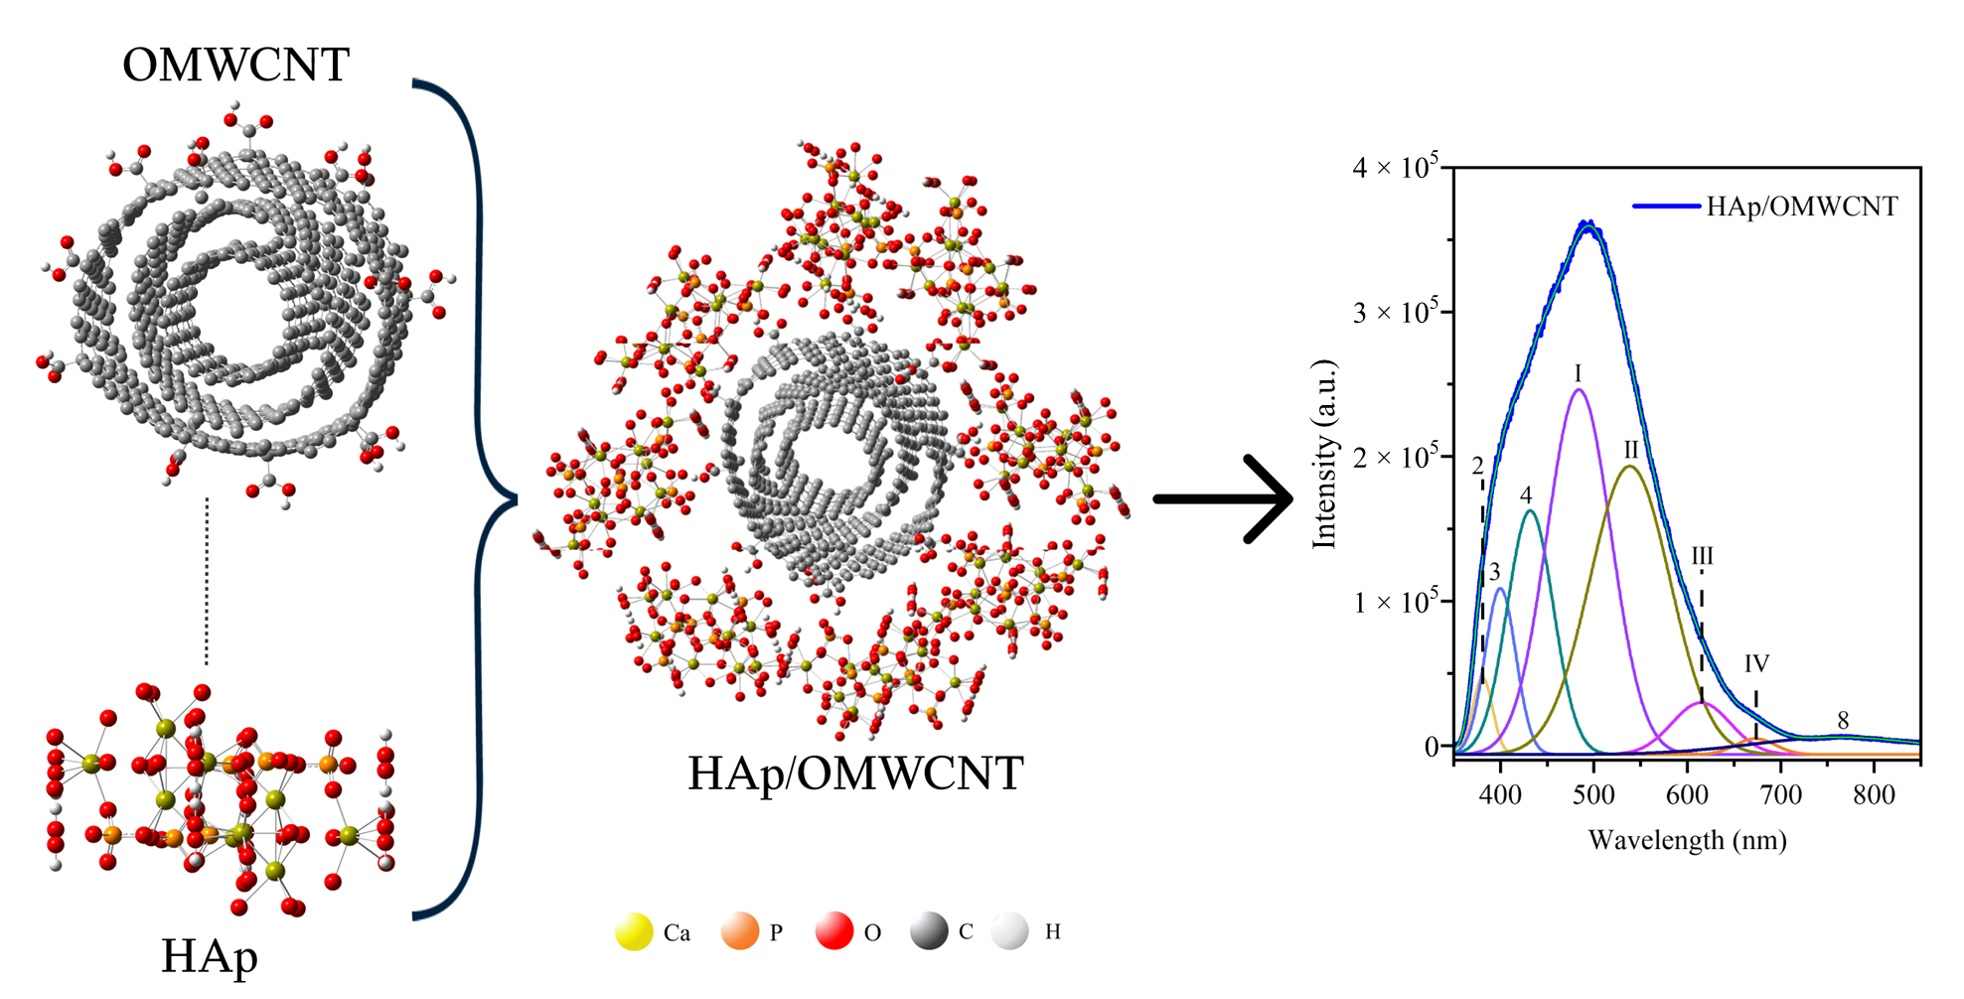
| Sample | Band | Wavelength (nm) | Energy (eV) | Associated With | Ref. |
|---|---|---|---|---|---|
| HAp | 1 | 373.41 | 3.32 | Oxygen vacancies from PO43− ion | [47] |
| 2 | 386.17 | 3.21 | Oxygen vacancies from PO43− ion, bulk, and surface defects | [45,46,48] | |
| 3 | 401.93 | 3.08 | OH− ion vacancies | [47] | |
| 4 | 425.29 | 2.91 | Oxygen vacancies from OH− ion | [47] | |
| 5 | 460.44 | 2.69 | OH− and H+ ion vacancies | [47] | |
| 6 | 512.93 | 2.41 | Ca2+ vacancies | [47] | |
| 7 | 635.81 | 1.95 | OH− ion vacancies | [45,47] | |
| 8 | 783.34 | 1.58 | Oxygen vacancies from PO43− ion and OH− ion vacancies | [45] | |
| HAp/OMWCNT | 2 | 381 | 3.25 | Oxygen vacancies from PO43− ion, bulk, and surface defects | [45,46,48] |
| 3 | 399 | 3.10 | OH− ion vacancies | [47] | |
| 4 | 431 | 2.88 | Oxygen vacancies from OH− ion | [47] | |
| I | 483 | 2.57 | Exciton from carbon nanotubes | [49] | |
| II | 538 | 2.30 | Exciton from carbon nanotubes | [49] | |
| III | 615 | 2.02 | Exciton from carbon nanotubes | [50] | |
| IV | 673 | 1.84 | Exciton from carbon nanotubes, or OH− ion vacancies | [45,47,49] | |
| 8 | 767 | 1.61 | Oxygen vacancies from PO43− ion and OH- ion vacancies | [45] | |
| HAp/MWCNT | 1 | 372.13 | 3.33 | Oxygen vacancies from PO43− ion | [47] |
| 2 | 384.84 | 3.22 | Oxygen vacancies from PO43− ion, bulk, and surface defects | [45,46,48] | |
| 3 | 402.24 | 3.08 | OH− ion vacancies | [47] | |
| 4 | 421.76 | 2.94 | Oxygen vacancies from OH− ion | [47] | |
| 5 | 443.38 | 2.79 | OH− and H+ ion vacancies | [47] | |
| I | 477.94 | 2.59 | Exciton from carbon nanotubes | [49] | |
| II | 542.15 | 2.28 | Exciton from carbon nanotubes | [49] | |
| 7 | 654.11 | 1.89 | OH− ion vacancies | [45,47] | |
| 8 | 775.37 | 1.59 | Oxygen vacancies from PO43− ion and OH- ion vacancies | [45] |
Publisher’s Note: MDPI stays neutral with regard to jurisdictional claims in published maps and institutional affiliations. |
© 2021 by the authors. Licensee MDPI, Basel, Switzerland. This article is an open access article distributed under the terms and conditions of the Creative Commons Attribution (CC BY) license (https://creativecommons.org/licenses/by/4.0/).
Share and Cite
Figueroa-Rosales, E.X.; Martínez-Juárez, J.; García-Díaz, E.; Hernández-Cruz, D.; Sabinas-Hernández, S.A.; Robles-Águila, M.J. Photoluminescent Properties of Hydroxyapatite and Hydroxyapatite/Multi-Walled Carbon Nanotube Composites. Crystals 2021, 11, 832. https://doi.org/10.3390/cryst11070832
Figueroa-Rosales EX, Martínez-Juárez J, García-Díaz E, Hernández-Cruz D, Sabinas-Hernández SA, Robles-Águila MJ. Photoluminescent Properties of Hydroxyapatite and Hydroxyapatite/Multi-Walled Carbon Nanotube Composites. Crystals. 2021; 11(7):832. https://doi.org/10.3390/cryst11070832
Chicago/Turabian StyleFigueroa-Rosales, Edna X., Javier Martínez-Juárez, Esmeralda García-Díaz, Daniel Hernández-Cruz, Sergio A. Sabinas-Hernández, and Maria J. Robles-Águila. 2021. "Photoluminescent Properties of Hydroxyapatite and Hydroxyapatite/Multi-Walled Carbon Nanotube Composites" Crystals 11, no. 7: 832. https://doi.org/10.3390/cryst11070832
APA StyleFigueroa-Rosales, E. X., Martínez-Juárez, J., García-Díaz, E., Hernández-Cruz, D., Sabinas-Hernández, S. A., & Robles-Águila, M. J. (2021). Photoluminescent Properties of Hydroxyapatite and Hydroxyapatite/Multi-Walled Carbon Nanotube Composites. Crystals, 11(7), 832. https://doi.org/10.3390/cryst11070832