Communication

Using DFT to Calculate the Parameters of the Crystal Field in Mn2+ Doped Hydroxyapatite Crystals

by
Daria Vladimirovna Shurtakova
1,*,
Peter Olegovich Grishin
2,
Marat Revgerovich Gafurov
1 and
Georgy Vladimirovich Mamin
1
1
Institute of Physics, Kazan Federal University, 18 Kremlevskaya Str., 420008 Kazan, Russia
2
Dentistry Faculty, Kazan State Medical University, 49 Butlerova Str., 420012 Kazan, Russia
*
Author to whom correspondence should be addressed.
Crystals 2021, 11(9), 1050; https://doi.org/10.3390/cryst11091050
Submission received: 31 July 2021 / Revised: 24 August 2021 / Accepted: 30 August 2021 / Published: 31 August 2021
(This article belongs to the Special Issue Hydroxyapatite Base Nanocomposites (Volume II))

Abstract

:
Crystal field parameters for two nonequivalent positions Ca (I) and Ca (II) for hydroxyapatite (HAp) crystals from the density functional theory (DFT) are calculated. Calculations are compared with the experimental electron paramagnetic resonance (EPR) spectra (registered at two microwave frequencies) for the synthesized Mn-HAp powders Ca9.995Mn0.005(PO4)6(OH)2. It is found that in the investigated species, the manganese is redistributed between both calcium sites with prevalence in Ca (I). Agreement between the calculated and experimental data proves that crystal field parameters in HAp can be calculated in the classical DFT model using the distributed electron density.

1. Introduction

Hydroxyapatite (HAp)-based (bio)materials are widely employed for tissue engineering applications, especially in orthopedics and dentistry [1]. The crystal structure of HAp (Ca10(PO4)6(OH)2) allows for a wide range of substitutions, which can affect various material properties ranging from mechanical to antimicrobial [2,3,4]. Among various ions with therapeutic effects, manganese (Mn) has recently attracted attention for inclusion in diverse bioceramics [5,6,7,8,9]. Manganese is one of the essential trace elements for human health and one of the metals found in natural (bio)apatites. The presence of manganese in the HAp structure, for example, is able to change the adherence of bone cells to an implant material, favors osteoblast activity and proliferation, and enhances antimicrobial properties [10]. Manganese can induce alterations in mineralogical structure, physical properties, reactivity, and solubility of HAp, and influence the magnetic properties of a substance [11]. Hence, it is important to understand the incorporation mechanism of Mn into HAp, as well as structural alterations with Mn contents [11,12].
Although the incorporation of Mn into the HAp crystal structure has been extensively investigated, the preferred Ca site for Mn substitution is still under debate. There are two structurally distinct Ca sites for manganese localization in the HAp structure [13,14]. The Ca (I) site is nine oxygen coordinated, while the Ca (II) site is surrounded by six oxygen atoms and one hydroxyl group. It was shown, for example, that the localization and redistribution of Mn2+ between the calcium positions in the inorganic component of the human aorta atherosclerotic plaques (composed mainly of the carbonated, nonstoichiometric hydroxyapatite) influence plaque stability and, therefore, can serve as a surgical indication [12,15].
Electron paramagnetic resonance (EPR) is known as one of the analytical, nondestructive methods for determining the type and concentration of paramagnetic impurities in liquids and solids including HAp [16]. To calculate the concentration, the integral signal intensity should be known [17]. To analyze the EPR spectra in more detail, the spin Hamiltonian is used, which, in general form, is the sum of the Zeeman interaction, zero-field splitting parameters (ZFSs), and hyperfine interaction. The fine interaction reflects the influence of the electric field created by other ions and electrons on the level splitting of a paramagnetic center with an electron spin S > 1/2. The corresponding spin Hamiltonian can be written in the form H ^ Z F S = k = 2.4.6 q = k k B k q O ^ k q , where B k q   are the parameters of the electric crystal field, and O ^ k q are the Stevens operators. Stevens operators are known, while the parameters of the crystal field depend on the environment of the impurity ion. It is possible to calculate these parameters for various positions of the impurity center, simulate the EPR spectra of these centers, and compare the calculations with the experimental data. Thus, it gives an ability to draw conclusions about what position is most likely for the impurity center. However, the EPR spectrum of powder is an average EPR spectrum of a large number of microcrystals differently oriented that prevents simple decoding of the center position. Therefore, in our work, we propose a calculation method that helps identify the positions of the impurity center.
To calculate the parameters of the crystal field, quantum mechanical approaches are most often used [18,19]. However, the classical approach can also be used, such as calculation of the crystal field parameters in the model point charges through the Coulomb interaction. In this work, a combined approach is used, where the electron density distribution is calculated using the density functional theory (DFT) method, and then the parameters of the crystal field are computed using the calculated electron density and atomic cores (at points of interest).
Nowadays, with an increase in computing power and a growing interest in materials based on calcium phosphates, a large number of works are devoted to the study of cationic substitutions in calcium phosphates, especially in hydroxyapatites, by DFT. DFT calculations make it possible to determine the most probable substitution position for impurity ions and monitor changes in the unit cell geometry, changes in the local positions of surrounding ions caused by impurities, etc. [20,21,22,23,24,25]. In most cases, DFT calculations help to confirm the assumptions that are made on the basis of experimental data. In addition to calculating positions and other geometric properties and cell geometry, DFT allows calculating various parameters that are associated with different physical properties of the substance. As an example, calculations of the electronic band structure, optical properties, energy of formation of defects, density of states, and EPR parameters, such as g-factor and hyperfine interaction constant A for HAp, are presented in [26,27,28,29]. Our work relates to the calculation of physical parameters that appear in the spectra of electron paramagnetic resonance.

2. Materials and Methods

2.1. Calculation of Electron Density

To calculate the electron density and configuration of paramagnetic impurities, the variational self-consistent field method was chosen. This method is implemented in the Quantum Espresso software package (PWscf module) using a plane waves (PWs) basis set and pseudopotentials to represent electron–ion interactions to the solution of the density functional theory (DFT) problem. The codes are constructed around the use of periodic boundary conditions, which allows for a straightforward treatment of infinite crystalline systems, and an efficient convergence to the thermodynamic limit for aperiodic but extended systems, such as liquids or amorphous materials [30].
The initial parameters of the crystal structure of hydroxyapatite were taken from the work [31]. Optimization was performed in two steps. In the first step, one hydroxyapatite cell was optimized. During the optimization of the geometry of one cell, the cell sizes and atomic positions were completely relaxed. In the second step, a supercell was obtained by doubling the new coordinates. Further, the calcium ion was replaced by a manganese ion in this structure. After this, the second optimization was performed with a fixed cell size. This was performed in order to take into account the locality of the substitution ion in further calculations, as the other surrounding cells of hydroxyapatite (in our calculations, there are about 20,000) do not change their size without impurity.
The unit cell was doubled along the A crystallographic axis (2 × 1 × 1). The size of the doubled cell is 18.848 × 9.424 × 6.879 Å. The impurity paramagnetic center replaces the Ca ion in one of two possible positions in the double cell according to the literature [32]. In our case, the Ca (I) position corresponds to the Ca (5) ion, and the Ca (II) position corresponds to the Ca (10) (Figure 1). Then, the cell geometry is optimized by energy minimization. This approach allows obtaining configurations of impurity centers in a crystal cell and numerical values of the electron density distribution. The positions of the ions could be varied, and the volume and size of the original cell were preserved.
Calculations were implemented using plane-wave pseudopotential using the Purdue–Burke–Ernzerhof (PBE) exchange-correlation functional [33]. Structural optimization was performed with the kinetic energy cutoffs of 60 Ry for the smooth part of the electron wave functions and 400 Ry for the augmented electron density (as defined by the convergence test) and with a 1 × 1 × 1 Monkhorst-Pack k-point mesh.
The electron density distribution is shown in Figure 1. The figure shows that the electron density in the region of the Mn2+ ion is spherical, but the electron density of the nearest PO4 groups is far from spherical. Therefore, the use of the model of point charges, in this case, is unjustified.

2.2. Calculation of the Parameters of the Electric Crystal Field

In the point-charge model, the crystal field includes the electric fields from all charged ions in the environment. The crystal field parameters B k q can be calculated through the Coulomb interaction:
B q k = j Z j e 2 r k R j k + 1 ( 1 ) q C q k ( θ j , φ j ) ,
where r i k = 0 r k R 3 d 2 r 2 d r [34].
As described above, it is insufficient to use the model of point charges for the HAp+Mn2+ system. Therefore, this model was modified. The interaction of the impurity ion with the cores of the ions and with the electron density was taken into account separately:
B q k = j Z j e 2 r k R j k + 1 ( 1 ) q C q k ( θ j , φ j ) +   ρ ( r ) e 2 r k R j k + 1 ( 1 ) q C q k ( θ , φ ) d r
where j runs over all the ion cores in the lattice, ZCa = 10, ZO = 6, ZP = 5, and ZH = 1. The integral is taken over the entire electron density.
The calculation of the crystal field parameters was carried out using a computer program written in the Python language for a sphere of double cells, in the center of which there is an impurity ion. The calculated positions of the impurity center for two possible variants of substitution at the positions Ca (I) and Ca (II) were taken as the origin of coordinates (centers of the spheres). This sphere includes entire double cells that are no further than a certain radius. Thus, proceeding from the electroneutrality of one cell, the electroneutrality of the entire crystal is taken into account. To maintain symmetry, the calculations use an odd number of cells in each direction. To accelerate the calculations, the following models are combined: the calculation of the parameters B q k taking into account the distributed (calculated) electron density inside the sphere of the nearest environment and the calculation of the parameters B q k in the point charges model for the remote environment. In the intermediate case, a light model of the electron density was used: the several points of the electron density are replaced by one point with average coordinates (reduction of sampling).
The calculation of electric crystal field parameters in the model with electron density was made in a radius from 0 to 6 nm (1727 double cells), an intermediate model was applied in a radius from 6 to 9 nm (3988 double cells), and the model of point charges was from 9 to 15 nm (21,064 double cells). The resulting parameters B k q were adjusted according to the article [35]. The results are shown in Table 1.
To check the convergence, an increase in the radius of the spheres by 1.5 times was used; the change in the parameters was 0.01%. The calculation was also performed for different positions of Ca (I) and Ca (II) in the supercell; the change in the parameters did not exceed 1%.

2.3. HAp Samples and EPR Technique

Powders of hydroxyapatite doped with Mn2+ with the chemical formula Ca9.995Mn0.005(PO4)6(OH)2 were synthesized by the wet precipitation technique at the Faculty of New Materials Science, Moscow State University. Details of the synthesis and powder characterization are given elsewhere [14,36]. The powders were investigated by EPR. The EPR spectra of impurity manganese ions in hydroxyapatite were obtained by exploiting the abilities of Bruker Elexsys 580/680 spectrometer in the X- (9 GHz) and W- (94 GHz) bands in the pulsed mode [9]. The EPR absorption spectra are recorded by the detection of the electron spin echo amplitude using the two-pulse Hahn sequence (π/2 ← 240 ns → π with the duration of the π/2 pulse equal to 24 ns) To acquire an electron spin echo signal with the appropriate signal-to-noise ratio, the EPR measurements were done at low temperatures by using a helium-flow cryostat.

3. Results

Modeling of “Powder” EPR Spectra of Mn2+

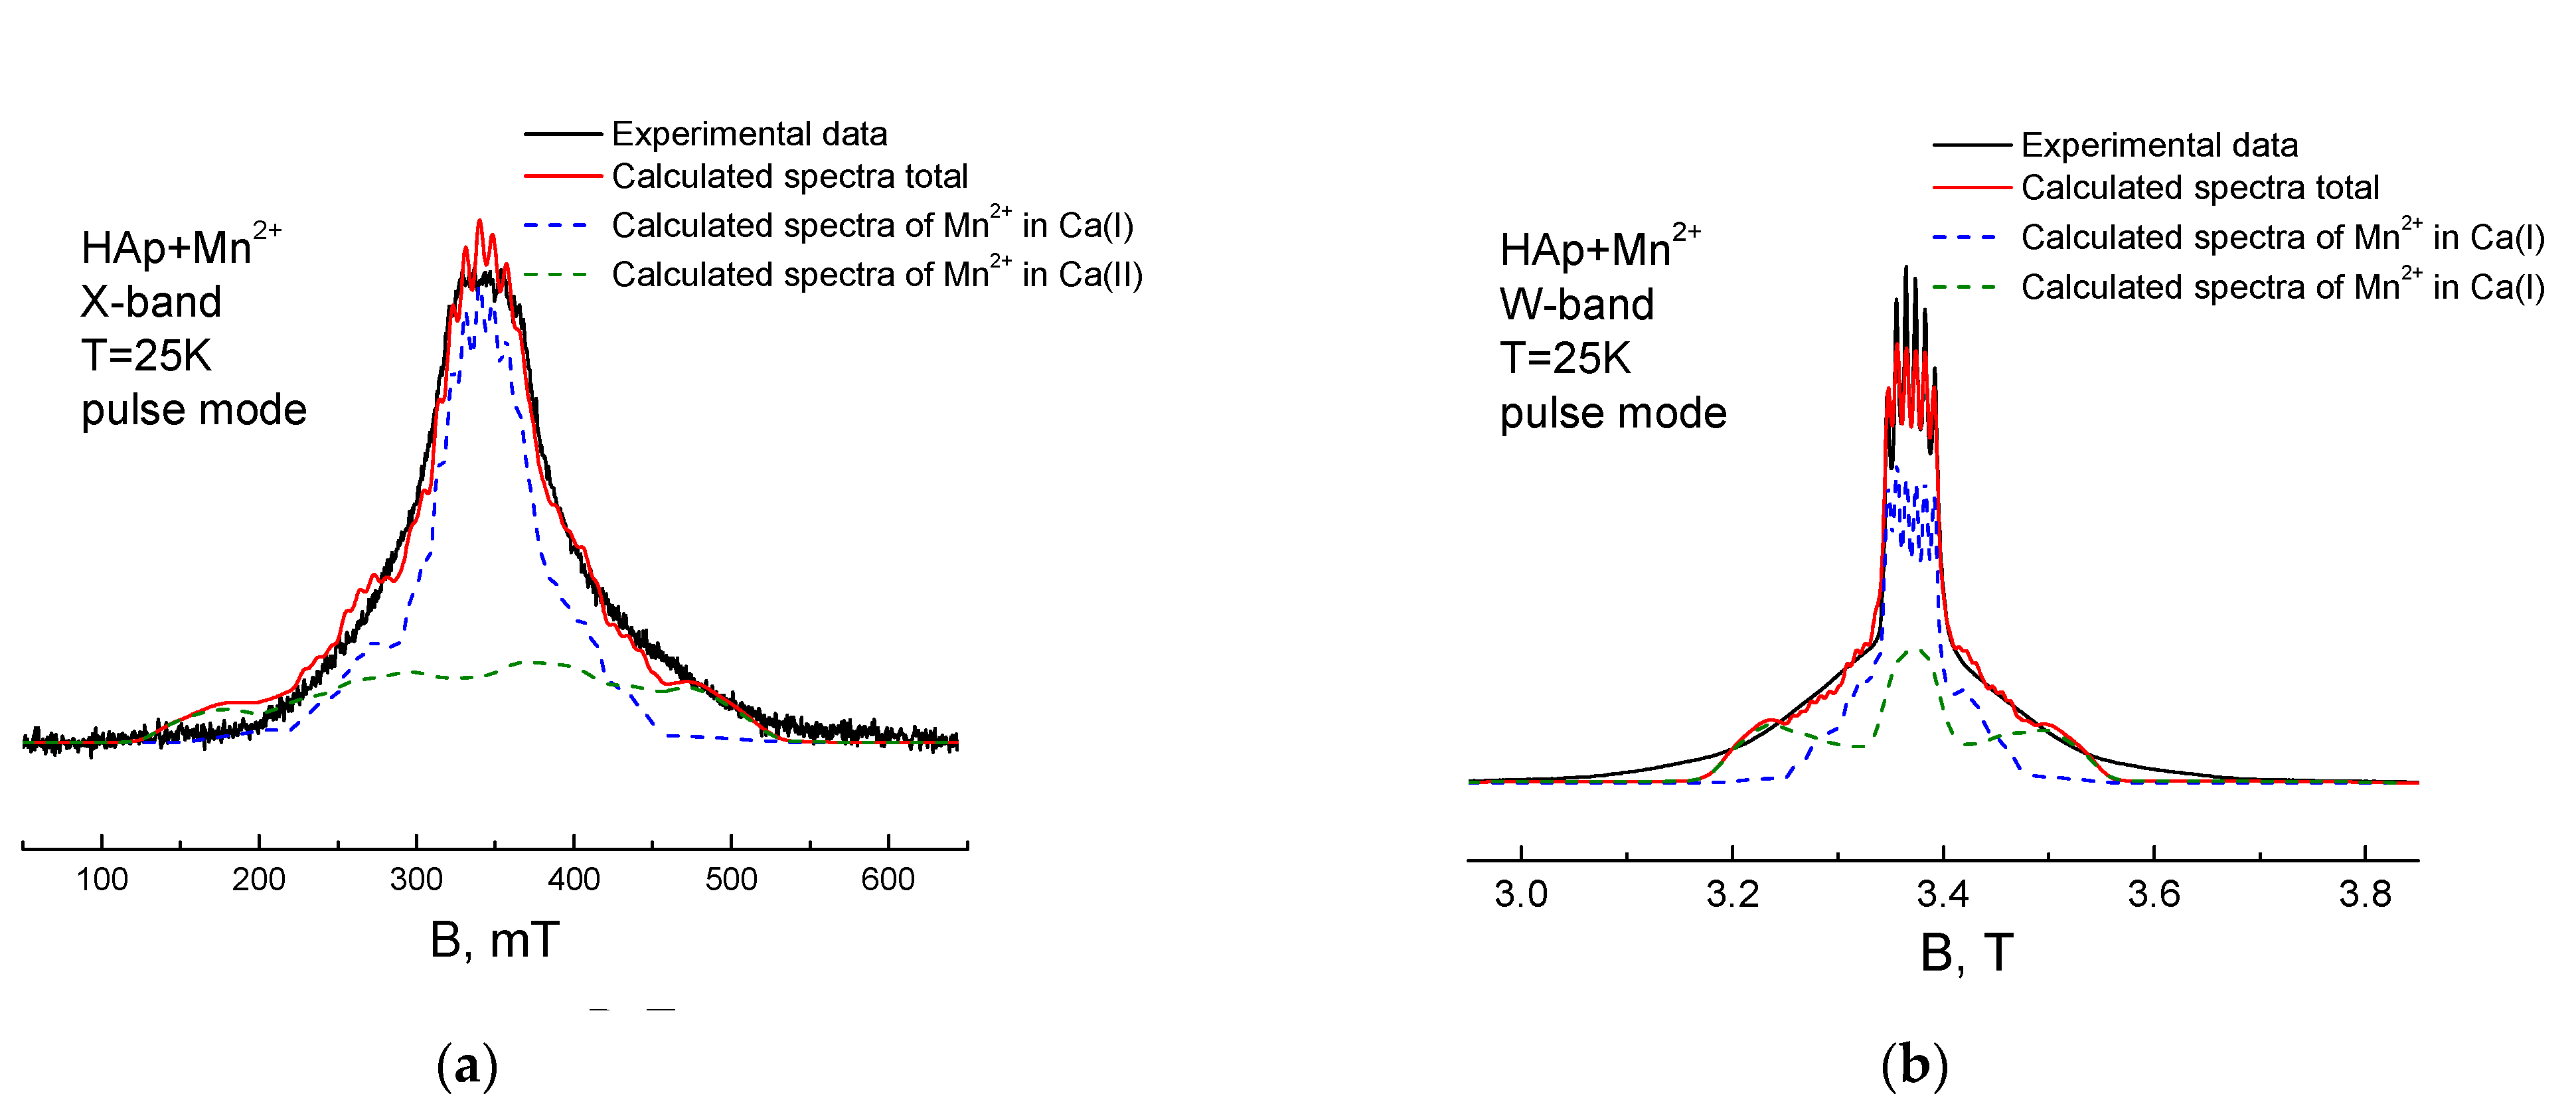
The Mn2+ ion is in the 6S5/2 spin state and the fine structure in the EPR spectra should be absent in the first approximation. In [37], excited electronic states with nonzero spin-orbital angular momentum are used to explain the appearance of ZFS. Using the results of this work in our case, we obtained a correction factor of the order 10−7, which is the same for all simulated spectra. Further, for the best agreement of the experimental data, this coefficient was chosen more accurately (for B2 as 2 × 10⁻⁷, for B4 as 0.7 × 10⁻⁷). The obtained parameters of the crystal field were used to simulate the powder EPR spectra of manganese ions in hydroxyapatite in the X- and W-ranges. The modeling of the EPR spectra was carried out in the EasySpin module in MATLAB. The spectra are shown in Figure 2. The simulation was carried out simultaneously in the X and W bands of the EPR spectrometer, as this made it possible to isolate the ZFS effects. The simulation parameters of the experiment (field sweep, temperature, number of points) corresponded to the experimental ones. System parameters: g-factor from calculations in the Quantum Espresso program (for the Ca (I) center gx = 2.0082, gy = 2.0082, gz = 2.0078; for the Ca (II) center gx = 2.0096, gy = 2.008, gz = 2.0077), hyperfine interaction constant A from literature data (we consider it isotropic) A = 252 ± 3 MHz [14]. The intensity ratio of the manganese spectra at the Ca (I)/Ca (II) positions was 1.4.

4. Conclusions

It was demonstrated that the parameters of the crystal field in HAp can be calculated in the classical model using the distributed electron density. We tested the extraction for the two distinct calcium positions in HAp crystal field parameters to fit the EPR spectra of the doped Mn2+ ions. Good agreement between the modeled and experimental data can be achieved by only suggesting that, in the hydroxyapatite powder under study, manganese ions replace calcium ions in both possible positions even at low concentration with the slight prevalence for the Ca (I) site. The obtained results show a way to extract information for the localization of paramagnetic ions in the HAp structure from the EPR spectra.
At present, there are different approaches to calculating the parameters of the crystal field. These approaches require complex mathematical calculations. The advantage of the presented in this paper technique is the simplicity of the mathematical model and the absence of complex mathematical calculations. To calculate the parameters of the crystal field, it is enough to set the initial positions of the ions in the system and indicate for which center the calculation will be carried out.
The disadvantages of the method include the fact that the average radius is involved in the calculations. In fact, the radius of the impurity ion depends on the angle and time. In addition, the utilization of various software is required for the calculations, which implies high software costs and high qualifications of the researcher. Moreover, due to limitations in computer power, we cannot calculate the parameters of the crystal field at real (low) concentrations of dopants. On the other hand, our approach allows taking into account imperfections of real crystals, for example, by introducing the parameters of the distribution of the fine structure associated with dislocations in the crystal. The corresponding calculations are being prepared for publication.

Funding

The reported study was funded by the Russian Foundation for Basic Research (RFBR) according to the research project 20-32-90159.

Institutional Review Board Statement

Not applicable.

Informed Consent Statement

Not applicable.

Data Availability Statement

Data can be available upon request from the authors.

Conflicts of Interest

The authors declare no conflict of interest.

References

  1. Epple, M. Review of potential health risks associated with nanoscopic calcium phosphate. Acta Biomater. 2018, 77, 1–14. [Google Scholar] [CrossRef]
  2. Silva, L.M.D.; Tavares, D.D.S.; Santos, E.A.D. Isolating the Effects of Mg2+, Mn2+ and Sr2+ Ions on Osteoblast Behavior from those Caused by Hydroxyapatite Transformation. Mater. Res. 2020, 23. [Google Scholar] [CrossRef]
  3. Matsunaga, K. First-principles study of substitutional magnesium and zinc in hydroxyapatite and octacalcium phosphate. J. Chem. Phys. 2008, 128, 245101. [Google Scholar] [CrossRef] [PubMed] [Green Version]
  4. Gafurov, M.; Biktagirov, T.; Yavkin, B.; Mamin, G.; Filippov, Y.; Klimashina, E.; Putlayev, V.; Orlinskii, S. Nitrogen-containing species in the structure of the synthesized nano-hydroxyapatite. JETP Lett. 2014, 99, 196–203. [Google Scholar] [CrossRef] [Green Version]
  5. Medvecký, Ľ.; Štulajterová, R.; Parilák, Ľ.; Trpčevská, J.; Ďurišin, J.; Barinov, S. Influence of manganese on stability and particle growth of hydroxyapatite in simulated body fluid. Colloids Surfaces A Physicochem. Eng. Asp. 2006, 281, 221–229. [Google Scholar] [CrossRef]
  6. Li, Y.; Widodo, J.; Lim, S.; Ooi, C.P. Synthesis and cytocompatibility of manganese (II) and iron (III) substituted hydroxyap-atite nanoparticles. J. Mater. Sci. 2012, 47, 754–763. [Google Scholar] [CrossRef]
  7. Rau, J.V.; Fadeeva, I.V.; Fomin, A.S.; Barbaro, K.; Galvano, E.; Ryzhov, A.P.; Murzakhanov, F.; Gafurov, M.; Orlinskii, S.; Antoniac, I.V.; et al. Sic Parvis Magna: Manganese-Substituted Tricalcium Phosphate and Its Biophysical Properties. ACS Biomater. Sci. Eng. 2019, 5, 6632–6644. [Google Scholar] [CrossRef]
  8. Fadeeva, I.; Kalita, V.; Komlev, D.; Radiuk, A.; Fomin, A.; Davidova, G.; Fursova, N.; Murzakhanov, F.; Gafurov, M.; Fosca, M.; et al. In Vitro Properties of Manganese-Substituted Tricalcium Phosphate Coatings for Titanium Biomedical Implants Deposited by Arc Plasma. Materials 2020, 13, 4411. [Google Scholar] [CrossRef]
  9. Gabbasov, B.; Gafurov, M.; Starshova, A.; Shurtakova, D.; Murzakhanov, F.; Mamin, G.; Orlinskii, S. Conventional, pulsed and high-field electron paramagnetic resonance for studying metal impurities in calcium phosphates of biogenic and synthetic origins. J. Magn. Magn. Mater. 2019, 470, 109–117. [Google Scholar] [CrossRef]
  10. Bose, S.; Fielding, G.; Tarafder, S.; Bandyopadhyay, A. Understanding of dopant-induced osteogenesis and angiogenesis in calcium phosphate ceramics. Trends Biotechnol. 2013, 31, 594–605. [Google Scholar] [CrossRef] [Green Version]
  11. Liu, H.; Cui, X.; Lu, X.; Liu, X.; Zhang, L.; Chan, T.-S. Mechanism of Mn incorporation into hydroxyapatite: Insights from SR-XRD, Raman, XAS, and DFT calculation. Chem. Geol. 2021, 579, 120354. [Google Scholar] [CrossRef]
  12. Chelyshev, Y.; Gafurov, M.; Ignatyev, I.; Zanochkin, A.; Mamin, G.; Sorokin, B.; Sorokina, A.; Lyapkalo, N.; Gizatullina, N.; Mukhamedshina, Y.; et al. Paramagnetic Manganese in the Atherosclerotic Plaque of Carotid Arteries. BioMed. Res. Int. 2016, 2016, 1–7. [Google Scholar] [CrossRef] [Green Version]
  13. Kay, M.I.; Young, R.A.; Posner, A.S. Crystal Structure of Hydroxyapatite. Nature 1964, 204, 1050–1052. [Google Scholar] [CrossRef]
  14. Gafurov, M.; Biktagirov, T.; Mamin, G.; Klimashina, E.; Putlayev, V.; Kuznetsova, L.; Orlinskii, S. The Interplay of manganese and nitrate in hydroxyapatite nanoparticles as revealed by pulsed EPR and DFT. Phys. Chem. Chem. Phys. 2015, 17, 20331–20337. [Google Scholar] [CrossRef] [PubMed]
  15. Ignatyev, I.M.; Gafurov, M.R.; Krivosheeva, N.V. Criteria for Carotid Atherosclerotic Plaque Instability. Ann. Vasc. Surg. 2021, 72, 340–349. [Google Scholar] [CrossRef]
  16. Murzakhanov, F.F.; Grishin, P.O.; Goldberg, M.A.; Yavkin, B.V.; Mamin, G.V.; Orlinskii, S.B.; Fedotov, A.Y.; Petrakova, N.V.; Antuzevics, A.; Gafurov, M.R.; et al. Radiation-Induced Stable Radicals in Calcium Phosphates: Results of Multifrequency EPR, EDNMR, ESEEM, and ENDOR Studies. Appl. Sci. 2021, 11, 7727. [Google Scholar] [CrossRef]
  17. Kooser, R.G.; Kirchmann, E.; Matkov, T. Measurements of spin concentration in electron paramagnetic resonance spectros-copy preparation of standard solutions from optical absorption. Concepts Magn. Reson. 1992, 4, 145–152. [Google Scholar] [CrossRef]
  18. Reviakine, R.; Arbuznikov, A.V.; Tremblay, J.-C.; Remenyi, C.; Malkina, O.L.; Malkin, V.G.; Kaupp, M. Calculation of zero-field splitting parameters: Comparison of a two-component noncolinear spin-density-functional method and a one-component perturbational approach. J. Chem. Phys. 2006, 125, 54110. [Google Scholar] [CrossRef] [PubMed]
  19. Ganyushin, D.; Neese, F. First-principles calculations of zero-field splitting parameters. J. Chem. Phys. 2006, 125, 024103. [Google Scholar] [CrossRef] [PubMed]
  20. Ellis, D.E.; Terra, J.; Warschkow, O.; Jiang, M.; González, G.B.; Okasinski, J.S.; Bedzyk, M.J.; Rossi, A.M.; Eon, J.-G. A theoretical and experimental study of lead substitution in calcium hydroxyapatite. Phys. Chem. Chem. Phys. 2006, 8, 967–976. [Google Scholar] [CrossRef]
  21. De Leeuw, N.H. Computer simulations of structures and properties of the biomaterial hydroxyapatite. J. Mater. Chem. 2010, 20, 5376–5389. [Google Scholar] [CrossRef]
  22. Gelli, R.; Briccolani-Bandini, L.; Pagliai, M.; Cardini, G.; Ridi, F.; Baglioni, P. Exploring the effect of Mg2+ substitution on amorphous calcium phosphate nanoparticles. J. Colloid Interface Sci. 2021, 66, 444–453. [Google Scholar]
  23. Goldberg, M.; Gafurov, M.; Murzakhanov, F.; Fomin, A.; Antonova, O.; Khairutdinova, D.; Pyataev, A.; Makshakova, O.; Konovalov, A.; Leonov, A.; et al. Mesoporous Iron(III)-Doped Hydroxyapatite Nanopowders Obtained via Iron Oxalate. Nanomaterials 2021, 11, 811. [Google Scholar] [CrossRef]
  24. Goldberg, M.; Gafurov, M.; Makshakova, O.; Smirnov, A.; Komlev, V.; Barinov, S.; Kudryavtsev, E.; Sergeeva, N.; Achmedova, S.; Mamin, G.; et al. Influence of Al on the Structure and in Vitro Behavior of Hydroxyapatite Nanopowders. J. Phys. Chem. B 2019, 123, 9143–9154. [Google Scholar] [CrossRef] [PubMed] [Green Version]
  25. Goldberg, M.A.; Akopyan, A.V.; Gafurov, M.R.; Makshakova, O.N.; Donskaya, N.O.; Fomin, A.S.; Polikarpova, P.P.; Anisimov, A.V.; Murzakhanov, F.F.; Leonov, A.V.; et al. Iron-Doped Mesoporous Powders of Hydroxyapatite as Molybdenum-Impregnated Catalysts for Deep Oxidative Desulfurization of Model Fuel: Synthesis and Experimental and Theoretical Studies. J. Phys. Chem. C 2021, 125, 11604–11619. [Google Scholar] [CrossRef]
  26. Rulis, P.; Ouyang, L.; Ching, W.Y. Electronic structure and bonding in calcium apatite crystals: Hydroxyapatite, fluorapat-ite, chlorapatite, and bromapatite. Phys. Rev. B 2004, 70, 155104. [Google Scholar] [CrossRef]
  27. Bystrova, A.V.; Dekhtyar, Y.D.; Popov, A.I.; Coutinho, J.; Bystrov, V.S. Modified hydroxyapatite structure and properties: Modeling and synchrotron data analysis of modi-fied hydroxyapatite structure. Ferroelectrics 2015, 475, 135–147. [Google Scholar] [CrossRef]
  28. Avakyan, L.A.; Paramonova, E.V.; Coutinho, J.; Öberg, S.; Bystrov, V.S.; Bugaev, L.A. Optoelectronics and defect levels in hydroxyapatite by first-principles. J. Chem. Phys. 2018, 148, 154706. [Google Scholar] [CrossRef] [Green Version]
  29. Biktagirov, T.; Gafurov, M.; Mamin, G.; Klimashina, E.; Putlayev, V.; Orlinskii, S. Combination of EPR Measurements and DFT Calculations To Study Nitrate Impurities in the Carbonated Nanohydroxyapatite. J. Phys. Chem. A 2014, 118, 1519–1526. [Google Scholar] [CrossRef]
  30. Giannozzi, P.; Baroni, S.; Bonini, N.; Calandra, M.; Car, R.; Cavazzoni, C.; Ceresoli, D.; Chiarotti, G.L.; Cococcioni, M.; Dabo, I.; et al. Quantum Espresso: A modular and open-source software project for quantum simulations of materials. J. Phys. Condens. Matter 2009, 21, 395502. [Google Scholar] [CrossRef]
  31. Sudarsanan, K.; Young, R.A. Significant precision in crystal structural details. Holly Springs hydroxyapatite. Acta Crystallogr. Sect. B Struct. Crystallogr. Cryst. Chem. 1969, 25, 1534–1543. [Google Scholar] [CrossRef]
  32. Gilinskaya, L.G.; Scherbakova, M.Y. Physics of Apatite; Nauka: NovosiЬirsk, Russia, 1975; Volume C, pp. 7–63. [Google Scholar]
  33. Perdew, J.P.; Burke, K.; Ernzerhof, M. Generalized Gradient Approximation Made Simple. Phys. Rev. Lett. 1996, 77, 3865. [Google Scholar] [CrossRef] [PubMed] [Green Version]
  34. Sugano, S.; Tanabe, Y.; Kamimura, H. Multiplets of Transition-Metal Ions in Crystals; Academic Press: Cambridge, MA, USA, 1970; pp. 6–16. [Google Scholar]
  35. Mulak, M.; Mulak, J. The Second and Third Crystal Field Splitting Moments in Verification of the Trigonal and Hexagonal Crystal Field Parametrizations. Phys. Status Solidi 2018, 255, 1800115. [Google Scholar] [CrossRef]
  36. Kovaleva, E.S.; Shabanov, M.P.; Putlyaev, V.I.; Tretyakov, Y.D.; Ivanov, V.K.; Silkin, N.I. Bioresorbable carbonated hydroxyapatite Ca10-xNax(PO4)6-x(CO3)x(OH)2 powders for bioactive materials preparation. Cent. Eur. J. Chem. 2009, 7, 168. [Google Scholar] [CrossRef]
  37. Sharma, R.R.; Das, T.P.; Orbach, R. Zero-field splitting of S-state ions. I. Point-multipole model. Phys. Rev. 1966, 149, 257. [Google Scholar] [CrossRef]
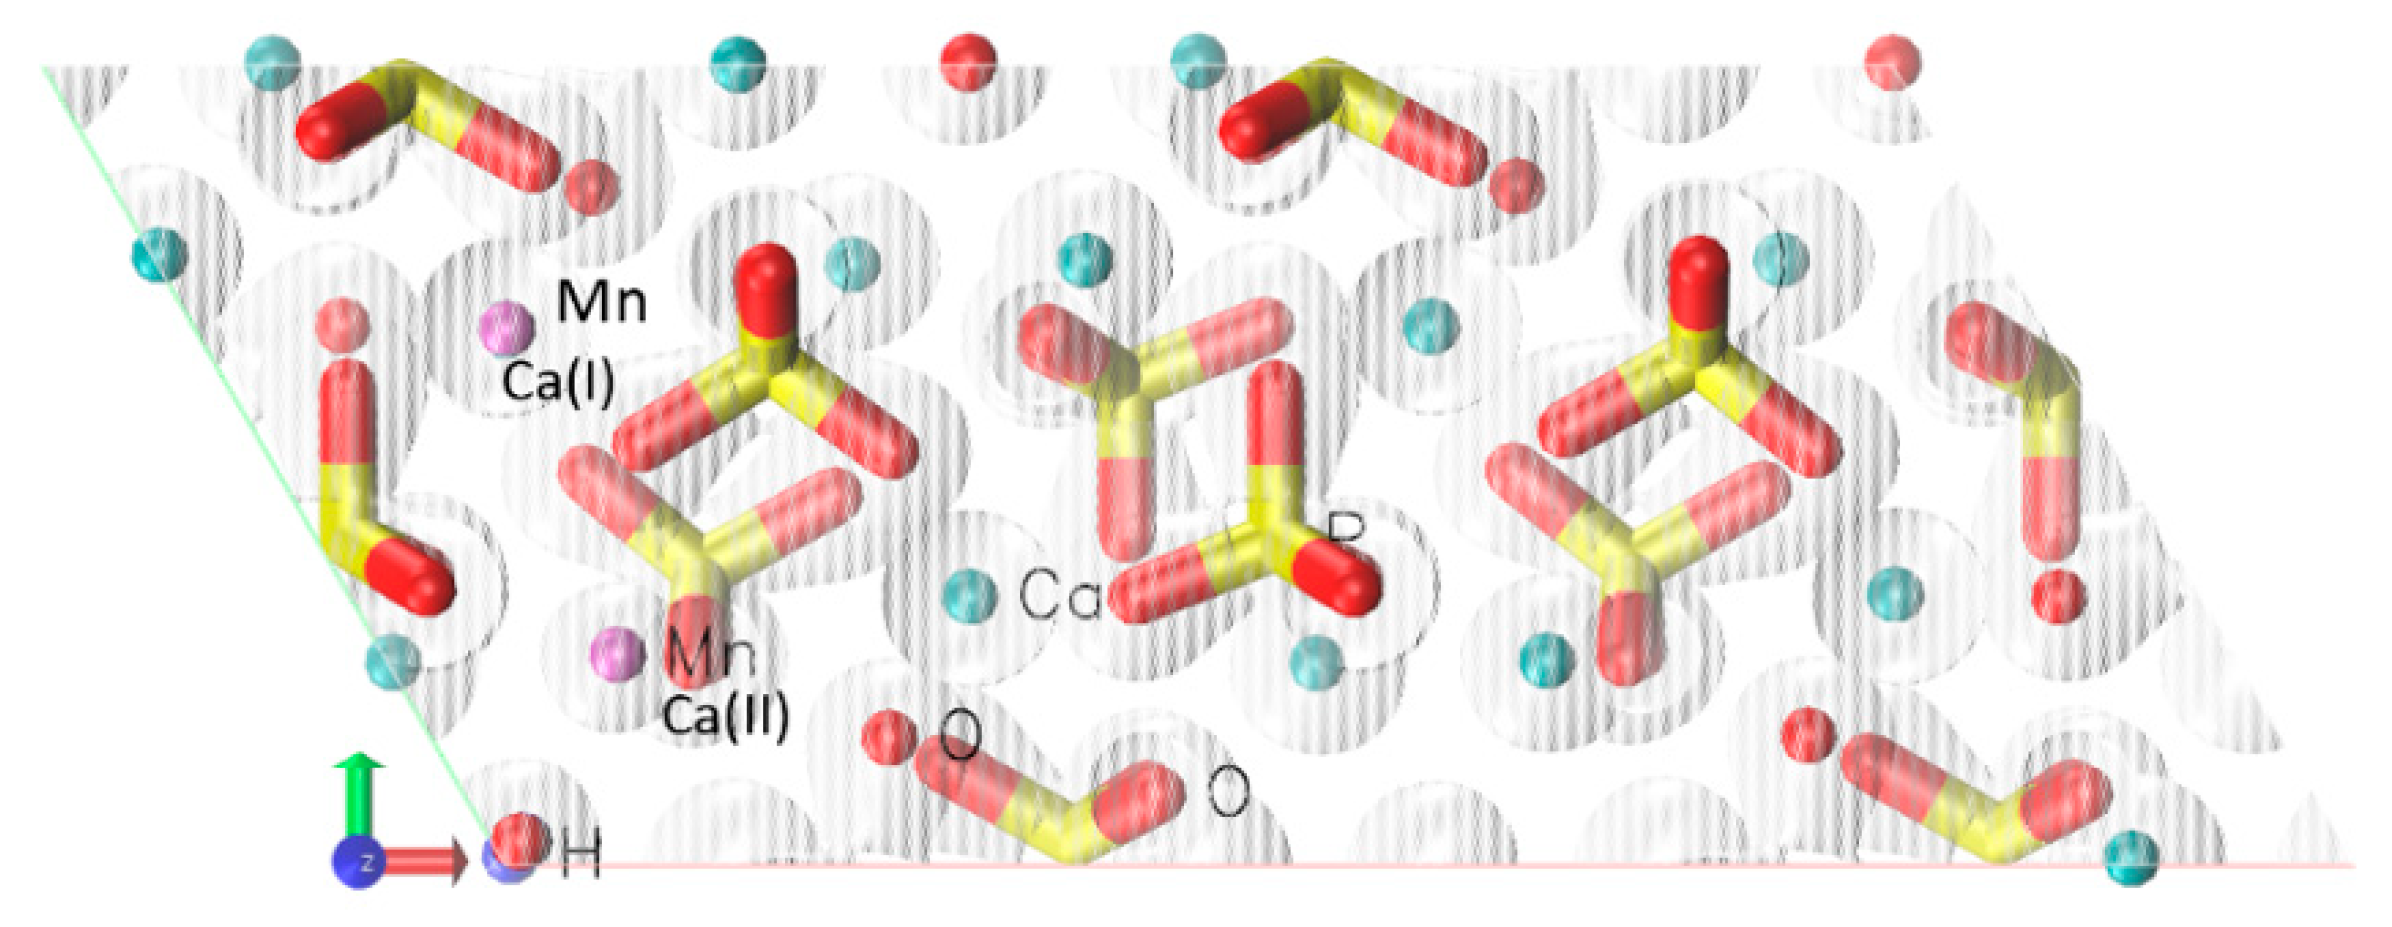
Figure 1. Example of calculating electron density using the Quantum Espresso software for hydroxyapatite.
Crystals 11 01050 g001
Figure 2. Modeled (red line) and experimental (black line) EPR spectra of Mn2+ ions in the X-range (a) and in the W-range (b) in a hydroxyapatite sample in the pulse mode.
Crystals 11 01050 g002
Table 1. The calculated parameters of the crystal field B k q for two possible positions in different models.
Ca(I)Ca(II)
cm−1Electron Density ModelPoint-Charge ModelElectron Density ModelPoint-Charge Model
B2051,44325,83147,18326,702
B2219601510729
B403721268812,2293850
B4152032644
B42440272103
B4330839817
B448022927
Publisher’s Note: MDPI stays neutral with regard to jurisdictional claims in published maps and institutional affiliations.