Abstract
Each tubulin protein molecule on the cylindrical surface of a microtubule, a fundamental element of the cytoskeleton, acts as a unit cell of a crystal sensor. Electromagnetic sensing enables the 2D surface of microtubule to act as a crystal or a collective electromagnetic signal processing system. We propose a model in which each tubulin dimer acts as the period of a one-dimensional crystal with effective electrical impedance related to its molecular structure. Based on the mathematical crystal theory with one-dimensional translational symmetry, we simulated the electrical transport properties of the signal across the microtubule length and compared it to our single microtubule experimental results. The agreement between theory and experiment suggests that one of the most essential components of any Eukaryotic cell acts as a one-dimensional crystal.
1. Introduction
In the past, several theoretical studies were completed by physicists on the vibrational characteristics of bio-living systems, which are currently becoming more attractive research domains in the present. State-of-the-art tools are used to detect vibrational aspects and principle authentication. Traditional theoretical methods are not sufficient to understand the process of biological systems [1,2]. The cooperative interaction between individual components of the developed dynamic system of the biological system changes in a specific fashion [3]. Biological materials show complex vibrational patterns. In other words, solid structures have a crystalline structure and the translational symmetry/spatial periodicity confirms them as an integrated mechanical system, which is well known in solid-state physics or lattice theory. The lattice, known as the base, can be found by the duplication of building elements [4]. The electrons interact with the atomic lattice with atomic potentials. The electronic bandgap is generated when an electronic state does not exist for a certain energy range [5].
Consequently, a wide range of man-made systems is inspired by the design and organization of such biological systems, which include some of their properties. Whereby we have photonic crystals (crystals in which phonons interact with the periodic variation of elasticity and mass of structure elements) and phononic crystals (crystals in which photons are affected by the variation of the dielectric constant of structure) [6,7].
However, there are many examples of photonic crystals [8] in nature, such as the Chrysinaresplendens beetle in which 120 layers produce color, commonly known as one-dimensional photonic crystals [9]. More, a two-dimensional photonic crystal film is found in the peacock Pavomuticus, which is composed of more than ten-unit cells in thickness, and that layer has a highly reflective nature and provides a saturated color. The interactive wavelength is determined by the lattice parameters of the layers [10]. Neurofilament and microfilaments are not photonic crystals, although they form the basic features of neurons, they carry out information processing during the cell division process and serve as carriers of vesicles and several components in the biological system. Crystalline structures are found in various forms in nature. Bressloff PC & Cowan JD [11] present a model of pattern formation in the primary visual cortex (V1) of the brain that considers a crystalline structure. In order to understand biological systems more broadly, an interdisciplinary approach based on mathematical and physical sciences can make a significant contribution as biological crystal structures are not limited to photonic domains. The propagation of electromagnetic quanta through a biological lattice leads to a wide range of applications. For example, quantized energy propagation can have applications in wireless electromagnetic fields in medical treatment. The microtubule is the closest candidate related to it.
Microtubules in living cells are organized as networks (where they regularly shrink and grow) and in neurons (where they form highly complex networks with neurons and microfilaments, which generate large-scale communication pathways). To demonstrate the function of cells, microtubules are interconnected through multiple proteins (Figure 1a). The outer and inner diameter voids of the microtubule cylinder are approximately 25 nm and 15 nm respectively and they are found in animals from 200 nm to 25 µm [12]. The length of the dimer unit is 8 nm distributed over a Gaussian distribution with a 2 nm standard deviation and 13 protofilaments are present in the cylindrical surface of the microtubule [13]. The protofilaments are tightly bound from the inside and have weak ties between them, forming 2D sheets that are wrapped with a tube through the nucleation process [14]. Each monomer of the lattice of the microtubule has H12- a small C-terminal helix, which emits after a sequence of amino acids that extend from the microtubule surface.
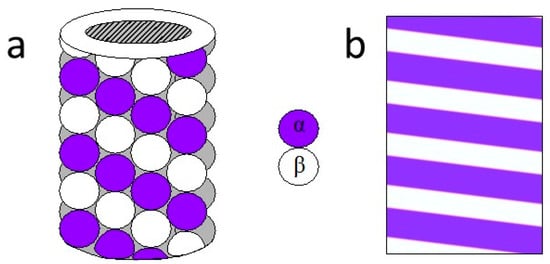
Figure 1.
(a) Sketch of a microtubule. (b) Simple drawing of a single photonic crystal layered with 18° tilt.
This approximate sequence is known as tubulin tail (TT). TTs have a length of about 4–5 nm when they become completely uncontaminated, protrude from the microtubule (MT) surface into the slurry, and form the rough surface of the microtubule filaments. The TTs are key for MT interactions with related proteins. In addition, TTs from a beta-tubulin monomer could increase or decrease H12 length and consequently the beta-TT length [15,16].This property would be of importance as we model the transport properties in microtubules because TT’s flexibility could significantly act on the ionic current flow across the microtubule surface. MTs are predominantly negatively charged, chiefly on their outward surface. Thus, each MT attracts a positive counter of ions near its surface, while negative ions of the cytosol are repelled in such a way that form depletion layers around the microtubule. The thickness of the depletion layer is known as the Bjerrum length , which is the length from the surface of the microtubule where the thermal energy is equal to the coulomb energy of the screened surface charges [14].This length greatly determines MT’s electric properties. Additionally, the final spatial arrangement of MT protofilaments can be seen as a tilted multilayer structure with a unit cell of 8 nm (Figure 1b). In this way, we can make explicit the method by which wave-like activity emerges from neuronal activity [17,18,19,20,21,22,23,24,25].
Researchers believe that the dissemination of information in neural networks occurs at synaptic junctions, while experimental evidence suggests that microtubules may function as RAM, which demands correction more accurately than at a synaptic junction. It is also noteworthy that a sequence of protein molecules has to undergo a conformational chain in a particular order to open the ion channel. Therefore, vibration is key to the conventional understanding of membranes and ionic-based information processing. Although the terms of neural oscillations [26,27,28] in brain activity are mostly preferred with electrical impulses through membrane molecules, and the oscillatory term of the brain refers to the rhythm of electrical activity [29,30] in the central nervous system, CNS, and this can form the microtubule from the transmission system of the electromagnetic quanta [31,32]. Poznanski and Cacha have considered “protein polarization as a mechanism by way of passive dendrites becoming active by treating the dipolar core as a conductor of current based on the assumption that interactions between individual moving charges can be treated as a homogeneous intracellular medium of constant conductivity and permittivity in space and time.”. As can be seen in Figure 1, the MT can be represented as a structure whose permittivity and permeability parameters are changing periodically. Sahu S, et al. proposed that the “water channel and protein molecule together control the emergent properties of the material” [21]. These facts play an important role in MT modeling as electromagnetic quanta processing crystals. A theoretical model is suggested for magnetoencephalography (MEG) and electroencephalography (EEG) that is based on the activity of cortical networks and the transmission line model [20]. The theory of brain waves is defined theoretically based on synaptic action properties that can infer many silent features and some experimental findings using the characteristic of the forward and backward propagating wave.
We speculate that brain waves can be thought of as Bloch waves that may provide important mechanisms for consistent large-scale integration between brain regions [17,18,24].In this work, we study, experimentally and theoretically, electrical transport properties within tubulin-based microtubules (MT). Using the above MTs properties and symmetry we model them as a periodic crystal with a defect and compare the experimental transmission with our model predicted transmission spectrum.
2. Results
2.1. Crystal Model
We suppose that there is a flow of water and ions from one end of the MTs to the other, produced by the concentration gradient and by inherent electrical fields generated by the charge of the protein spread aligned to every one of the 13 protofilaments. On top of that, the globe-like configuration of tubulin dimers engenders tiny orifices that can be regarded as channels connecting the outer and the inner surfaces of a microtubule. In these straits, we should expect further escape of water molecules, which would be capable of rectifying the currents along with the depletions of the Bjerrum layer around a microtubule [23]. Moreover, if the water channel is released, the microtubule loses all its unique vibrational properties, and, thus, the water channel controls all optical and electronic properties of the microtubule [20]. Therefore, our work is based on the theory used for electromagnetic radiation in periodic layered media, but, in the present case, we will consider electromagnetic resonance-induced water and ionic flows as ion current waves traveling in a periodic structure. The MT or neuronic crystal period will consist of the tubulin dimer unit (alpha- and beta-tubulin together). The reason for this is because they fold differently, creating two intertwined helicoidal structures. We can model each tubulin monomer as two perpendicular hollow cylinders [23] as depicted in Figure 2. Every monomer has a series resistance RSI(I = β) and parallel resistance Rpi and to keep the model as simple as possible neither capacitance nor inductance effects are taken into account.
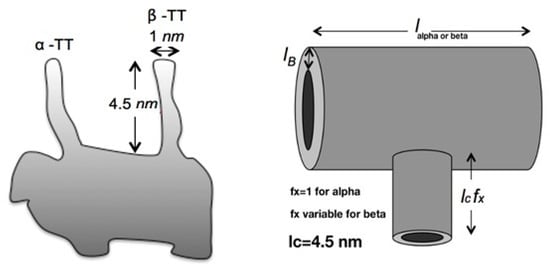
Figure 2.
A sketch showing tubulin monomer physical model.
Both resistances are given by the following:
The parameter allows the β-TTs to shrink. , , , and . The monomers’ lengths are and . The period length is then . The tilted angle is approximately 18 degrees (). Herein we use a simplified transmission model like the one developed in [31]. Figure 3 shows the transmission line where and are the impedances and admittances of one tubulin dimer unit. Such a transmission line can be simplified like the one shown in Figure 4, where we observe a unit cell consisting of the alpha-MT unit (effective impedance Z0α) and beta-MT unit (effective impedance Z0β). We can repeat this unit infinitely. The expressions for and are as follows:
We can then identify: , and , .
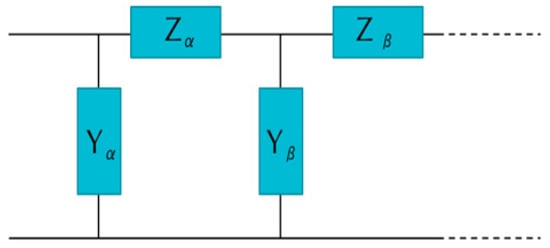
Figure 3.
Transmission model.

Figure 4.
The equivalent transmission model used in the analysis.
We can, thus, define the equivalent refractive indices for each monomer as , where is a reference impedance and sub-index i means the i-th layer ( or ). The transmission line propagation constant is given by , where shows the angular frequency, equals the alpha- or beta units’ length, is the propagation velocity of ions. In physiological conditions like an action potential propagation, the velocity of electric fields regulating the vertical transmission of ions lies between 0.1–10 m/s [33]. Note that ions or electrons move with negligible drift velocity (0.001–0.00001 m/s) when current flows even in metals; hence, we should not confuse field flow with the ionic transmission. Herein, we obtained better results when m/s. To take into account the tilted angle , we use Snell’s law and calculates the angle . The parameter is the surrounding medium refractive index (water). Therefore, the matrices associated with each alpha- or beta units are given as follows:
The transfer matrix in a unit-cell is given as follows:
Now, if we want to simulate an MT with N-units the final matrix should as follows:
We have the following condition involving the ABCD matrix (where A = D in this case due to the symmetry):
where K is the propagation constant also known as the Bloch wave number [34] for the periodic structure and p is the period of the structure. From this equation, we can calculate the band structure as
When K is real, we have the transmission in the line and when K is pure imaginary, the transmission is forbidden. To obtain the transmission line band diagram, we have to calculate matrix Mk(k = 1,2 … N) for each frequency , multiply all the matrices shown in Equation (8) to obtain M, then use the element A to calculate the propagation constant .
Finally, we calculate the electrical transport as
We used the Fourier transform technique for the synthesis of the optical thin film to obtain the best theoretical fit. We followed the method developed in [35], where further details can be found. The final design consisted of 376 layers where each layer length was 4 nm (1504 nm in total). The final multilayer sequence was as follows: 12 layers with refractive index then 36 cavities, the order where, and , finally 4 layers with series, where is added. The lowest refractive index values () represent -tubulin monomers on the contrary , , and constitute -tubulin monomers. The whole structure was embedded in the water .
2.2. Finite Element Analysis
It was possible to perform full-wave finite element simulations (FEMLAB 3.1, COMSOL AB, Burlington, MA, USA) on a shorter MT version (Length of 304 nm). The monomers’ lengths were 4 nm each. The final layer sequence was similar to the one described before. The only difference was that it contained only 6 cavities with the same order . We checked the transmission properties of this shorter MT version and it retained the mean transmission peaks (not shown). The equivalent refractive indices for each monomer were the same as before. A plane wave with an amplitude of excited the MT at an angle of 18 degrees. This value is inferred from the experimental values reported [20] that is 3.5 V/100 microns. In Figure 5 we observe the simulated MT structure.

Figure 5.
Finite element simulated microtubule (MT) structure. Black layers represent -tubulin monomers (), white, red, and brown layers are -tubulin monomers with , , and respectively.
The mesh was created with isosceles triangles with a base averaged length of 0.5 nm and height of 0.25 nm and 10−6 was the numerical tolerance. The simulation results are the normal component of the electric field and in-plane magnetic field components. We used TE polarization configuration to solve the Helmholtz equation given as
where —the angular frequency; n—the refractive index and the propagation velocity of ions, which has a value of 2.65 m/s.
The electric field is oriented in the z direction (perpendicular to monomers’ layers). All external boundaries fulfilled a matched boundary condition given by , where is the water wave number and is a unitary vector normal to external boundaries. This boundary condition permits the inclusion of water as a surrounding medium ().
The transverse field components act as current and voltage on a transmission line model and are known as transverse equivalent networks [36]. The correspondence relationship can be understood as (i = TM or TE):
The unit vectors are chosen that , where is a unit vector in the propagation direction, is a unit vector perpendicular to propagation direction and is a unit vector perpendicular to the propagation plane. The function is known as the transverse wave function. For instance, in the case of plane waves traveling in the direction, it is written as . Therefore, magnetic field modes should provide insights into the current distributions along the MTs. The simulated magnetic modes are given by the normalized summation of the real part of both magnetic field components parallel to multilayers. That is .
3. Discussion
We detected experimentally the microtubule’s electrical transport properties and following various protocols we measured the transmission spectra across the single microtubule. For over a decade we have published a series of experimental measurements where transmissions of various carriers have been measured using quantum tunneling [21,22,29,31]. Figure 6a shows MT’s electrical transport bands for a spectral bandwidth spanning from 10 KHz to 250 MHz. The MT length was 1500 nm. We simulated the power and transport band of MT as shown in Figure 6a from the electrical parameters obtained from the model created. Such a model consists of 376 layers, where each layer has the length (Figure 6b). The model fits very well the experimental transmission spectra. Only peak values of the order of 20% at normalized frequencies bigger than 1 are not present in the theoretical model. Nevertheless, we do not know if the experimental peaks in that region are meaningful or just noise. The electrical impedance has only one value of calculated with the help of Equation (2). The other electrical impedances were calculated from the effective refractive indices using the ratio between them. That is, since we know the value of the ratios , , and and, by definition, they are equal to , , and , respectively. Thus, , , and . These values are obtained when the parameter equals , , and respectively.
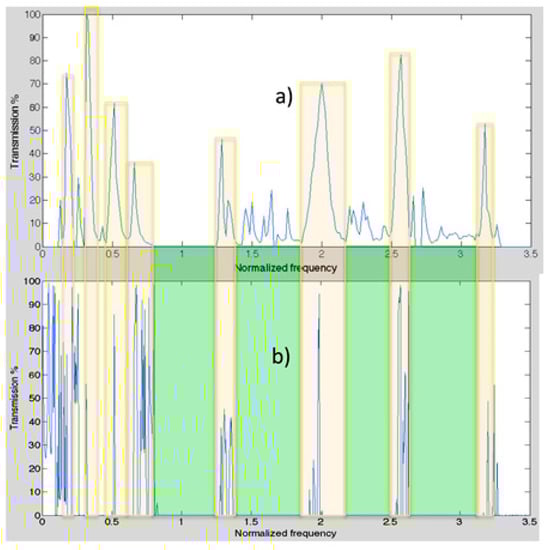
Figure 6.
Comparison of experimental (a) and theoretical (b) electrical transport bands.
The built model has two open parameters as the length of beta-TT and the propagation velocity of ions. We found the finest value of beta-TT length are 0.09 nm, 0.47 nm, and 1.28 nm and 2.65 m/s for the propagation velocity. Although, the model is simple and could speculate the whole electrical band structure (see Figure 6). These results highlight the fact that molecular configurational outcomes are significant in microtubules because these outcomes could modulate energy transportation. Indeed, simply changing β-TTs’ lengths drastically modifies the electrical impedances to create the electrical band structure.
Other results that support the idea of standing wave formation are presented in [21,37] where scanning tunneling images (STM) of a single microtubule were presented. After an AC signal is pumped over the microtubule at a particular frequency, the STM images of the induced current were recorded. From the images, one can clearly observe different ion current configurations that might be thought of as ion current modes similar to electromagnetic modes in a photonic crystal. Along the same lines, the appearance of these ion current modes only happens when water is presented. That is if the water is out of the MT core, the STM images cannot be taken, and the MT disintegrates as the researchers scan it. This also reinforces the idea that water is necessary to create ion waves that later could form standing waves within the MT. From the finite element analysis (Figure 7) we can observe that simulation describes fairly well the experimental current distribution for different applied AC voltage frequencies up to 113 MHz (Figure 7a–c). Nonetheless, for the frequency of 185 MHz the experimental pattern is replicated only in two layers (shown by asterisks).
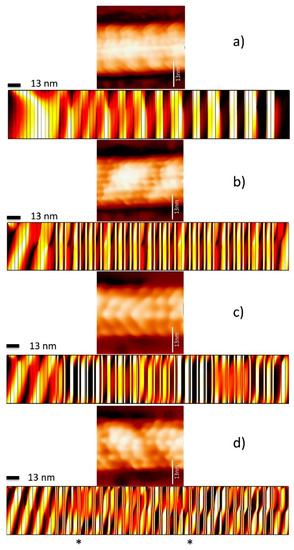
Figure 7.
Finite element simulations of compared with experimental current distribution measurements at different frequencies [37]. (a) 30 MHz, (b) 101 MHz, (c) 113MHz, and (d) 185 MHz. The simulation shows similar patterns as the experimental current distributions for frequencies up to 113 MHz. Nonetheless, for the frequency of 185 MHz the experimental pattern is replicated only in two layers (shown by asterisks). Microtubule’s STM images are taken while pumping materials using a GHz antenna. We have described the experimental details in earlier works [21,22,29,37].
4. Conclusions
From this analysis, we can conclude that MT is a one-dimensional structure with linear translational symmetry, but it would be interesting to use a helicoidal symmetry to make our results more realistic. Another important restriction of our model is that capacitance and inductance effects were not taken into account, which is equivalent to neglect energy emission or absorption by MT’s dimers. These effects can modulate electrical transmission peaks’ amplitudes and bandwidths. In future work, the model can be improved by taking into account both aspects.
5. Materials and Methods
5.1. Microtubules Preparation
In the experiment, porcine brain neuron-derived microtubules were used. The microtubules were reorganized in our laboratory and we purchased tubulin proteins with all associated tools from Cytoskeleton Inc. (Denver, CO, USA). The −80 °C temperature freezer was used to preserve tubulin protein. To polymerize tubulin into a microtubule of 6.5 μm length, a 160 μL microtubule cushion buffer is mixed with 10 μL of 100 Mm GTP solution and 830 μL general tubulin buffer. Such a solution is placed in an ice bath for 10 min. 200 μL solution of the mixture was added to 1mg general tubulin solution. We put it in an ice bath again for the same period. After that, such a solution is kept at 35–37 °C for 40 min. To achieve stabilization of the microtubule, paclitaxel is decomposed into anhydrous DMSO and mixed with the solution. The entire mixture is again kept at 37 °C for 10 min. The length of the microtubule varied 4–20 μm. The composition of the microtubule cushion buffer and general tubulin buffer solutions are given as 1 mM MgCl2, 60% v/v glycerol, 1 mm EGTA, 80 mm PIPES pH 6.8 and 2 mM MgCl2, 80 mM PIPES pH 7, 1 mM EGTA, respectively.
To prepare the film, the prepared solution is diluted several times in a paclitaxel DMSO solution and microtubule cushion buffer, after which, it is dropped onto a Si substrate, and interconnected electrodes are placed in an ice bath (−20 °C) for the entire night. For the proper alignment of the microtubule, an electric field is applied to the Si substrate. A filter paper is used to remove the accesses solution of microtubules on the substrate which is the appropriate method of study of AFM and STM. The Si substrate is then dissolved in tubulin solution and N2 is dried in the same manner [21].
The reformation of α and β tubulin into αβ heterodimer has the dimensions 46 × 80 × 65 Å as confirmed via UHV-STM and AFM [21,22,29,37]. The solution containing the microtubule is dropped on the pre-grown electrodes and then the chip is cleaned from large ion deposits by dielectrophoresis. The dielectric property of the microtubule was measured with the electro-orientation method [19]. The analysis of the dielectric properties of the microtubules reports a large charge density because the reported value is much greater than in an organic semiconductor, but smaller than in a metal, the microtubule cannot be classified as either.
5.2. Protein Preparation
The −80 °C temperature is used in protein preservation. Protein orientation is performed when the protein solution is dropped into a small gap between electrodes under a 4V DC electric field. The nanomolar solution is precipitated on a highly oriented pyrolytic graphite, HOPG substrate. The resonant AC frequencies are used to scan the protein and its formation, otherwise, they go away. The solution of tubulin solution is dropped at the junction of the 4 probe Au electrodes. A constant value of a 0.5 V electric field is reliably kept on each pair of electrodes.
5.3. Electrical Transport Measurements
MT transmittance was measured with a four-probe circuit [21], there are some special frequencies where the microtubule conducts the AC signal with almost no AC resistance (<<<0.04 MΩ) at those frequencies.
The details can be found in [21]. Both spectra were measured between 10 kHz to 20 GHz. It has been suggested that the microtubule resonance frequencies significantly change the lattice geometry of the microtubule. Every single resonance frequency is associated with particular lattice geometry. Using a specially designed scanning tunneling microscope, the cylindrical surface has been imaged live. Several fundamentally different experiments support each other in the finding that the microtubule is an insulator; however, several interesting properties of microtubule emerge as soon as it is triggered by resonance frequencies. Using several versions of the tubulin proteins, it has been demonstrated that electromagnetic resonance has a profound effect, even in their self-assembly.
Author Contributions
Conceptualization, N.S.-C., J.F., J.E.L., A.B. and K.R.; methodology, N.S.-C., J.E.L., A.B. and K.R.; formal analysis, N.S.-C., J.E.L., A.B. and K.R.; investigation, N.S.-C., J.E.L., M.A.P.-O., M.T.-S. and A.B., P.S.; resources, J.F., M.A.P.-O., A.B. and M.T.-S.; writing-original draft preparation, N.S.-C., J.E.L., A.B. and K.R.; writing-review and editing, N.S.-C., M.A.P.-O., J.F., J.E.L., M.T.-S., S.S., P.S., A.B. and K.R.; supervision, J.E.L. and K.R.; project administration, J.E.L., A.B. and K.R. All authors have read and agreed to the published version of the manuscript.
Funding
This research was funded by a Natural Sciences and Engineering Research Council of Canada operating grant, the MagnetoPhotonicsMaterial SEP-PRODEP grant, and the Mexican National Council for Science and Technology (No. CONACYT A1-S-38743).
Institutional Review Board Statement
Not applicable.
Informed Consent Statement
Not applicable.
Data Availability Statement
Not applicable.
Acknowledgments
N.S.-C. wants to thank CONACYT for the scholarship “BecaMixta-Movilidaden el Extranjero”. We would also like to thank the Photonic Systems Group at McGill University for providing software for the simulations.
Conflicts of Interest
The authors declare no conflict of interest.
References
- Byrne, J.H.; Schultz, S.G. Introduction to Membrane Transport and Bioelectricity; Raven Press, University of Delaware: Newark, DE, USA, 1988. [Google Scholar]
- Gilbert, S.F.; Sarkar, S. Embracing complexity: Organicism for the 21st century. Dev. Dyn. 2000, 219, 1–9. [Google Scholar] [CrossRef]
- Lugo, J.E.; Doti, R.; Agarwal, R.; Ray, K.; Faubert, J. Physical Analogies in Biology: From Photons, Phonons, Bloch Waves to Non Linear Oscillators. Adv. Sci. Eng. Med. 2015, 7, 62–75. [Google Scholar] [CrossRef]
- Kittel, C. Crystal Structure. Introduction to Solid State Physics, 8th ed.; John Wiley & Sons: Hoboken, NJ, USA, 2005; pp. 3–6. [Google Scholar]
- Prather, D.W. Photonic Crystals, Theory, Applications and Fabrication; John Wiley & Sons: Hoboken, NJ, USA, 2005. [Google Scholar]
- Hussein, M.I. Reduced Bloch mode expansion for periodic media band structure calculations. In Proceedings of the Royal Society of London A: Mathematical, Physical and Engineering Sciences; The Royal Society: London, UK, 2009; pp. 2825–2848. [Google Scholar]
- Joannopoulos, J.D.; Johnson, S.G.; Winn, J.N.; Meade, R.D. Photonic Crystals Molding the Flow of Light; Princeton University press: Princeton, NJ, USA, 2011. [Google Scholar]
- Vigneron, J.P.; Simonis, P. Natural photonic crystals. Phys. B Condens. Matter 2012, 407, 4032–4036. [Google Scholar] [CrossRef]
- Onslow, H. The Iridescent Colours of Insects. Nature 1920, 106, 181–183. [Google Scholar] [CrossRef][Green Version]
- Zi, J.; Yu, X.; Li, Y.; Hu, X.; Wang, X.; Liu, X.; Fu, R. Coloration strategies in peacock feathers. Proc. Natl. Acad. Sci. USA 2003, 100, 12576–12578. [Google Scholar] [CrossRef]
- Bressloff, P.C.; Cowan, J.D. Thevisualcortexasacrystal. Phys. D Nonlinear Phenom. 2002, 173, 226–258. [Google Scholar] [CrossRef]
- Li, D.; Zhao, J. Exact solitary wave and periodic solitary wave solutions for the shallow water wave equation. Chin. Phys. Lett. 2009, 26, 5–8. [Google Scholar]
- Mozziconacci, J.; Sandblad, L.; Wachsmuth, M.; Brunner, D.; Karsenti, E. Tubulin dimers oligomerize before their incorporation into microtubules. PLoS ONE 2008, 3, e3821. [Google Scholar] [CrossRef]
- Chrétien, D.; Fuller, S.D.; Karsenti, E. Structure of growing microtubule ends:Two-dimensional sheets close in to tubes at variable rates. J. Cell Biol. 1995, 129, 1311–1328. [Google Scholar] [CrossRef]
- Georgiev, D.; Papaioanou, S.; Glazebrook, J. Neuronic system inside neurons: Molecular biology and biophysics of neuronal microtubules. Biomed. Rev. 2004, 15, 67–75. [Google Scholar] [CrossRef][Green Version]
- Luchko, T.; Huzil, J.T.; Stepanova, M.; Tuszynski, J. Conformational analysis of the carboxy-terminaltails of human β-tubulin isotypes. Biophys. J. 2008, 94, 1971–1982. [Google Scholar] [CrossRef]
- Feinerman, O.; Segal, M.; Moses, E. Signal propagation along unidimensional neuronal networks. J. Neurophysiol. 2005, 94, 3406–3416. [Google Scholar] [CrossRef] [PubMed]
- Huang, X.; Troy, W.C.; Yang, Q.; Ma, H.; Laing, C.R.; Schiff, S.J.; Wu, J.-Y. Spiral waves in disinhibited mammalian neocortex. J. Neurosci. 2004, 24, 9897–9902. [Google Scholar] [CrossRef]
- Minoura, I.; Muto, E. Dielectric measurement to find individual microtubules using the electro orientation method. Biophys. J. 2006, 90, 3739–3748. [Google Scholar] [CrossRef] [PubMed]
- Ray, K.; Roy, M.K. A theoretical basis for surges of electroencephalogram activity and vivid mental sensation during neardeath experience. Int. J. Eng. Sci. Technol. 2010, 2, 5484. [Google Scholar]
- Sahu, S.; Ghosh, S.; Ghosh, B.; Aswani, K.; Hirata, K.; Fujita, D.; Bandyopadhyay, A. Atomic water channel controlling remarkable properties of a single brain microtubule:correlating single protein to its supramolecular assembly. Biosens. Bioelectron. 2013, 47, 141–148. [Google Scholar] [CrossRef]
- Sahu, S.; Ghosh, S.; Hirata, K.; Fujita, D. A Bandyopadhyay Multi-level memory-switching properties of a single brain microtubule. Appl. Phys. Lett. 2013, 102, 123701. [Google Scholar] [CrossRef]
- Satarić, M.V.; Ilić, D.I.; Ralević, N.; Tuszynski, J.A. A nonlinear model of ionic wave propagation along microtubules. Eur. Biophys. J. 2009, 38, 637–647. [Google Scholar] [CrossRef]
- Ray, K.; Roy, M.K. A theoretical basis for brain waves with implications for a large scale integration required for cognitiveprocesses. In Proceedings of the 9th IEEE International Conference on Cognitive Informatics, Beijing, China, 7–9 July 2010; pp. 436–440. [Google Scholar]
- Llinás, R. The intrinsic electrophysiological properties of mammalian neurons:insights into central nervous system function. Science 1988, 242, 1654–1664. [Google Scholar] [CrossRef]
- Başar, E. Brain oscillations in neuro psychiatric disease. Dialogues. Clin. Neurosci. 2013, 15, 291–300. [Google Scholar]
- Bódizs, R.; Kis, T.; Lázár, A.S.; Havrán, L.; Rigó, P.; Clemens, Z.; Halász, P. Prediction of general mental ability based on neural oscillation measures of sleep. J. Sleep Res. 2005, 14, 285–292. [Google Scholar] [CrossRef]
- Moran, L.V.; Hong, L.E. High vs low frequency neural oscillations in schizophrenia. Schizophr. Bull. 2011, 37, sbr056. [Google Scholar] [CrossRef]
- Komal, S.; Pushpendra, S.; Pathik, S.; Satyajit, S.; Subrata, G.; Kanad, R.; Daisuke, F. DaisukeFujita and Anirban Bandyopadhyay Fractal, scale free electromagnetic resonance of a single brain extracted microtubule nanowire, a single tubulin protein and a single neuron. Fractal Fract. 2020, 4, 11. [Google Scholar] [CrossRef]
- Pushpendra, S.; Subrata, G.; Pathik, S.; Kanad, R.; Fujita, D.; Bandyopadhyay, A. Reducing the Dimension of a Patch-Clamp to the Smallest Physical Limit Using a Coaxial Atom Probe. Prog. Electromagn. Res. B 2020, 89, 29–44. [Google Scholar] [CrossRef]
- Ray, K.; Agarwal, R.; Cacha, L.A.; Poznanski, R.R. Protein Polarization Induced Bloch Waves in Axonal Fibres. In Proceedings of the 11th International Conference on VibrationProblems, Lisbon, Portugal, 9–12 September 2013. [Google Scholar]
- Wang, K.; Rappel, W.-J.; Levine, H. Cooperativity can reduce stochasticity in intracellular calcium dynamics. Phys. Biol. 2004, 1, 27. [Google Scholar] [CrossRef] [PubMed][Green Version]
- Alberts, B.; Bray, D.; Hopkin, K.; Johnson, A.D.; Lewis, J.; Raff, M. Essential Cell Biology: An Introduction to the Molecular Biology of the Cell; Garland Science Publishing: NewYork, NY, USA, 1998. [Google Scholar]
- Yeh, P. Optical Waves in Layered Media; Wiley-Interscience: Hoboken, NJ, USA, 2005. [Google Scholar]
- Dobrowolski, J.A.; Lowe, D. Optical thin film synthesis program based on the use of Fourier transforms. Appl. Opt. 1978, 17, 3039–3050. [Google Scholar] [CrossRef]
- Jackson, D.R. Plane Wave Propagation and Reflection. In The Electrical Engineering Handbook; Chen, W.-K., Ed.; Elsevier Academic Press: Amsterdam, The Netherlands, 2004; pp. 513–524. [Google Scholar]
- Sahu, S.; Ghosh, S.; Fujita, D.; Bandyopadhyay, A. Live visualizations of single isolated tubulin protein self-assembly via tunneling current: Effect of electromagnetic pumping during spontaneous growth of microtubule. Sci. Rep. 2014, 4, 1–9. [Google Scholar] [CrossRef]
Publisher’s Note: MDPI stays neutral with regard to jurisdictional claims in published maps and institutional affiliations. |
© 2021 by the authors. Licensee MDPI, Basel, Switzerland. This article is an open access article distributed under the terms and conditions of the Creative Commons Attribution (CC BY) license (http://creativecommons.org/licenses/by/4.0/).