
Four Isostructural 3d-4f Mixed Metal Organic Frameworks and Their Magnetic Properties

Abstract
:
1. Introduction
2. Materials and Methods
2.1. Materials
2.2. Instrumental Methods
2.3. Synthesis
3. Results and Discussion
3.1. Synthesis
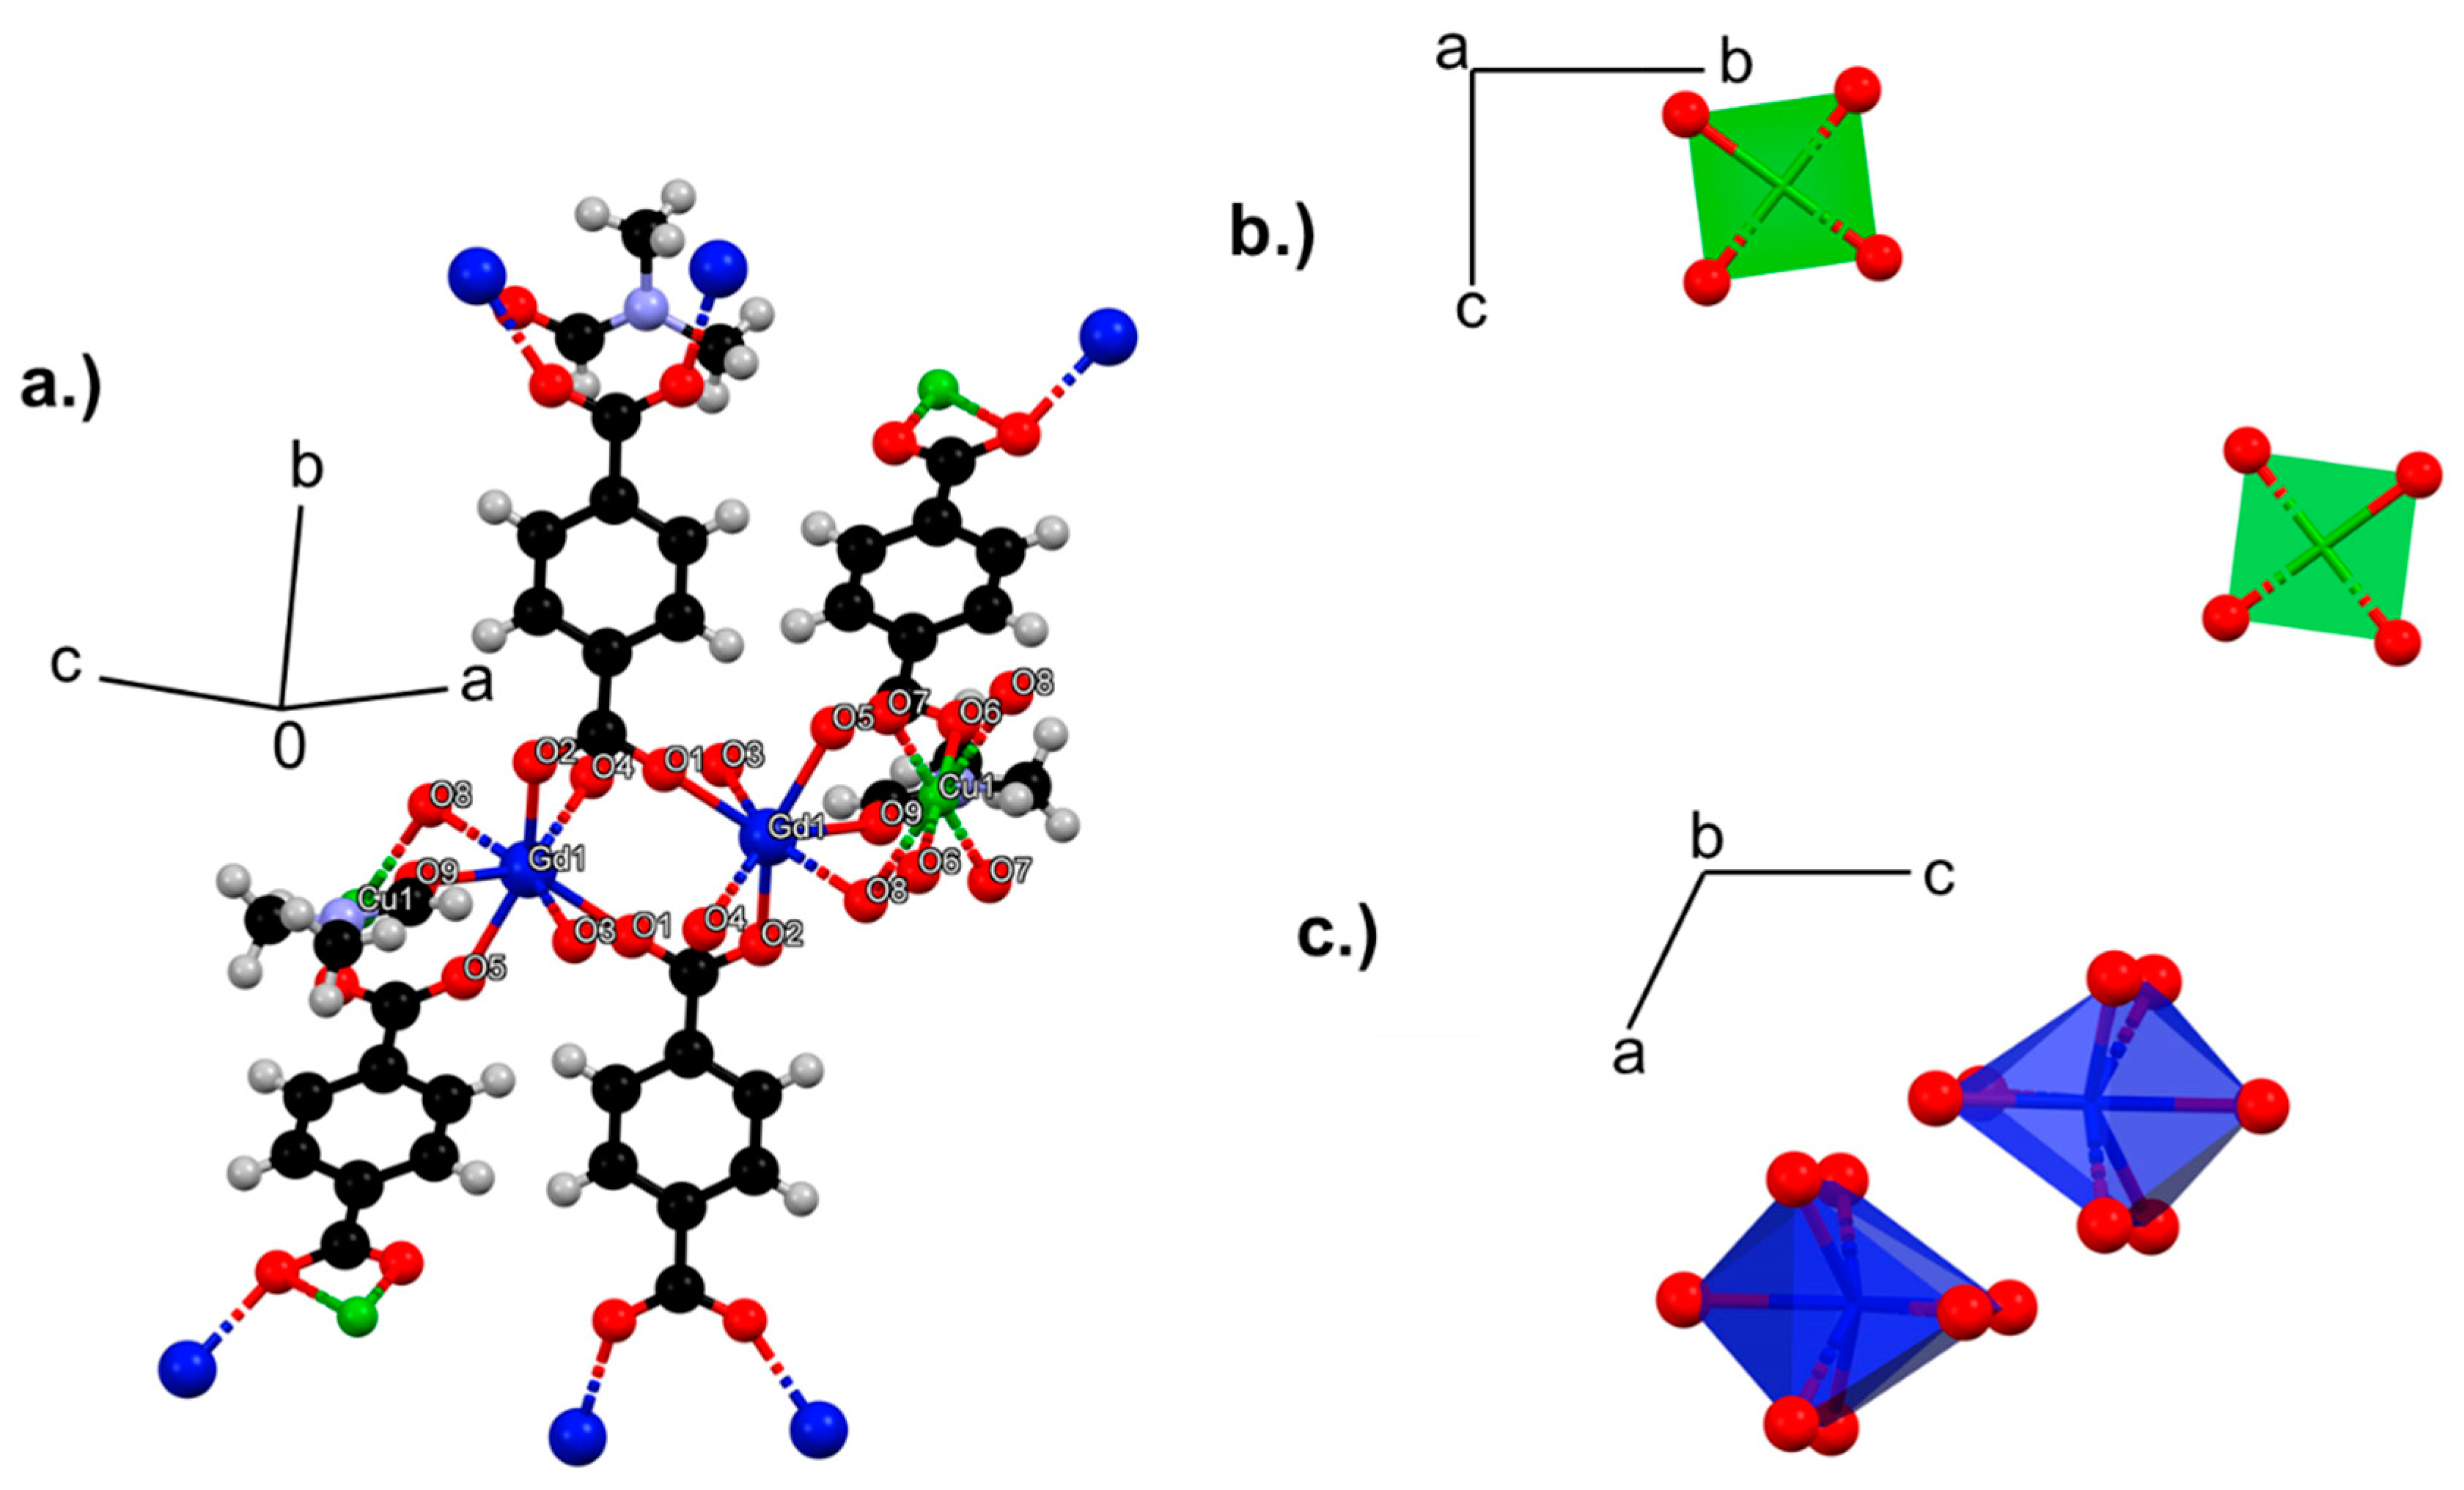
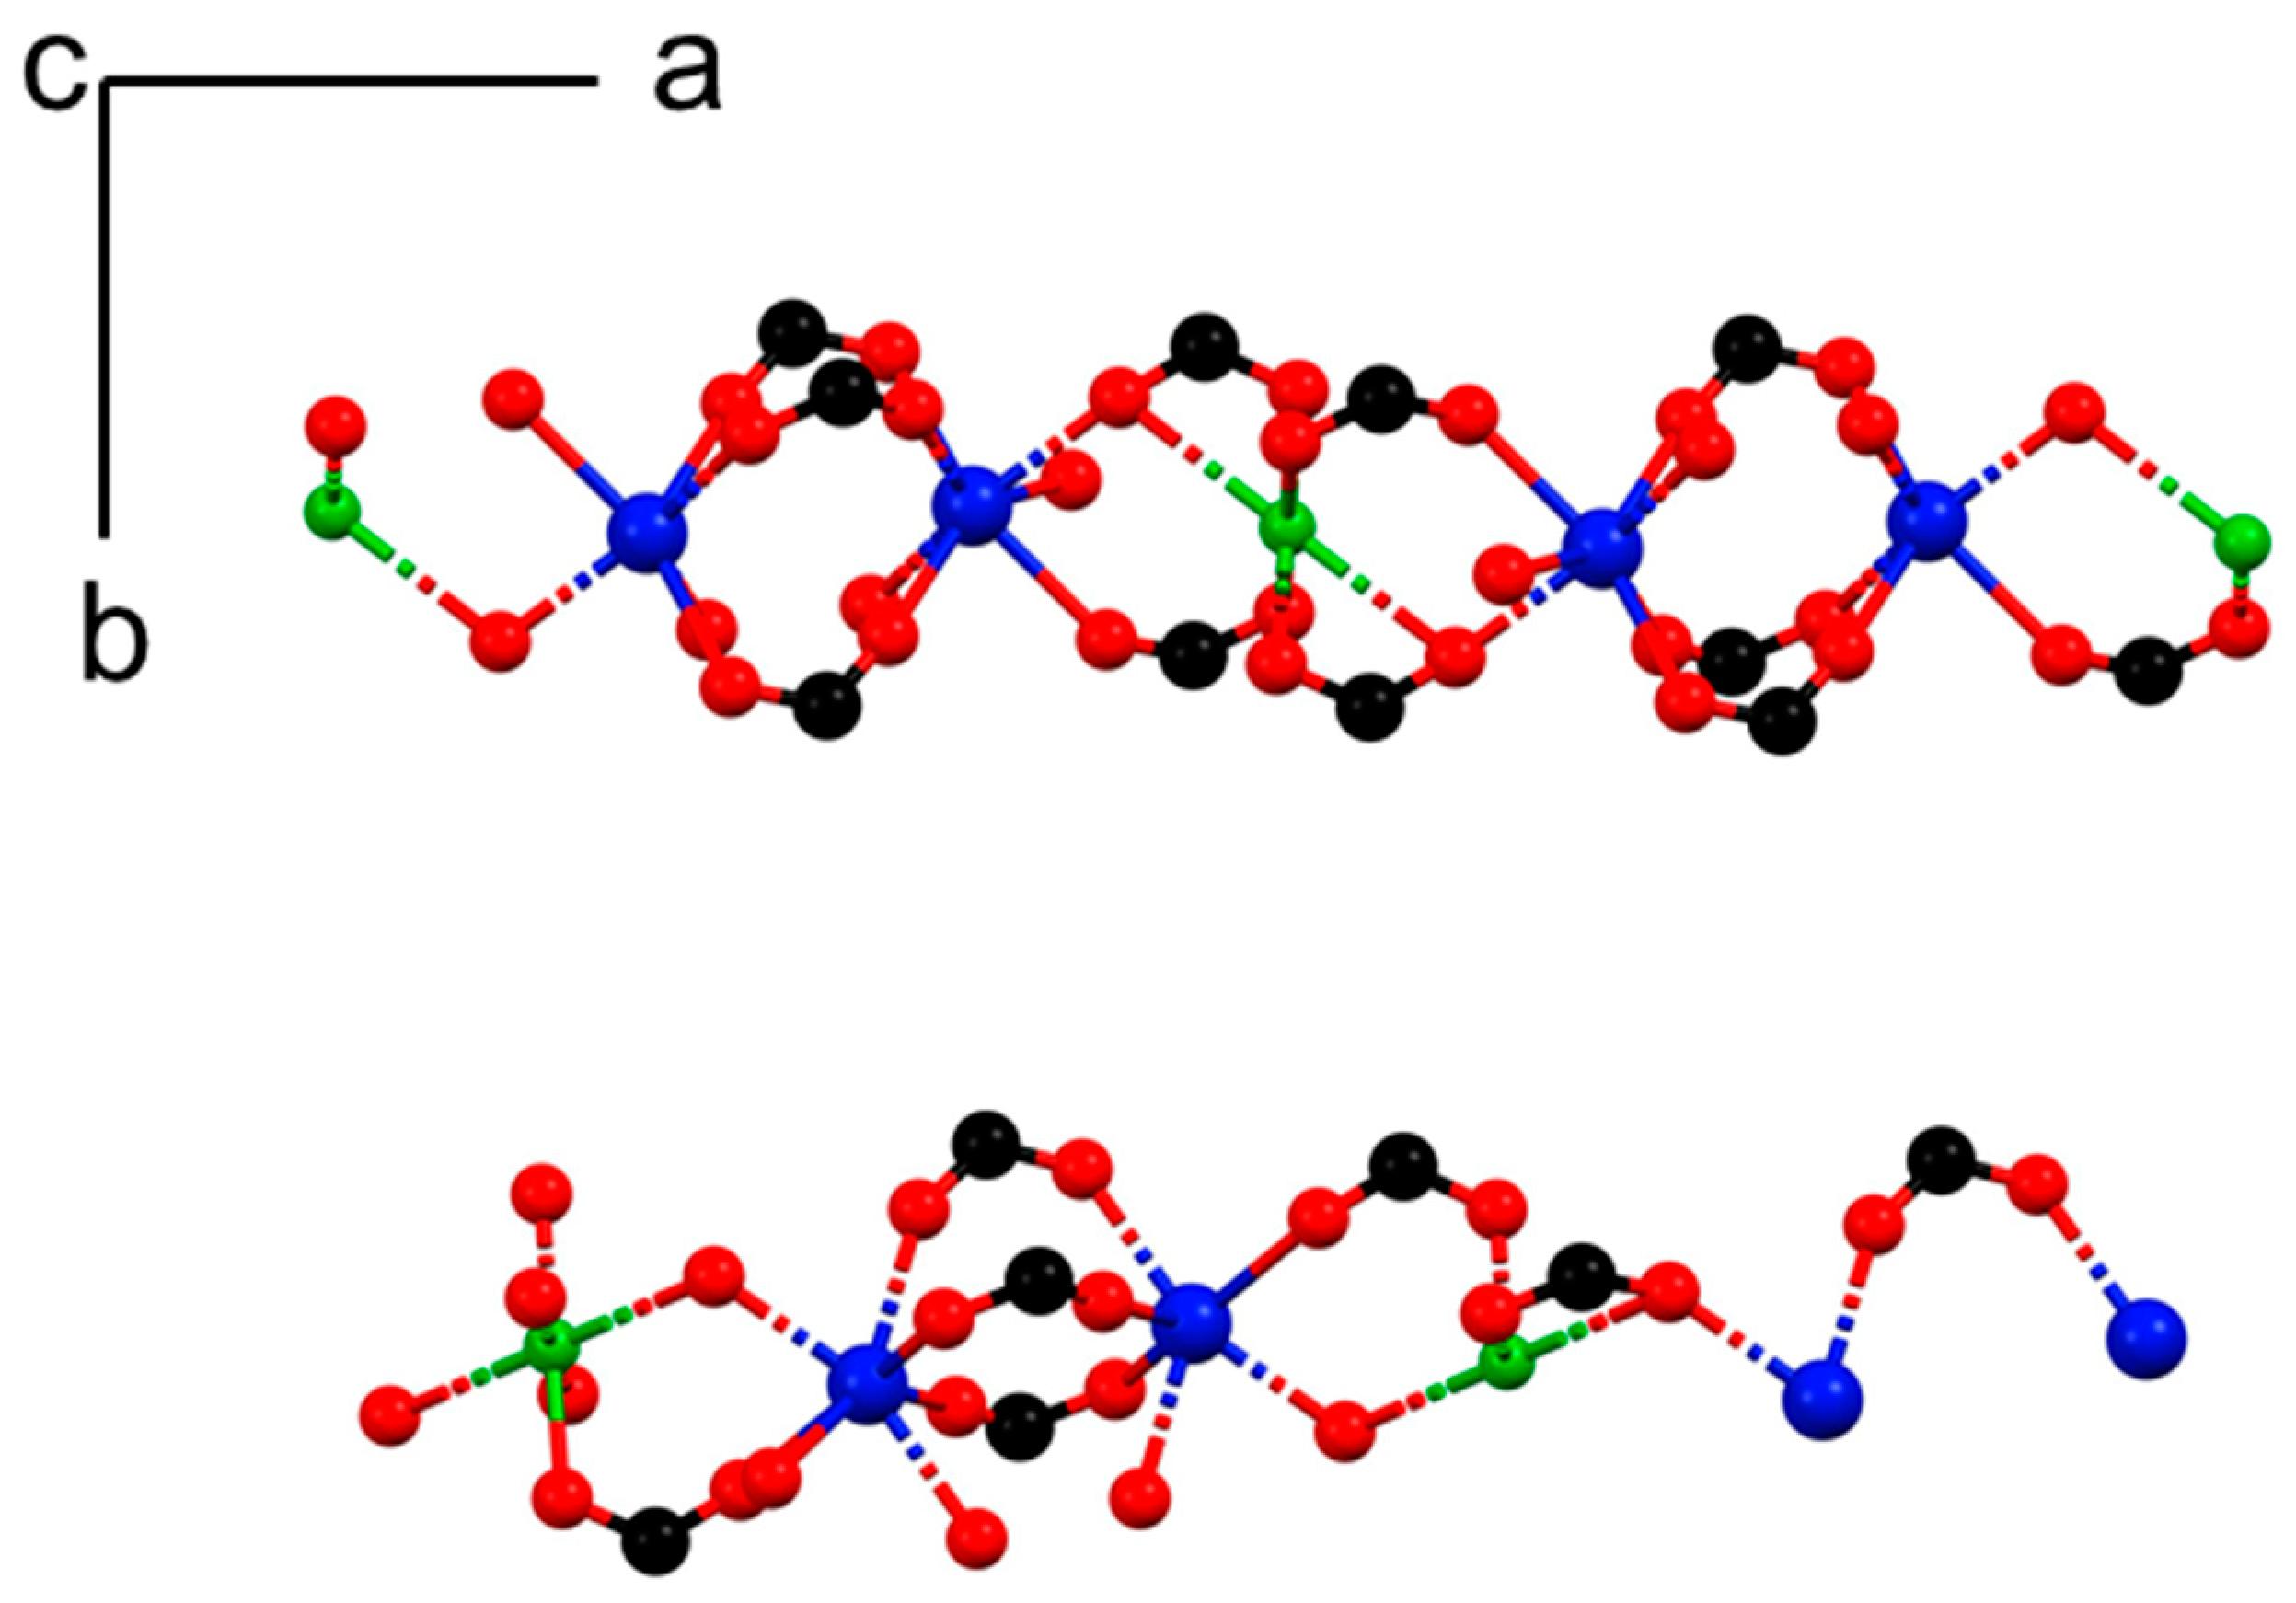
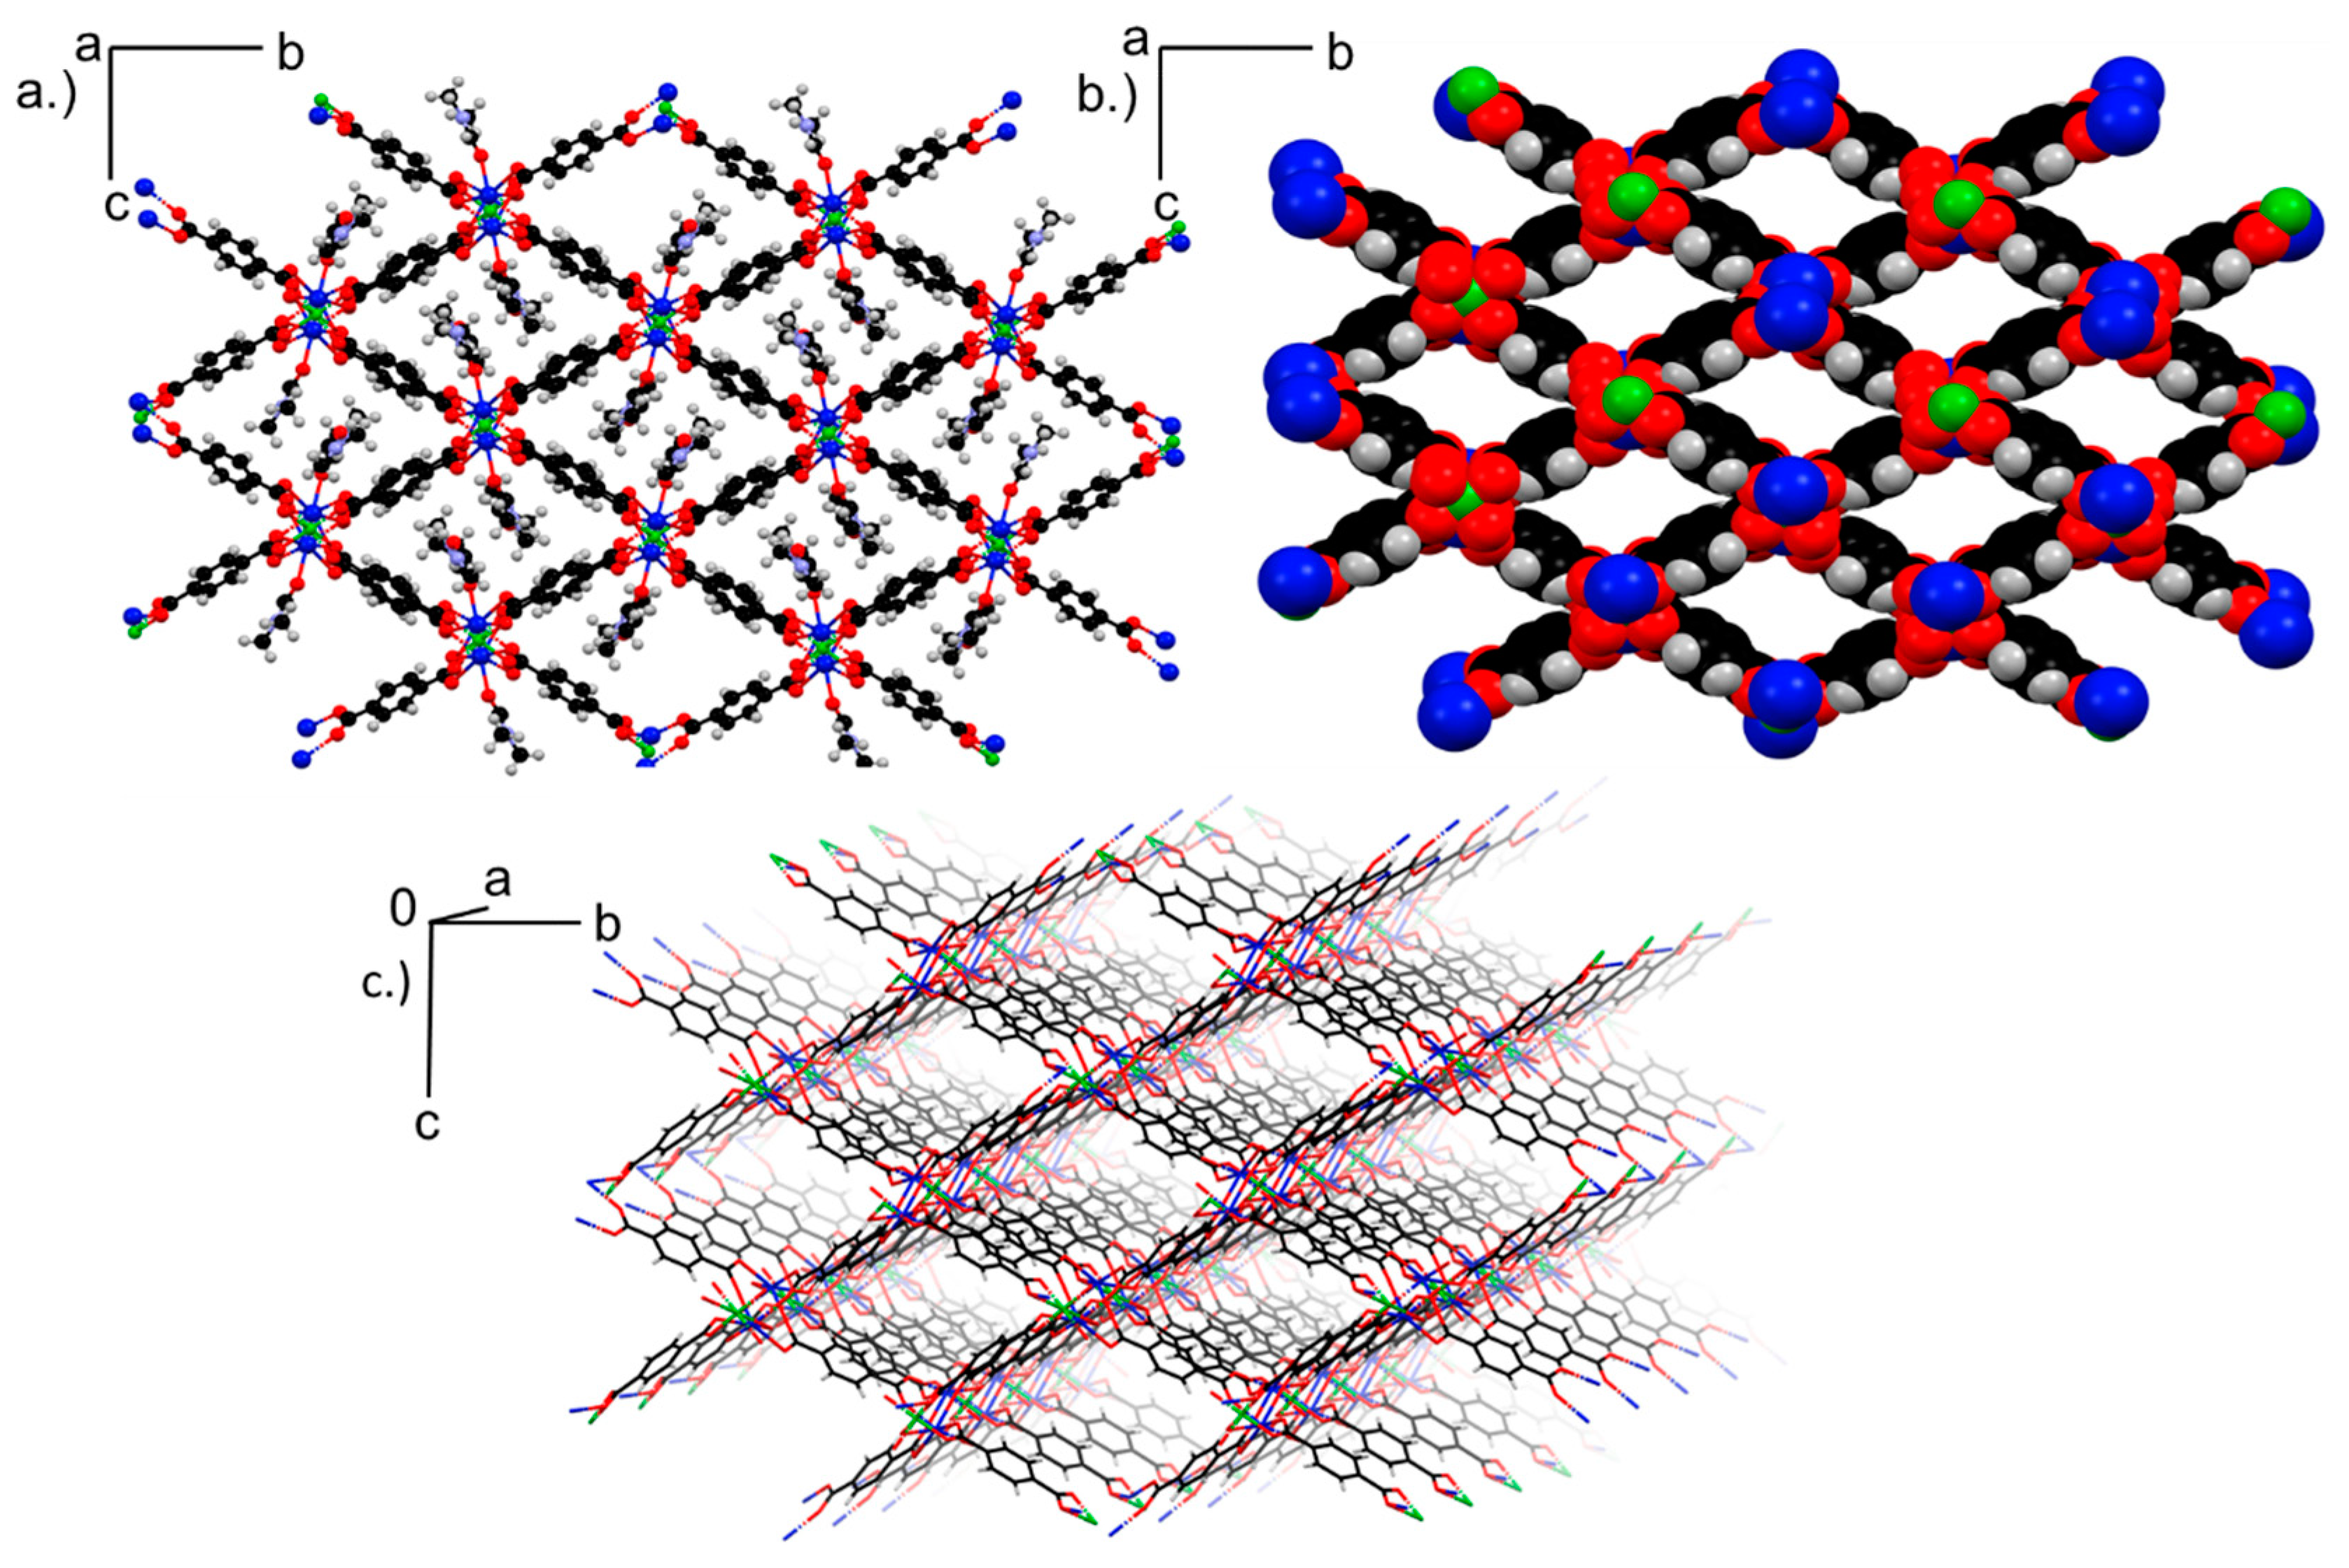
3.2. Single Crystal Analysis
3.2.1. Structural Analysis of 1
3.2.2. Structure Analysis of 2
3.2.3. Structure Analysis of 3
3.2.4. Structure Analysis of 4
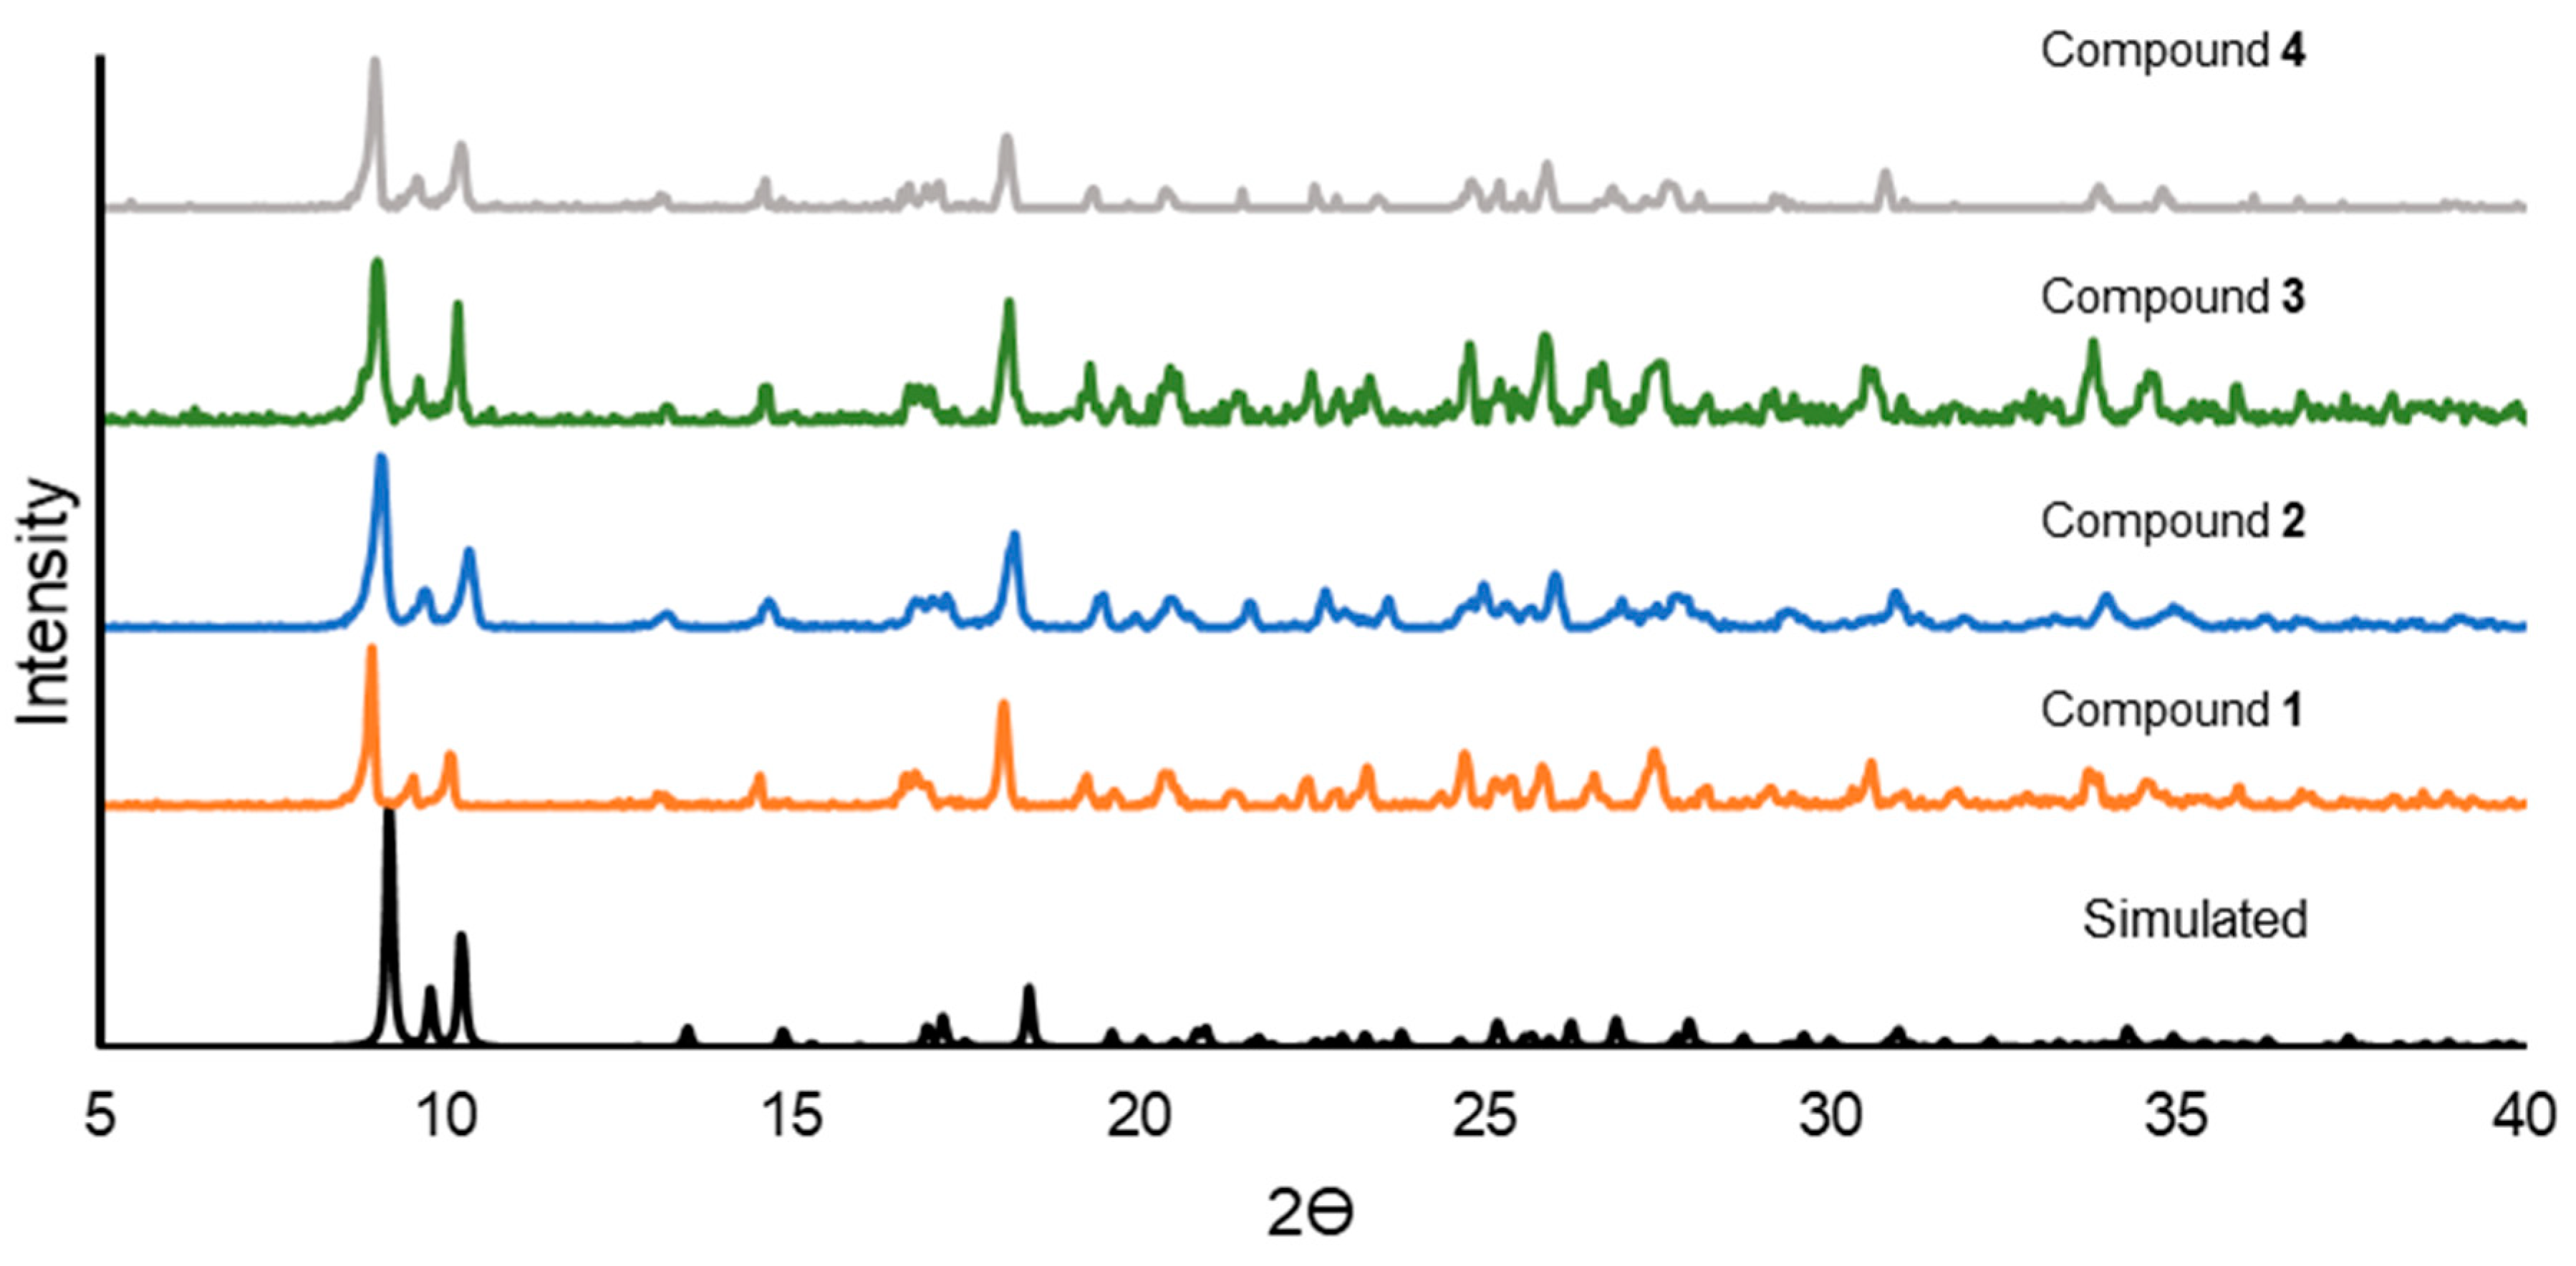
3.3. Powder X-ray Diffraction (PXRD)
3.3.1. PXRD Comparison of 1, 2, 3, and 4
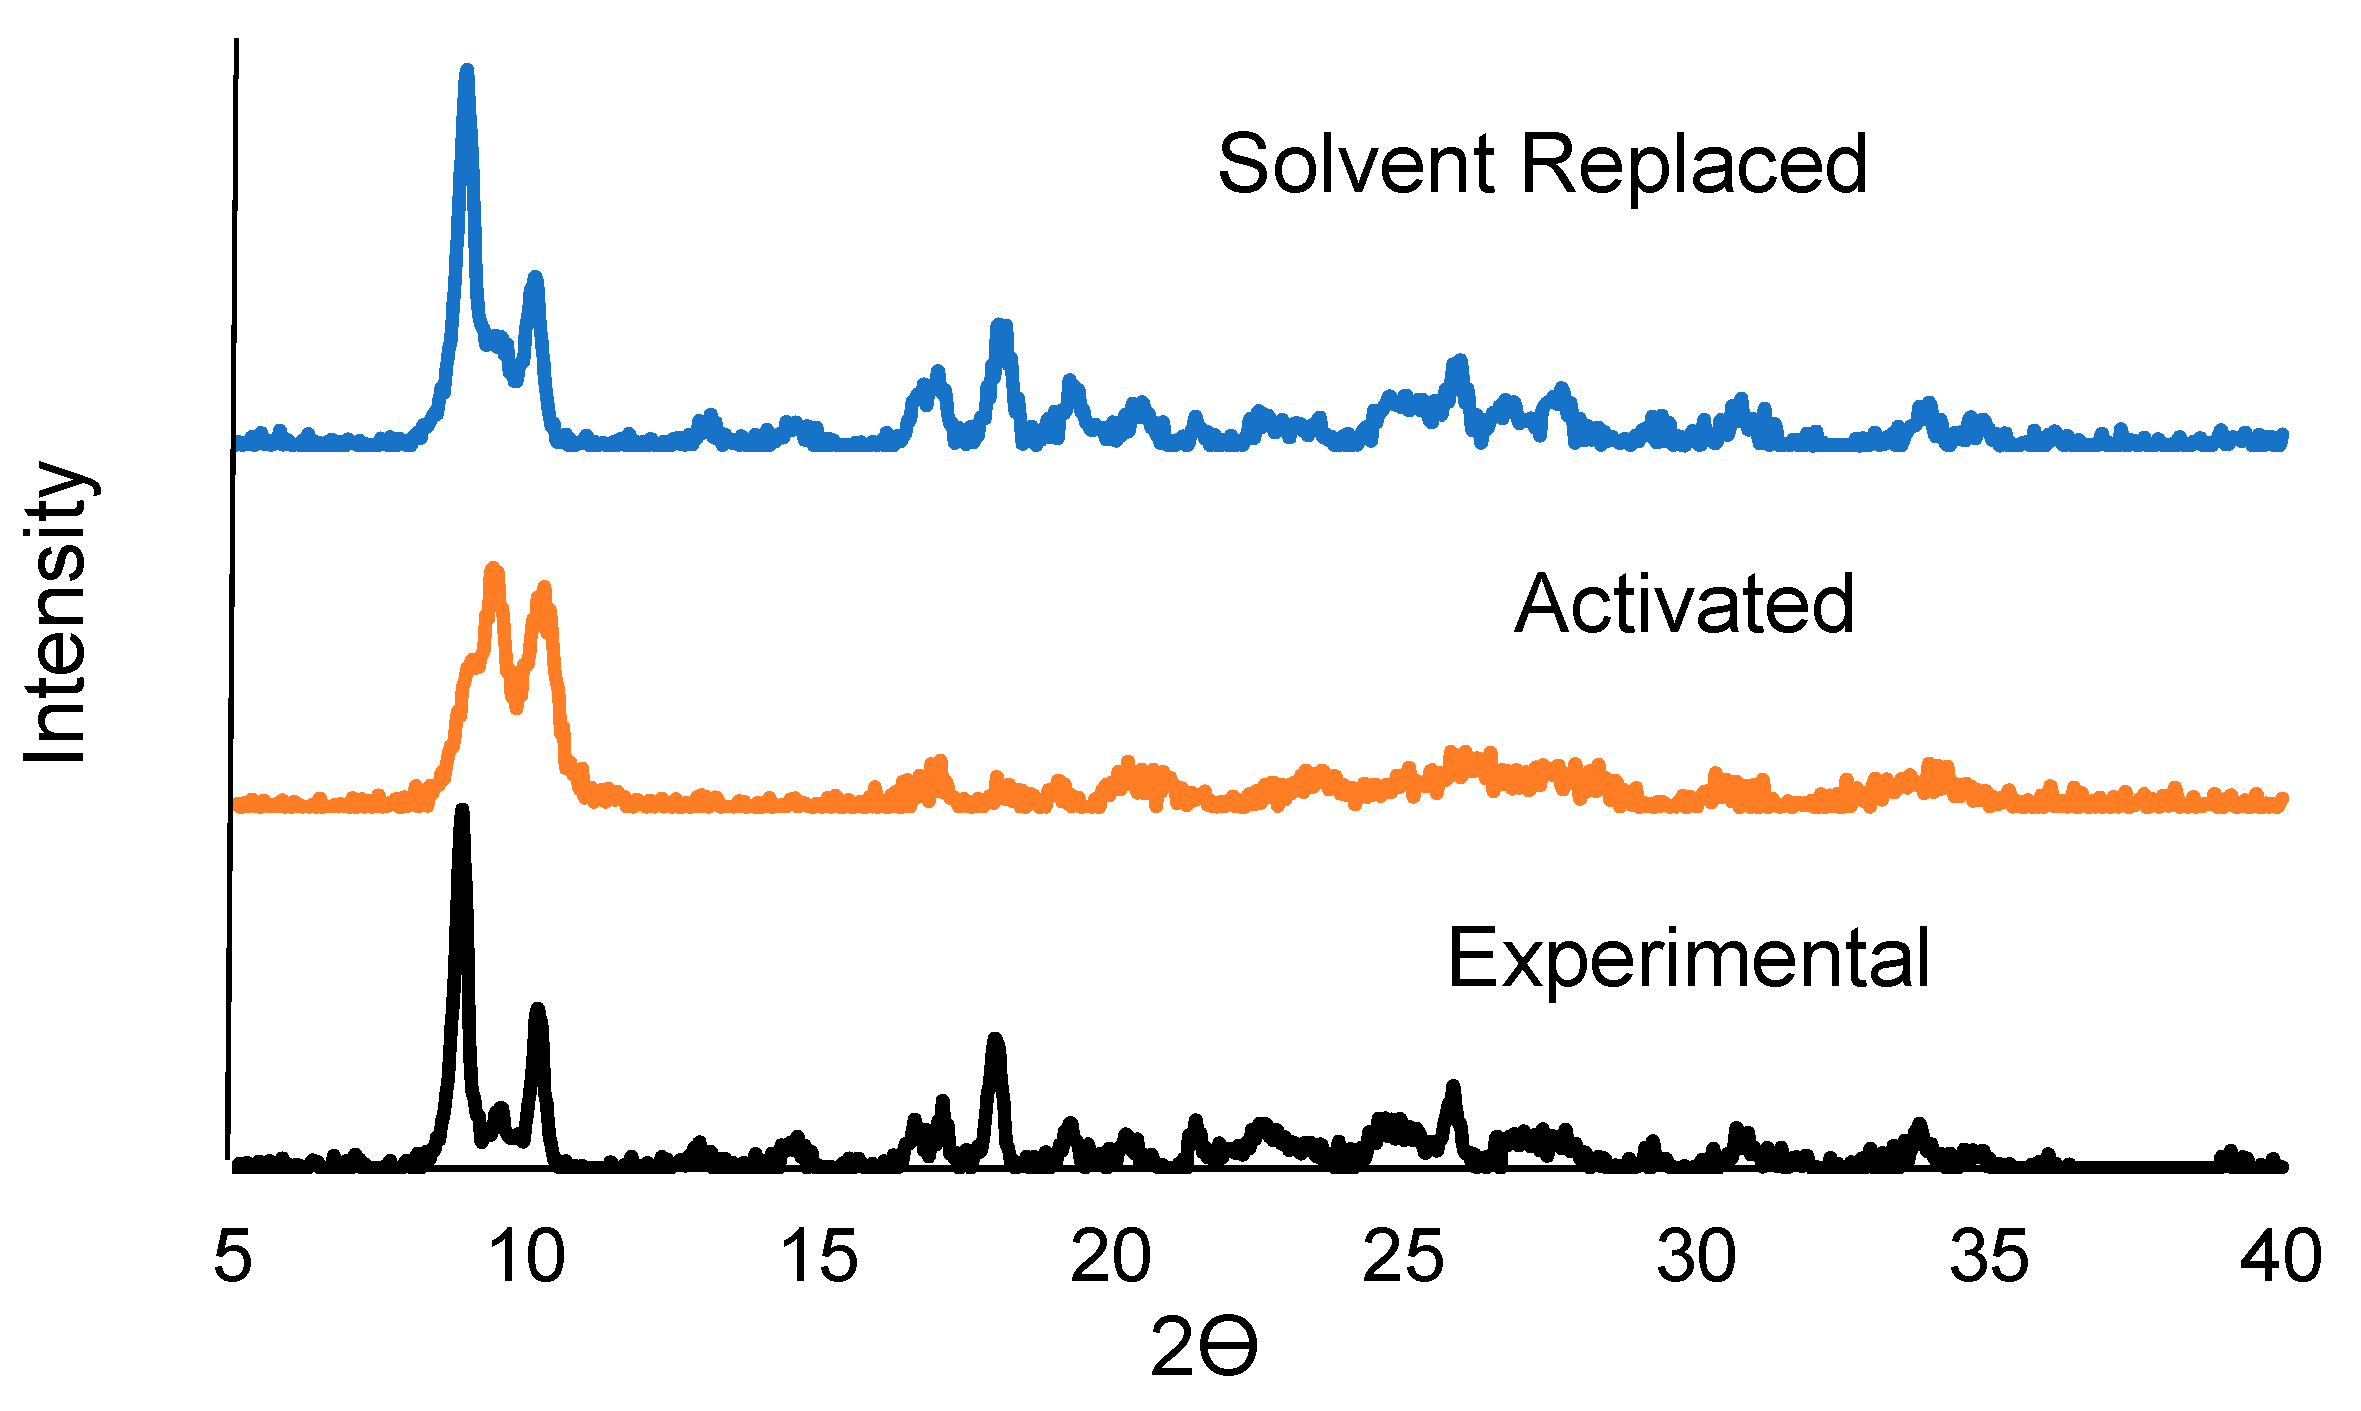
3.3.2. PXRD Comparison of the Solvent Removal and Replacement in 1, 2, 3, and 4
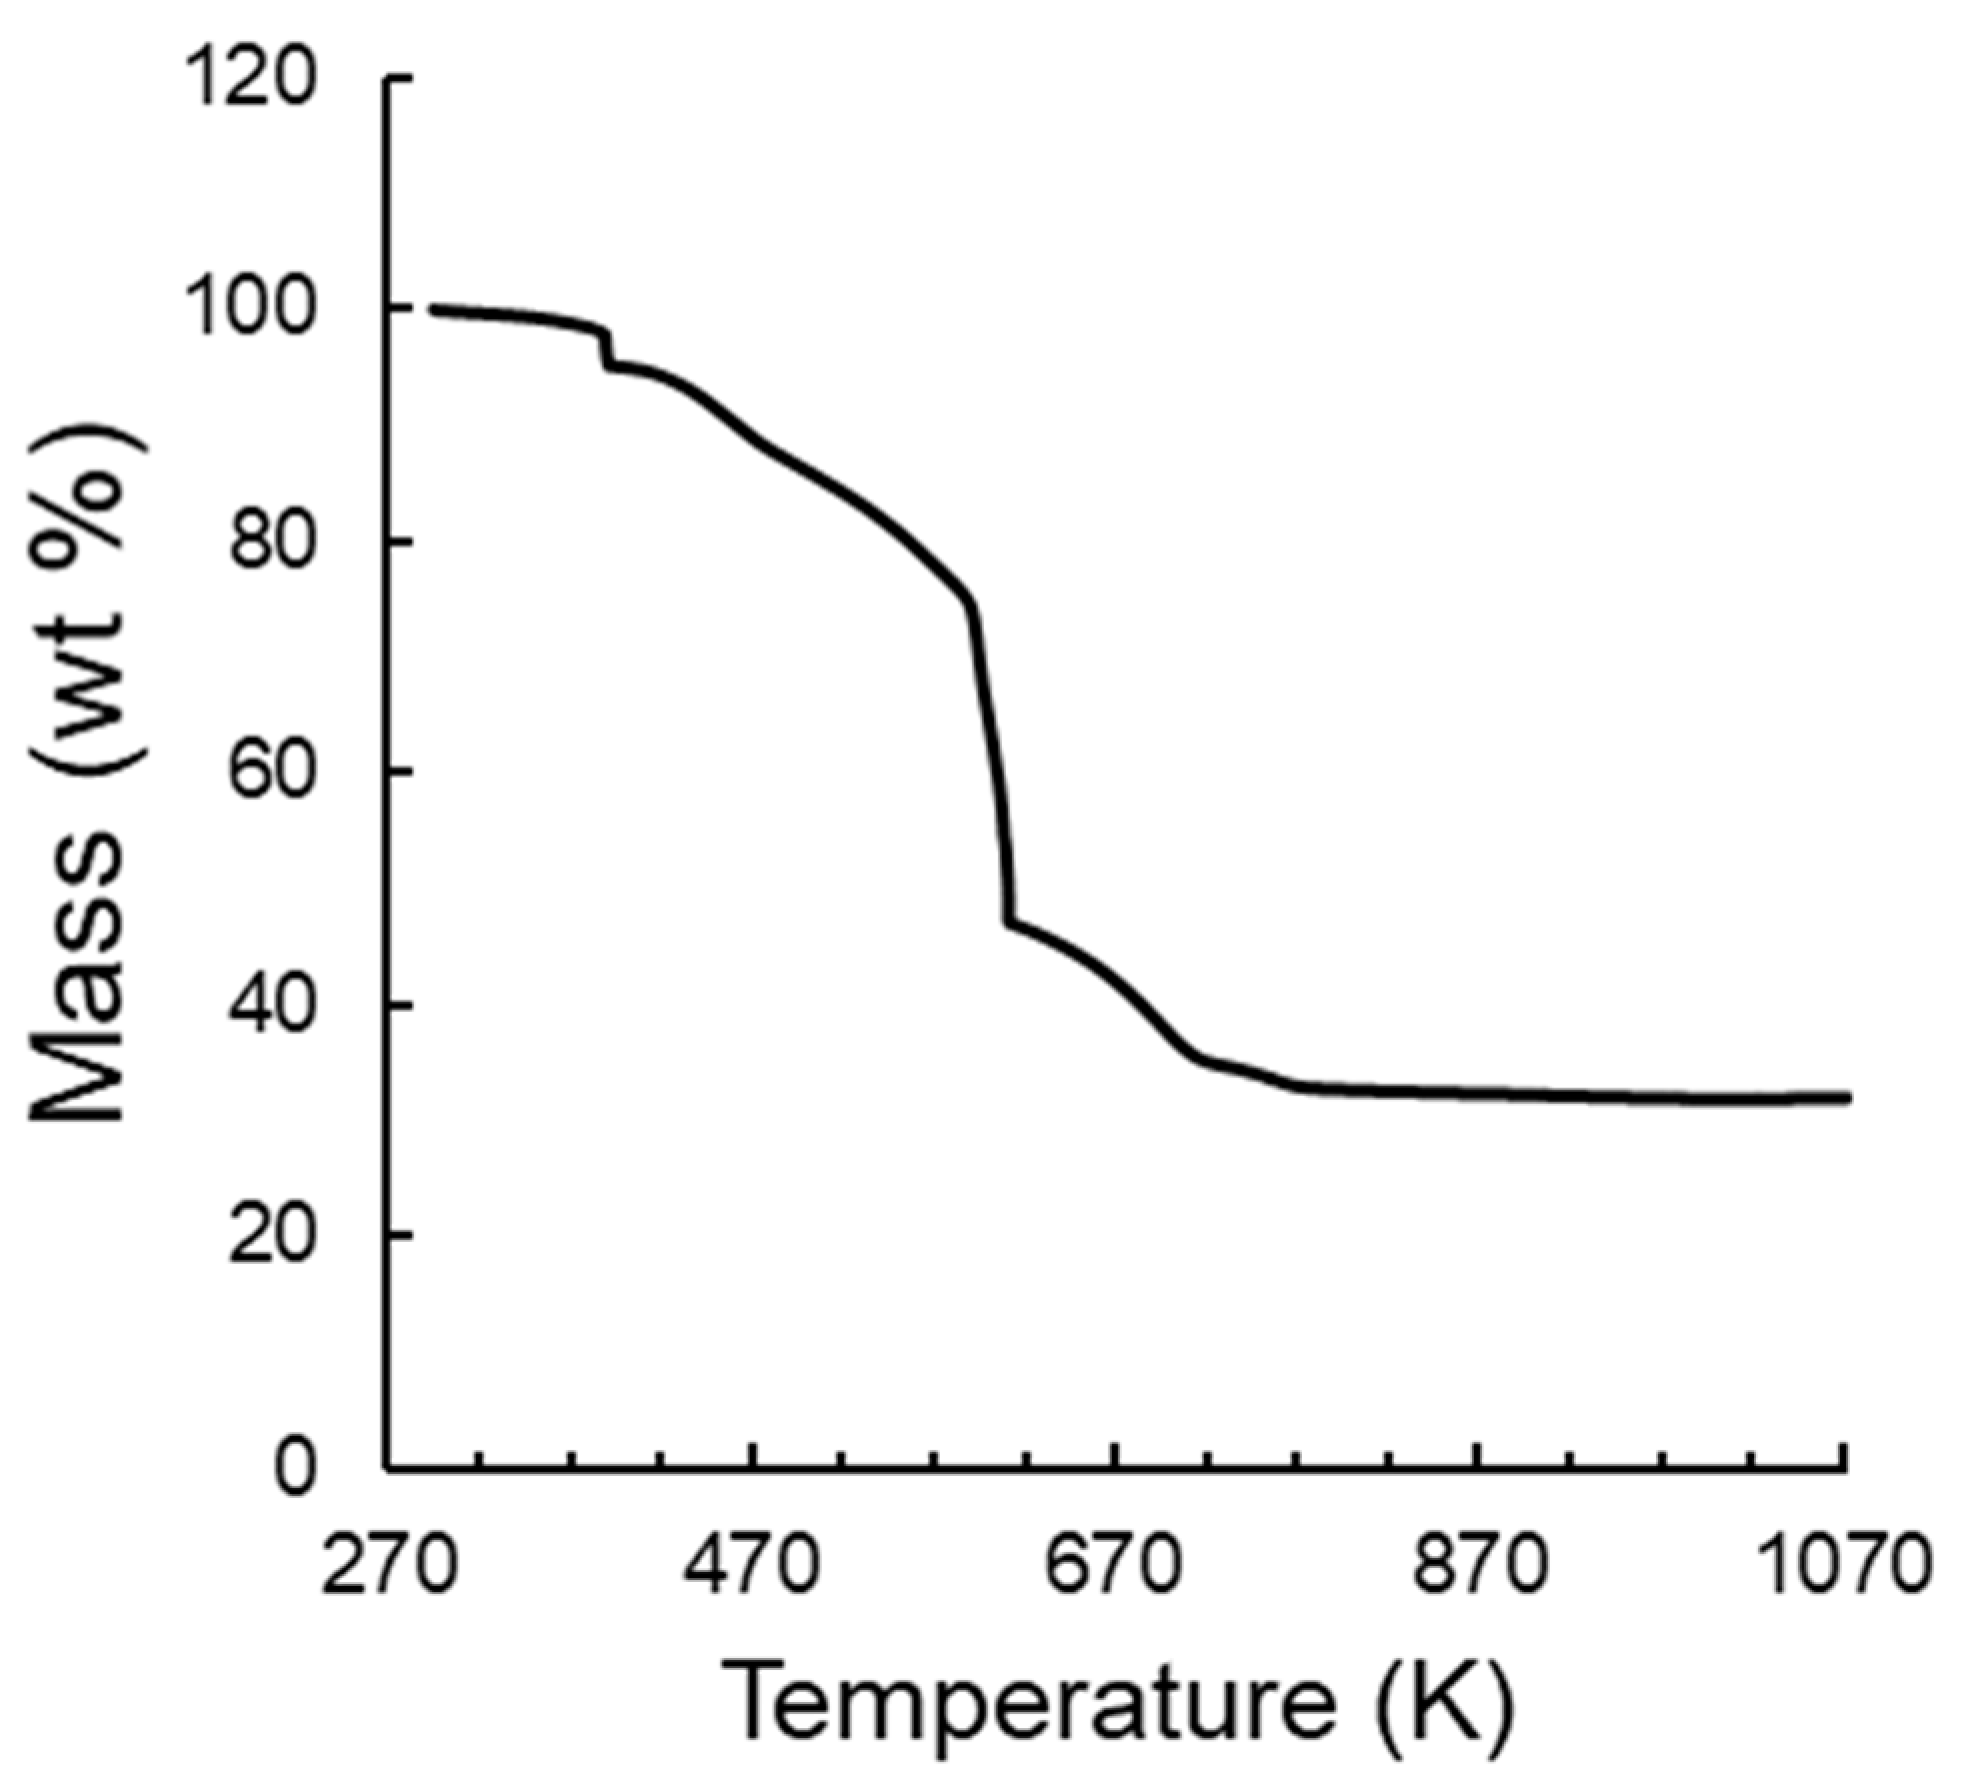
3.4. Thermogravimetric Analysis (TGA)
3.5. Luminescence
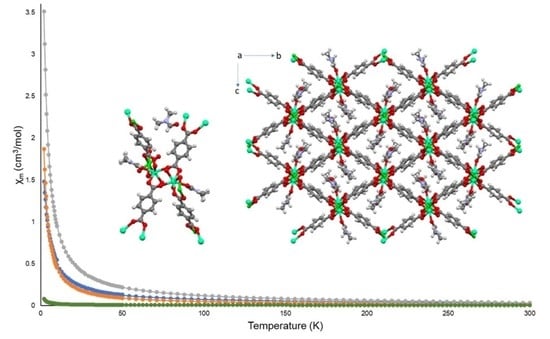
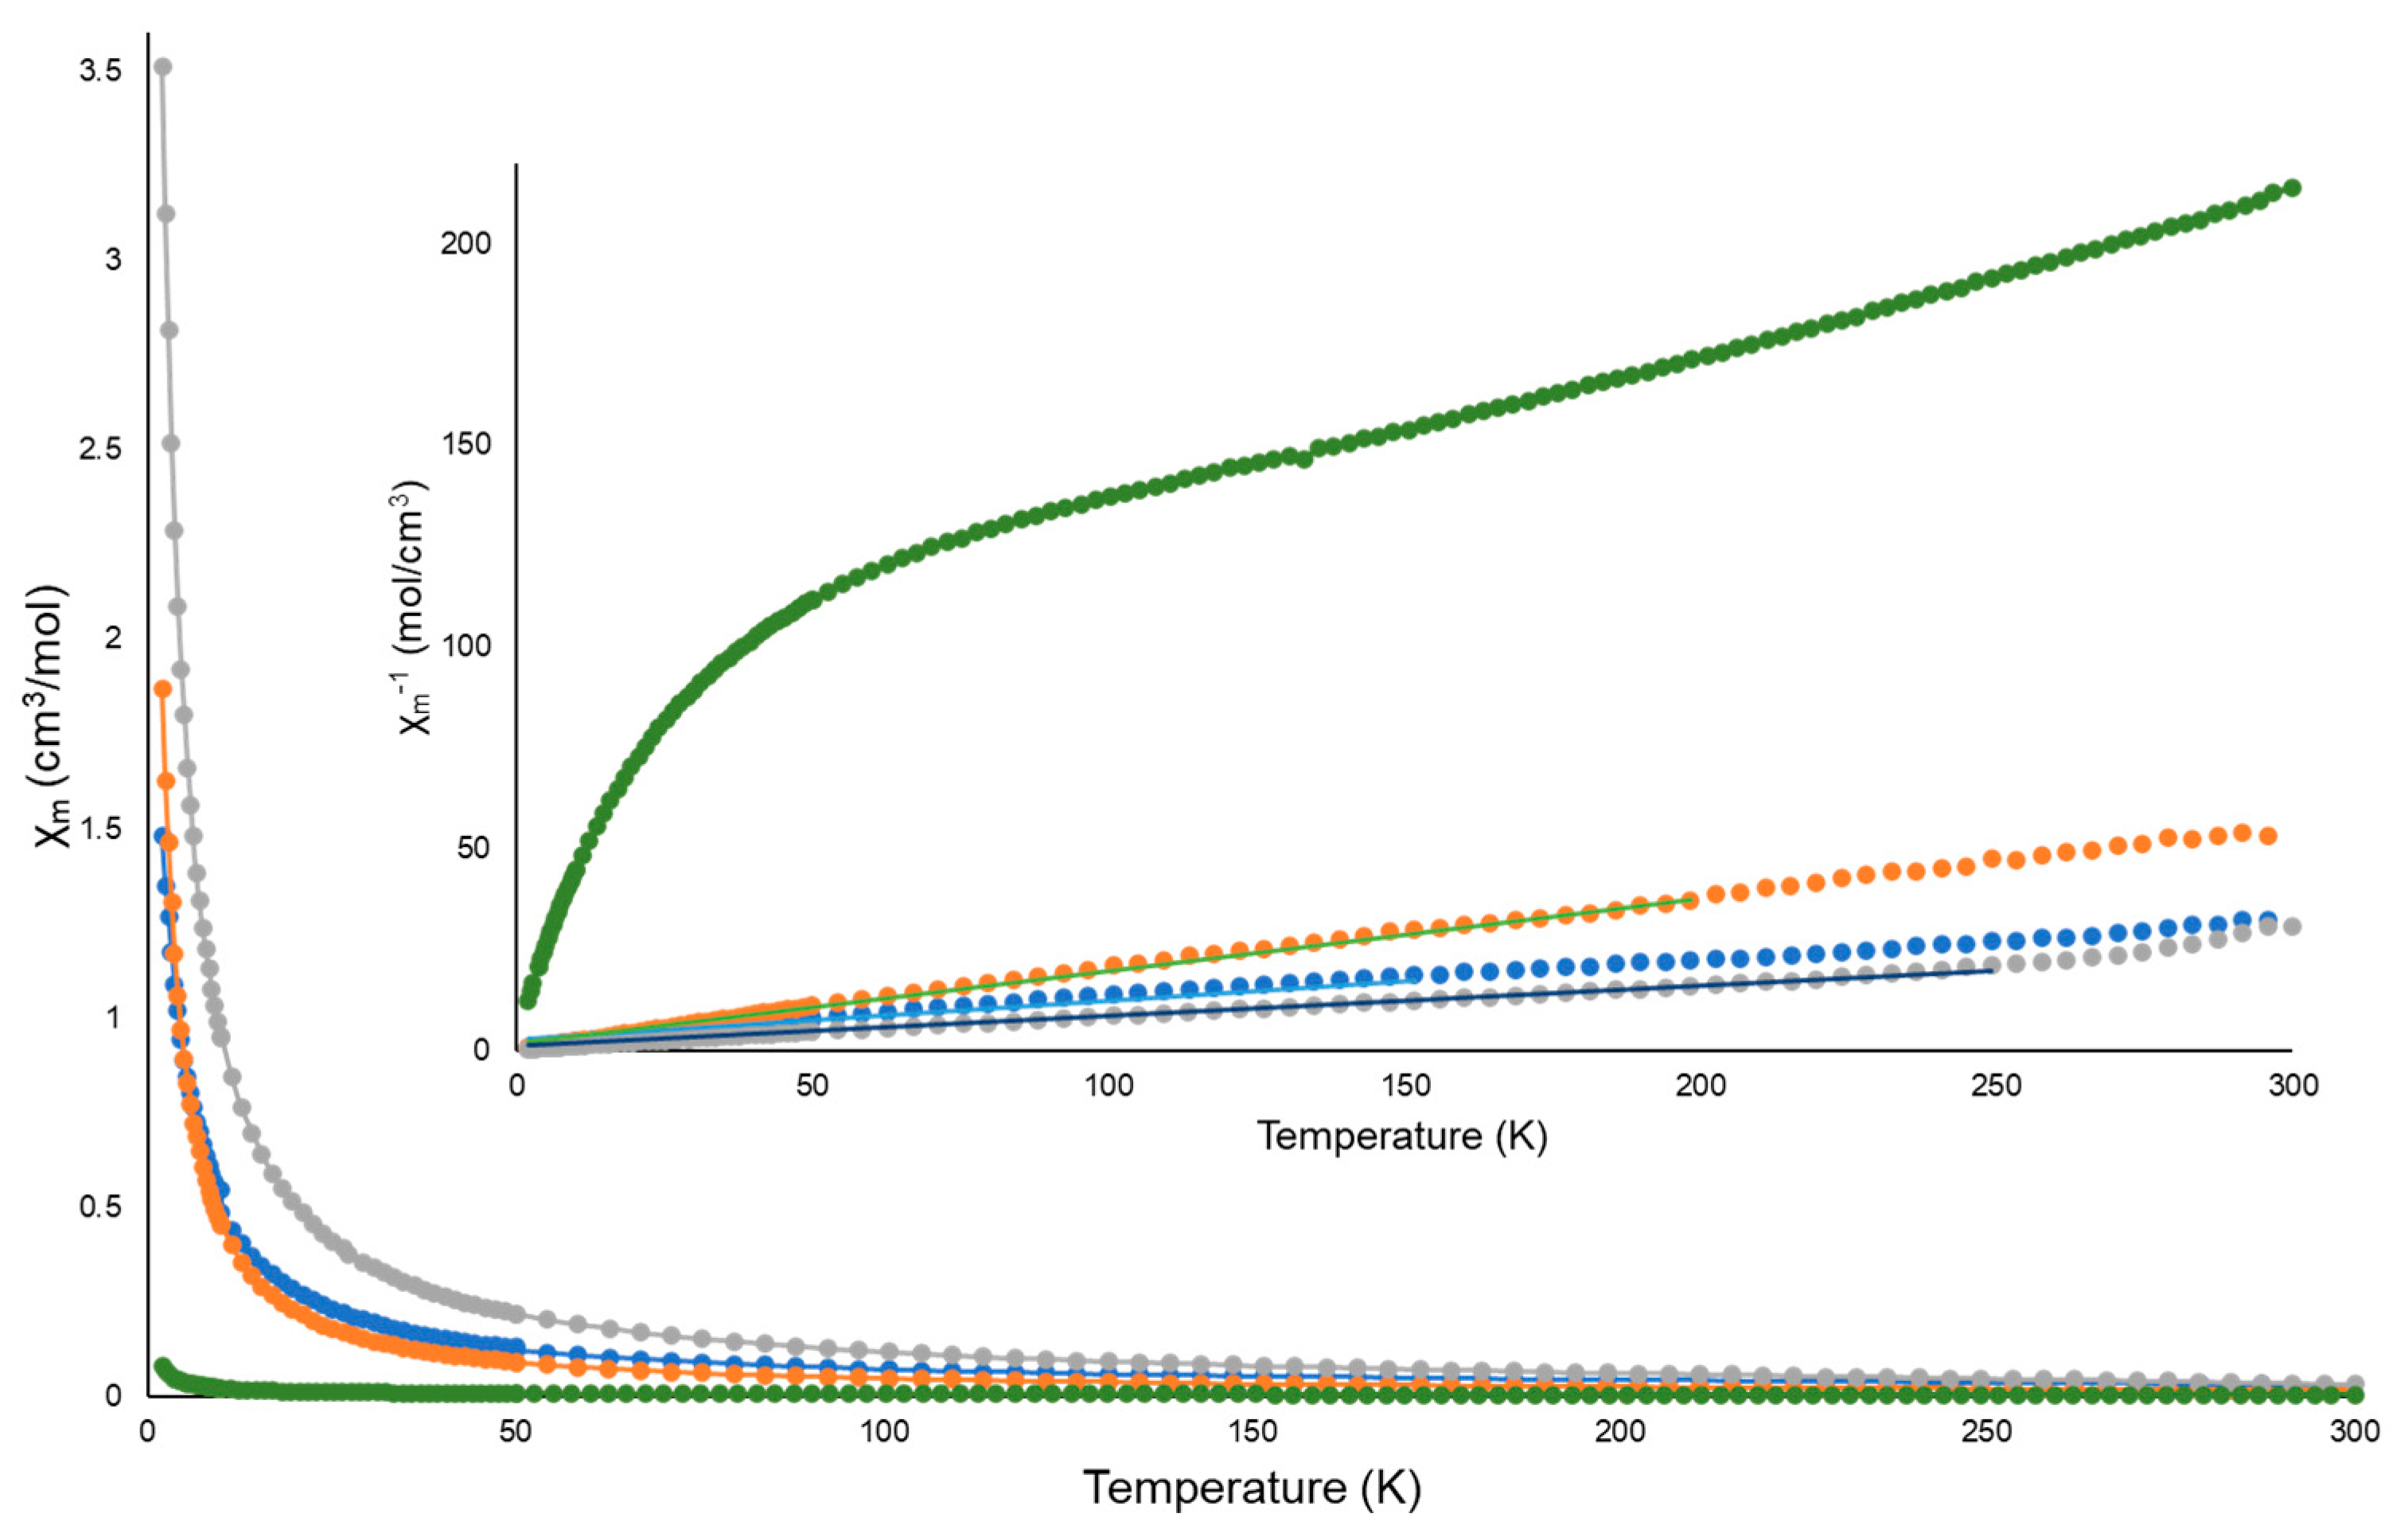
3.6. Magnetism
4. Conclusions
Supplementary Materials
Author Contributions
Funding
Institutional Review Board Statement
Informed Consent Statement
Data Availability Statement
Acknowledgments
Conflicts of Interest
References
- Zhao, Z.; Li, Z.; Lin, Y.S. Adsorption and Diffusion of Carbon Dioxide on Metal–Organic Framework (MOF-5). Ind. Eng. Chem. Res. 2009, 48, 10015–10020. [Google Scholar] [CrossRef]
- Rice, A.M.; Leith, G.A.; Ejegbavwo, O.A.; Dolgopolova, E.A.; Shustova, N.B. Heterometallic Metal–Organic Frameworks (MOFs): The Advent of Improving the Energy Landscape. ACS Energy Lett. 2019, 4, 1938–1946. [Google Scholar] [CrossRef]
- Dhakshinamoorthy, A.; Asiri, A.M.; Garcia, H. Mixed-Metal or Mixed-Linker Metal Organic Frameworks as Heterogeneous Catalysts. J. Adv. Catal. Sci. 2016, 6, 5238–5261. [Google Scholar] [CrossRef]
- Assen, A.H.; Yassine, O.; Shekhah, O.; Eddaoudi, M.; Salama, K.N. MOFs for the Sensitive Detection of Ammonia: Deployment of Fcu-MOF Thin Films as Effective Chemical Capacitive Sensors. ACS Sens. 2017, 2, 1294–1301. [Google Scholar] [CrossRef] [PubMed]
- Miner, E.M.; Park, S.S.; Dincă, M. High Li+ and Mg2+ Conductivity in a Cu-Azolate Metal–Organic Framework. J. Am. Chem. Soc. 2019, 141, 4422–4427. [Google Scholar] [CrossRef] [PubMed]
- Black, C.A.; Costa, J.S.; Fu, W.T.; Massera, C.; Roubeau, O.; Teat, S.J.; Aromí, G.; Gamez, P.; Reedijk, J. 3-D Lanthanide Metal-Organic Frameworks: Structure, Photoluminescence, and Magnetism. Inorg. Chem. 2009, 48, 1062–1068. [Google Scholar] [CrossRef] [PubMed]
- Masoomi, M.Y.; Morsali, A.; Dhakshinamoorthy, A.; Garcia, H. Mixed-Metal MOFs: Unique Opportunities in Metal-Organic Framework (MOF) Functionality and Design. Angew. Chem. 2019, 58, 15188–15205. [Google Scholar] [CrossRef] [PubMed]
- Wu, Z.-L.; Dong, J.; Ni, W.-Y.; Zhang, B.-W.; Cui, J.-Z.; Zhao, B. Unique Chiral Interpenetrating d–f Heterometallic MOFs as Luminescent Sensors. Inorg. Chem. 2015, 54, 5266–5272. [Google Scholar] [CrossRef]
- Cui, Z.; Zhang, X.; Liu, S.; Zhou, L.; Li, W.; Zhang, J. Anionic Lanthanide Metal–Organic Frameworks: Selective Separation of Cationic Dyes, Solvatochromic Behavior, and Luminescent Sensing of Co(II) Ion. Inorg. Chem. 2018, 57, 11463–11473. [Google Scholar] [CrossRef]
- Sakamoto, M. d-f Heteronuclear Complexes: Synthesis, Structures and Physicochemical Aspects. Coord. Chem. Rev. 2001, 219–221, 379–414. [Google Scholar] [CrossRef]
- Shiga, T.; Onuki, T.; Matsumoto, T.; Nojiri, H.; Newton, G.N.; Hoshino, N.; Oshio, H. Undecanuclear Mixed-Valence 3d–4f Bimetallic Clusters. Chem. Comm. 2009, 3568–3570. [Google Scholar] [CrossRef] [PubMed]
- Li, Z.-Y.; Wang, Y.-X.; Zhu, J.; Liu, S.-Q.; Xin, G.; Zhang, J.-J.; Huang, H.-Q.; Duan, C.-Y. Three Series of 3d–4f Heterometallic Polymers Based on [LnCu6] or [Ln6Cu24] Clusters and Formate Bridges: Displaying Significant Magnetocaloric Effect. Cryst. Growth Des. 2013, 13, 3429–3437. [Google Scholar] [CrossRef]
- Prasad, T.K.; Rajasekharan, M.V.; Costes, J.-P. A Cubic 3d–4f Structure with Only Ferromagnetic Gd–Mn Interactions. Angew. Chem. Int. Ed. Engl. 2007, 119, 2909–2912. [Google Scholar] [CrossRef]
- He, H.; Ma, H.; Sun, D.; Zhang, L.; Wang, R.; Sun, D. Porous Lanthanide–Organic Frameworks: Control over Interpenetration, Gas Adsorption, and Catalyst Properties. Cryst. Growth Des. 2013, 13, 3154–3161. [Google Scholar] [CrossRef]
- Abednatanzi, S.G.; Derakhshandeh, P.V.D.; Depauw, H.; Coudert, F.-X.; Vrielinck, H.; Voort, P.; Leus, K. Mixed-Metal Metal–Organic Frameworks. Chem. Soc. Rev. 2019, 48, 2535–2565. [Google Scholar] [CrossRef] [PubMed] [Green Version]
- Zhang, F.; Zou, X.; Yan, P.; Sun, J.; Hou, G.; Li, G. Pyrazine-2,3-Carboxylate Based Ag Homometallic and Ln3+–Ag+ Heterometallic Coordination Frameworks: Synthesis, Structures, and Magnetic Properties. Cryst. Growth Des. 2015, 15, 1249–1258. [Google Scholar] [CrossRef]
- Rieter, W.J.; Taylor, K.M.L.; An, H.; Lin, W.; Lin, W. Nanoscale Metal−Organic Frameworks as Potential Multimodal Contrast Enhancing Agents. J. Am. Chem. Soc. 2006, 128, 9024–9025. [Google Scholar] [CrossRef] [PubMed] [Green Version]
- Bresinska, I.; Balkus, K.J.J. Studies of Gd(III)-Exchanged Y-Type Zeolites Relevant to Magnetic Resonance Imaging. J. Phys. Chem. 1994, 98, 12989–12994. [Google Scholar] [CrossRef]
- Young, S.W.; Qing, F.; Rubin, D.; Balkus, K.J.; Engel, J.S.; Lang, J.; Dow, W.C.; Mutch, J.D.; Miller, R.A. Gadolinium Zeolite as an Oral Contrast Agent for Magnetic Resonance Imaging. J. Magn. Reson. Imaging 1995, 5, 499–508. [Google Scholar] [CrossRef] [PubMed]
- Peller, M.; Böll, K.; Zimpel, A.; Wuttke, S. Metal–Organic Framework Nanoparticles for Magnetic Resonance Imaging. Inorg. Chem. Front. 2018, 5, 1760–1779. [Google Scholar] [CrossRef]
- Balkus, K.J.; Coutinho, D.; Lucas, J.; Washmon-Kriel, L. Synthesis and Characterization of DAM-1 Type Materials. MRS Proc. 2000, 628, 2000. [Google Scholar] [CrossRef]
- Allendorf, M.D.; Medishetty, R.; Fischer, R.A. Guest Molecules as a Design Element for Metal–Organic Frameworks. MRS Bull. 2016, 41, 865–869. [Google Scholar] [CrossRef] [Green Version]
- Kitagawa, S.; Kitaura, R.; Noro, S.-I. Functional Porous Coordination Polymers. Angew. Chem. Int. Ed. Engl. 2004, 43, 2334–2375. [Google Scholar] [CrossRef] [PubMed]
- Sheldrick, G.M. Integrated space-group and crystal-structure determination. Acta Crystallogr. Sect. A 2015, 71, 3–8. [Google Scholar] [CrossRef] [Green Version]
- Sheldrick, G.M. Crystal structure refinement with SHELXL. Acta Crystallogr. Sect. C 2015, 71, 3–8. [Google Scholar] [CrossRef] [PubMed]
- Andrews, P.C.; Gee, W.J.; Junk, P.C.; Massi, M. Variation of Structural Motifs in Lanthanoid Hydroxo Clusters by Ligand Modification. New J. Chem. 2013, 37, 35–48. [Google Scholar] [CrossRef] [Green Version]
- Baskar, V.; Roesky, P.W. Synthesis and Structural Characterization of a Series of Tetranuclear Lanthanide Clusters. Z. Anorg. Allg. Chem. 2005, 631, 2782–2785. [Google Scholar] [CrossRef]
- Zheng, Z. Ligand-Controlled Self-Assembly of Polynuclear Lanthanide–Oxo/Hydroxo Complexes: From Synthetic Serendipity to Rational Supramolecular Design. Chem. Comm. 2001, 24, 2521–2529. [Google Scholar] [CrossRef]
- Luo, F.; Yang, Y.-T.; Che, Y.-X.; Zheng, J.-M. Construction of Cu(II)–Gd(III) Metal–Organic Framework by the Introduction of a Small Amino Acid Molecule: Hydrothermal Synthesis, Structure, Thermostability, and Magnetic Studies. Cryst. Eng. Comm. 2008, 10, 1613. [Google Scholar] [CrossRef]
- Sakamoto, M.; Hashimura, M.; Nakayama, Y.; Matsumoto, A.; Okawa, H. Fluorescence Quenching of Europium(III) by Heteronuclear Complex Formation with Copper(II) or Nickel(II). Bull. Chem. Soc. Jpn. 1992, 65, 1162–1164. [Google Scholar] [CrossRef]
- Ohtsu, H.; Suzuki, T.; Ohtsuka, H.; Ishii, A.; Hasegawa, M. The Unprecedented Role of a Cu(II) Cryptand in the Luminescence Properties of a Eu(III) Cryptate Complex. Monatsh. Chem. 2009, 140, 783–787. [Google Scholar] [CrossRef]
- Petrochenkova, N.V.; Tkachenko, I.A.; Mirochnik, A.G.; Karasev, V.E.; Kavun, V.Y. Luminescence and Magnetic Properties of Europium(III) Carboxylatodibenzoylmethanates. Opt. Spectrosc. 2010, 109, 917–920. [Google Scholar] [CrossRef]
- Andruh, M.; Bakalbassis, E.; Kahn, O.; Trombe, J.C.; Porcher, P. Structure, Spectroscopic and Magnetic Properties of Rare Earth Metal(III) Derivatives with the 2-Formyl-4-Methyl-6-(N-(2-Pyridylethyl)Formimidoyl)Phenol Ligand. Inorg. Chem. 1993, 32, 1616–1622. [Google Scholar] [CrossRef]
- Almáši, M.; Zeleňák, V.; Zeleňáková, A. Magnetic and Structural Studies into the Effect of Solvent Exchange Process in Metal-Organic Framework MOF-76(Gd). Acta Phys. Pol. A 2017, 131, 991–993. [Google Scholar] [CrossRef]
- Lin, Z.-J.; Xu, B.; Liu, T.-F.; Cao, M.-N.; Lü, J.; Cao, R. A Series of Lanthanide Metal-Organic Frameworks Based on Biphenyl-3,4′,5-Tricarboxylate: Syntheses, Structures, Luminescence and Magnetic Properties. Eur. J. Inorg. Chem. 2010, 2010, 3842–3849. [Google Scholar] [CrossRef]
- Fernández, B.; Oyarzabal, I.; Seco, J.M.; Sebastián, E.S.; Fairen-Jiménez, D.; Gómez-Ruiz, S.; Salinas-Castillo, A.; Calahorro, A.J.; Rodríguez-Diéguez, A. Luminescence and Magnetic Properties of Two Three-Dimensional Terbium and Dysprosium MOFs Based on Azobenzene-4,4′-Dicarboxylic Linker. Polymers 2016, 8, 39. [Google Scholar] [CrossRef] [Green Version]
- Li, Z.; Zhu, G.; Guo, X.; Zhao, X.; Jin, Z.; Qiu, S. Synthesis, Structure, and Luminescent and Magnetic Properties of Novel Lanthanide Metal−Organic Frameworks with Zeolite-like Topology. Inorg. Chem. 2007, 46, 5174–5178. [Google Scholar] [CrossRef] [PubMed]
- Tang, Y.; Guo, W.; Zhang, S.; Yang, M.; Xiang, H.; He, Z. Gd2Cu(SO4)2(OH)4: A 3d–4f Hydroxysulfate with an Enhanced Cryogenic Magnetocaloric Effect. Dalton Trans. 2015, 44, 17026–17029. [Google Scholar] [CrossRef]
- Benelli, C.; Caneschi, A.; Gatteschi, D.; Guillou, O.; Pardi, L. Synthesis, Crystal Structure, and Magnetic Properties of Tetranuclear Complexes Containing Exchange-Coupled Ln2Cu2 (Ln: Gd, Dy) Species. Inorg. Chem. 1990, 29, 1750–1755. [Google Scholar] [CrossRef]
- Pascual-Álvarez, A.; Cano, J.; Lloret, F.; Ferrando-Soria, J.; Armentano, D.; Pardo, E. Magnetic Order in a Cu(II)–Dy(III) Oxamato-Based Two-Dimensional Coordination Polymer. C. R. Chim. 2019, 22, 466–475. [Google Scholar] [CrossRef]


| Cu Gd2 (BDC)4 | Cu Ho2 (BDC)4 | Cu Eu2 (BDC)4 | Cu Dy2 (BDC)4 | |
|---|---|---|---|---|
| Chemical formula | C38H30CuGd2N2O18 2(C3H7NO) | C38H30CuHo2N2O18 2(C3H7NO) | C38H30CuEu2N2O18 2(C3H7NO) | C38H30CuDy2N2O18 2(C3H7NO) |
| M | 1326.87 | 1342.23 | 1316.29 | 1337.37 |
| Crystal System | Monoclinic | Monoclinic | Monoclinic | Monoclinic |
| Space Group | P21/n | P21/n | P21/n | P21/n |
| a/Å | 11.798 (3) | 11.728 (3) | 11.806 (3) | 11.757 (4) |
| mb/Å | 17.390 (4) | 17.305 (4) | 17.516 (5) | 17.289 (4) |
| c/Å | 12.804 (3) | 12.808 (3) | 12.802 (3) | 12.783 (5) |
| β/Å | 115.285 (8) | 115.108 (8) | 115.578 (7) | 114.95 (2) |
| V/Å3 | 2375.4 (10) | 2353.9 (10) | 2388.1 (10) | 2355.7 (14) |
| T/K | 100 (2) | 100 (2) | 110 (2) | 110 (2) |
| Z | 2 | 2 | 2 | 2 |
| λ/Å | 0.71073 | 0.71073 | 0.71073 | 0.71073 |
| μ(MoKα)/mm−1 | 3.29 | 3.86 | 3.12 | 3.67 |
| Rint | 0.037 | 0.054 | 0.069 | 0.074 |
| Reflection Measured | 57,097 | 55,556 | 75,255 | 33,679 |
| Independent Reflections | 7244 | 7178 | 5505 | 5423 |
| Parameters | 326 | 327 | 326 | 327 |
| Reflections with I > 2σ (I) | 6742 | 6171 | 4805 | 4154 |
| Final R value (I > 2σ (I)) | 0.031 | 0.028 | 0.039 | 0.037 |
| Final Rw (F2) (I > 2σ (I)) | 0.056 | 0.048 | 0.087 | 0.068 |
| Final R value (all data) | 0.035 | 0.038 | 0.048 | 0.059 |
| Rw(F2) (all data) | 0.057 | 0.052 | 0.091 | 0.076 |
| Goodness of fit on F2 | 1.20 | 1.07 | 1.11 | 1.04 |
Publisher’s Note: MDPI stays neutral with regard to jurisdictional claims in published maps and institutional affiliations. |
© 2021 by the authors. Licensee MDPI, Basel, Switzerland. This article is an open access article distributed under the terms and conditions of the Creative Commons Attribution (CC BY) license (https://creativecommons.org/licenses/by/4.0/).
Share and Cite
Mortensen, M.L.; Lewis, A.L.; McCandless, G.; Balkus, K.J., Jr. Four Isostructural 3d-4f Mixed Metal Organic Frameworks and Their Magnetic Properties. Crystals 2021, 11, 1547. https://doi.org/10.3390/cryst11121547
Mortensen ML, Lewis AL, McCandless G, Balkus KJ Jr. Four Isostructural 3d-4f Mixed Metal Organic Frameworks and Their Magnetic Properties. Crystals. 2021; 11(12):1547. https://doi.org/10.3390/cryst11121547
Chicago/Turabian StyleMortensen, Marie L., Abigail L. Lewis, Gregory McCandless, and Kenneth J. Balkus, Jr. 2021. "Four Isostructural 3d-4f Mixed Metal Organic Frameworks and Their Magnetic Properties" Crystals 11, no. 12: 1547. https://doi.org/10.3390/cryst11121547
APA StyleMortensen, M. L., Lewis, A. L., McCandless, G., & Balkus, K. J., Jr. (2021). Four Isostructural 3d-4f Mixed Metal Organic Frameworks and Their Magnetic Properties. Crystals, 11(12), 1547. https://doi.org/10.3390/cryst11121547