Article

Optimization Preparation of Indium Tin Oxide Nanoparticles via Microemulsion Method Using Orthogonal Experiment

Beijing Key Laboratory of Electrochemical Process and Technology for Materials, College of Materials Science and Engineering, Beijing University of Chemical Technology, Beijing 100029, China
*
Author to whom correspondence should be addressed.
Crystals 2021, 11(11), 1387; https://doi.org/10.3390/cryst11111387
Submission received: 10 September 2021 / Revised: 6 November 2021 / Accepted: 10 November 2021 / Published: 13 November 2021
(This article belongs to the Special Issue Synthesis, Characterization, and Properties of Nanomaterials)

Abstract

:
Indium tin oxide (ITO), an experimentally friendly transparent conducting oxide (TCO), has attracted great attention in the photoelectric field due to its intrinsically low resistivity and high transparency. In this work, the experimental conditions of preparing ITO nanoparticles using the microemulsion method were optimized by an orthogonal experiment. The optimal experimental conditions were obtained: mass ratio of the surfactant (AEO-3, MOA-5), a co-surfactant (n-propyl alcohol) of 5:3, molar ratio of indium and ammonia of 1:20, calcination temperature of 700 °C and calcination time of 4 h. Subsequently, the influence from process variables on the resistivity was researched systematically. The results demonstrated that the calcination temperature had a great effect on the resistivity; the resistivity reduced from 11.28 to 2.72 Ω·cm with the increase in the calcination temperature from 500 to 700 °C. Ultimately, ITO nanoparticles were prepared and systematically characterized under the optimal experimental conditions. The particles with a size of 60 nm were attributed to the cubic ITO crystal phase and showed low resistivity of 0.3675 Ω·cm. Significantly, ITO nanoparticles with low resistivity were obtained using the microemulsion method, which has potential application in the field of ITO nanoparticle preparation.

1. Introduction

Indium tin oxide (ITO) is an n-type semiconductor oxide [1,2]. In recent years, due to low resistivity combined with high transparency to visible light [3,4], ITO films have been widely used in various technological areas, including flat panel displays [5,6], solar cells [7,8], gas sensors [9,10] and organic light emitting diodes [11,12]. ITO thin films are usually prepared by magnetron sputtering [13], using ITO targets as raw materials. It has been reported that the properties of ITO nanoparticles have a significant influence on the properties of ITO targets [14]. Therefore, it is necessary to prepare ITO nanoparticles with a high performance.
Many methods have been used to prepare ITO nanoparticles, such as the hydrothermal method [15], co-precipitation method [16], solvothermal method and so on. The hydrothermal method [17] is environmentally friendly, but the high reaction temperature leads to the hard agglomeration of nanoparticles. The co-precipitation method [18] has a simple preparation process, but the morphology and dispersibility of the nanoparticles are difficult to control. The advantage of the solvothermal method [19] is that it can change the solvent system to improve the properties of the nanoparticles, but it has requirements for equipment safety. Compared with the above methods, the microemulsion method, with a simple and safe process, could control the morphology and size of the nanoparticles. It has been used in the preparation of metal nanocrystals, metal oxides and polymers, such as high-efficiency CsPbBr3/CsPb2Br5 composite [20], nanostructured CaO/CuO composites [21], hydrophobically associative polyacrylamides [22] and sub-100 nm PEG NPs [23]. However, the microemulsion method has not been applied in the preparation of ITO nanoparticles.
The microemulsion method also has preliminary application in the ITO field. Zhan et al. [24] prepared In2O3 nanoparticles using the inverse microemulsion method and obtained In2O3 nanoparticles with narrow particle size distribution and high sphericity in a range from 400 °C to 600 °C. Yang et al. [25] prepared spherical and rod-like In(OH)3 using the microemulsion-mediated hydrothermal method and prepared spherical and rod-like In2O3 nanoparticles by calcination. Devi et al. [26] successfully prepared ITO nanoparticles with a high tin-doping amount at a low temperature with emulsion technology. However, the microemulsion method is not commonly used in the ITO nanoparticles preparation field.
This work aims to systematically study the preparation of ITO nanoparticles using the microemulsion method and the study of its properties, explain the mechanism of the microemulsion method, and finally promote the application of the microemulsion method in the field of ITO nanoparticles preparation. To systematically study the effect of the preparation process of the microemulsion method on ITO resistivity, we designed an orthogonal experiment and calculated the scientific range variance to obtain the best preparation process. Then, through system characterization, we sought to prove the accuracy of orthogonal experimental calculation.
In this paper, cubic ITO (c-ITO) nanoparticles with low resistivity were successfully synthesized using the microemulsion method. Firstly, the orthogonal experiment was employed to optimize the experimental conditions of ITO nanoparticles, and the influence of mass ratio of the surfactant and co-surfactant, molar ratio of indium and ammonia, calcination temperature and calcination time on resistivity was investigated, whereafter ITO nanoparticles were synthesized and characterized systematically under the optimal experimental conditions. Finally, the formation mechanism of ITO nanoparticles using the microemulsion method was proposed and analyzed to improve the performance of ITO nanoparticles. This paper provides a new method for the preparation of c-ITO nanoparticles and provides a reference for future research on ITO nanoparticles preparation.

2. Experimental Section

2.1. Materials

Metal indium (purity > 99.99%) was purchased from Liuzhou Smelting Co. Ltd. (Liuzhou, China). SnCl4·5H2O (A.R.) was purchased from Sinopharm Chemical Reagent Co. Ltd. (Beijing, China). Ammonium hydroxide (A.R.) and n-propyl alcohol (A.R.) and n-hexane (A.R.) were purchased from Beijing Tongguang Fine Chemical Company (Beijing, China). Fatty alcohol-polyoxyethylene ether (MOA-5 (A.R.) and AEO-3 (A.R.)) were purchased from Shanghai Macklin Biochemical Co. Ltd. (Shanghai, China). HCl (purity: 37%) was purchased from Shanghai Macklin Biochemical Co. Ltd. (Shanghai, China).

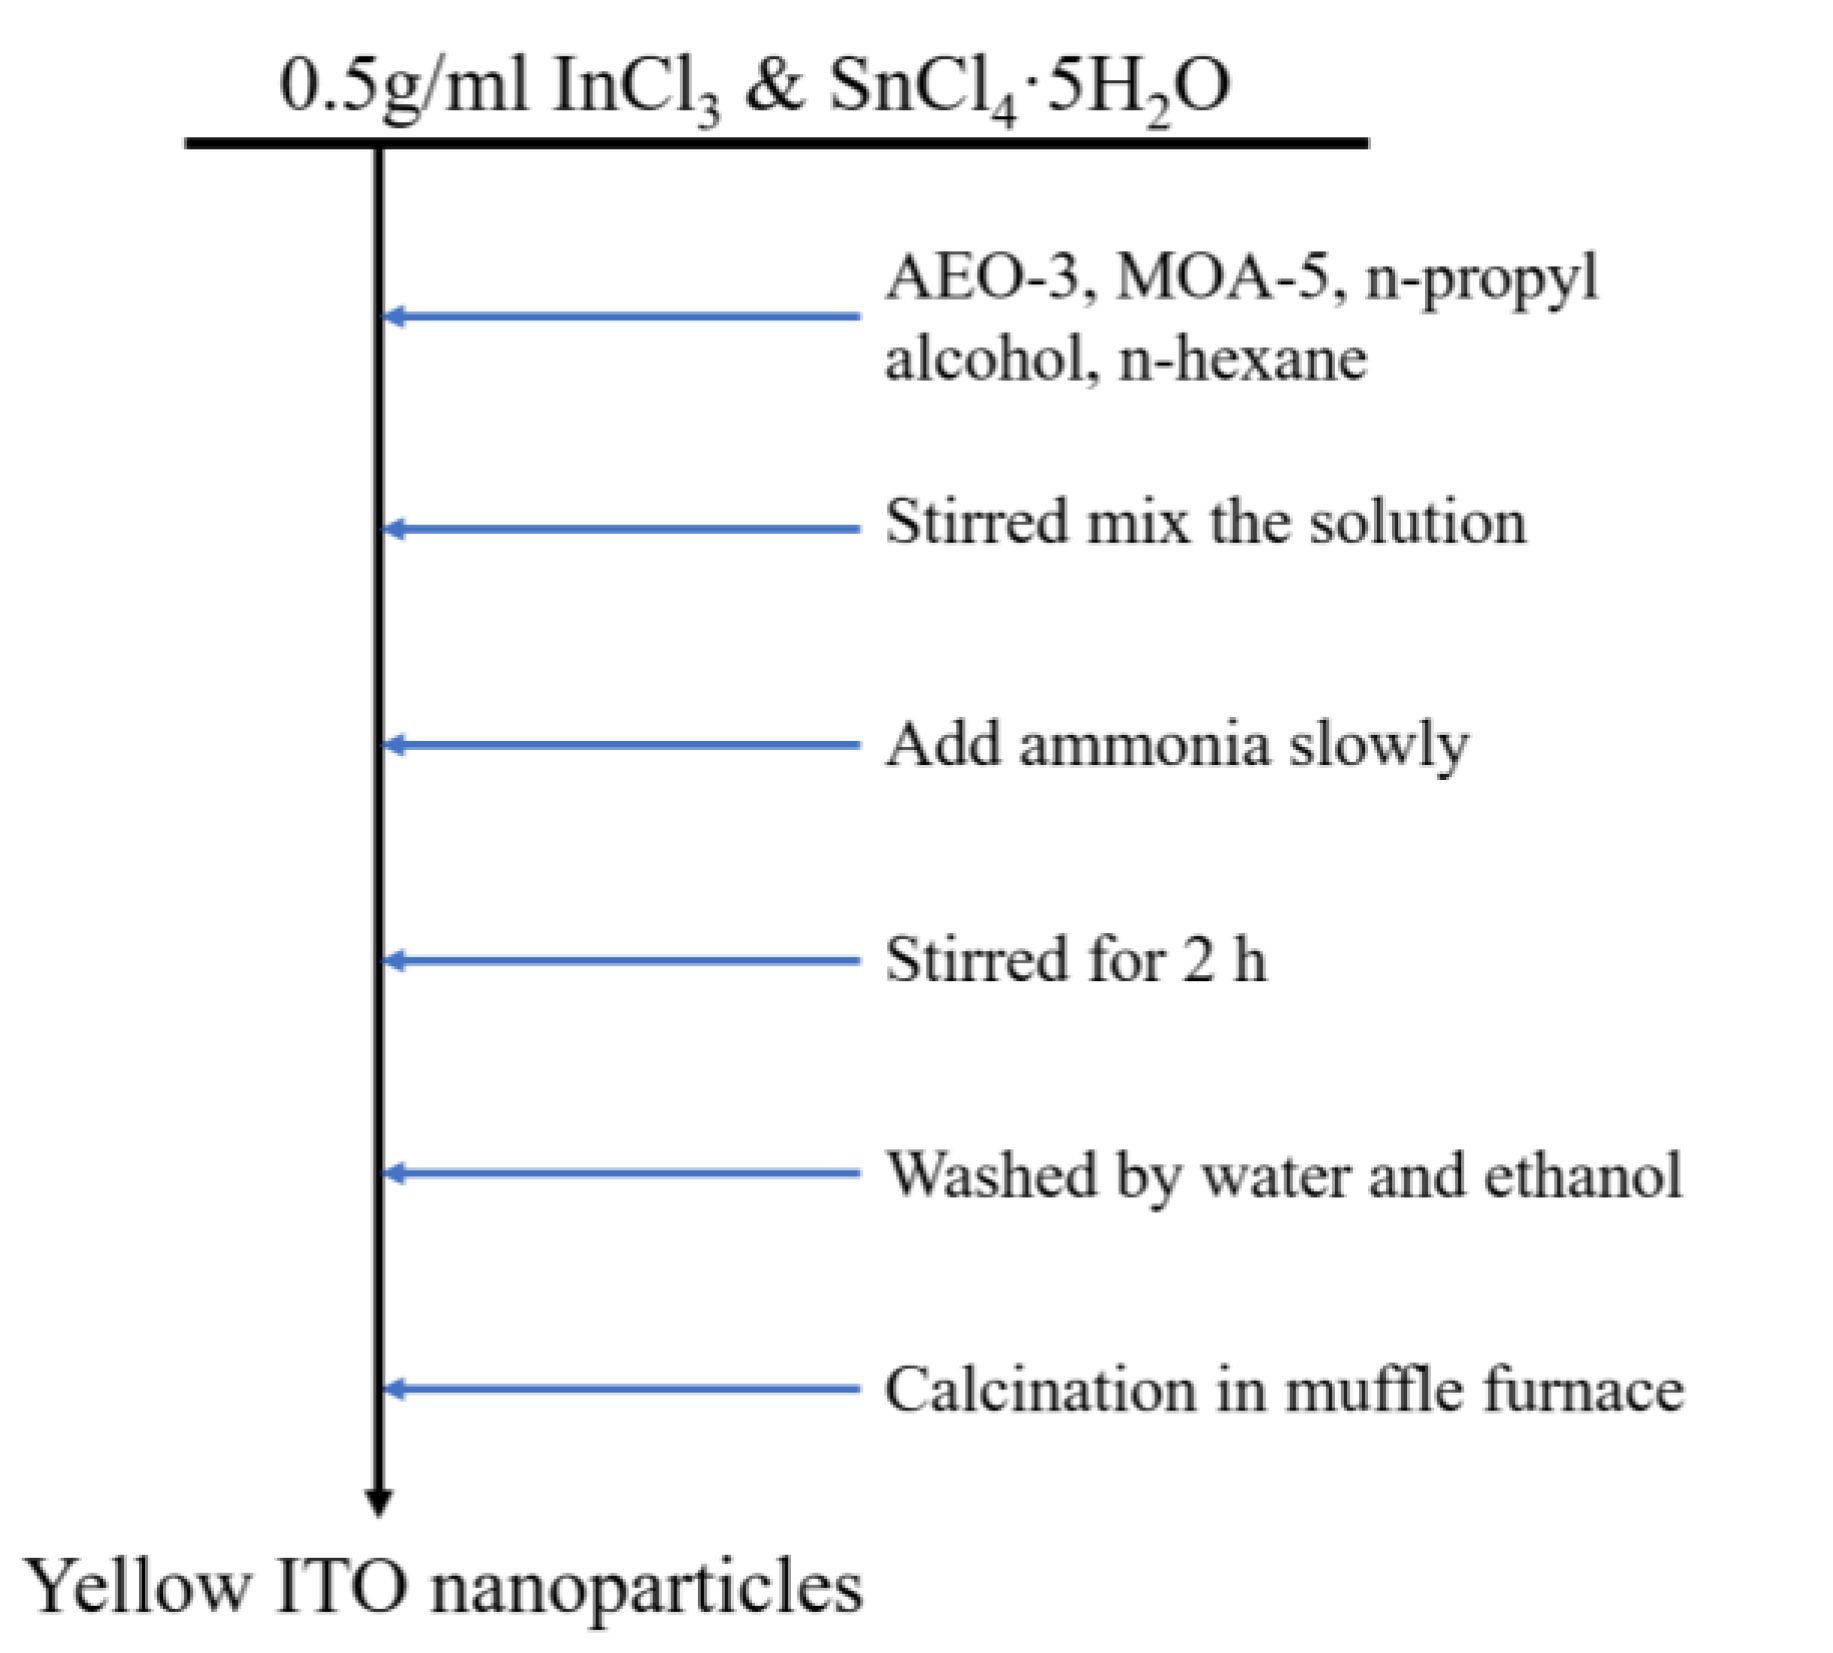
2.2. Preparation of ITO Nanoparticles

In this experiment, ITO nanoparticles were prepared using the microemulsion method, wherein 1.5 g indium was dissolved in 3 mL hydrochloric acid, and the solution was continually stirred and heated until the metal indium was completely dissolved. InCl3 solution was mixed with SnCl4·5H2O with the In2O3/SnO2 mass ratio of 9:1. The mixed solution was used as the aqueous phase, with AEO-3 and MOA-5 mixed in a mass ratio of 1:1 as the surfactants, n-propanol as the co-surfactant and n-hexane as the oil phase, preparing the microemulsion in an appropriate proportion. Ammonium hydroxide was slowly added to the above microemulsion, accompanied with continuous stirring for 2 h. Then the white precipitate was centrifuged, washed with deionized water and ethanol and dried at 80 °C for 4 h. Finally, the precursor was calcined at a certain temperature in a muffle furnace, resulting in yellow ITO nanoparticles. The experimental process is shown in Figure 1.

2.3. Characterization

X-ray diffractometer (XRD, D8 Advance, Karlsruhe, German) was used to measure the phase composition of ITO nanoparticles. Mettler Toledo 2+ synchronous thermal analyzer (Columbus, OH, USA) was employed to analyze the thermogravimetric (TG) and differential thermal analysis (DTA) of ITO precursor. The morphology of ITO nanoparticles was studied using a scanning electron microscope (SEM, TESCAN MAIA3, Tescan Brno, Brno, Czech Republic), selected area electron diffraction (SAED) and high-resolution TEM (HRTEM, JEM 2100, Tokyo, Japan). A 4-Point Probes Resistivity Measurement System (RTS-9, Guangzhou, China) was adopted to measure the resistivity of ITO nanoparticles. The carrier concentration and mobility of ITO nanoparticles were measured by Hall effect measurement system (LanHai Instrument Co., Ltd., Linhai, China). Elemental states of ITO nanoparticles were characterized by X-ray photoelectron spectroscopy (XPS, ESCALAB 250, Thermo-Scientific, Waltham, MA, USA). Diffusion reflection spectra were obtained by ultraviolet-visible spectrophotometer (UV-Vis, UV-3600, Shimadzu Corporation, Kyoto, Japan).

3. Results and Discussion

3.1. Orthogonal Experiment Optimization of ITO Nanoparticles Preparation Process

3.1.1. Orthogonal Experiment Design and Data

In the hope of obtaining the optimal preparation process of ITO nanoparticles, four factors which have important effects on the resistivity were selected to conduct the orthogonal experiment, namely the mass ratio of surfactant and co-surfactant (Ms/Mc), molar ratio of metal indium and ammonia (NIn/Na), calcination temperature (tc) and calcination time (th). The orthogonal experiment was designed based on our previous work. Table 1 shows the three levels of the four factors. Assuming there is no interaction between these four factors, orthogonal array table L9(34) was used to design the orthogonal experiment. The experimental plan and results are shown in Table 2.

3.1.2. Range Analysis of the Orthogonal Experiment Results

Only using the above data in Table 2, it was impossible to obtain the optimal conditions for the experiment. Therefore, range analysis was carried out on the data in Table 2, and the results are shown in Table 3. Among them, R1, R2 and R3 respectively correspond to the sum of the resistivity at three levels of each factor. R is the difference between the maximum and minimum values of R1, R2 and R3 for each factor. The greater the value of R, the greater the influence of this factor on the experimental results [27,28]. Taking factor A as an example, the resistivity sum of the Ⅰ level is maximum (54.739), while the Ⅲ level is minimum (23.342), so the R value of factor A is 31.397. The R values of factors B, C, D were calculated using the same method.
It can be concluded from the Table 3 that RC > RA > RB > RD. This indicates that the factor impacting sequence on the resistivity of ITO nanoparticles are tc > MS/MC > NIn/Na > th. According to the analysis of the experimental data, the best experimental conditions are A3B3C3D3, which indicates that the best synthesis conditions are as follows: tc = 700 °C Ms/Mc = 5/3, NIn/Na = 1/20, th = 4 h.

3.1.3. Variance Analysis of Orthogonal Experiment Results

As is well known, experimental errors are inevitable. Though the influence significance of various factors could be obtained by the range analysis, the experimental error cannot be judged by the range analysis [29]. Therefore, the variance analysis was carried out to study the significance of various factors and evaluate the experimental error size of each factor. Table 4 shows all the calculation results of variance analysis. Taking factor A as an example, the analysis process was as follows [29,30]:
The sum of squared deviations for factor A(QA):
Q A   =   h = 1 r n h ( R ¯ h R ¯ ) 2   = h = 1 3 n h ( R ¯ h R ¯ ) 2 = 6   ×   ( 9.123167 6.024944 ) 2 + 6   ×   ( 5.061333 6.024944 ) 2 + 6   ×   ( 3.890333 6.024944 ) 2 = 90.5045762
where nh, r, h, R ¯ h and R ¯   are the experiment number of h level, factor level quantity, the h level, resistivity average of h level and total resistivity average, respectively.
The freedom degrees of factor A (fA):
fA = 3 − 1 = 2
The sum of squared deviations generated by repeated experimental error (Qe):
Q e   = i = 1 9 k = 1 2 ( R i k     R ¯ i ) = 3.6887865
where Rik and R ¯ i are the resistivity of experiment ik and resistivity average of experiment i.
The freedom degrees of experimental error (fe):
f e   = f T   f j = 17 2   ×   4 = 9
F value of factor A:
F A = Q A / f A Q e / f e = 110.407742
The same calculation method was employed to obtain the sum of squared deviations QB, QC and QD, the freedom degrees fB, fC and fD and the F values FB, FC and FD, in which j = A, B, C, D.
As can be seen from Table 4, the four factors have a significant influence on the resistivity of ITO nanoparticles (Fj > F0.01). The F value of each factor follows the sequence: FC > FA > FB > FD, which is consistent with the results of range analysis. It can be seen that calcination temperature is a significant effect on resistivity, followed by Ms/Mc, NIn/Na and calcination time. Therefore, the best experimental conditions are A3B3C3D3: Ms/Mc = 5/3, NIn/Na = 1/20, tc = 700 °C, th = 4 h.

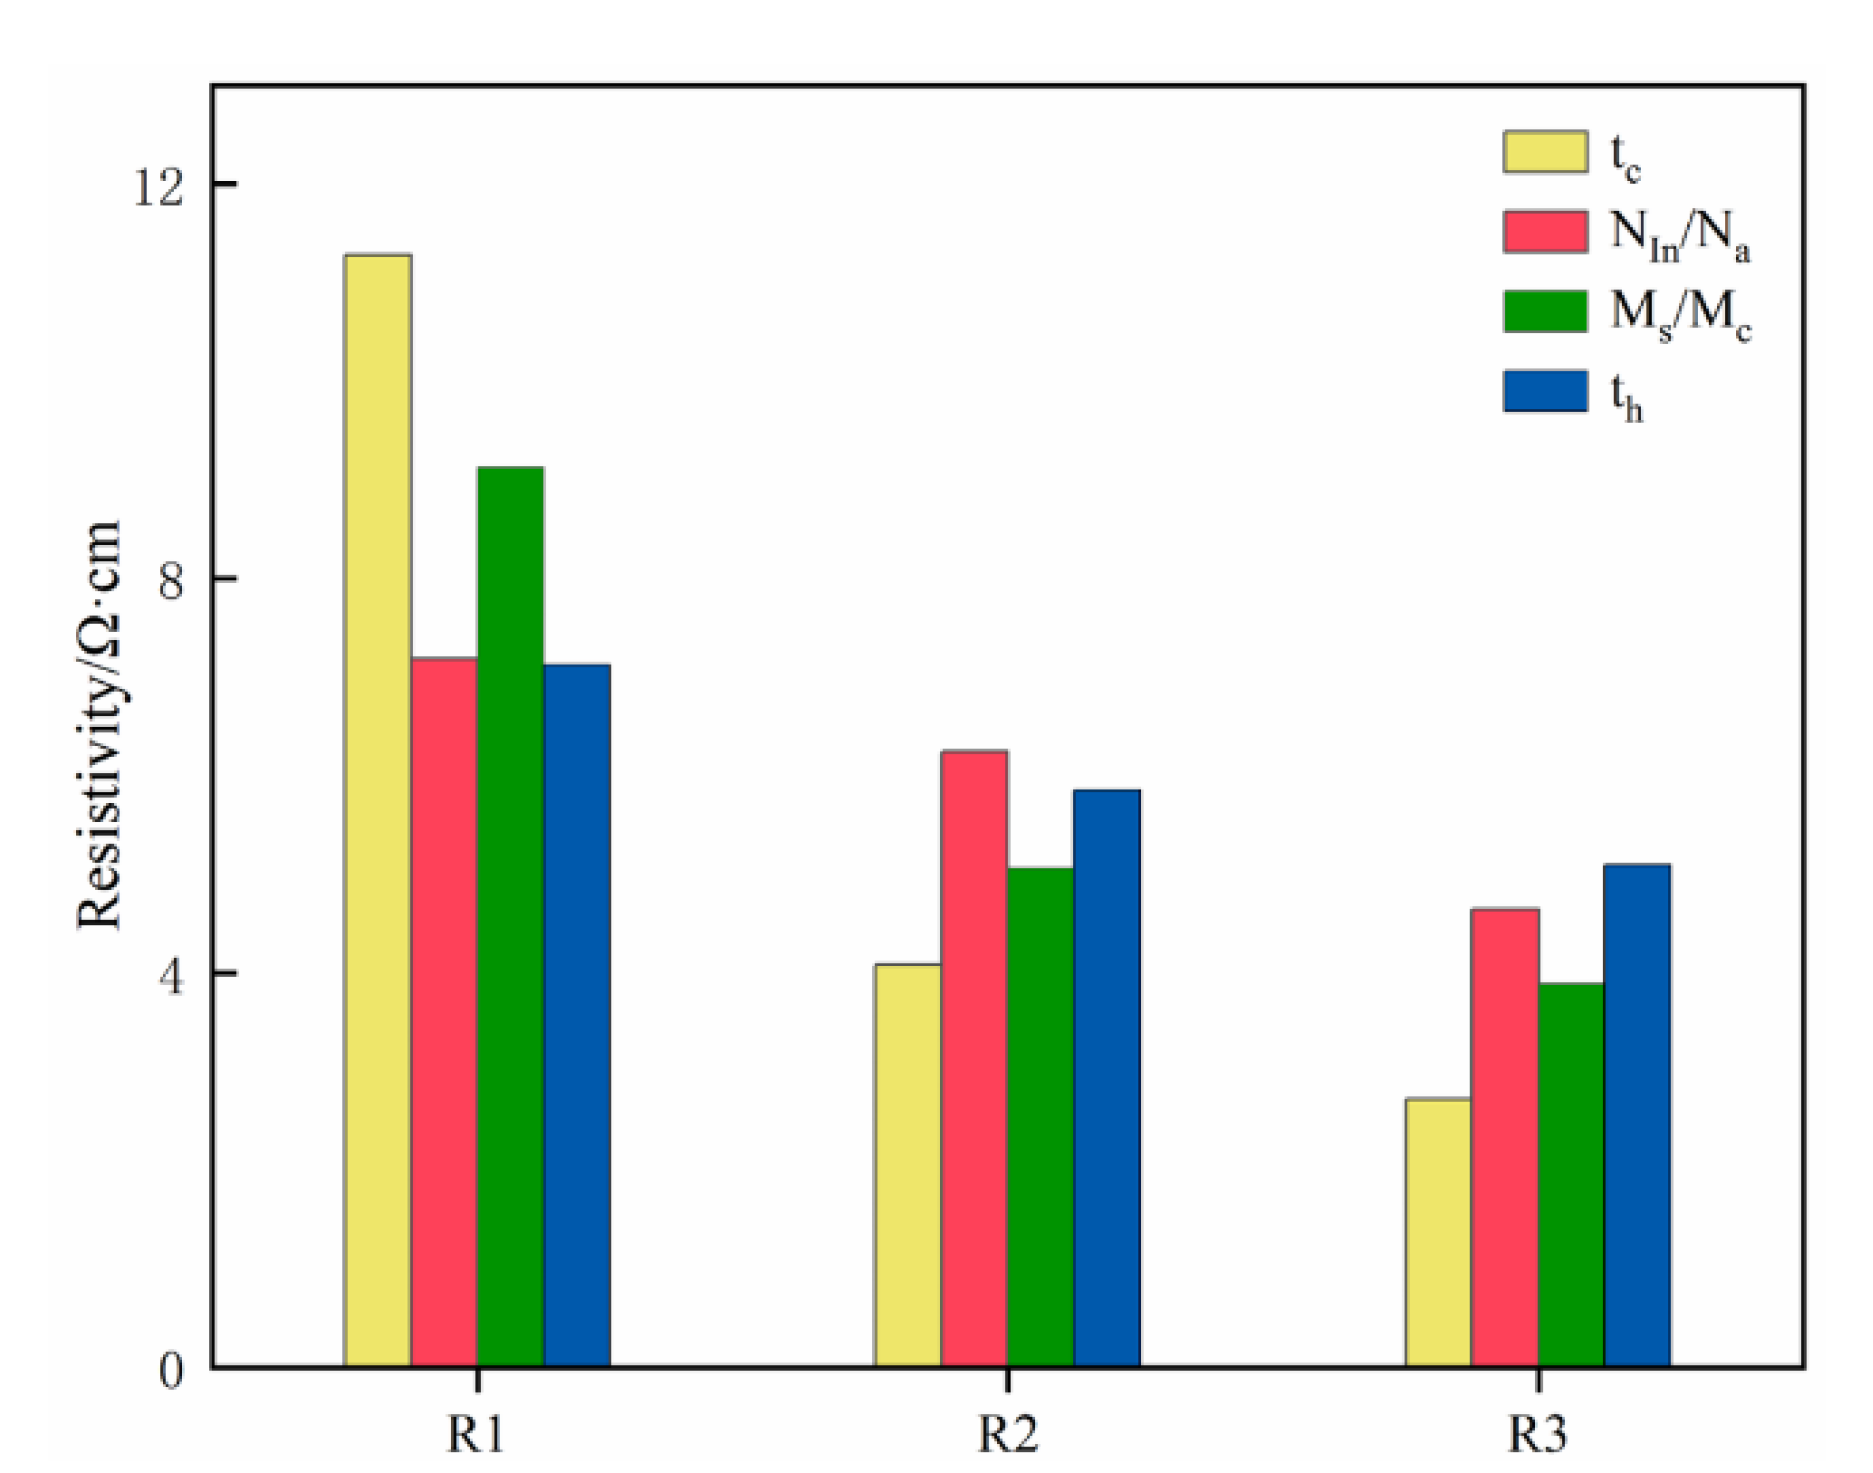
3.1.4. The Influence of Various Factors on Resistivity

The resistivity of ITO nanoparticles is related to mobility and carrier concentration, and the relationship is as follows [31,32]:
ρ = 1 n e μ ,
According to Mathison’s law, the mobility of ITO material can be expressed as [33]:
1 μ   =   1 μ g   +   1 μ I ,
In the formula, ρ is the resistivity, μ is the mobility, n is the carrier concentration, e is the absolute value of the electron charge and μg, μI are the mobility of grain boundary scattering and the mobility of impurity ion scattering, respectively. In this experiment, the doping amount of tin was unchanged, that is, n and μI are fixed values. At this time, the resistivity of ITO nanoparticles was determined by the mobility μg of grain boundary scattering. The grain boundary scattering mainly depends on the grain size and the structure densification degree.
Figure 2 shows single-factor analysis of the orthogonal experiment, where R1, R2 and R3 represent levels 1, 2 and 3. It shows that the resistivity of ITO nanoparticles decreases continuously as the level of each factor changes from R1 to R3. It can be observed that the curves of MS/MC and tc decreased dramatically, while the curves of NIn/Na and th exhibited a slight bend, indicating that the effects of MS/MC and tc are greater than those of NIn/Na and th on the resistivity. The results are consistent with the above results of range and variance analysis.
As shown in Figure 2, the resistivity of ITO nanoparticles exhibits a continuously decreasing tendency with the decrease in MS/MC. The microemulsion system is more stable with the increase in co-surfactant; hence the size of ITO precursor particles is uniform, and the dispersion of particles is improved [34], resulting in a higher μg and lower resistivity. Similarly, the resistivity of ITO nanoparticles decreases continuously with the decrease in NIn/Na. It has been reported that the concentration of precipitant has an influence on growth rate and formation rate of crystal [35]. Sufficient precipitant not only ensures the complete precipitation of metal ions but also makes the particle size of R3 more uniform than others, which is conducive to the decrease in resistivity. In addition, the resistivity of ITO nanoparticles decreases significantly with the increase in calcination temperature and calcination time. That could be attributed to the large grain size caused by the high calcination temperature and long calcination time. The large grain size increases the contact area between nanoparticles and decreases interface resistivity [36], leading to the decrease in resistivity.

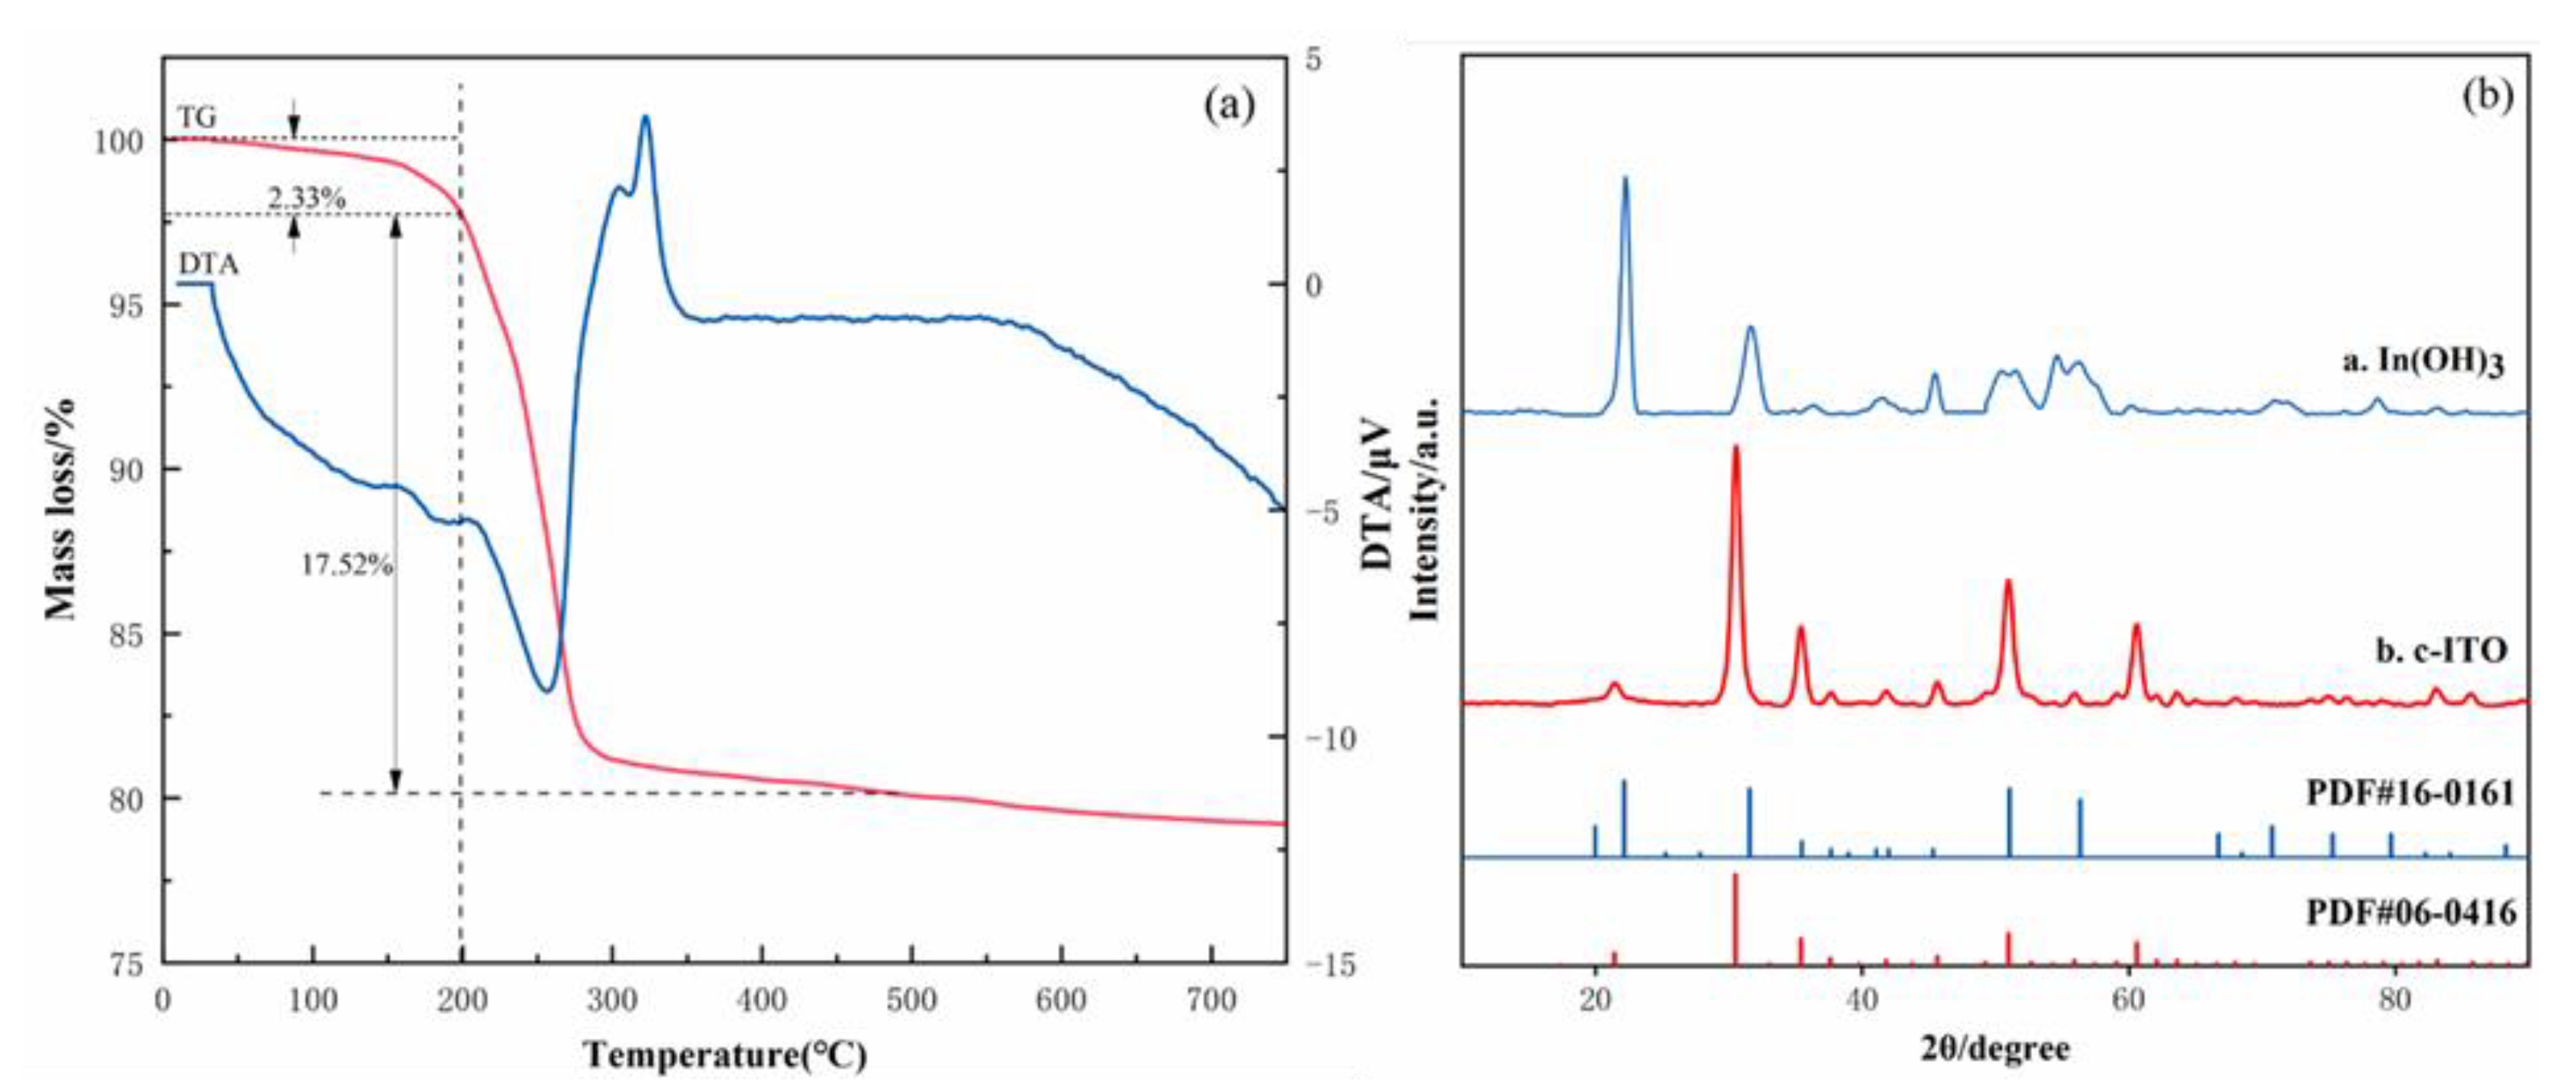
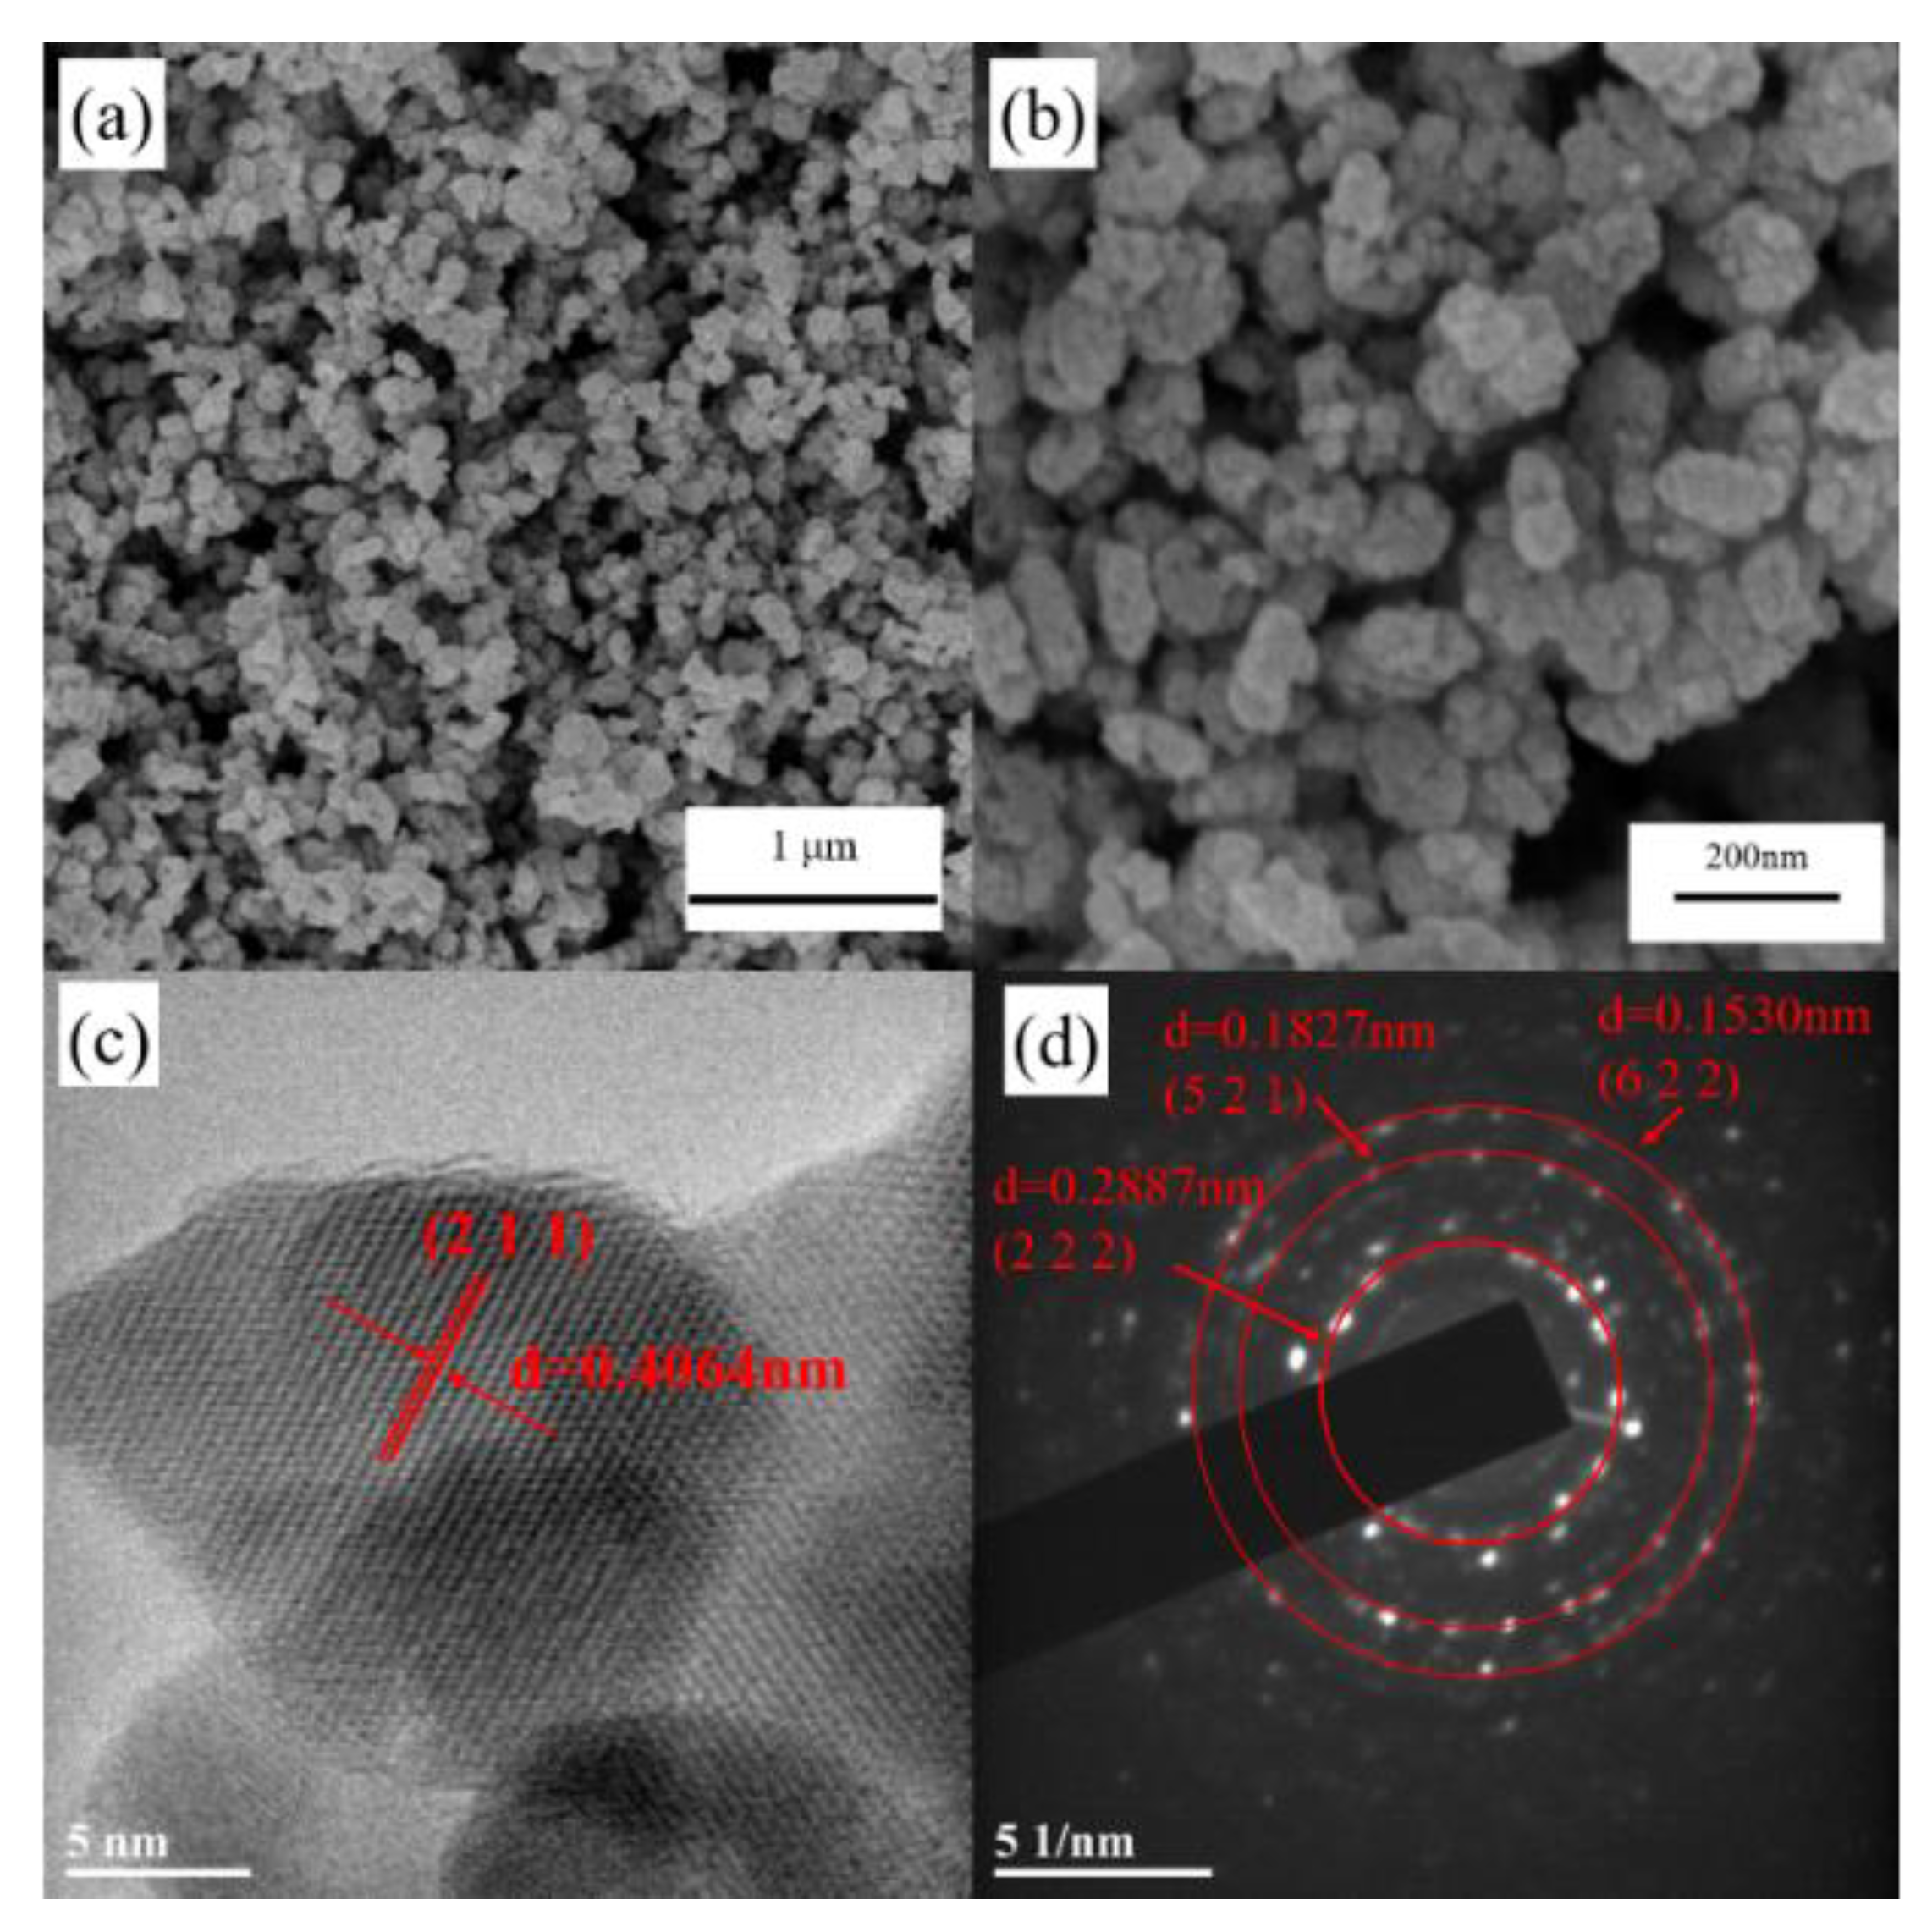
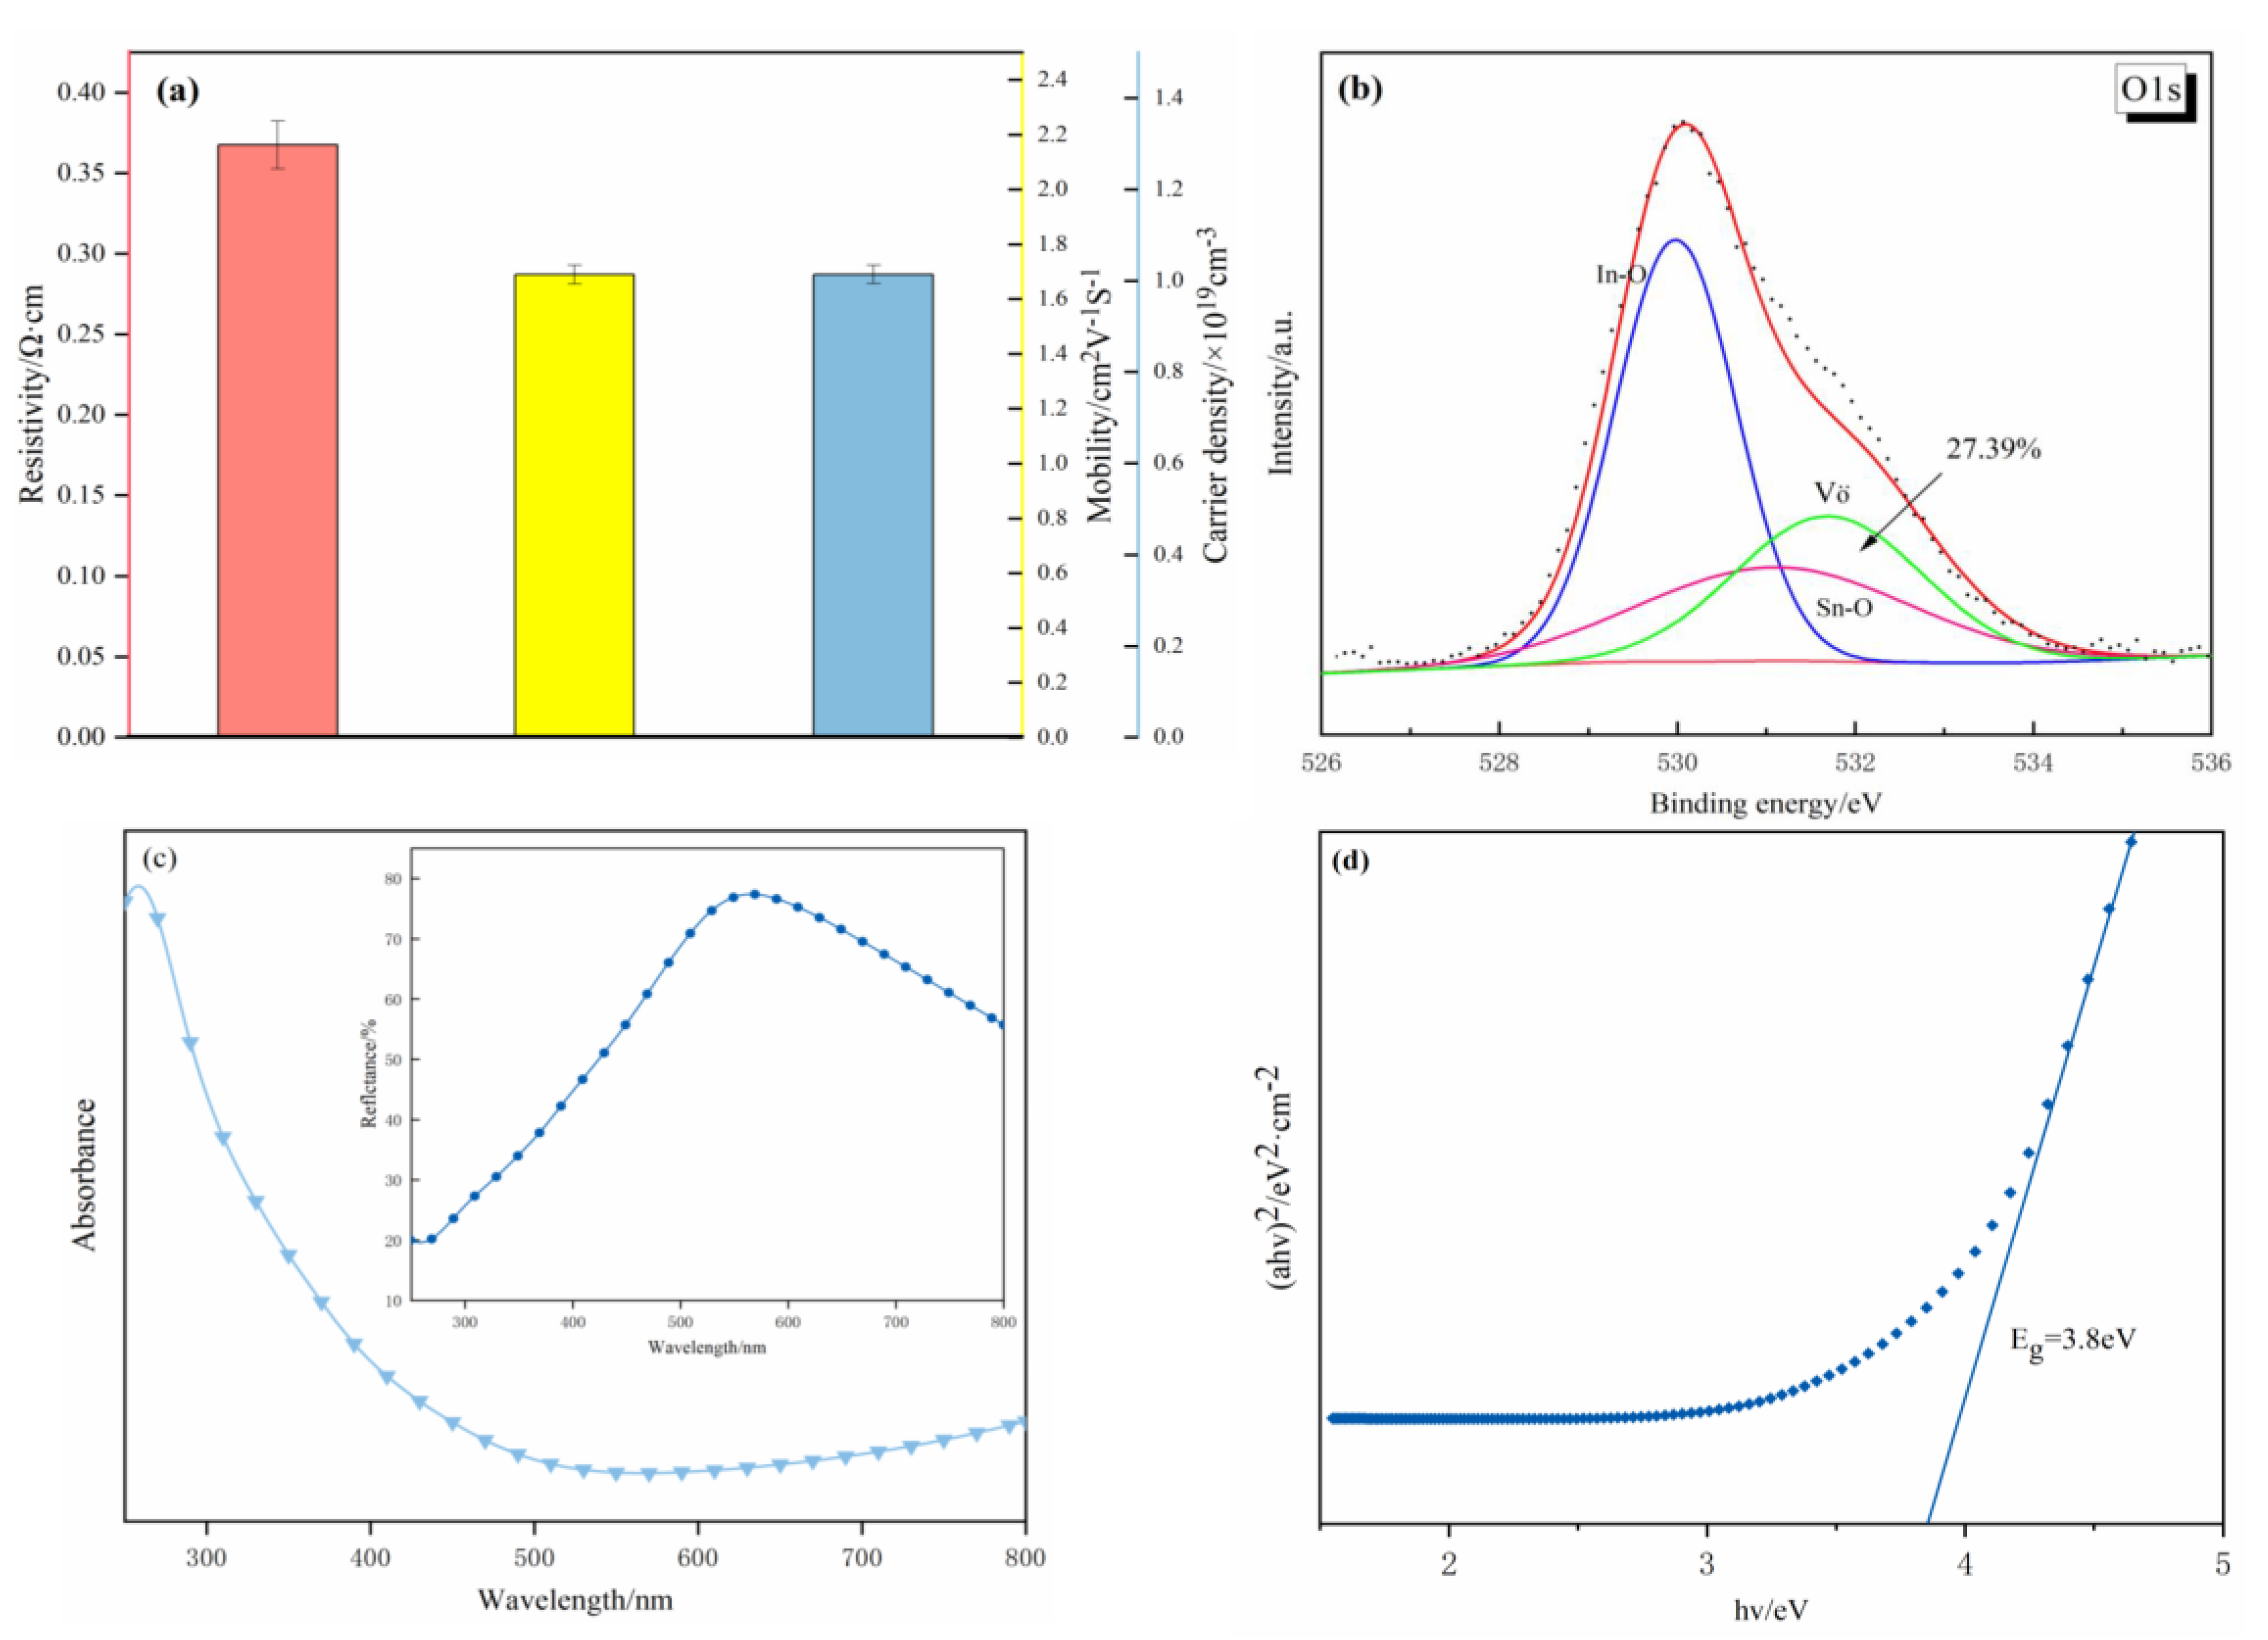
3.2. Characterization of ITO Nanoparticles

According to the analysis results of the orthogonal experiment, ITO nanoparticles were prepared under the optimum experimental conditions. Figure 3a shows the TG-DTA curves of the ITO precursor, revealing two main thermal decomposition steps. As shown in Figure 3a, the first exothermic reaction at 0–200 °C was mainly due to the evaporation of the adsorbed water and hydroxyl groups on the surface of ITO precursor, and the mass loss was about 2.33%. The second exothermic reaction at 200–500 °C can be attributed to the decomposition of hydroxide precursors into oxides by heating. The mass loss (17.52%) at this stage is higher than the theoretical mass loss (16.28%) of the transition from In(OH)3 to In2O3. That is attributed to the decomposition of the residual surfactants adsorbed by the precursor surface at 200–500 °C. When the calcination temperature was higher than 500 °C, mass loss did not reoccur, indicating that the phase transformation of ITO precursor was completed.
In order to further verify the above analysis, the XRD patterns of ITO nanoparticles and precursors are shown in Figure 3b. The diffraction peaks of the ITO precursor appeared at 2θ = 22.262°, 31.680°, 45.425°, 51.160° and 56.477°, which can be attributed to the crystal phase of In(OH)3. Moreover, there was no diffraction peak of other impurity phases, which is in good agreement with the TG results. The diffraction peaks of ITO nanoparticles appeared at 2θ = 30.580°, 35.466°, 45.691°, 51.037° and 60.676°, which can be attributed to c-ITO. In addition, there was no diffraction peak of SnO2 in the XRD pattern, confirming that Sn4+ was completely doped into the main lattice of In2O3. According to XRD diffraction patterns, grain size can be obtained by using the Debye–Scherrer formula (Equation (8)) [37,38]. The calculation results are listed in Table 5, and average grain size of crystalline ITO nanoparticles was 12 nm.
As the raw material of ITO films, the properties of ITO nanoparticles are closely related to the properties of ITO films. Compared with the ITO films in the literature [2,14,39], the peak positions of ITO nanoparticles prepared using the microemulsion method shifted to a large angle, and FWHM became wider. The reason may be the existence of residual stress in ITO nanoparticles. In other words, the residual stress in ITO nanoparticles is an important factor affecting the XRD peak position shift and FWHM broadening and will also affect the lattice parameters of ITO nanoparticles.
D = 0.89 λ β H K L cos θ ,
After the crystal phase analysis of crystalline ITO nanoparticles and the precursor, the microstructure analysis of ITO nanoparticles was carried out. Figure 4a,b show the SEM images of crystalline ITO nanoparticles. It can be seen that ITO particles agglomerate into aggregates with a length of 100 nm and a width of 60 nm. The particles are uniformly distributed, but the dispersion is poor. This can probably be attributed to the fact that the surfactant could not effectively disperse the primary particles, resulting in ITO aggregates formation. Figure 4c shows the HRTEM image of crystalline ITO nanoparticles. It can be seen that the interplanar spacing is 0.4064 nm, corresponding to the typical (211) plane of c-ITO. Figure 4d shows the selected electron diffraction (SAED) pattern of ITO nanoparticles. As shown in Figure 4d, the pattern exhibits halo rings and discrete spots, which confirms that the ITO nanoparticles have a polycrystalline structure. Furthermore, the three diffraction rings could be attributed to the (222), (521) and (622) plane of c-ITO without any indication of other oxides, which further verifies that Sn4+ was doped with In2O3 lattice and a single c-ITO structure was formed.
In the analysis in the previous section, we mentioned that the residual stress of ITO nanoparticles will affect its lattice parameters. Li et al. [40] prepared high-performance ITO film using the sol-gel method. In their work, different lattice plane distances are measured through the inversed FFT image: d211 = 0.413 nm, d222 = 0.292 nm, d400 = 0.252 nm. Compared with the above ITO films, the d211 = 0.4064 and d222 = 0.2887 of ITO nanoparticles are smaller. This shows that the lattice distance of ITO nanoparticles is shifted due to the influence of residual stress.
The change of the lattice distance of ITO nanoparticles affects the lattice parameters. The change of lattice parameters causes the absorption edge of ITO nanoparticles to shift and then affect the band gap (Eg) of ITO nanoparticles.
As they are used as semiconductor materials, it is necessary to measure the electrical properties of ITO nanoparticles. Figure 5a shows the resistivity, carrier concentration and mobility of ITO nanoparticles. The resistivity of ITO nanoparticles is 0.3675 Ω·cm, the carrier concentration is 1.0107 × 1019 cm−3 and the mobility is 1.68445 cm2V−1s−1. As shown in Table 6, the resistivity of ITO nanoparticles prepared in this experiment is obviously lower than those of Ref [16], Ref [36] and so on. Figure 5b shows the O1S XPS spectrum of ITO nanoparticles, and it could be deconvoluted into three peaks: 529.90 eV (In-O), 530.65 eV (Sn-O) and 531.65 eV (oxygen vacancy) [41]. This shows that the oxygen vacancy content of ITO nanoparticles is 27.39%. It has been reported that high oxygen vacancy content is beneficial to an increase in carrier concentration [42], leading to lower resistivity. In addition, the band gap of ITO nanoparticles is also related to carrier concentration [43]. Figure 5c shows the UV-Vis diffuse reflectance spectra and the corresponding absorption spectra of ITO nanoparticles. Based on the following formula conversion [44,45]:
A = (1 − Rx)2/(2Rx),
hv)2 = A(hvEg),
where α, hv, Eg and A are the absorption coefficient, photon energy, optical band gap and the parameter that relates to the effective masses, respectively. The band gap can be obtained by the extrapolated values of the linear section (see Figure 5d). The band gap of c-ITO nanoparticles (3.80 eV) is higher than that (3.60 eV) of ITO nanoparticles reported in the literature [46]. According to Burstein–Moss shift theory, for doped and highly degenerate ITO nanoparticles, the higher the carrier concentration the higher the band gap [47]. Consequently, it is obvious that ITO nanoparticles with a high band gap have excellent electrical properties.
In the previous section, we mentioned the influence of residual stress on ITO particles, which changed the lattice parameters of the particles compared with ITO film. The change of lattice parameters results in the deviation of the absorption edge of ITO nanoparticles, and finally, the deviation of its band gap was compared with ITO films [2].

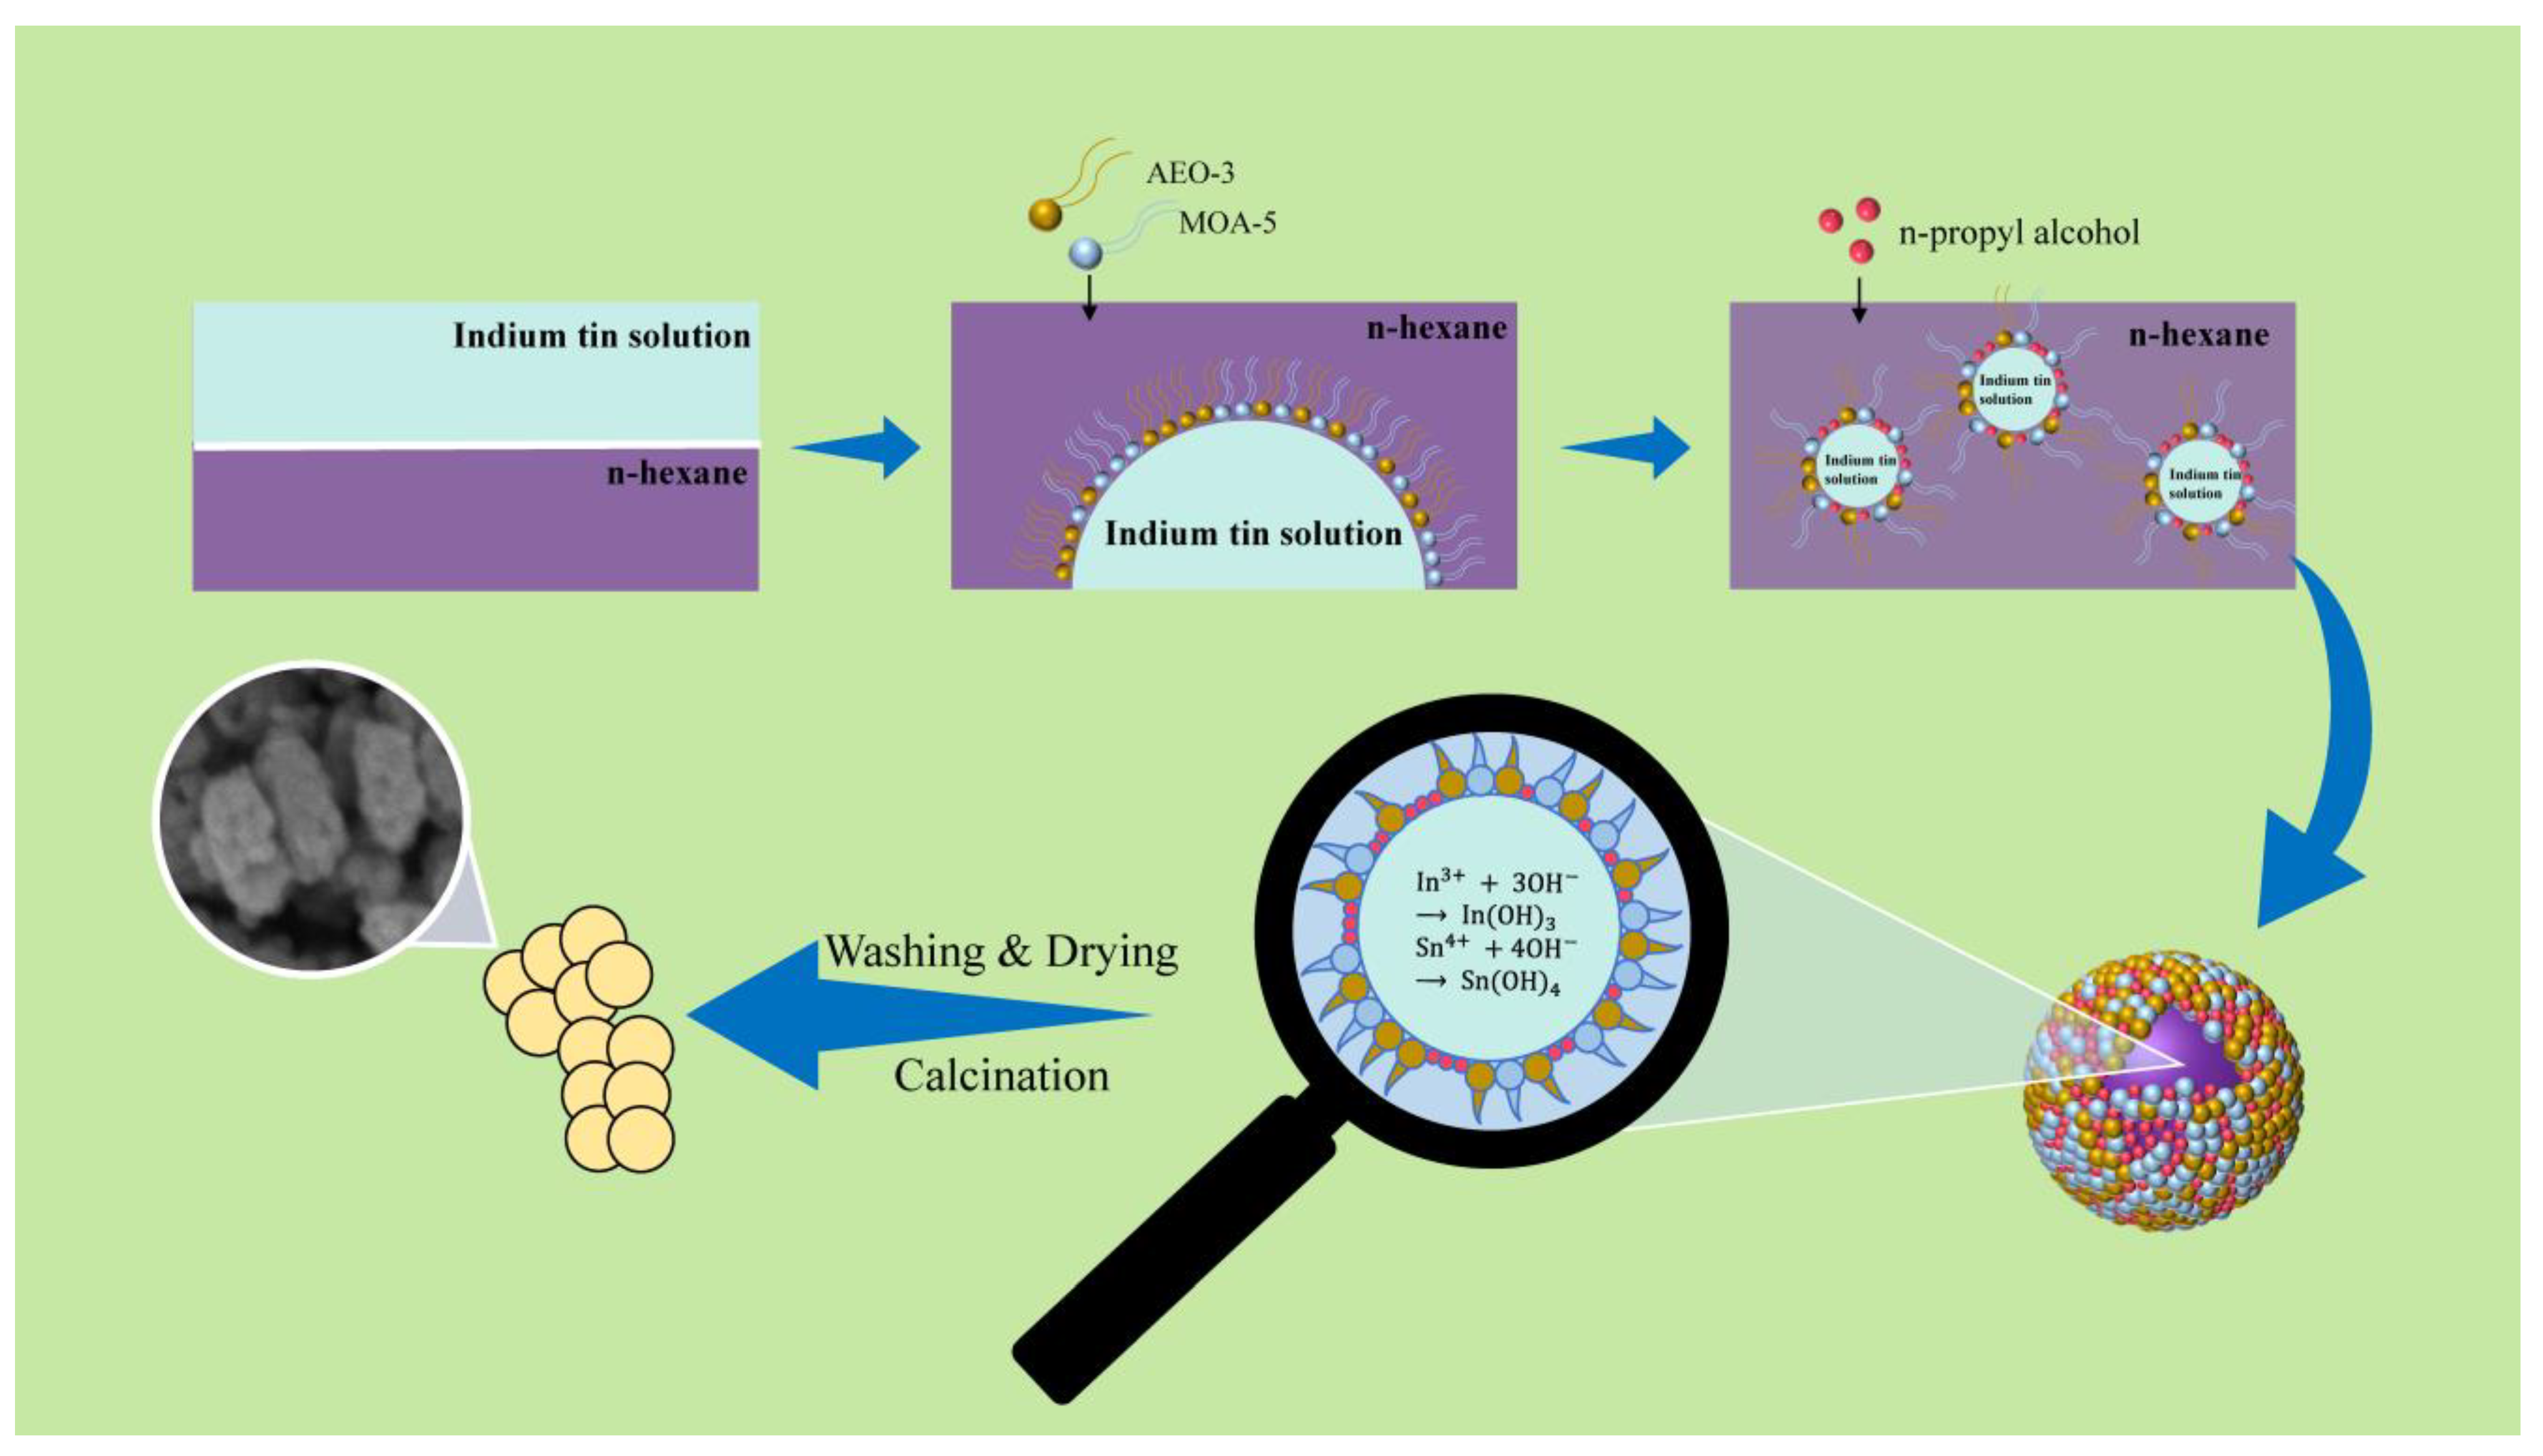
4. Preparation Mechanism of Crystalline ITO Nanoparticles

Though a microemulsion appears to be macroscopically homogenous, microemulsion preparation is not simple. It is important for microemulsion preparation to investigate the pseudo-ternary phase diagrams. Significantly, the pseudo-ternary phase diagrams could generally be obtained using the titration method, keeping the relative concentration of any two constituents (oil/surfactant/water/co-surfactant) fixed. In this paper, the relative concentrations of surfactant and co-surfactant were fixed, and the pseudo ternary phase diagrams were obtained for microemulsion preparation (see Figure S1). The microemulsion method takes advantage of microemulsion droplets formed with the surfactant and co-surfactant, and the ITO precursor solution is packed into microemulsion droplets, resulting in the formation of fine ITO nanoparticles with good dispersion.
Microemulsion droplets play two roles in this process; firstly, as a nanoreactor that provides a reaction place for preparing ITO precursor, and secondly, as a soft template that controls the morphology and size of the ITO precursor to a certain extent. The preparation mechanism of ITO nanoparticles using the microemulsion method is shown in Figure 6. Because the surfactant could reduce the interfacial tension between two immiscible phases [34], the addition of AEO-3 and MOA-5 as surfactants contributes to the water-in-oil (W/O) emulsion formation of indium tin solution and n-hexane. In order to further reduce the particle size and agglomeration, the n-propyl alcohol as a co-surfactant is added to the above solution. According to the negative interfacial tension theory, the addition of a co-surfactant could break the equilibrium between the two phases and make the effective interfacial tension negative, which leads to interfacial expansion and the formation of smaller droplets [50]. In microemulsion droplets, the metal ions (In3+ and Sn4+) react with the precipitant to produce an ITO precursor. As the calcination proceeds, the organic residues and precursor are easily decomposed, eventually forming the fine ITO nanoparticles.

5. Conclusions

In this paper, we have reported a new strategy for the preparation of ITO nanoparticles using the microemulsion method. Firstly, the orthogonal experiment was used to optimize the process conditions of preparing ITO nanoparticles using the microemulsion method. The optimum conditions are as follows: Ms/Mc = 5:3, NIn/Na = 1:20, tc = 700 °C, th = 4 h. Subsequently, under the optimal synthesis conditions, the c-ITO nanoparticles presented a low resistivity of 0.3675 Ω·cm, a carrier concentration of 1.0107 × 1019 cm−3, a mobility of 1.68445 cm2V−1s−1, an oxygen vacancy content of 27.39% and a band gap of 3.8 eV. Finally, the formation mechanism of ITO nanoparticles using the microemulsion method was systematically investigated, and the distribution ratio of each microemulsion component in the experiment was determined using a pseudo ternary phase diagram. The experimental results show that the microemulsion method can prepare high-performance ITO nanoparticles. This work provides a new direction for the preparation of ITO powder and promotes the development of ITO nanocomposites.

Supplementary Materials

The following are available online at https://www.mdpi.com/article/10.3390/cryst11111387/s1, Figure S1: Pseudo-ternary phase diagram of microemulsion with different surfactant and cosurfactant ratios (a) 5:1, (b) 5:2, (c) 5:3.

Author Contributions

Conceptualization, Z.J.; methodology, Z.J.; software, T.L.; validation, Z.J.; formal analysis, Z.J.; investigation, X.Z.; resources, J.L.; data curation, Z.J.; writing—original draft preparation, Z.J.; writing—review and editing, Z.J., T.L. and J.L.; visualization, Z.J.; supervision, J.L.; project administration, J.L. All authors have read and agreed to the published version of the manuscript.

Funding

This work was financially supported by the Beijing Natural Science Foundation (Grant No. 2192041).

Data Availability Statement

Not available.

Conflicts of Interest

There are no conflict of interest to declare.

References

  1. Aziz, A.; Zahir, H.; Shaikh, M.N.; Al-Betar, A.-R.; Oyama, M.; Sulaiman, K.O. Hydrothermal synthesis of tin-doped indium oxide nanoparticles using pamoic acid as an organic additive and their photoluminescence properties. J. Mater. Sci. Mater. Electron. 2017, 28, 3226–3233. [Google Scholar] [CrossRef]
  2. Yang, S.; Sun, B.; Liu, Y.; Zhu, J.; Song, J.; Hao, Z.; Zeng, X.; Zhao, X.; Shu, Y.; Chen, J.; et al. Effect of ITO target crystallinity on the properties of sputtering deposited ITO films. Ceram. Int. 2020, 46, 6342–6350. [Google Scholar] [CrossRef]
  3. Mei, F.; Yuan, T.; Li, R.; Qin, K.; Zhou, L.; Wang, W. Micro-structure of ITO ceramics sintered at different temperatures and its effect on the properties of deposited ITO films. J. Eur. Ceram. Soc. 2018, 38, 521–533. [Google Scholar] [CrossRef]
  4. Huang, J.; Yuan, T.; Mei, F.; Li, R. Effects of cerium oxide doping on the microstructure and properties of ITO targets and the photoelectric properties of the films. J. Mater. Sci. Mater. Electron. 2019, 30, 15469–15481. [Google Scholar] [CrossRef]
  5. Solieman, A.; Moharram, A.H.; Aegerter, M.A. Patterning of nanoparticulate transparent conductive ITO films using UV light irradiation and UV laser beam writing. Appl. Surf. Sci. 2010, 256, 1925–1929. [Google Scholar] [CrossRef]
  6. Liu, Y.; Sun, J.; Liu, H.; Seo, D.-S. Super fast switching and low operating of liquid crystals sandwiched between ion beam-spurted ITO thin layers. Liq. Cryst. 2018, 46, 1052–1059. [Google Scholar] [CrossRef]
  7. Krajangsang, T.; Thongpool, V.; Piromjit, C.; Sriprapha, K. Development of indium tin oxide stack layer using oxygen and argon gas mixture for crystalline silicon heterojunction solar cells. Opt. Mater. 2020, 101, 109743. [Google Scholar] [CrossRef]
  8. Abdulkadir, A.; Aziz, A.A.; Pakhuruddin, M.Z. Properties of indium tin oxide on black silicon after post-deposition annealing for heterojunction solar cells. Results Phys. 2020, 19, 103405. [Google Scholar] [CrossRef]
  9. Janković, B. Isothermal thermo-analytical study and decomposition kinetics of non-activated and mechanically activated indium tin oxide (ITO) scrap powders treated by alkaline solution. Trans. Nonferrous Met. Soc. China 2015, 25, 1657–1676. [Google Scholar] [CrossRef]
  10. Xu, S.; Shi, Y. Low temperature high sensor response nano gas sensor using ITO nanofibers. Sens. Actuators B Chem. 2009, 143, 71–75. [Google Scholar] [CrossRef]
  11. Honga, J.-W.; Guo, Y.-W.; Shin, J.-Y.; Kim, T.W. Performance Enhancement of Organic Light-emitting Diodes with an Electron-transport Layer of Bathocuproine. Trans. Electr. Electron. Mater. 2016, 17, 37–40. [Google Scholar] [CrossRef] [Green Version]
  12. Besbes, S.; Ben Ouada, H.; Davenas, J.; Ponsonnet, L.; Jaffrezic, N.; Alcouffe, P. Effect of surface treatment and functionalization on the ITO properties for OLEDs. Mater. Sci. Eng. C 2006, 26, 505–510. [Google Scholar] [CrossRef]
  13. Ma, W.H.; Cai, C.L. Studying on Thickness Control of ITO Films Deposited Using RF Magnetron Sputtering. Adv. Mater. Res. 2011, 415–417, 1921–1924. [Google Scholar] [CrossRef]
  14. Mei, F.; Yuan, T.; Li, R.; Huang, J. A Comparative Study on the Microstructure and Properties of ITO Targets and Thin Films Prepared from Two Different Powders. Acta Met. Sin. (Engl. Lett.) 2021, 34, 675–693. [Google Scholar] [CrossRef]
  15. Wu, M.; Wang, C.; Zhao, Y.; Xiao, L.; Zhang, C.; Yu, X.; Luo, B.; Hu, B.; Fan, W.; Shi, W. Hydrothermal synthesis of porous rh-In2O3nanostructures with visible-light-driven photocatalytic degradation of tetracycline. Cryst. Eng. Comm. 2015, 17, 2336–2345. [Google Scholar] [CrossRef]
  16. Senthilkumar, V.; Senthil, K.; Vickraman, P. Microstructural, electrical and optical properties of indium tin oxide (ITO) nanoparticles synthesized by co-precipitation method. Mater. Res. Bull. 2012, 47, 1051–1056. [Google Scholar] [CrossRef]
  17. Yang, G.J.; Park, S.J. Conventional and Microwave Hydrothermal Synthesis and Application of Functional Materials: A Review. Materials 2019, 12, 1177. [Google Scholar] [CrossRef] [PubMed] [Green Version]
  18. Sun, Y.R.; Fan, T.; Wang, C.A.; Ma, L.G.; Liu, F. Template Induced Synthesis of Nano-Hydroxyapatite by Co-Precipitation Method. Adv. Mater. Res. 2011, 311–313, 1713–1716. [Google Scholar] [CrossRef]
  19. Wang, G.Y. Research Progress in Solvothermal Synthesis of Nano Functional Materials. Adv. Mater. Res. 2012, 531, 223–226. [Google Scholar] [CrossRef]
  20. Lou, S.; Zhou, Z.; Gan, W.; Xuan, T.; Bao, Z.; Si, S.; Cao, L.; Li, H.; Xia, Z.; Qiu, J.; et al. In situ synthesis of high-efficiency CsPbBr3/CsPb2Br5 composite nanocrystals in aqueous solution of microemulsion. Gr. Chem. 2020, 22, 5257–5261. [Google Scholar] [CrossRef]
  21. Chen, J.; Shi, T.; Duan, L.; Sun, Z.; Anthony, E.J. Microemulsion-derived, nanostructured CaO/CuO composites with controllable particle grain size to enhance cyclic CO2 capture performance for combined Ca/Cu looping process. Chem. Eng. J. 2020, 393, 124716. [Google Scholar] [CrossRef]
  22. Li, Y.; Zhang, S.; Wang, S.; He, Z.; Zhou, Y.; Ren, H. Structure, surface tension, and rheological behaviors of hydrophobically associative polyacrylamides by self-emulsified microemulsion polymerization. J. Appl. Polym. Sci. 2020, 137, 49234. [Google Scholar] [CrossRef]
  23. Lin, G.; Cortez-Jugo, C.; Ju, Y.; Besford, Q.A.; Ryan, T.M.; Pan, S.; Richardson, J.J.; Caruso, F. Microemulsion-Assisted Templating of Metal-Stabilized Poly(ethylene glycol) Nanoparticles. Biomacromolecules 2021, 22, 612–619. [Google Scholar] [CrossRef] [PubMed]
  24. Zhan, Z.; Song, W.; Jiang, D. Preparation of nanometer-sized In2O3 particles by a reverse microemulsion method. J. Colliods Interface Sci. 2004, 271, 366–371. [Google Scholar] [CrossRef]
  25. Yang, J.; Lin, C.; Wang, Z.; Lin, J. In(OH)3 and In2O3 Nanorod Bundles and Spheres: Microemulsion-Mediated Hydrothermal Synthesis and Luminescence Properties. Inorg. Chem. 2006, 45, 8973–8979. [Google Scholar] [CrossRef]
  26. Devi, P.S.; Chatterjee, M.; Ganguli, D. Indium tin oxide nano-particles through an emulsion technique. Mater. Lett. 2002, 55, 205–210. [Google Scholar] [CrossRef]
  27. Hu, X.; Yang, H.; Guo, T.; Shu, D.; Shan, W.; Li, G.; Guo, D. Preparation and properties of Eu and Dy co-doped strontium aluminate long afterglow nanomaterials. Ceram. Int. 2018, 44, 7535–7544. [Google Scholar] [CrossRef]
  28. Tan, Y.; Luo, X.; Mao, M.; Shu, D.; Shan, W.; Li, G.; Guo, D. Optimization red emission of SrMoO4: Eu3+ via hydro-thermal co-precipitation synthesis using orthogonal experiment. Curr. Appl. Phys. 2018, 18, 1403–1409. [Google Scholar] [CrossRef]
  29. Shan, W.; Wu, L.; Tao, N.; Chen, Y.; Guo, D. Optimization method for green SrAl2O4:Eu2+, Dy3+ phosphors synthesized via co-precipitation route assisted by microwave irradiation using orthogonal experimental design. Ceram. Int. 2015, 41, 15034–15040. [Google Scholar] [CrossRef]
  30. Fu, J.; Hu, X.; Luan, F.; Li, G.; Guo, D. Optimum synthesis and properties of NaBiF4:Yb/Er upconversion nanoparticles. Ceram. Int. 2019, 45, 24365–24374. [Google Scholar] [CrossRef]
  31. Igasaki, Y.; Kanma, H. Argon gas pressure dependence of the properties of transparent conducting ZnO:Al films deposited on glass substrates. Appl. Surf. Sci. 2001, 169–170, 508–511. [Google Scholar] [CrossRef]
  32. Gupta, R.; Ghosh, K.; Patel, R.; Kahol, P. Effect of substrate temperature on opto-electrical properties of Nb-doped In2O3 thin films. J. Cryst. Growth 2008, 310, 4336–4339. [Google Scholar] [CrossRef]
  33. Zhang, D.H.; Ma, H.L. Scattering mechanisms of charge carriers in transparent conducting oxide films. Appl. Phys. A 1996, 62, 487–492. [Google Scholar] [CrossRef]
  34. Ganguli, A.K.; Ganguly, A.; Vaidya, S. Microemulsion-based synthesis of nanocrystalline materials. Chem. Soc. Rev. 2010, 39, 474–485. [Google Scholar] [CrossRef]
  35. Yousefi, S.; Ghasemi, B. Precipitator concentration-dependent opto-structural properties of MgO nanoparticles fabricated using natural brine. SN Appl. Sci. 2020, 2, 1–10. [Google Scholar] [CrossRef]
  36. Ma, Y.; Zhai, X.; Liu, J. Synthesis of hexagonal-phase indium tin oxide nanoparticles by deionized water and glycerol binary solvothermal method and their resistivity. J. Mater. Sci. 2020, 55, 3860–3870. [Google Scholar] [CrossRef]
  37. Kumar, P.; Kumar, P.; Kumar, A.; Meena, R.; Tomar, R.; Chand, F.; Asokan, K. Structural, morphological, electrical and dielectric properties of Mn doped CeO2. J. Alloys Compd. 2016, 672, 543–548. [Google Scholar] [CrossRef]
  38. Baghi, R.; Zhang, K.; Wang, S.; Hope-Weeks, L.J. Conductivity tuning of the ITO sol-gel materials by adjusting the tin oxide concentration, morphology and the crystalline size. Microporous Mesoporous Mater. 2017, 244, 258–263. [Google Scholar] [CrossRef]
  39. Kim, H.; Horwitz, J.S.; Kim, W.H.; Kafafi, Z.H.; Chrisey, U.B. Highly oriented indium tin oxide thin films for organic light-emitting diodes. Int. Symp. Opt. Sci. Technol. 2002, 4464, 76–84. [Google Scholar] [CrossRef]
  40. Li, Y.; Zhao, G.; Ren, Y.; Chen, D. Microstructure analysis of sol-gel-derived nanocrystalline ITO thin films. Surf. Interface Anal. 2011, 43, 1199–1202. [Google Scholar] [CrossRef]
  41. Zhai, X.; Zhang, Y.; Chen, Y.; Ma, Y.; Liu, J. Controllable phase transition ITO nano powders and temperature-structure sensitivity. Chem. Phys. Lett. 2020, 742, 137174. [Google Scholar] [CrossRef]
  42. Liang, F.; Liu, J.-X. Photoluminescence properties of hexagonal indium tin oxide nanopowders prepared by solvothermal method. Rare Met. 2017, 37, 47–53. [Google Scholar] [CrossRef]
  43. Xu, J.; Wang, S.; Ding, H.; Pan, S.; Zhang, Y.; Li, G. Influence of post-annealing on the structure and optical properties of ITO nanocrystals prepared by electrochemical method. Mater. Res. Bull. 2012, 47, 4457–4462. [Google Scholar] [CrossRef]
  44. Senthilkumar, V.; Vickraman, P.; Jayachandran, M.; Sanjeeviraja, C. Structural and optical properties of indium tin oxide (ITO) thin films with different compositions prepared by electron beam evaporation. Vacuum 2010, 84, 864–869. [Google Scholar] [CrossRef]
  45. Jeevanandam, P.; Mulukutla, R.S.; Phillips, M.; Chaudhuri, S.; Erickson, L.E.; Klabunde, K.J. Near Infrared Reflectance Properties of Metal Oxide Nanoparticles. J. Phys. Chem. C 2007, 111, 1912–1918. [Google Scholar] [CrossRef]
  46. Wang, T.; Radovanovic, P.V. Free Electron Concentration in Colloidal Indium Tin Oxide Nanocrystals Determined by Their Size and Structure. J. Phys. Chem. C 2010, 115, 406–413. [Google Scholar] [CrossRef]
  47. Ray, S.; Banerjee, R.; Basu, N.; Batabyal, A.K.; Barua, A.K. Properties of tin doped indium oxide thin films prepared by magnetron sputtering. J. Appl. Phys. 1983, 54, 3497–3501. [Google Scholar] [CrossRef]
  48. Shong, B.; Shin, N.; Lee, Y.-H.; Ahn, K.H.; Lee, Y.-W. Synthesis of indium tin oxide (ITO) nanoparticles in supercritical methanol. J. Supercrit. Fluids 2016, 113, 39–43. [Google Scholar] [CrossRef]
  49. Wei, X. Effect of fabrication conditions on the properties of indium tin oxide powders. Chin. Phys. B 2008, 17, 6. [Google Scholar] [CrossRef]
  50. Patashinski, A.Z.; Orlik, R.; Paclawski, K.; Ratner, M.A.; Grzybowski, B.A. The unstable and expanding interface between reacting liquids: Theoretical interpretation of negative surface tension. Soft Matter 2012, 8, 1601–1608. [Google Scholar] [CrossRef]
Figure 1. Flow chart of ITO nanoparticles prepared using the microemulsion method.
Crystals 11 01387 g001
Figure 2. The effect of a single factor on the resistivity.
Crystals 11 01387 g002
Figure 3. TG-DTA, XRD pattern of ITO precursor and XRD pattern of ITO nanoparticles: (a) TG-DTA curves of ITO precursor; (b) XRD pattern of ITO nanoparticles and precursor.
Crystals 11 01387 g003
Figure 4. The morphology and microstructure of ITO nanoparticles: (a,b) SEM; (c) HRTEM; and (d) SAED.
Crystals 11 01387 g004
Figure 5. Electrical properties, XPS, diffusion reflection spectra of ITO nanoparticles: (a) electrical properties; (b) eeconvolution O 1s XPS spectra; (c) UV-Vis absorption spectra (insert of diffusion reflection); (d) plot of (αhv)2 as function of hv.
Crystals 11 01387 g005
Figure 6. Preparation mechanism of ITO nanoparticles using the microemulsion method.
Crystals 11 01387 g006
Table 1. Factors and levels for orthogonal experiment.
FactorsMs/Mc
(A)
NIn/Na
(B)
tc (°C)
(C)
th (h)
(D)
Levels
5:11:105002
5:21:156003
5:31:207004
Table 2. Orthogonal experiment plan and results.
RunFactorResistivity Rik (Ω·cm)
ABCD12
1111116.10017.175
212227.6166.828
313333.7103.310
421233.1903.506
522312.8843.262
623129.7667.760
731321.7321.412
832137.9968.864
933211.8681.470
Table 3. Range analysis of experiment data.
RunFactorResistivity Rik (Ω·cm)
ABCD12
1111116.10017.175
212227.6166.828
313333.7103.310
421233.1903.506
522312.8843.262
623129.7667.760
731321.7321.412
832137.9968.864
933211.8681.470
R154.73943.11567.66142.759
R230.36837.45024.47835.114
R323.34227.88416.31030.576
R31.39715.23151.35112.183
Table 4. Variance analysis of experiment data.
RunFactorResistivity Rik (Ω·cm)
ABCD12
1111116.10017.175
212227.6166.828
313333.7103.310
421233.1903.506
522312.8843.262
623129.7667.760
731321.7321.412
832137.9968.864
933211.8681.470
R154.73943.11567.66142.759
R230.36837.45024.47835.114
R323.34227.88416.31030.576
R31.39715.23151.35112.183
Qj90.504576219.7546652250.21364412.6370112Qe = 3.6887865
fj2222fe = 9
Fj110.40774224.0989802305.23896915.4160588F0.05(2,9) = 4.26
F0.01(2,9) = 8.02
Table 5. Grain size of different planes of ITO NPs.
Peak Position (°)Β(FWHM)D (nm)D Average (nm)
30.580(222)0.76210.80
35.466(400)0.69611.99
45.691(431)0.57215.0711.99
51.037(440)0.86410.18
60.676(622)0.77111.92
Table 6. Resistivity comparison of ITO NPs.
FactorsMethodResistivity (Ω·cm)
Article
This paperMicroemulsion method0.3675
Ref [16].co-precipitation method4.900
Ref [36].solvothermal method1.258
Ref [48].solvothermal method0.64
Ref [49].co-precipitation method0.68
Publisher’s Note: MDPI stays neutral with regard to jurisdictional claims in published maps and institutional affiliations.

