Article

Electrochemical In Situ Fabrication of Titanium Dioxide Nanotubes on a Titanium Wire as a Fiber Coating for Solid-Phase Microextraction of Polycyclic Aromatic Hydrocarbons

College of Chemical Engineering, Lan Zhou City University, Lanzhou 730070, China
*
Author to whom correspondence should be addressed.
Crystals 2021, 11(11), 1384; https://doi.org/10.3390/cryst11111384
Submission received: 14 October 2021 / Revised: 7 November 2021 / Accepted: 10 November 2021 / Published: 12 November 2021
(This article belongs to the Special Issue Emerging Low-Dimensional Materials)

Abstract

:
A novel titanium dioxide nanotube (TiO2NTS) coated fiber for solid-phase microextraction (SPME) was prepared by in situ anodization of titanium wire in electrolyte containing ethylene glycol and ammonium fluoride (NH4F). The effects of different electrolyte solutions (NH4F and ethylene glycol) and oxidation voltages on the formation and size of TiO2NTs was studied. It was obtained from the experiment that TiO2NTs arrays were arranged with a wall thickness of 25 nm and the diameter of 100 nm pores in ethylene glycol and water (v/v, 1:1) containing NH4F of 0.5% (w/v) with a voltage of 20 V at 25 °C for 30 min. The TiO2NTs were used as solid-phase microextraction fiber coatings coupled with high-performance liquid chromatography (HPLC) in sensitive determination of polycyclic aromatic hydrocarbons (PAHs) in spiked real samples water. Under the optimized SPME conditions, the calibration curve has good linearity in the range of 0.20–500 μg·L−1, and the correlation coefficient (R2) is between 0.9980 and 0.9991. Relative standard deviations (RSDs) of 3.5–4.7% (n = 5) for single fiber repeatability and of 5.2% to 7.9% for fiber-to-fiber reproducibility (n = 3) was obtained. The limits of detection (LOD) (S/N = 3) and limits of quantification (LOQ) (S/N = 10) of PAHs were 0.03–0.05 µg·L−1 and 0.12–0.18 µg·L−1. The developed method was applied to the preconcentration and determination of trace PAHs in spiked real samples of water with good recoveries from 78.6% to 119% and RSDs from 4.3 to 8.9%, respectively.

1. Introduction

Solid-phase microextraction (SPME) has attracted extensive attention due to its high sensitivity, rapidity, simplicity and being free of solvents [1,2]. In principle, the technique is based on the distribution of the target analyte between the sample matrix and the thin extraction coating deposited on the fine solid fibers. Currently, microscale fused silica rods are used as the matrix for commercial SPME fibers. As a result, commercial SPME coatings are generally characterized by a low operating temperature, instability, less selectivity and swelling in organic solvents [3,4]. In addition, the SPME coating variety of the product is single, and the application is limited. To overcome the above problems, an important development in the SPME fiber preparation technology is to obtain a coating with high mechanical strength and good chemical stability by using a metal as a matrix to improve the sensitivity and selectivity of the coating to the target compound [5,6,7,8,9]. Metal nanofibers, in particular, have attracted the attention of many researchers due to their unique physical chemistry properties, including a large specific surface area, good chemical and thermal stability, and favorable adsorption performance [10,11]. These metal fibers with high mechanical strength and nanostructured coatings exhibit higher extraction capacity, faster extraction rate and better extraction selectivity for the target analytes. Due to the chemical inertness of the metal fiber surface, researchers proposed novel strategies to prepare novel metal SPME fibers [12,13,14].
Since the Gong group reported the formation of titanium dioxide porous structure by anodizing titanium foils in fluorine-containing aqueous electrolyte, various attempts were made to prepare TiO2 nanostructures by anodization [15,16]. At present, the preparation, characterization, and application of TiO2NTs have attracted wide attention. The importance of TiO2 is growing as a major component of photocatalysis and photovoltaic devices, as well as applications in sensors, biomedical coatings, preservatives or antioxidants [17,18,19,20].
The preparation methods include hydrothermal synthesis, template synthesis and anodization. TiO2NTs arrays not only have larger surfaces, but also possess some special properties, including unique electronic and chemical properties. The TiO2NTs prepared by anodization are perpendicularly orientated and well-aligned structures with controllable operation, good repeatability and a simple oxidation preparation process. In the application of titanium dioxide nanotubes, the dimensions of the nanotubes, such as the outer diameter and length, has a profound influence on its ability to produce an excellent performance. Different electrolytes will affect the morphology of coating, which will affect the extraction effect of TiO2NTs. PAHs are a kind of widely distributed organic pollutant which has carcinogenic, teratogenic and mutagenic effects, especially those containing four or more aromatic rings [21,22]. Many modern analytical techniques have been developed and applied to the determination of PAHs in environment water [23,24]. Since the concentration levels of PAHs are present in the aquatic environment at trace levels in complex matrices, this makes accurate determination difficult. Sample pretreatment in trace analysis is the bottleneck and the main source of error in the analysis process. Therefore, PAHs need to be enriched before instrumental analysis and determination.
At present, techniques for the enrichment of PAHs from environmental samples include solvent extraction [25,26], solid-phase extraction [27,28], SPME [29,30], pressurized liquid extraction [31] and supercritical fluid extraction [32]. The combination of SPME and HPLC is the most commonly used technology, which has the characteristics of a simple preparation method, high enrichment efficiency and less time consumption.
The shape of nano TiO2 produced by the in situ oxidation of titanium wire is closely related to the electrolyte. In this paper, we investigated the effects of fluoride concentration and the amount of ethylene glycol on the formation and dimensions of the TiO2NTs. The as-fabricated TiO2NTs coating was employed to extract polycyclic aromatic hydrocarbons (PAHs) with different ring numbers in combination with high-performance liquid chromatography-UV detection (HPLC-UV). Meanwhile, the extraction mechanism of PAHs by TiO2 nanotube fibers was discussed. It was found that the TiO2NTs coating exhibited high extraction capability and good selectivity for some PAHs from the water phase. Under the optimized SPME conditions, the fiber was used to measure PAHs in spiked real samples and from which we draw a satisfactory result.

2. Experimental

2.1. Chemicals and Reagents

A roll of Ti wire of 0.25 mm diameter with high purity was obtained from Alfa Aesar (Ward Hill, MA, USA). A 0.45 μm micropore membrane of polyvinylidene fluoride was supplied by Xingya Purifying Material Factory (Shanghai, China). Ammonium fluoride (NH4F) and ethylene glycol were obtained from Sinopharm Chemical Reagent Co., Ltd. (Shanghai, China). The HPLC-grade methanol was purchased from Yuwang Chemical Company (Shandong, China). Naphthalene (Nap), phenanthrene (Phe), fluorene (Flu), anthracene (Ant), fluoranthene (Flt), and pyrene (Pyr) were obtained from the Aldrich (Steinheim, Germany). Individual standard stock solutions were prepared in methanol at a concentration of 100 mg⋅L−1 and stored at 4 °C in the refrigerator. All other reagents were of analytical grade.

2.2. Instruments

Anodization of the Ti wire was performed with a precise WY-3D power supply (Nanjing, China). A Waters 600E multi-solvent delivery system (Milford, MA, USA) equipped with Waters 2487 dual λ absorbance detector and a Waters Sunfire C18 chromatographic column (150 mm × 4.6 mm, 5 μm) was used as all separations. A N2000 workstation (Zhejiang University, Hangzhou, China) was used for the acquisition of data. The mobile phase was methanol/water and the wavelength of UV detection was set at 254 nm. A desorption chamber was used in a commercially available Supelco SPME-HPLC interface (Bellefonte, PA, USA). Scanning electron microscope micrographs of TiO2 fibers were obtained on a field emission scanning electron microscope (Zeiss, Oberkochen, Germany) equipped with an energy dispersive X-ray (EDX) spectrometer. X-ray diffraction (XRD) was performed on a D8 Advance diffractometer (Bruker, Germany). Ultrapure water was obtained from the Sudreli-system (Chongqing, China). The DF-101S Magnetic stirrer (Zhengzhou, China) was used to heat and stir.

2.3. Preparation of SPME Fiber

The Ti wire was cut into lengths of 6 cm then thoroughly washed with ethanol, acetone and distilled water in sequence prior to the anodization. TiO2NTs were prepared by a potentiostatic anodization method in a two-electrode electrochemical cell. In a typical process, the commercial Ti wire (99.9%) was used as a working electrode, and a Pt rod as the counter electrode. Ti wire was anodized in different NH4F concentrations and the amount of ethylene glycol at a controlled potential of 20 V for 30 min at room temperature. After the anodization, the fiber was washed with deionized water and then dried in air.

2.4. The Procedure of SPME-HPLC

To carry out the extraction, 15 mL of the standard solution or sample solution was added into a 20 mL glass vial equipped with 1 cm magnetic stirrer bar inside and a Teflon septum. The TiO2NTs/Ti fiber was exposed to the heated and stirred sample solution for extraction. Subsequently, the fiber was pulled out and immersed into an SPME-HPLC interface using the static mode for desorption with mobile phase. After desorption, a six-port valve was switched from the load to inject position, the mobile phase was passed through the interface and PAHs were introduced into the analytical column at a flow rate of 1 mL·min−1 for analysis. The mixtures of methanol and water of 90/10 (v/v) were employed as mobile phases for HPLC analyses of PAHs at a flow rate of 1 mL⋅min−1. Corresponding chromatographic signals was monitored at 254 nm. For the next extraction, the fiber was immersed into methanol and ultrapure water to eliminate possible carry-over for 10 min and 5 min, respectively.

3. Results and Discussion

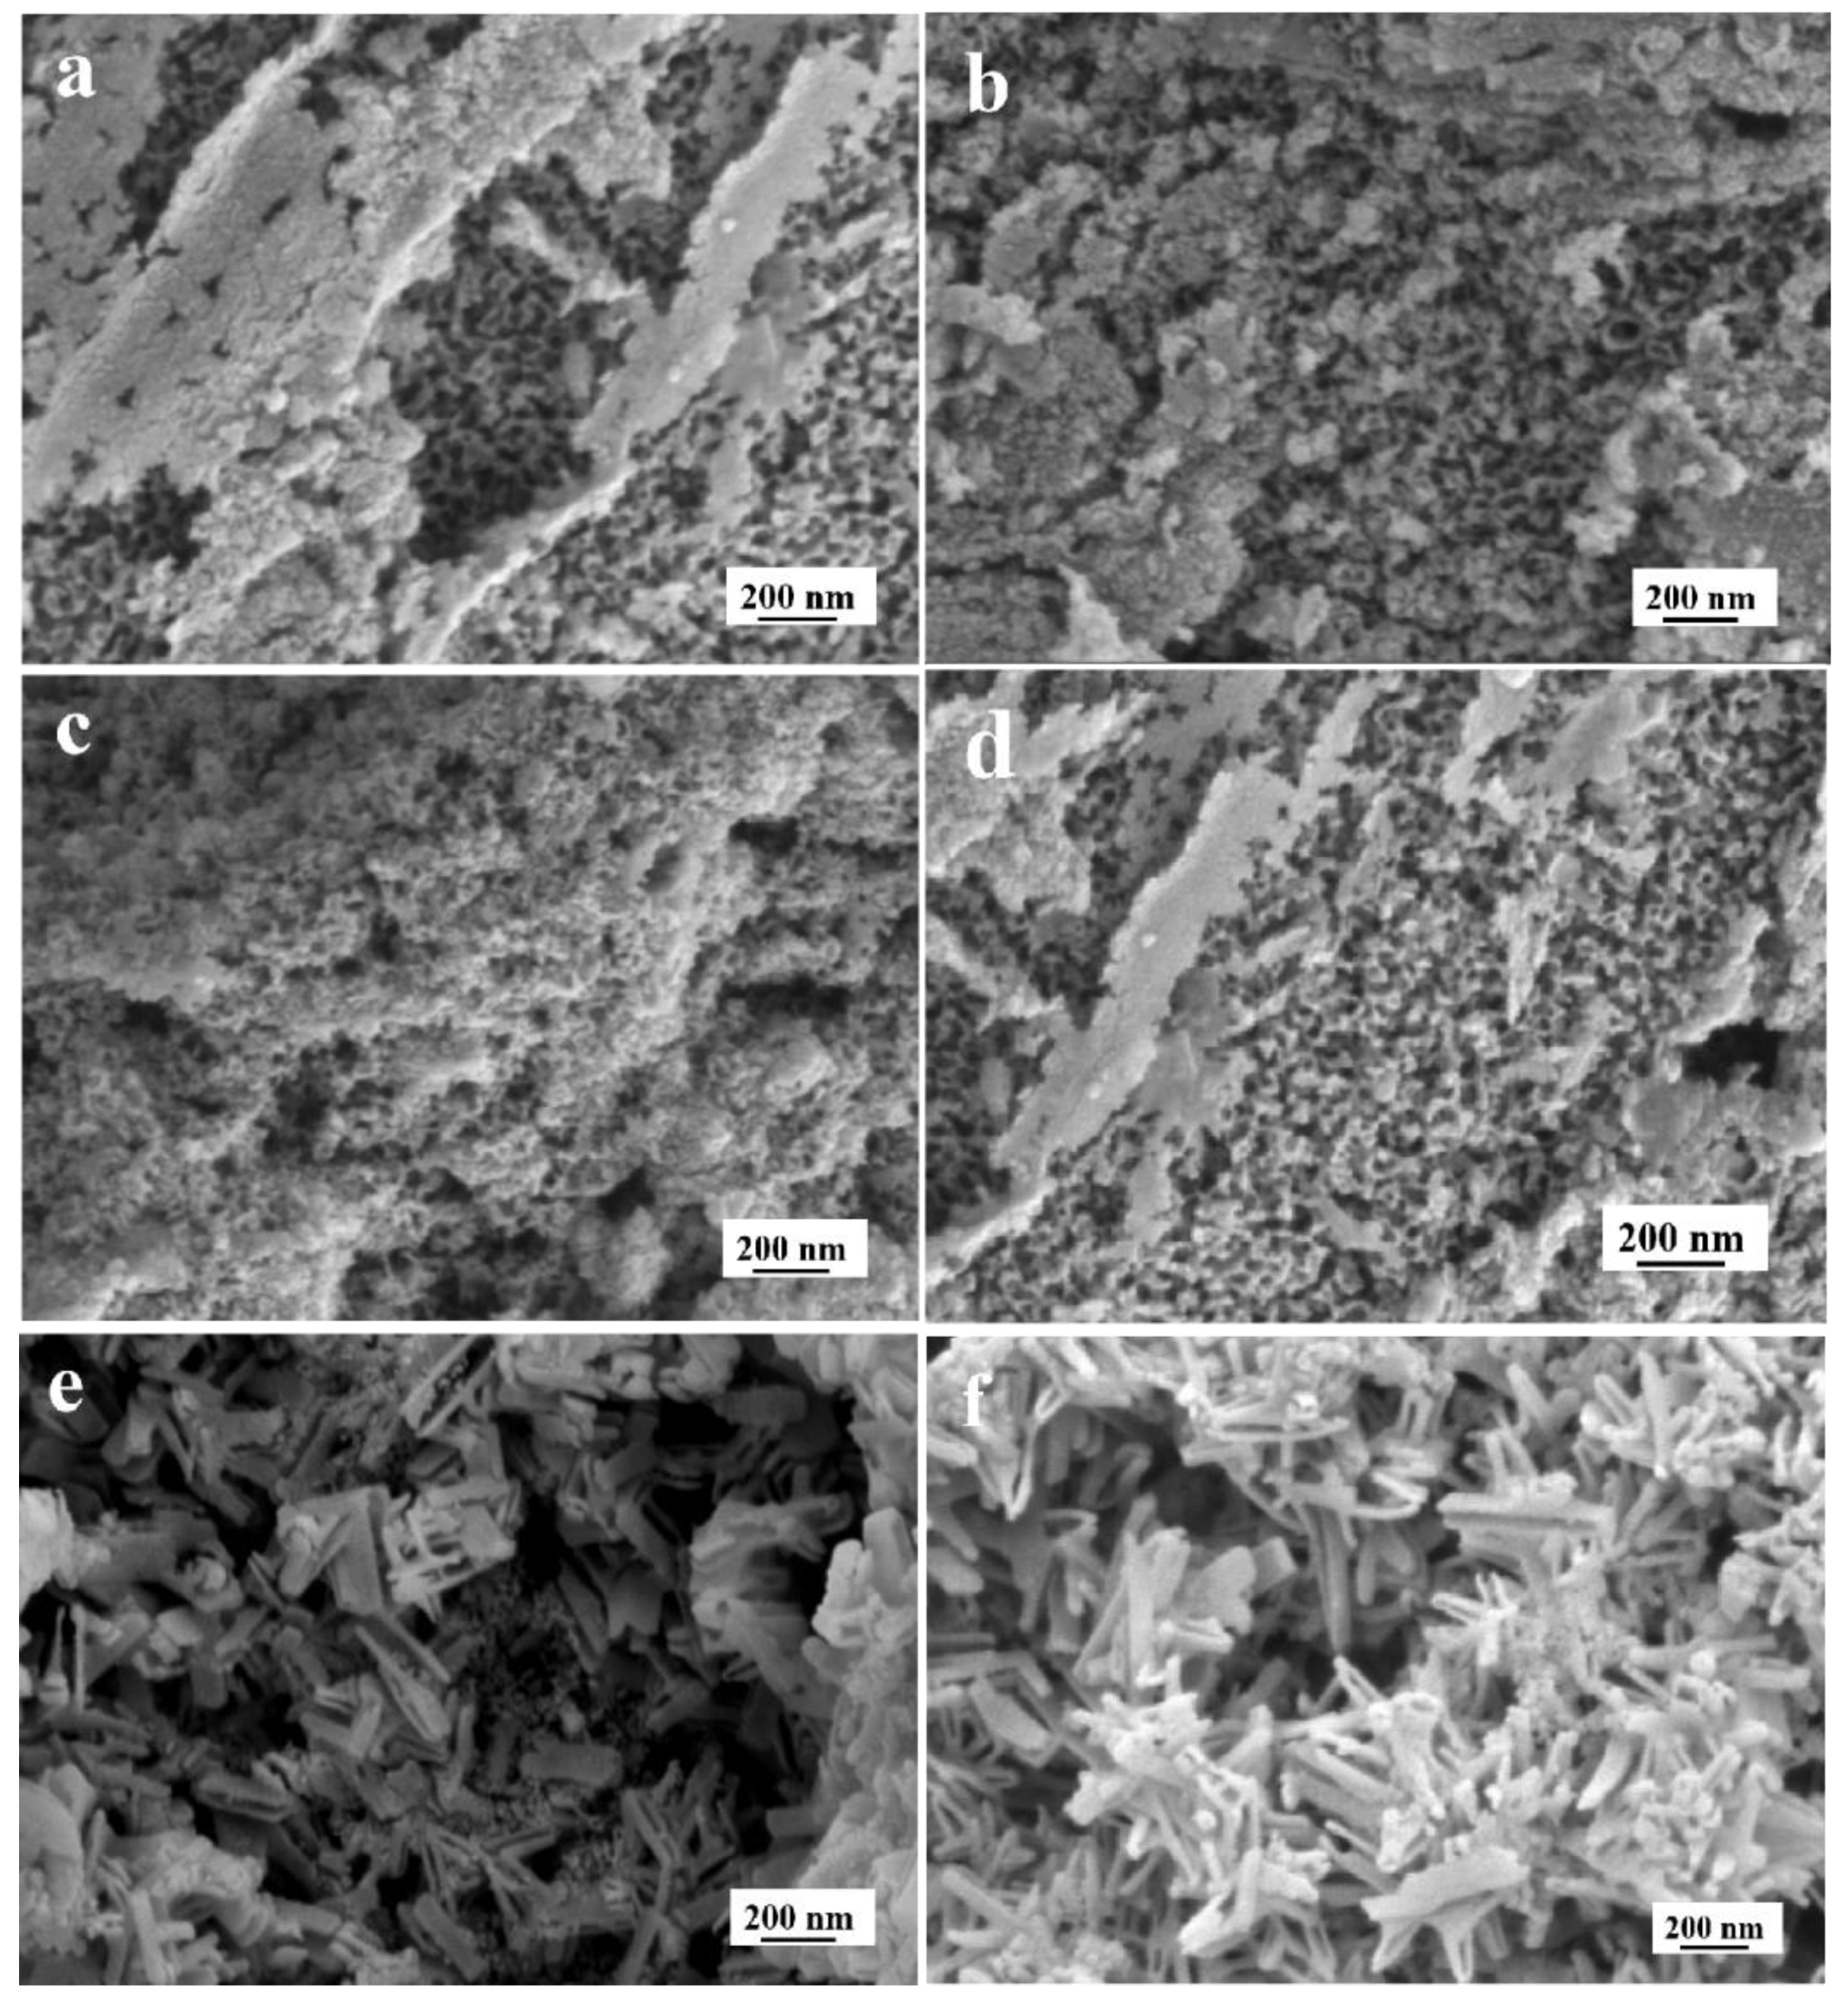
3.1. The Effect of NH4F on TiO2NTs Coating

3.1.1. Aqueous Solution System

According to the oxidation mechanism proposed by Macak et al. [33,34,35], in the process of preparing TiO2NTs by in situ anodization of the Ti matrix, the anodic oxidation rate and chemical etching rate jointly determine the morphology and structure of TiO2NTs array. The growth and formation rate of TiO2NTs array is controlled by anodic oxidation rate, while the dissolution rate of TiO2NTs array is controlled by chemical etching rate. The composition and concentration of electrolyte have an important effect on the structure of TiO2NTs array. The formation of TiO2NTs was investigated by adding different concentrations of NH4F in aqueous electrolyte. In aqueous solution of NH4F, the surface of Ti wire can be easily oxidized to TiO2. With the increase in NH4F concentration, the chemical etching rate is much higher than the formation rate of nanotube array. As shown in Figure 1, when the NH4F concentration increases to 2.5%, flower-shaped rather than tubular TiO2 is generated.

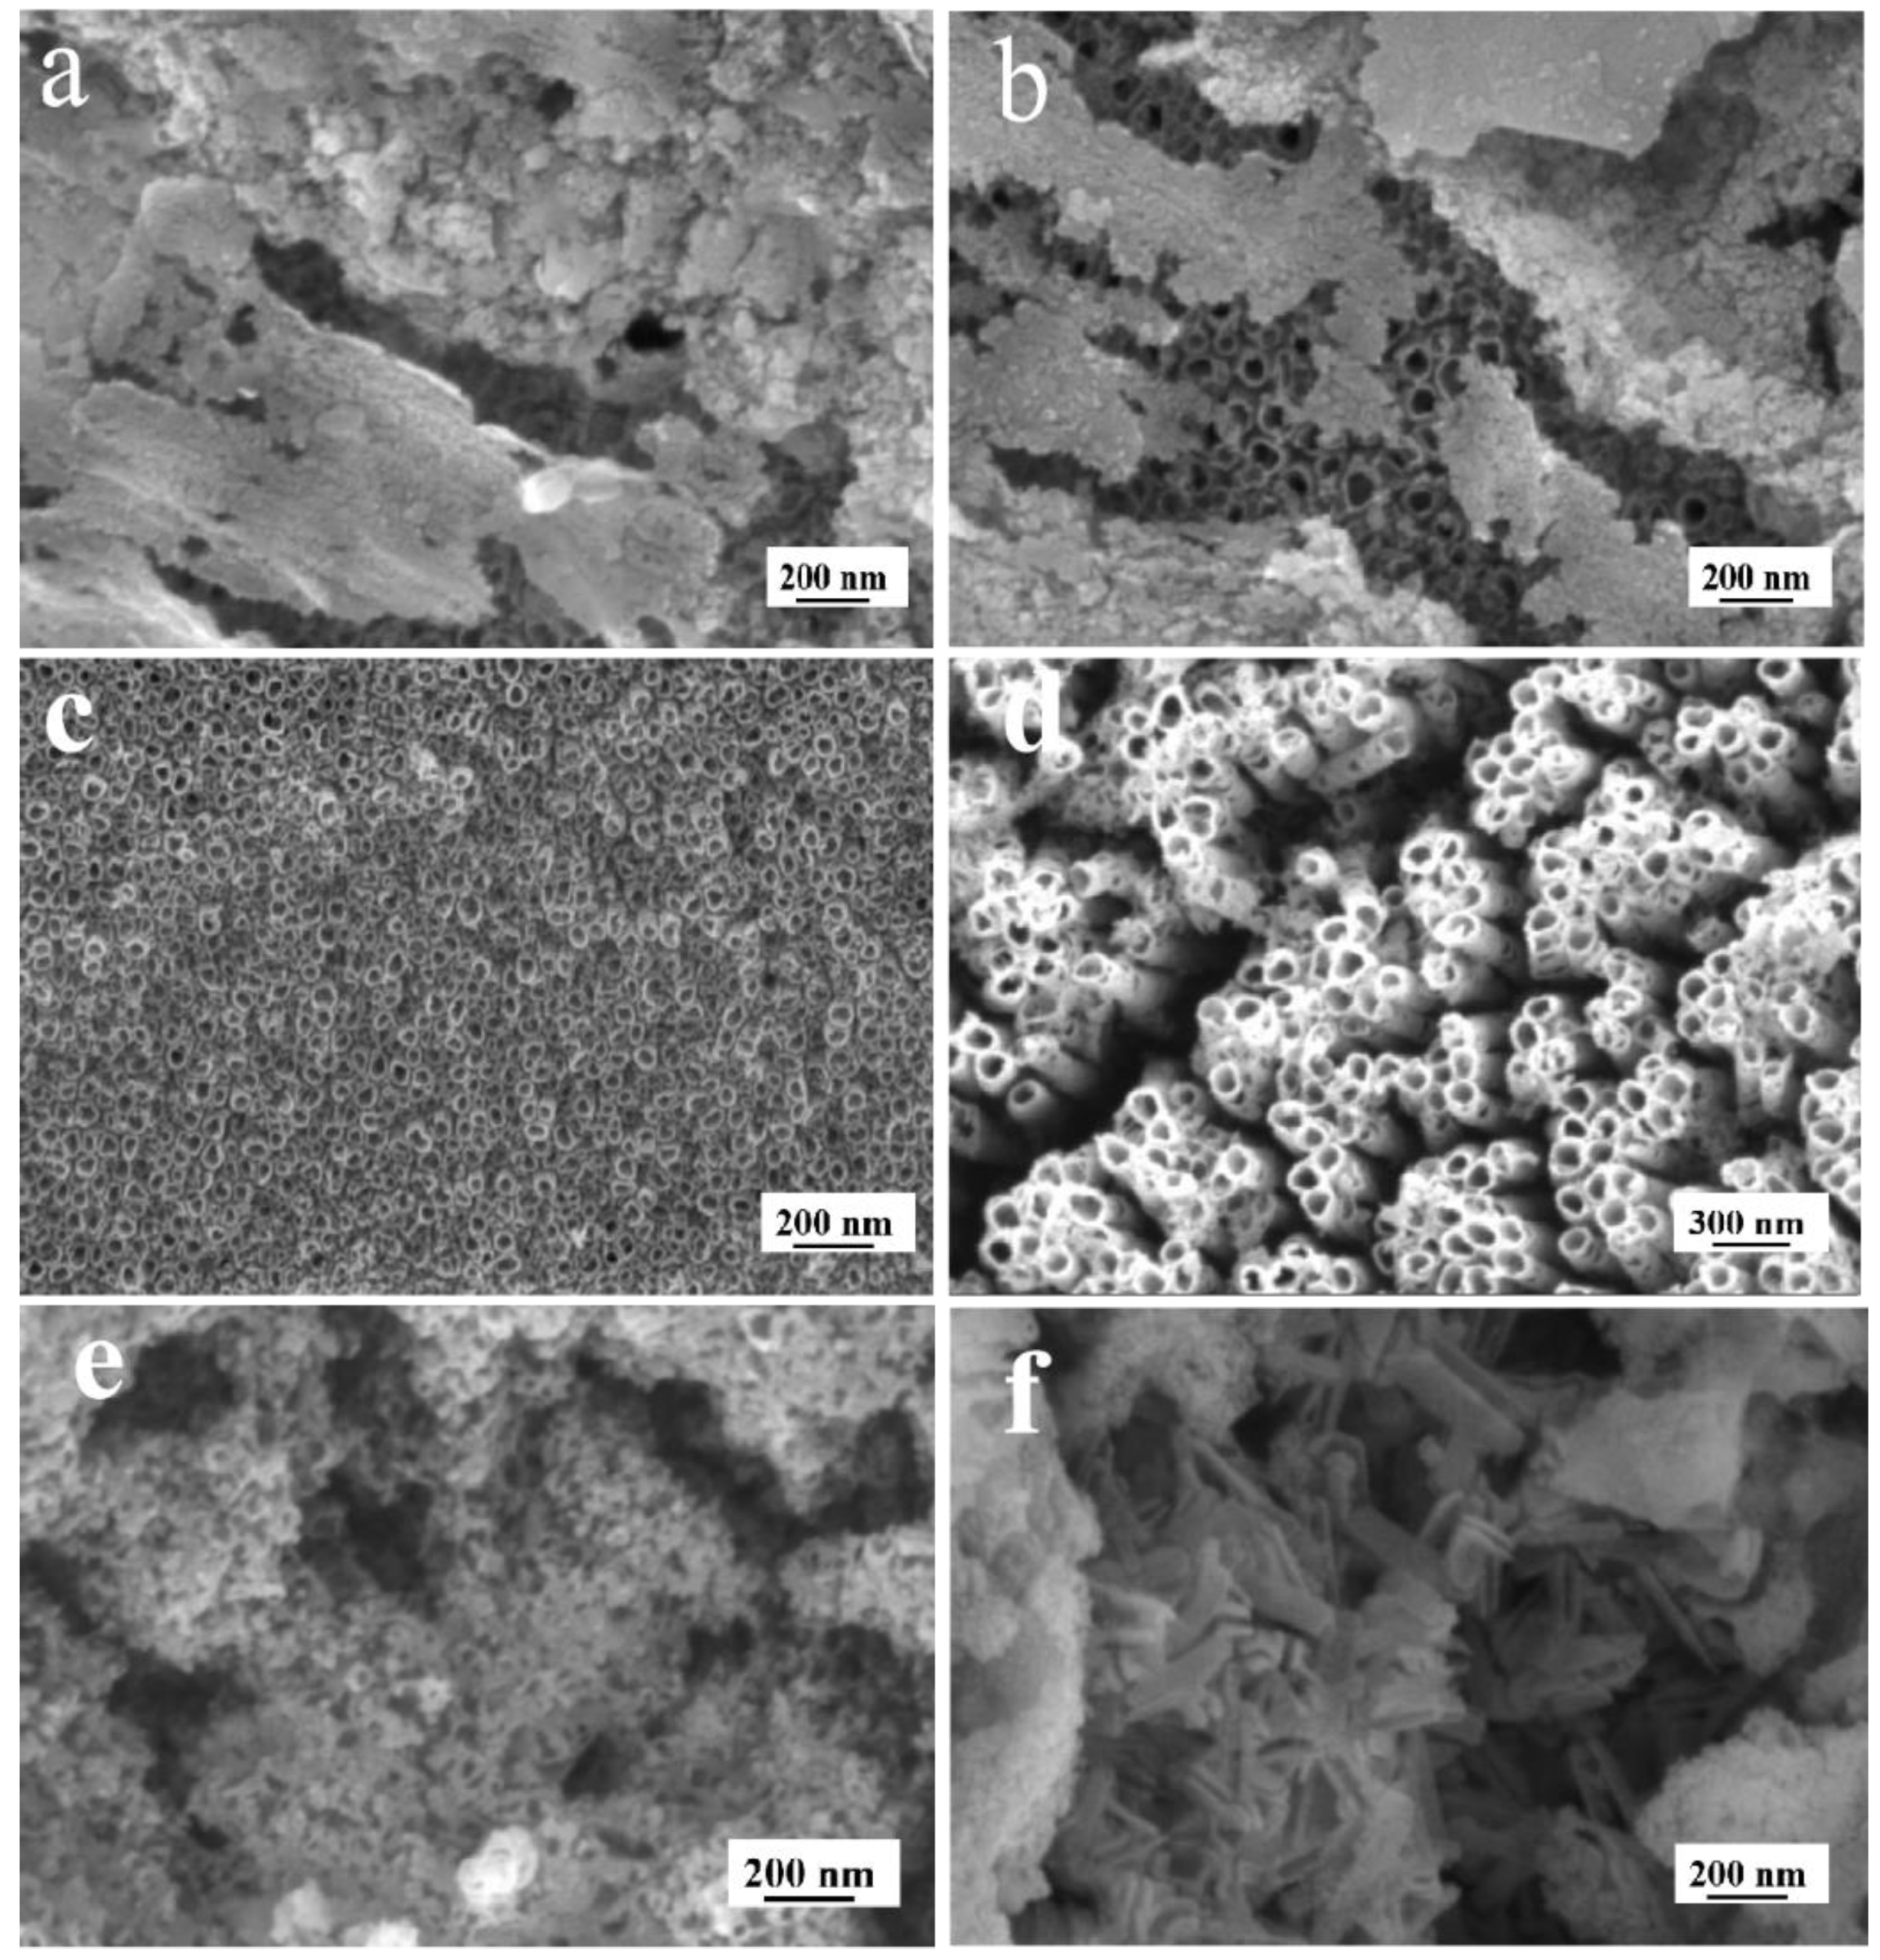
3.1.2. Organic Electrolyte Solution System

In order to reduce the chemical etching rate of TiO2NTs grown in situ by anodized Ti wire, organic solvent electrolyte was introduced. By adding the surface-active agent to change its crystal structure during the process of making TiO2NTs, reduce nano TiO2 bonding and improve its dispersion. In the organic electrolyte, the etching rate of TiO2NTs by F is small, and the anodized oxidation rate is greater than the chemical etching rate within the reaction time, so as to obtain regular TiO2NTs array. The chemical etching rate increases with the increase in F- concentration, while the formation rate of TiO2NTs array is the opposite. Therefore, by adjusting and optimizing the concentration of NH4F, the dynamic balance of anodic oxidation and chemical etching in the growth of TiO2NTs array can be controlled to achieve the controllable growth of TiO2NTs array structure.
Figure 2 is the SEM diagram of Ti anodic oxidation with the same ethylene glycol concentration and different NH4F concentration. As can be seen from Figure 2a,b, the concentration of NH4F is low and the corresponding chemical etching rate is slow, and the lamellar layer covers the nanotubes, resulting in the failure to form continuous and regular nanotubes. The nanotubular morphology is preserved for the fiber coating with the narrower inner diameter at NH4F concentration of 0.5–1.0% (ω%) (Figure 2c,d). However, the uniform frameworks of the TiO2NTs structure were rapidly deteriorated at a higher concentration of NH4F (Figure 2e,f). The main reason for this problem is that the chemical etching rate is much greater than the oxidation rate, the migration rate of Ti4+ increases, the structure of array TiO2NTs is damaged, and finally, flake TiO2 is formed.

3.2. The Effect of Ethylene Glycol

The excellent properties of TiO2NTs/Ti fibers largely depend on the pore size of nanotubes. In the electrolyte with water as solvent, the TiO2NTs obtained by anodic oxidation are shorter (Figure 1a–d). In order to increase the length of TiO2NTs, NH4F was used as an electrolyte and the concentration was 0.5%, and the concentration of ethylene glycol was 20%, 50%, 60% and 80% to obtain the TiO2NTs/Ti fibers, respectively.
As depicted in Figure 3, considerable changes in the surface structures are observed after electrolysis in different electrolytes at 20 V constant voltage for 30 min. Ethylene glycol is an organic solvent electrolyte, which is less acidic than the water-soluble electrolyte, and the etching rate of TiO2NTs by F decreases. In a longer reaction time, the anodic oxidation rate is greater than the chemical etching rate, thus obtaining a longer TiO2NTs array. However, as the concentration of ethylene glycol continued to increase, the nanotube lengthened and its irregularity increased, so that the nanotube was superimposed, and its mechanical strength decreased. Considering the length and strength of the nanotubes, the optimal electrolyte composition is 0.5% (ω%) NH4F and 50% (v/v) ethylene glycol.

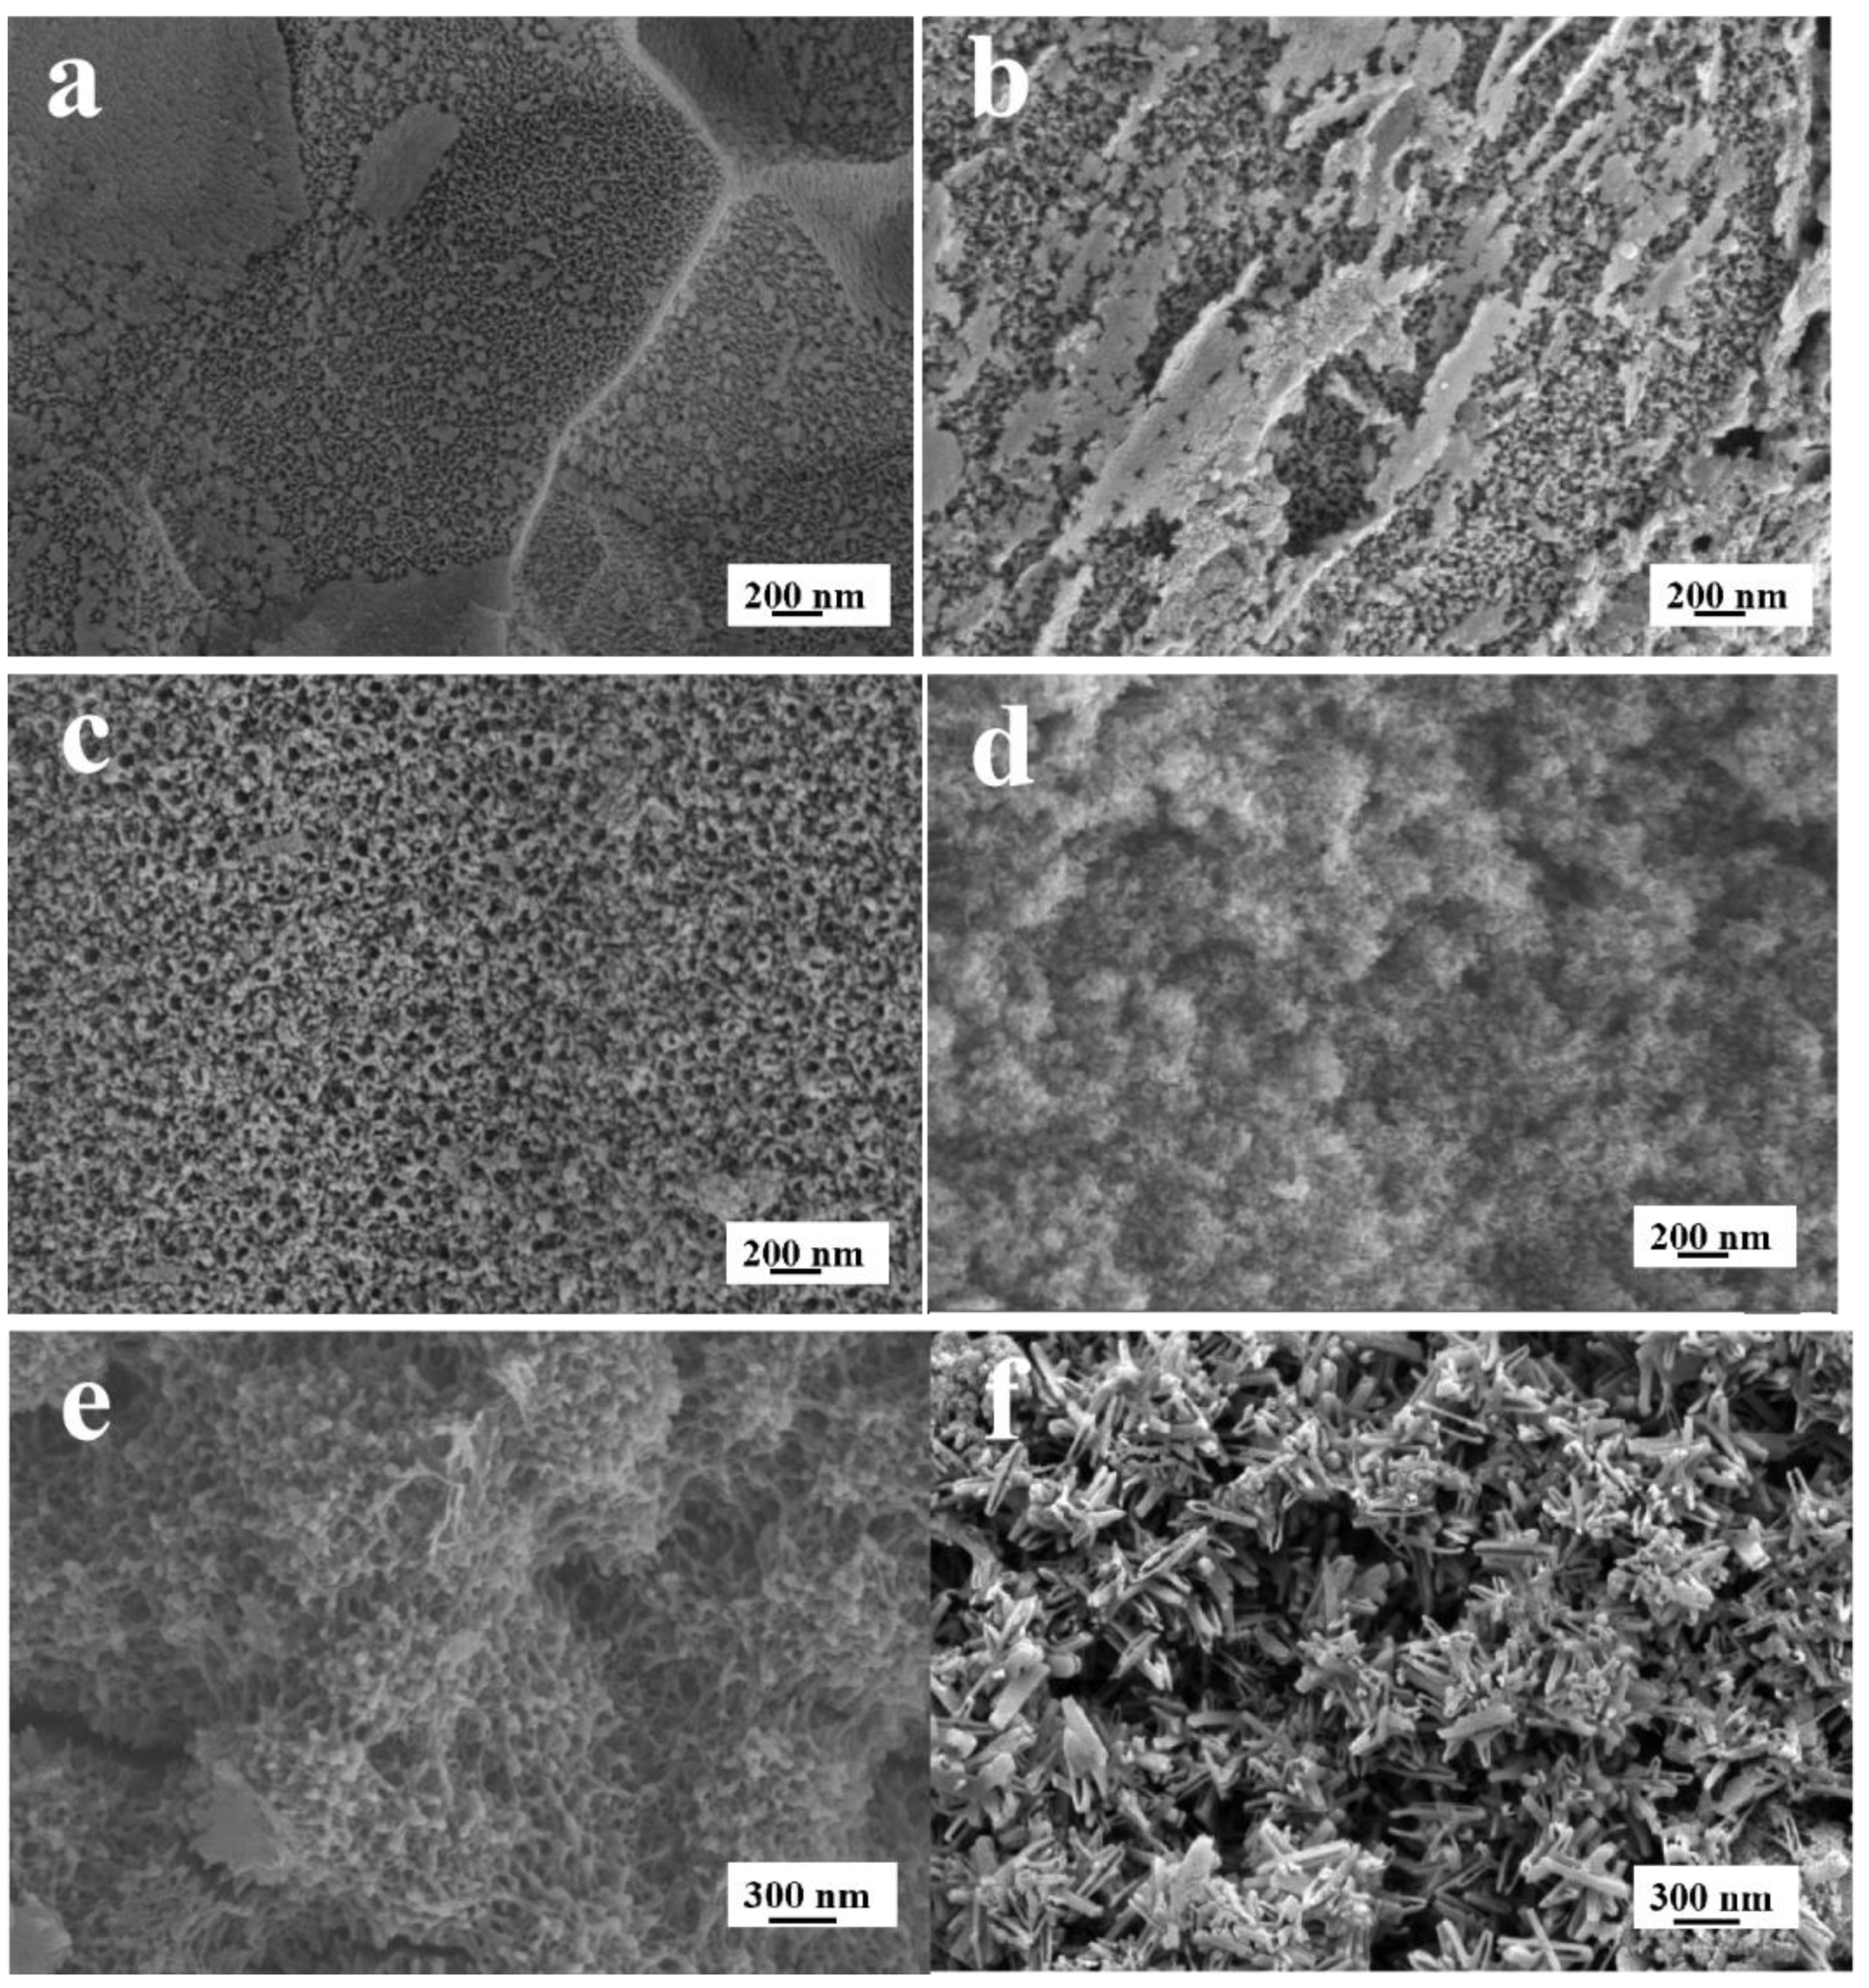
3.3. The Effect of Voltages

Different anodic voltages produce different morphologies of titanium dioxide coating. As can be seen from Figure 4, a passive film of titanium dioxide is rapidly formed on the surface of titanium wire during oxidation (Figure 4a,b). TiO2 was provided with poorer conductivity and a high voltage is required to maintain the reaction. With the increase in voltage, the reaction speed is accelerated, and nanotubes are formed on the surface of titanium wire (Figure 4b,c). However, high voltage can lead to the dissociation of water and the breakdown of the nanotube structure due to the formation of gas (Figure 4e,f).

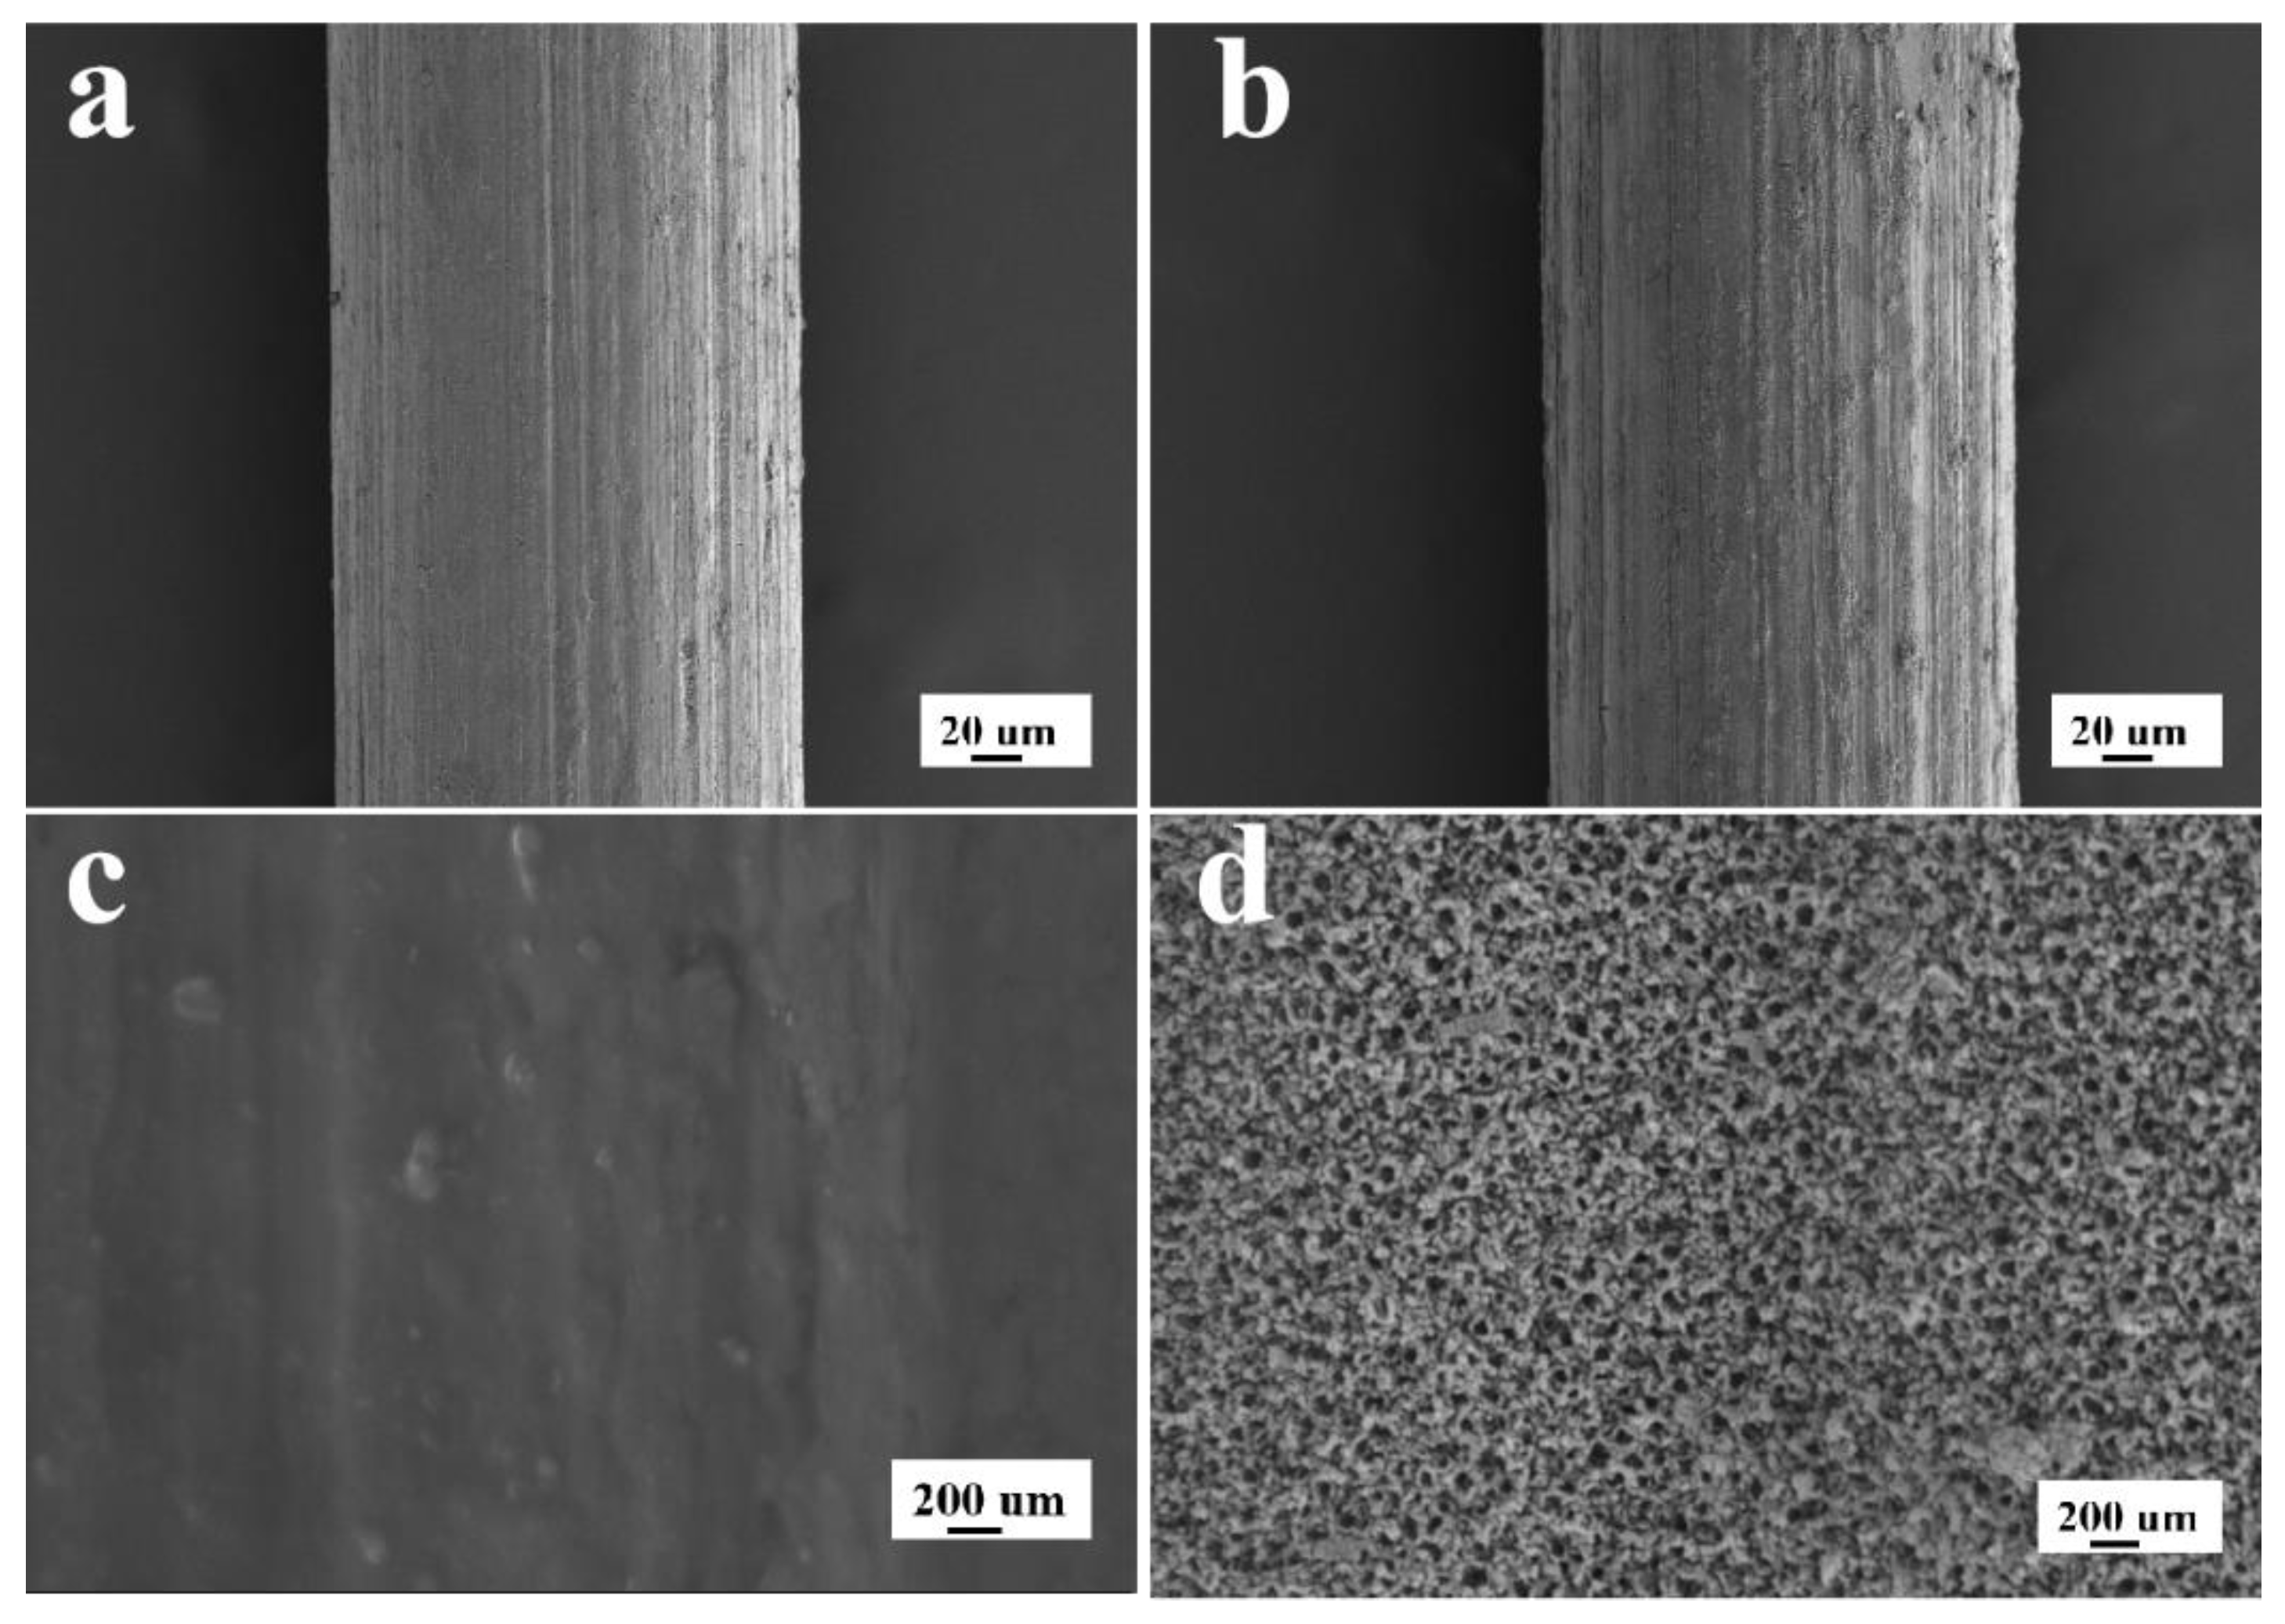
3.4. The Characterization of the TiO2NTs

SEM was used to characterize the surface of the Ti wire before and after anodizing. As shown in Figure 5, highly ordered TiO2NTs arrays (Figure 5d) were generated on the surface of the anodized Ti wire with an average aperture of about 100 nm and a wall thickness of about 25 nm.
The surface elemental analysis of the Ti wire before and after oxidation was performed by energy dispersive X-ray spectroscopy. As shown in Figure 6a, the presence of weak O peak in the EDS spectrum illustrates the formation of a very thin passivation layer at the surface of the commercial Ti wire. Figure 6b shows peaks corresponding to the presence of Ti and O, and their mass composition was close to the composition molar ratio of TiO2. The EDS analysis demonstrates the drastic increase in O content due to the formation of TiO2NTs coating. From the SEM image and EDS spectrum analysis results, the TiO2NTs are tightly embedded into the Ti wire substrate.
In the X-ray diffraction (XRD) image of TiO2NTs, diffraction peaks at 25.2° and 27.3° are the characteristic diffraction peaks of 101 lattice plane of anatase and 110 lattice planes of rutile (see Figure S1 in the Supplementary Materials). As can be seen from Figure S1, the crystalline structures of TiO2NTs obtained by in situ anodization of Ti wire was almost all anatase type.

3.5. The Extraction Mechanism of TiO2NTs Fiber

It was found that the fiber had excellent extraction performance for PAHs. This result may be attributed to the inherent physicochemical nature of TiO2NTs coatings. On the one hand, the as-fabricated fiber have special nanostructures, such as larger surface area, more open access points and better durability. These characteristics are most desirable for highly efficient SPME. On the other hand, the special anion-π orbital (electron donor-acceptor) interaction between TiO2 and PAHs can take actions and result in the better extraction efficiencies. Therefore, the TiO2NT-coated fiber just provides a hopeful approach to specifically extract and analyze trace amount of PAHs from complex environment water samples.

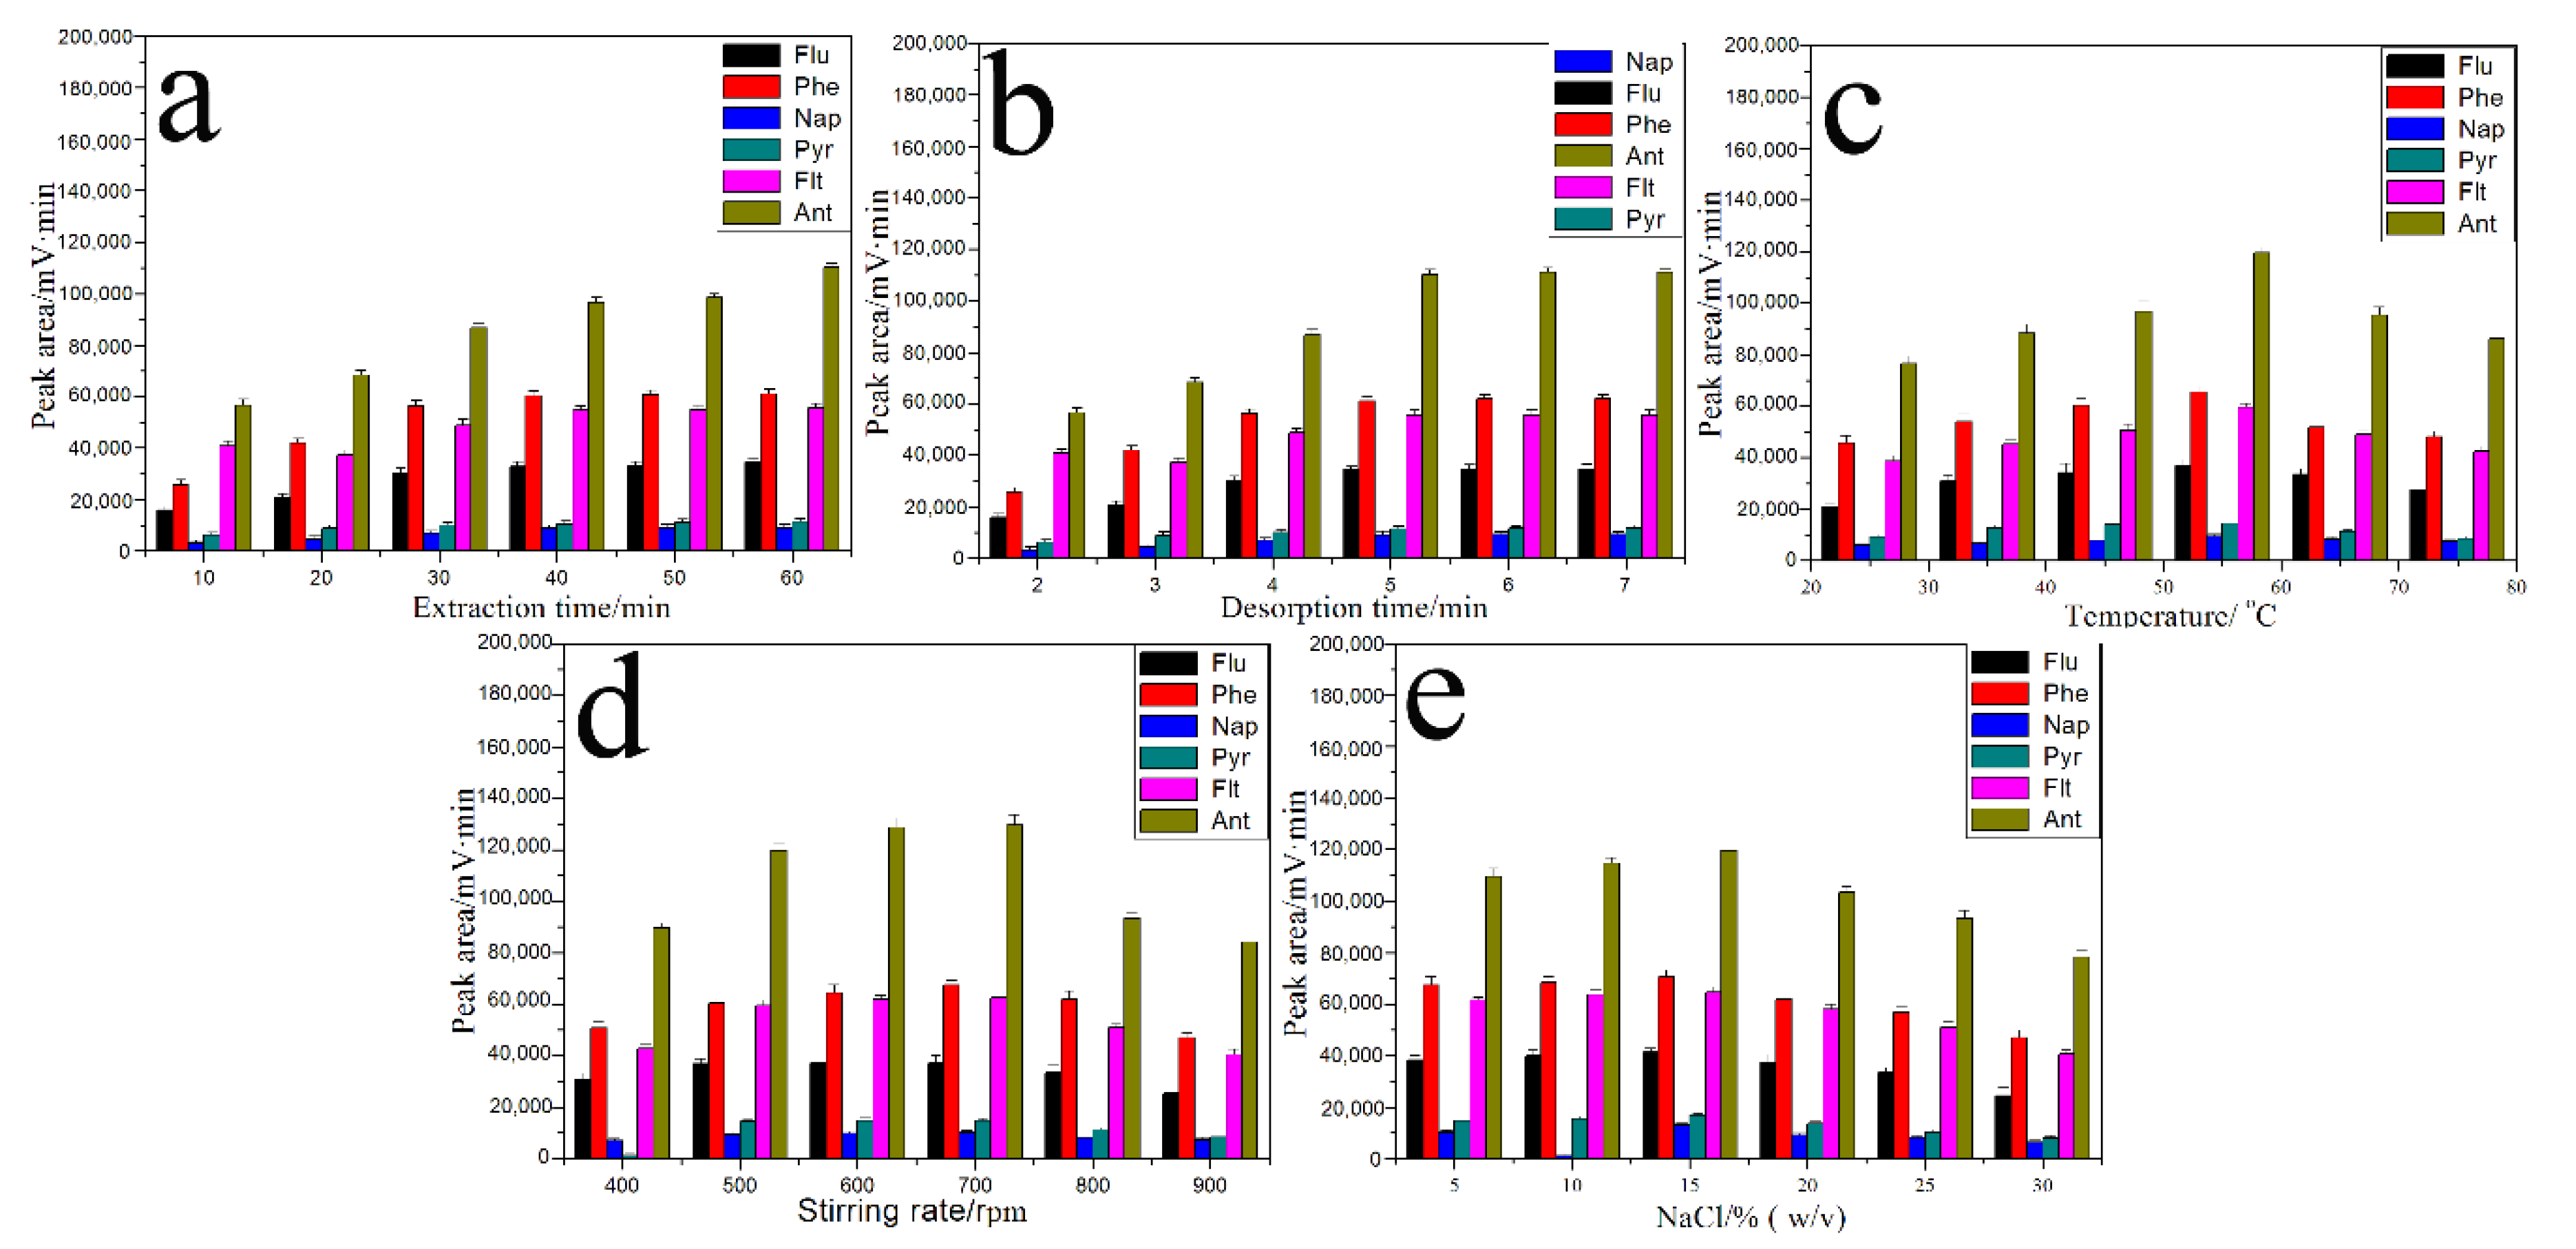
3.6. The Optimization of SPME Conditions for PAHs

The as-prepared TiO2NTs/Ti fiber coupled with HPLC was used for the SPME of PAHs mixtures from water samples. To achieve the optimal extraction, the effects of extracting parameters, such as the extraction time, desorption time, temperature, stirring and ionic strength of sample solutions were optimized at the concentration level of 50 μg·L−1.

3.6.1. Extraction and Desorption Time

In general, the extraction time depends on the analyte distribution equilibrium time between the fiber and water samples. Long extraction time is advantageous to reach the best equilibrium translation [36]. If the extraction time is short and the content of polycyclic aromatic hydrocarbons enriched in the fiber coating is too small, the sensitivity of the determination method will be affected. On the contrary, the extension of extraction time leads to the increase of determination time, and the method will lose its timeliness. Within 10–60 min, the effect of time on extraction efficiency was investigated. The amount of PAHs in the extraction coating increased with the extension of extraction time (expressed by peak area) before reaching equilibrium. As shown in Figure 7a, the extraction equilibrium was almost obtained within 50 min except for Ant. Considering only a slight increase in the peak areas of Ant after 50 min, 50 min is a reasonable compromise time between a good peak area and an acceptable extraction time for all PAHs.
In the SPME process, two steps are very important; one is the adsorption of the analyte on the surface of the fiber coating, and the other is the desorption of the analyte from the fiber coating in mobile phase. For target PAHs, the peak area reached constant maximum within 6 min (Figure 7b). Thus, 50 min extraction and 6 min desorption were employed in subsequent experiments.

3.6.2. Extraction Temperature

It is generally accepted that temperature is very important for SPME because of its potential influence. On the one hand, an elevated temperature can enhance the migration rate of molecules and so quicken the extraction rate. On the other hand, it would decrease the partitioning coefficient of the analyte between the fiber coating and the sample solution [37]. Therefore, the selection of a proper temperature is necessary for the extraction process. In our experiments, the effects of the temperature on the extraction efficiency of analytes were studied in a range of 25–70 °C. The results were shown in Figure 7c, the chromatographic peak area reached the maximum value of most compounds at 50 °C, so 50 °C was chosen for subsequent experiments.

3.6.3. Stirring Speed

The extraction efficiency is notably affected by stirring speed, the solution agitation can reduce the equilibrium time by accelerating the diffusion of analytes from the samples to the fiber [38]. The stirring speed ranging from 200 to 1200 rpm was investigated. As shown in Figure 7d, the extraction efficiency increased with the stirring speed. However, a stirring rate above 700 rpm would lead to lower extraction efficiency. This may be due to strong fluid shear stress which made analytes absorbed in coating surface wash down easily. Therefore, the magnetic agitator was fixed at 700 rpm during the extraction.

3.6.4. Ionic Strength

It is known that the addition of a salt (NaCl) into a solution might either help with the extraction by the “salt out effect” or deteriorate the extraction due to the competitive adsorption of Na+ and Cl [39]. The extraction efficiency as a function of salt concentration from 0% to 30% (30% is the saturated solubility of NaCl) was studied and is shown in Figure 7e. It is found that with the increase in salt concentration, chromatographic peak areas for the most analytes increase firstly up to 15% (w/v) salt concentration, indicating the “salt out effect” plays a dominant role at this stage and then the peak areas decrease because of the competitive adsorption. Therefore, a concentration of 15% (w/v) was selected as the optimized salt concentration.

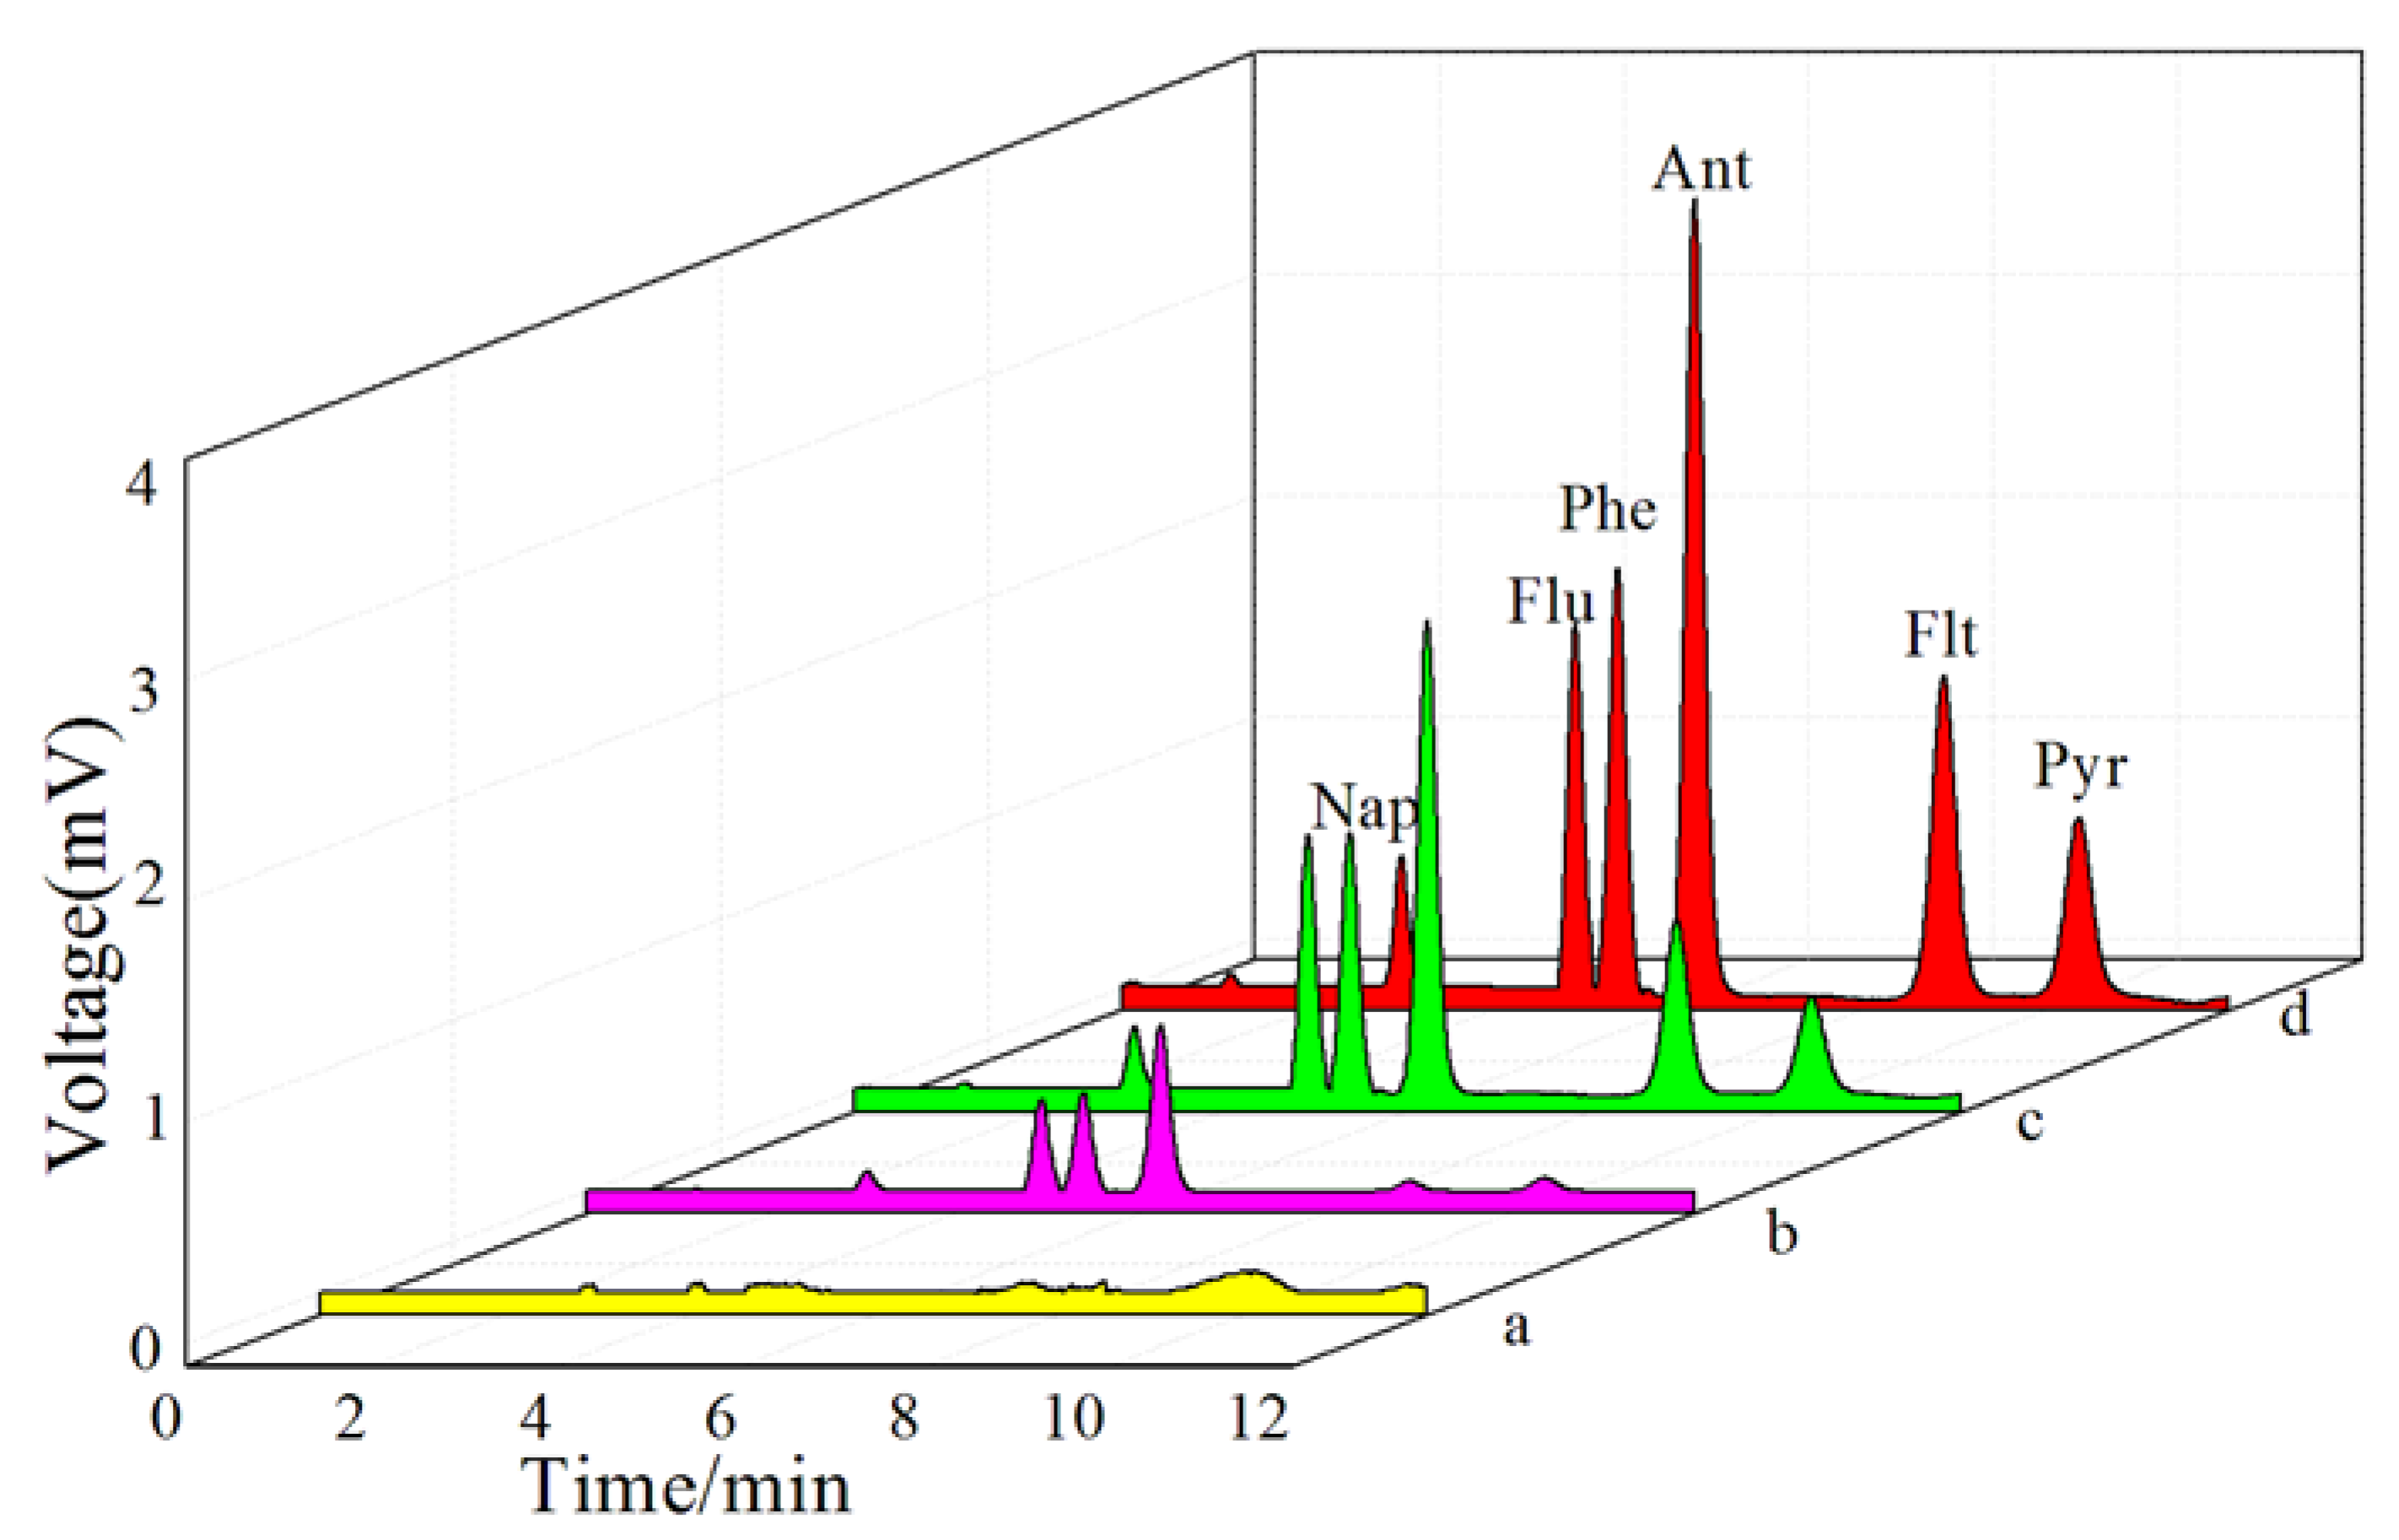
3.7. Analytical Performance

Under the optimized conditions, figures of merit, including linear range, precision in terms of reproducibility and repeatability quantification (RSD%) and limits of detection (LOD). were evaluated. As shown in Table 1, good linearities are achieved in the range of 0.20–500 μg·L−1 for all target analytes with satisfactory correlation coefficients. The limits of detection (LOD) (S/N = 3) and limits of quantitation (LOQ) (S/N = 10) ranged from 0.03 to 0.05 μg·L−1 and from 0.12 to 0.18 µg/L for PAHs, respectively. The single fiber repeatability for five replicate extractions of PAHs at the spiking level of 50 μg·L−1 varied from 3.5% to 4.7%. The fiber-to-fiber reproducibility for three parallel fibers fabricated in different batches ranged from 5.2% to 7.9%. These data clearly indicate that satisfactory accuracy, good precision and high sensitivity were achieved with the proposed SPME-HPLC procedure.

3.8. Spiked Real Samples Analysis

To demonstrate the applicability and reliability of the proposed method, the presented method using the TiO2NTs/Ti fiber was applied to the preconcentration and determination of target PAHs in tap water, river water, rainwater and wastewater. All water samples were filtered through 0.45 μm micropore membranes and then adjusted to pH 7.0 with phosphate buffer. The results of three replicate analyses are shown in Table 2. No PAHs was found in tap water but were detected in other water samples. In addition, for the sake of demonstrating the applicability and reliability, the recoveries of the target compounds are also determined. The median recoveries ranged from 78.6% to 119.0% with the RSD values from 4.3% to 8.9%.
The data in Table 2 indicated that the proposed method could be used in the analysis of spiked real samples. Figure 8 shows typical chromatograms of direct HPLC and SPME-HPLC for PAHs in wastewater. These data indicate that the proposed method is suitable for the extraction, enrichment and determination of target PAHs in different environmental water samples with a minor matrix effect.

3.9. The Stability of the TiO2NTs/Ti Fiber

The stability of the metal-based fibers greatly depends on their coating procedures, coating structures and surface properties [40]. In our study, TiO2NTs coating was grown in situ on the Ti fiber substrate with the characteristics of good mechanical properties and easy acquirement, flexible and non-fragile. The fabricated fiber was immersed in 0.01 mol⋅L−1 NaOH and 0.01 mol⋅L−1 H2SO4 for 36 h, respectively. As a matter of fact, negligible morphological changes were observed from its SEM image. In order to examine its reusability, the TiO2NTs/Ti fiber was soaked in buffer solution and methanol for 15 min in sequence to imitate the extraction process in the SPME procedure. The obtained results revealed that the fabricated fiber could be used at least 250 times for extraction and desorption of PAHs. In this case, the acceptable average recovery (87.5–107.2%) and RSDs (4.53–8.04%) were still achieved for five replicate analyses of target PAHs at the level of 50 μg⋅L−1. Clearly, the physical and chemical stability demonstrate that the TiO2NTs/Ti fiber will find its practical applications in environmental water samples.

3.10. A Comparison of the Developed Method with Other Methods

To further evaluate the analytical performance of the TiO2NTs/Ti fiber, several typical analytical parameters such as extraction time, linear range, LOD, relative RSD and recovery rate of this method were compared with those of previously reported SPME method for the preconcentration and determination of PAHs [41,42,43,44,45,46]. Some statistics are presented in Table 3, this method offers relatively short extraction time, lower LODs than the methods [41,42,44], comparable RSDs to the methods [41,42,44,45,46], and satisfactory recoveries of the proposed method is comparable or superior to the other reported microextraction methods for the determination of PAHs. However, compared with the reported methods, this method has the advantages of simple production, relatively low cost of preparation and good reproducibility.

4. Conclusions

In this paper, the TiO2NT-coated fiber was in situ fabricated through the anodization of Ti wire substrates in electrolyte containing ethylene glycol and NH4F. The TiO2NTs coating was performed in a highly reproducible manner and the TiO2NTs were embedded into the Ti wire substrate. Under the optimized preparation conditions, uniform pore size array TiO2NTs were obtained. The TiO2NTs/Ti fiber possessed high surface area, good mechanical strength and chemical stability. Coupled to HPLC, the prepared fiber was investigated using six PAHs. It offered a simple, rapid, sensitive and inexpensive pretreatment way for selective concentration and the determination of PAHs in real environmental water samples. The SPME-HPLC analytical method earned a good linear relation, wider linear ranges (0.20–500 μg⋅L−1), better reproducibility and accuracy (RSDs, 3.5–7.9%), and higher sensitivity (LODs, 0.03–0.05 μg⋅L−1) for target pollutants. In addition, this robust fibre can be used for more than 250 extraction and desorption cycles without the loss of the extraction capability. All these indicated that this novel SPME-HPLC-UV technique would be a good selection and have a great potential for the detection or quantification of trace PAHs in complex samples.

Supplementary Materials

The following are available online at https://www.mdpi.com/article/10.3390/cryst11111384/s1. Figure S1: XRD patterns of TiO2NTs

Author Contributions

Conceptualization, M.M., Y.W., J.C. and Q.S.; Methodology, M.M. and Y.W.; Project administration: M.M. and Y.W.; investigation, M.M., Y.W., J.C. and Q.S.; Writing—original draft: M.M., Writing—review & editing: M.M. and Y.W. All authors have read and agreed to the published version of the manuscript.

Funding

This research work was financially supported by the Key Talent Project of Gansu Province (2021), Science and Technology Projects of Gansu Province (20JR10RA290), Innovation Fund for Higher Education of Gansu Province (2021B-282) and Horizontal development project (LZCU-KJ/2021-040).

Institutional Review Board Statement

Not applicable.

Informed Consent Statement

Not applicable.

Data Availability Statement

Not applicable.

Conflicts of Interest

The authors declare no conflict of interest.

References

  1. Alpendurada, M.D.F. Solid-Phase Microextraction: A promising technique for sample preparation in environmental analysis. J. Chromatogr. A 2000, 889, 3–14. [Google Scholar] [CrossRef]
  2. Risticevic, S.; Niri, V.H.; Vuckovic, D.; Pawliszyn, J. Recent developments in solid-phase microextraction. Anal. Bioanal. Chem. 2009, 393, 781–795. [Google Scholar] [CrossRef]
  3. Bagheri, H.; Piri-Moghadam, H.; Naderi, M. Towards greater mechanical, thermal and chemical stability in solid-phase microextraction. TrAC Trends Anal. Chem. 2012, 34, 126–139. [Google Scholar] [CrossRef]
  4. Sajid, M.; Nazal, M.K.; Rutkowska, M.; Szczepańska, N.; Namieśnik, J.; Płotka-Wasylka, J. Solid phase microextraction: Apparatus, sorbent materials, and application. Crit. Rev. Anal. Chem. 2018, 49, 271–288. [Google Scholar] [CrossRef] [PubMed]
  5. Feng, J.J.; Qiu, H.D.; Liu, X.; Jiang, S.X. The development of SPME fibers with metal wires as supporting substrates. TrAC Trends Anal. Chem. 2014, 44, 44–58. [Google Scholar]
  6. Sun, M.; Feng, J.J.; Bu, Y.N.; Wang, X.J. Graphene coating bonded onto stainless steel wire as a solid-phase microextraction fiber. Talanta 2015, 134, 200–205. [Google Scholar] [CrossRef] [PubMed]
  7. Gholivand, M.B.; Piryaei, M.; Abolghasemi, M.M. Anodized aluminum wire as a solid-phase microextraction fiber for rapid determination of volatile constituents in medicinal plant. Anal. Chim. Acta 2011, 701, 1–5. [Google Scholar] [CrossRef]
  8. Djozan, D.; Abdollahi, L. Anodized zinc wire as a solid-phase microextraction fiber. Chromatographia 2003, 57, 799–804. [Google Scholar] [CrossRef]
  9. Wang, H.J.; Zhang, Y.D.; Zhang, M.; Zhen, Q.; Wang, X.M.; Du, X.Z. Gold nanoparticle modified NiTi composite nanosheet coating for efficient and selective solid phase microextraction of polycyclic aromatic hydrocarbons. Anal. Methods 2016, 8, 6064–6073. [Google Scholar] [CrossRef]
  10. Feng, J.J.; Sun, M.; Liu, H.M.; Li, J.B.; Liu, X.; Jiang, S.X. Au nanoparticles as a novel coating for solid-phase microextraction. J. Chromatogr. A 2010, 1217, 8079–8086. [Google Scholar] [CrossRef]
  11. Mehdinia, A.; Aziz-Zanjani, M.O. Recent advances in nanomaterials utilized infiber coatings for solid-phase microextraction. TrAC Trends Anal. Chem. 2013, 42, 205–215. [Google Scholar] [CrossRef]
  12. Aziz-Zanjani, M.O.; Mehdinia, A. Electrochemically prepared solid-phase microextraction coatings—A review. Anal. Chim. Acta 2013, 781, 1–13. [Google Scholar] [CrossRef]
  13. Płotka-Wasylka, J.; Szczepańska, N.; la Guardia, M.; Namieśnik, J. Modern trends in solid phase extraction: New sorbent media. TrAC Trends Anal. Chem. 2016, 77, 23–43. [Google Scholar] [CrossRef]
  14. Płotka-Wasylka, J.; Szczepańska, N.; la Guardia, M.; Namieśnik, J. Miniaturized solid-phase extraction techniques. TrAC Trends Anal. Chem. 2015, 73, 19–38. [Google Scholar] [CrossRef]
  15. Gong, D.W.; Grimes, C.A.; Varghese, O.; Hu, W.C.; Singh, R.S.; Chen, Z.; Dickey, E.C. Titanium oxide nanotube arrays prepared by anodic oxidation. J. Mater. Res. 2001, 16, 3331–3334. [Google Scholar] [CrossRef] [Green Version]
  16. García-Valverde, M.T.; Lucena, R.; Cárdenas, S.; Valcárcel, M. Titanium-dioxide nanotubes as sorbents in (micro)extraction techniques. TrAC Trends Anal. Chem. 2014, 62, 37–45. [Google Scholar] [CrossRef]
  17. Liu, X.; Liu, Z.Q.; Lu, J.L.; Wu, X.L. Electrodeposition preparation of Ag nanoparticles loaded TiO2 nanotube arrays with enhanced photocatalytic performance. Appl. Surf. Sci. 2014, 288, 513–517. [Google Scholar] [CrossRef]
  18. Cabanas-Polo, S.; Boccaccini, A.R. Electrophoretic deposition of nanoscale TiO2: Technology and applications. J. Eur. Ceram. Soc. 2015, 36, 265–283. [Google Scholar] [CrossRef]
  19. Kafshgari, M.H.; Goldmann, W.H. Insights into theranostic properties of Titanium dioxide for nanomedicine. Nano-Micro. Lett. 2020, 12, 106–140. [Google Scholar]
  20. Xu, X.; Chen, B.; Hu, J.P.; Sun, B.W.; Liang, X.H.; Li, N.; Yang, S.Y.; Zhang, H.; Huang, W.; Yu, T. Heterostructured TiO2 spheres with tunable interiors and shells toward improved packing density and pseudocapacitive sodium storage. Adv. Mater. 2019, 31, 1904589. [Google Scholar] [CrossRef]
  21. Wang, C.Y.; Wang, Y.D.; Herath, H.M.S.K. Polycyclic aromatic hydrocarbons (PAHs) in biochar-Their formation, occurrence and analysis: A review. Org. Geochem. 2017, 114, 1–11. [Google Scholar] [CrossRef]
  22. Pulleyblank, C.; Cipullo, S.; Campo, P.; Kelleher, B.; Coulonet, F. Analytical progress and challenges for the detection of oxygenated polycyclic aromatic hydrocarbon transformation products in aqueous and soil environmental matrices: A review. Crit. Rev. Env. Sci. Technol. 2019, 49, 357–409. [Google Scholar] [CrossRef]
  23. Gorshkov, A.G.; Izosimova, O.N.; Kustova, O.V. Determination of priority polycyclic aromatic hydrocarbons in water at the trace level. J. Anal. Chem. 2019, 74, 771–777. [Google Scholar] [CrossRef]
  24. Zhang, Q.Y.; Liu, P.; Li, S.L.; Zhang, X.J.; Chen, M.D. Progress in the analytical research methods of polycyclic aromatic hydrocarbons (PAHs). J. Liq. Chromatogr. Relat. Technol. 2020, 43, 425–444. [Google Scholar] [CrossRef]
  25. Riddle, S.G.; Robert, M.A.; Jakober, C.A.; Hannigan, M.P.; Kleeman, M.J. Size distribution of trace organic species emitted from light-duty gasoline vehicles. Environ. Sci. Technol. 2007, 41, 7464–7471. [Google Scholar] [CrossRef] [PubMed]
  26. Zencak, Z.; Klanova, J.; Holoubek, I.; Gustafsson, O. Source apportionment of atmospheric PAHs in the western balkans by natural abundance radiocarbon analysis. Environ. Sci. Technol. 2007, 41, 3850–3855. [Google Scholar] [CrossRef]
  27. Zhou, Y.Y.; Yan, X.P.; Kim, K.N.; Wang, S.W.; Liu, M.G. Exploration of coordination polymer as sorbent for flow injection solid-phase extraction on-line coupled with high-performance liquid chromatography for determination of polycyclic aromatic hydrocarbons in environmental materials. J. Chromatogr. A 2006, 1116, 172–178. [Google Scholar] [CrossRef]
  28. Li, K.; Li, H.F.; Liu, L.B.; Hashi, Y.; Maeda, T.; Lin, J.M. Solid-phase extraction with C30 bonded silica for analysis of polycyclic aromatic hydrocarbons in airborne particulate matters by gas chromatography-mass spectrometry. J. Chromatogr. A 2007, 1154, 74–80. [Google Scholar] [CrossRef]
  29. Liu, Q.Z.; Xu, X.; Wang, L.; Lin, L.H.; Wang, D.H. Simultaneous determination of forty-two parent and halogenated polycyclic aromatic hydrocarbons using solid-phase extraction combined with gas chromatography-mass spectrometry in drinking water. Ecotoxicol. Environ. Saf. 2019, 181, 241–247. [Google Scholar] [CrossRef]
  30. Zhang, R.; Wang, Z.; Wang, Z.Y.; Wang, X.M.; Du, X.Z. Tailoring the selectivity of titania nanowire arrays grown on titanium fibers by self-assembled modification of trichlorophenylsilane for solid-phase microextraction of polycyclic aromatic hydrocarbons. Microchim. Acta 2019, 186, 536. [Google Scholar] [CrossRef]
  31. Burkhardt, M.R.; Zaugg, S.D.; Burbank, T.L.; Olson, M.C.; Iverson, J.L. Pressurized liquid extraction using water/isopropanol coupled with solid-phase extraction clean up for semivolatile organic compounds, polycyclic aromatic hydrocarbons (PAH), and alkylate PAH homolog groups in sediment. Anal. Chim. Acta 2005, 549, 104–116. [Google Scholar] [CrossRef]
  32. Hartonen, K.; Bøwadt, S.; Dybdahl, H.P.; Nylund, K.; Sporring, S.; Lund, H.; Oreld, F. Nordic laboratory intercomparison of supercritical fluid extraction for the determination of total petroleum hydrocarbon, polychlorinated biphenyls and polycyclic aromatic hydrocarbons in soil. J. Chromatogr. A 2002, 958, 239–248. [Google Scholar] [CrossRef]
  33. Macak, J.M.; Hildebrand, H.; Marten-Jahns, U.; Marten-Jahns, P. Mechanistic aspects and growth of large diameter self-organized TiO2 nanotubes. J. Electroanal. Chem. 2008, 621, 254–266. [Google Scholar] [CrossRef]
  34. Macak, J.M.; Gong, B.G.; Hueppe, M.; Schmuki, P. Filling of TiO2 nanotubes by self-doping and electrodeposition. Adv. Mater. 2007, 19, 3027–3031. [Google Scholar] [CrossRef]
  35. Valota, A.; LeClere, D.J.; Skeldon, P.; Curioni, M.; Hashimoto, T.; Berger, S.; Kunze, J.; Schmuki, P.; Thompson, G.E. Influence of water content on nanotubular anodic titania formed in fluoride/glycerol electrolytes. Electrochim. Acta 2009, 54, 4321–4327. [Google Scholar] [CrossRef]
  36. Tian, Y.; Sun, M.; Wang, X.Q.; Luo, C.N.; Feng, J.J. A nanospherical metal–organic framework UiO-66 for solid-phase microextraction of polycyclic aromatic hydrocarbons. Chromatographia 2018, 81, 1053–1061. [Google Scholar] [CrossRef]
  37. Fang, L.; Hou, L.X.; Zhang, Y.H.; Wang, Y.K.; Yan, G.H. Synthesis of highly hydrophobic rutile Titania-silica nanocomposites by an improved hydrolysis co-precipitation method. Ceram. Int. 2017, 43, 5592–5598. [Google Scholar] [CrossRef]
  38. Huang, Y.N.; Chen, J.; Li, Z.; Wang, L.; Guan, M.; Qiu, H.D. Porous graphene-coated stainless-steel fiber for direct immersion solid-phase microextraction of polycyclic aromatic hydrocarbons. Anal. Methods 2019, 11, 213–218. [Google Scholar] [CrossRef]
  39. Li, Y.; Ma, M.G.; Zhang, M.; Wang, X.M.; Du, X.Z. In situ anodic growth of rod-like TiO2 coating on a Ti wire as a selective solid-phase microextraction fiber. RSC Adv. 2014, 4, 53820–53827. [Google Scholar] [CrossRef]
  40. Wang, Z.Y.; Wang, F.F.; Zhang, R.; Wang, Z.; Du, X.Z. A new strategy for electrochemical fabrication of manganese dioxide coatings based on silica nanoparticles deposited on titanium fibers for selective and highly efficient solid-phase microextraction. New J. Chem. 2019, 43, 5055–5064. [Google Scholar] [CrossRef]
  41. Doong, R.A.; Chang, S.M.; Sun, Y.C. Solid-phase microextraction for determining the distribution of sixteen US Environmental Protection Agency polycyclic aromatic hydrocarbons in watersamples. J. Chromatogr. A 2000, 879, 177–188. [Google Scholar] [CrossRef]
  42. Feng, J.J.; Sun, M.; Liu, H.M.; Li, J.B.; Liu, X.; Jiang, S.X. A novel silver-coated solid- phase microextraction metal fiber based on electroless plating technique. Anal. Chim. Acta 2011, 701, 174–180. [Google Scholar] [CrossRef]
  43. Lucio-Gutiérrez, R.; Salazar-Cavazos, J.M.D.; de Torres, N.H.W.; Castro-Ríos, R. Solid-phase microextraction followed by high-performance liquid chromato-graphy with fluorimetric and UV detection for the determination of polycyclic aromatic hydrocarbons in water. Anal. Lett. 2008, 41, 119–136. [Google Scholar] [CrossRef]
  44. Liu, H.X.; Liu, L.; Li, Y.; Wang, X.M.; Du, X.Z. Preparation of a robust and sensitive gold-coated fiber for solid-phase microextraction of polycyclic aromatic hydrocarbons in environmental waters. Anal. Lett. 2014, 47, 1759–1771. [Google Scholar] [CrossRef]
  45. Guo, M.; Song, W.L.; Wang, T.E.; Li, Y.; Wang, X.M.; Du, X.Z. Phenyl-functionalization of titanium dioxide-nanosheets coating fabricated on a titanium wire for selective solid-phase microextraction of polycyclic aromatic hydrocarbons from environment water samples. Talanta 2015, 144, 998–1006. [Google Scholar] [CrossRef] [PubMed]
  46. Zhang, Y.D.; Yang, Y.X.; Li, Y.; Wang, X.M.; Du, X.Z. Growth of cedar-like Au nanoparticles coating on an etched stainless steel wire and its application for selective solid-phase microextraction. Anal. Chim. Acta 2015, 876, 55–62. [Google Scholar] [CrossRef]
Figure 1. SEM images of Ti wires anodized in aqueous solution of NH4F. Anodic conditions: time, 30 min; voltage, 20 V; temperature, 25 °C. Concentration of NH4F (ω%): 0.1% (a), 0.25% (b), 0.5% (c), 1.0% (d), 2.5% (e), 5.0% (f).
Crystals 11 01384 g001
Figure 2. SEM images of Ti wires anodized in ethylene glycol containing NH4F. Anodic conditions: time, 30 min; voltage, 20 V; temperature, 25 °C; electrolyte composition, ethylene glycol concentration (50%, v/v). Concentration of NH4F (ω%): 0.1% (a), 0.25% (b), 0.5% (c), 1.0% (d), 2.5% (e), 5.0% (f).
Crystals 11 01384 g002
Figure 3. SEM images of Ti wire anodized in ethylene glycol solution of NH4F. Electrochemical anodization condition: time, 30 min; voltage, 20 V; temperature, 25 °C; electrolyte composition, NH4F concentration 0.50% (ω%). The concentration of ethylene glycol (v/v): 20% (a), 50% (b), 60% (c), 80% (d).
Crystals 11 01384 g003
Figure 4. SEM images of in-situ titanium oxide wires at different voltages (a) 10 V; (b) 15V; (c) 20 V; (d) 25 V; (e) 30 V; (f) 25 V.
Crystals 11 01384 g004
Figure 5. SEM images of the bare Ti wire (a) × 500, (c) × 50,000) and the Ti-TiO2NTs fiber (b) ×500, (d) ×50,000).
Crystals 11 01384 g005
Figure 6. EDS spectra of the Ti wire (a) and the TiO2NTs/Ti fiber (b).
Crystals 11 01384 g006
Figure 7. Effect of extraction time (a), desorption time (b), temperature (c), stirring rate, (d), and ionic strength (e) on extraction efficiency.
Crystals 11 01384 g007
Figure 8. Chromatograms of direct HPLC and SPME-HPLC for PAHs in wastewater. Direct injection (a), SPME-HPLC with TiO2NTs/Ti fiber (b), SPME-HPLC with TiO2NTs/Ti fiber spiked wastewater at 5 μg·L−1 (c) and at 10 μg·L−1 (d).
Crystals 11 01384 g008
Table 1. Analytical parameters of the proposed method with the TiO2NTs/Ti fiber.
PAHsLinearity (μg·L−1)R2Recovery a
%
RSD (%) aLODs/(μg·L−1)LOQs/(μg·L−1)
Single Fiber
(n = 5)
Fiber-to-Fiber
(n = 3)
Nap0.2–5000.998990.44.77.60.040.15
Flu0.2–5000.99851073.86.80.050.17
Phe0.2–5000.99921184.25.20.040.13
Ant0.2–5000.998092.44.07.40.030.12
Flt0.2–5000.998787.44.37.90.040.14
Pyr0.2–5000.999192.83.56.30.050.18
a Calculated at the concentration level of 50 μg·L−1.
Table 2. Analytical results of PAHs in different environmental water samples.
Water SamplesPAHsOriginal/(μg·L−1)Spiked with 5 μg·L−1Spiked with 10 μg·L−1
Detected/(μg·L−1)Recovery/%RSD/%Detected/(μg·L−1)Recovery/%RSD/%
Tap waterNapND a4.8597.07.19.1291.27.9
FluND5.381085.611.31136.7
PheND4.2284.46.311.72117.27.1
AntND4.0681.25.48.7387.35.8
FltND5.951196.811.68116.87.3
PyrND4.4188.24.39.0590.55.5
River waterNap3.699.26106.67.812.2789.68.7
Flu2.576.8390.24.911.8594.35.8
Phe3.437.8593.16.215.21113.36.9
Ant1.124.8178.65.910.1691.46.1
Flt1.347.02110.76.512.05106.37.3
Pyr0.826.78116.54.411.24103.95.1
WastewaterNap1.976.2389.48.413.02108.88.9
Flu3.128.65106.56.212.3694.27.6
Phe2.626.8790.27.911.2489.18.3
Ant2.346.6390.37.311.1490.38.5
Flt0.366.34118.38.111.76113.58.7
Pyr0.896.53110.95.211.98111.06.3
Rain waterNap1.827.17105.17.911.3796.28.6
FluND4.8997.85.38.5285.26.1
Phe0.885.0786.27.311.76108.18.2
Ant3.758.2894.65.815.22110.76.7
Flt1.546.94106.16.910.9995.237.6
PyrND5.07101.44.610.78107.85.1
a ND, Not detected or lower than LOD.
Table 3. Comparison of the proposed method with other reported methods.
Methods aAnalytesTime (min)Linear Ranges (μg⋅L−1)LOD (μg⋅L−1)RSD (%)Recovery (%)Refs
PDMS-SPME-GC-MSNap, Flu, Phe, Ant, Flt, Pyr900.1–1000.03–0.24<1969–105[41]
AuNPs-SPME-GC-FIDNap, Flu, Ant, Flt500.05–3000.025–0.252.49–7.9078.4–119.9[42]
PDMS/DVB-SPME-HPLC-UVNap, Flu, Ant, Phe, Pyr600.04–150.005–0.0270.97–2.2181.23–89.11[43]
AuMPs-SPME-HPLC-UVNap, Flu, Ant, Phe, Pyr500.20–5000.016–0.222.03–11.786.0–112.9[44]
ph-TiO2NS-SPME-HPLC-UVNap, Flu, Phe400.05–3000.008–0.0436.13–9.4586.2–112[45]
AuNPs-SPME-HPLC-UVNap, Phe200.1–3000.008–0.0373.49–9.2682.74–110.0[46]
TiO2NTs/Ti-SPME-HPLC-UVNap, Flu, Phe, Ant, Flt, Pyr500.20–5000.03–0.053.5–7.987.4–118Present method
a PDMS, polydimethylsiloxane; MS, mass spectrometry; AuNPs, gold nanoparticles; DVB, divinylbenzene; AuMPs, gold microparticles; ph-TiO2NS, phenyl-functionalization of titanium dioxide-nanosheets; AuNPs, Au nanoparticles.
Publisher’s Note: MDPI stays neutral with regard to jurisdictional claims in published maps and institutional affiliations.

