Article

Effect of Annealing on Anisotropic Tensile Properties of Al–12%Si Alloy Fabricated by Laser Powder Bed Fusion

1
Department of Materials Process Engineering, Graduate School of Engineering, Nagoya University, Furo-cho, Chikusa-ku, Nagoya 464-8603, Japan
2
Aichi Center for Industry and Science Technology, 1267-1 Akiai, Yakusa-cho, Toyota 470-0356, Japan
*
Author to whom correspondence should be addressed.
Crystals 2020, 10(11), 1007; https://doi.org/10.3390/cryst10111007
Submission received: 30 September 2020 / Revised: 3 November 2020 / Accepted: 4 November 2020 / Published: 5 November 2020

Abstract

:
In this study, we systematically investigated microstructures and tensile properties of an Al–12mass%Si alloy additive-manufactured by laser powder bed fusion (LPBF) process and subsequently annealed at various temperatures. Microstructure of the as-fabricated sample was characterized by a number of melt pools consisting of α-Al phases surrounded by Si eutectic phases. Fine Si precipitates were observed in the α-Al phase in the sample annealed at 200 °C. The eutectic Si phase appears to agglutinate, resulting in a coarsened Si phase formed at high temperatures above 300 °C. The initial cellular microstructure completely disappears and a number of coarsened Si phases and plate-shaped intermetallic phases (β-AlFeSi) were formed in the sample annealed at 530 °C. However, the grain morphology of the α-Al matrix slightly changed after the annealing at high temperatures. The as-fabricated specimen showed a high strength above 400 MPa and a low ductility of below 10% in total elongation. The tensile ductility varied depending on the tensile direction. The annealed specimens exhibited a lower tensile strength and larger elongation, whereas the direction dependence of the tensile properties was less pronounced in the specimens annealed at higher temperatures. The anisotropic tensile ductility can be rationalized by preferential fractures occurred around melt pool boundaries.

Graphical Abstract

1. Introduction

Additive manufacturing (AM) is a process which enables to fabricate complex-shaped parts directly by using computer-aided design (CAD) data without the need of any machining facilities [1,2,3], which is widely known as 3D printing. With the first AM patent coming out in 1986 [4], the AM technology has attracted more and more attention in the last decades. Especially in the last ten years, the numbers of the patents and patent families relevant for AM increased to approximately 95,000 and 43,000, respectively [5]. Among the AM techniques, the laser powder bed fusion (LPBF) process, including direct metal laser sintering (DMLS), selective laser melting (SLM) and selective laser sintering (SLS), enables to additively manufacture dense metal parts by using an energy beam (a laser) to melt and solidify the metal/alloy powders layer by layer in a descending bed [6,7,8]. Compared with other AM techniques (such as electron beam melting (EBM)), the LPBF process can build metal parts with a relatively high surface quality and geometrical accuracy [1], so it is expected to widely use in the automotive, aerospace and medical fields. Aluminum alloys are widely used for lightweight materials of aerospace or automotive [9,10,11]. Since Al–Si alloys, such as Al–12mass%Si alloy or Al–10mass%Si–0.3mass%Mg (AlSi10Mg) alloy, have good flowability and relatively low melting temperatures [12], these alloys are widely used for the LPBF process to manufacture dense alloy parts with high relative densities above 99.5% [13,14,15,16,17]. A number of researchers have reported microstructural features of the Al–Si alloys fabricated by LPBF process [18,19,20,21,22,23,24,25,26]. The LPBF-fabricated Al–Si alloys show much higher strength (370~470 MPa) than the conventionally cast Al alloys [26,27,28]. The high strength might be provided by the characteristic microstructure formed due to the rapid solidification under an ultra-high cooling rate during the LPBF process [29,30,31]. However, the high strength is accompanied by poor ductility (tensile elongation < 5%) and anisotropic tensile properties in the LPBF-fabricated Al–Si alloys [18,31]. These properties could be key issues to consider industrial applications. It has been reported that controlling the unique microstructure by post processing (e.g., heat treatments [26,32,33] or hot isostatic pressing [34]) would contribute to not only improved mechanical properties but also control of the direction dependence of physical properties [18,28] in the LPBF-fabricated alloys.
It has been demonstrated that the heat treatments significantly influenced the tensile properties [32] and impact toughness [33] of the Al–12%Si alloy fabricated by LPBF process. For instance, the strength decreased to approximately 170 MPa by solution heat treatments at high temperatures above 500 °C, and the tensile ductility substantially increased to approximately 25% in total elongation [35]. In order to control the mechanical properties of the LPBF-fabricated Al–12%Si alloy by heat treatments, it could be necessary to systematically investigate its microstructural development and the associated mechanical properties during heat treatments at various temperatures. In particular, there are few studies on the varied direction dependence of tensile properties by the post-annealing at various temperatures widely ranging from 200 to 530 °C.
In the present study, microstructure and texture of the LPBF-fabricated Al–12%Si alloy subsequently annealed at high temperatures of 200 °C, 300 °C, 330 °C, 350 °C and 530 °C were systematically characterized. These results were compared with a thermodynamic equilibrium calculation for constitute phases in the studied alloy composition. The hardness test and tensile test were carried out to examine a change in tensile properties and their direction-dependence (parallel or normal to the building direction) of LPBF-fabricated Al–12%Si alloy by annealing at various temperatures.

2. Experimental Procedure

The Al–12%Si alloy powder particles with sizes ranging from 1 to 30 μm were produced by using gas atomization process. The block samples (15 × 15 × 10 mm3) were built in Ar atmosphere at ambient temperature by using 3D systems ProX 200 printer (3D Systems, Rock Hill, SC, USA). The optimized process parameters were as follows: focus diameter, 100 μm; hatch spacing, 100 μm; thickness of powder layer, 30 μm; laser scanning speed, 1.2 m/s, laser power, 190 W. The laser scanning strategy was applied using a hexagonal island pattern with a 90° rotation between each layer, as described in detail elsewhere [36]. All samples exhibited high relative densities above 99% measured by image analysis (Image J, National Institutes of Health, Madison, WI, USA). The relative densities were analyzed by measuring the area fraction of pores using optical micrographs. Optimization of the laser processing parameters for fabricating dense Al–12%Si alloy samples will be described in future papers. Table 1 lists the nominal chemical composition of the Al–12%Si alloy powder and the composition of the LPBF-fabricated alloy samples measured by inductively coupled plasma-atomic emission spectrometry (ICP–AES) (Hitachi, Fukuoka, Japan). The major elements of Si, Fe and Mg in the LPBF-fabricated alloy samples were within the limit of nominal chemical composition. Hereafter all compositions are given in mass percent (mass%) unless otherwise noted. It is notable that the studied alloy contains 0.07% Fe as an impurity. The block samples were used for microstructural observations and Vickers hardness tests. The samples were annealed at different temperatures ranging from 200 to 350 °C for holding time of 2 h and 530 °C for a holding time of 6 h, followed by water-quench. In order to investigate the natural age hardening, the annealed samples were held at ambient temperature for various periods up to 1.2 × 10³ Ks. Dog bone shaped specimens (width, 3 mm; thickness, 2 mm; gauge length, 14 mm) were used for the tensile test, as illustrated in Figure 1. The used specimens are equivalent to No. 14A test piece (specified in JIS Z2201). The specimens were cut from large-sized block samples (55 × 50 × 15 mm3).
Before optical microscopic observation, the sample cross-sections were mechanically polished and subsequently electro-polished at ambient temperature using a mixture of perchloric acid and ethyl alcohol of 1:9 in volume ratio. The optical micrographs were taken by an upright microscope (Nikon Eclipse 150N with Nikon DS-Ri1 digital camera, Nikon, Tokyo, Japan). The sample cross-sections for scanning electron microscopic (SEM) observations were ion-polished by using JEOL Cross Section Polisher (JEOL, Tokyo, Japan). The SEM observations were carried out by using a field-emission type scanning electron microscope (FE-SEM, JEOL JSM-7401, JEOL, Tokyo, Japan) equipped with an electron backscatter diffraction (EBSD) detector. The EBSD analysis with a step size of 2 μm was carried out to identify the orientation distributions of the α-Al matrix. The samples for transmission electron microscopic (TEM) observations were cut from the block samples and ion milled by a JEOL ion slicer (JEOL, Tokyo, Japan). The TEM observations were performed on a JEOL JEM-2100Plus (JEOL, Tokyo, Japan) equipped with an energy dispersive X-ray spectroscopy (EDS) detector. Vickers hardness tests were performed on the cross-sections of mechanically polished samples at ambient temperature under a load of 9.8 × 10⁻² N. More than ten indentation tests were carried out on each sample. The uniaxial tensile tests were carried out at an initial strain rate of 1.2 × 10⁻³ s−1 at ambient temperature. Three tests were performed for each specimen.

3. Results and Discussion

3.1. Microstructure

The thermodynamic equilibrium calculation of the Al–Si–Fe ternary system was calculated for the experimentally measured composition of Al–11.9%Si–0.1%Fe as listed in Table 1, using a thermodynamic database for the Al-based multi-component system (PanAl [37]). Figure 2 presents (a) a vertical section of Al–Si–0.1%Fe ternary phase diagram and (b) Scheil simulation for the fraction of solid phases at different temperatures. According to the calculated diagram (as shown in Figure 1a,b), the solidification path of the studied composition (Al–11.9%Si–0.1%Fe) could be conjectured. The initial solid of α-Al (fcc) phase solidifies at approximately 582 °C, as shown in Figure 2b. Since the studied composition is close to a eutectic composition (liquid (L) → α + Si) in an Al–Si binary system, solid phases form at the eutectic temperature of 576 °C, resulting in the decomposition into α-Al and Si (diamond) phases at lower temperatures. A three-phase region of α-Al + Si + β-AlFeSi (τ6-Al9Fe2Si2) [38,39] appears in the calculated phase diagram of the Al–Si–Fe ternary system. The phase diagram indicates the applied annealing temperatures correspond to the three-phase region in the studied alloy composition.
Figure 3 shows the optical micrographs observed from the different sections (a,c,e) parallel and (b,d,f) normal to the building direction (z axis) of the as-fabricated and annealed samples. The as-fabricated sample exhibits microstructures composed of several melt pools with an arc-shaped pattern, as shown in Figure 3a. In the sections normal to the z axis, the melt pools were observed from the top view exhibiting a columnar pattern (Figure 3b). The observed cross-hatched pattern of the columnar melt pool corresponds to the laser scanning pattern during the LPBF process. These microstructural features were observed in the 300 °C/2 h annealed sample as well (Figure 3c,d), whereas a number of fine particles (dark contrast) are homogeneously distributed in the sample annealed at 530 °C/6 h (Figure 3e,f). The change in microstructure with heat treatments is similar to that in the Al-Si alloys fabricated by LPBF process in the literature [18,26,31].
Figure 4a–d depicts the orientation color maps of the as-fabricated and annealed samples analyzed by the EBSD technique. The orientations along the building direction (z axis) are shown in various colors according to a color-coded triangle of the inverse pole figure in Figure 4. The observed grain morphologies in the as-fabricated sample (Figure 4a,b) correspond to the solidification microstructure of α-Al phase in the observed melt pools (Figure 3a,b). In the observed section normal to the z axis of the as-fabricated sample (Figure 4a), a number of equiaxed grains were located in the center region of columnar scanning laser tracks (corresponding to the melt pools), whereas fine grains were often localized along the edges of columnar tracks (corresponding to melt pool boundaries). Notably, the preferred <001> orientation along the z axis was observed more frequently in the center of the melt pools. In the section parallel to the z axis of the as-fabricated sample (Figure 4b), a number of grains were elongated along the z axis within the melt pools. Smaller and equiaxed grains were localized close to the melt pool boundaries. The elongated grains often exhibit the <001> orientation (colored in red) along the z axis. The observed grain morphology corresponds well to the analyzed result of the section normal to the z axis (Figure 4a). The grain morphology of the α-Al matrix was observed in the sample annealed at 300 °C (Figure 4c). These grains appear slightly coarsened after the annealing at 530 °C/6 h (Figure 4d), whereas the morphology remains unchanged. To evaluate the crystallographic texture evolution after annealing at high temperatures, the pole figures determined by EBSD analyses were utilized, as shown in Figure 4e–h. In the observed section parallel to the z axis of the as-fabricated sample (Figure 4f), the grains exhibit the orientation distributions with strong intensities concentrated on the center of the (001) pole figure, resulting in the development of a {001} texture in the as-fabricated samples. However, in the observed section normal to the z axis, the orientation distributions were broader and weaker than that in the observed section parallel to the z axis (Figure 4e). The results indicate that the <001>-oriented grains grow along the direction parallel to the z axis, which agreed well with the orientation color map (Figure 4b). After annealing at 300 °C and 530 °C, the concentrated orientation distributions were also observed, whereas the intensities slightly decreased, as shown in Figure 4g,h. In consequence, the results obviously indicate a high microstructural stability of the α-Al matrix in the LPFB-fabricated Al–12%Si alloy at high temperatures.
Figure 5 displays SEM micrographs of as-fabricated and annealed samples. In the section normal to the z axis of the as-fabricated sample (Figure 5a), a cellular microstructure comprising of equiaxed α-Al phases surrounded by fine Si eutectic phase were observed. The elongated cellular microstructure along the z axis was observed in the section parallel to the z axis (Figure 5b), indicating the columnar α-Al phase elongated to the building direction. After the annealing at 200 °C/2 h (Figure 5c), the cellular microstructure was observed. However, most of Si particles (in α-Al/Si eutectic microstructure) become relatively coarser and fine Si phases locally precipitate in the α-Al phase. After the annealing at 300 °C/2 h or 330 °C/2 h (Figure 5d,e), the eutectic Si phases appear agglutinated, resulting in the formation of locally coarsened Si phase in the α-Al matrix. In addition, fine Fe-rich phase (bright contrast) was locally observed. The change in microstructure becomes more pronounced at higher annealing temperature. After the annealing at 530 °C/6 h (Figure 5f), the initial cellular microstructure completely disappears. A number of coarsened Si phases with a size of several micrometers and plate-shaped intermetallic phases were observed in the α-Al matrix. The Fe-rich phases are expected to β-AlFeSi phase according to the calculated phase diagram (Figure 2a). The change in microstructure with heat treatments is similar to that in the Al-Si alloys fabricated by the LPBF process in the previous studies [18,26,31].
Figure 6 displays SEM images showing microstructures near the melt pool boundaries in the as-fabricated sample and subsequently annealed sample (300 °C/2 h). Most of the columnar α-Al phases appear elongated to the center of the melt pool (Figure 6a). The elongated direction corresponds to the solidification direction of the primary α-Al phase along the direction of heat flow inside the melt pools by laser irradiation during the LPBF process. The primary α-Al phase appears relatively coarsened and equiaxed around the melt pool boundaries (Figure 6a). In addition, the Si particles along the melt pool boundaries become coarse in comparison with those observed in the melt pools (Figure 5a,b). The coarsened microstructure localized near melt pool boundaries suggests a relatively slow growth of solid phases locally occurred around the melt pool boundaries during solidification. Note that the locally coarsened microstructure along the melt pool boundaries remains after the annealing at 300 °C (Figure 6b).
Figure 7 presents TEM micrographs showing microstructures of the as-fabricated and 530 °C/6 h annealed sample. A number of elongated α-Al phases surrounded by fine Si phases were observed in the as-fabricated sample (Figure 7a). This microstructural morphology corresponds well to the SEM observation (Figure 5b). The EDS analyses confirmed that the primary α-Al phases were surrounded by fine Si phases (Figure 7a2,a3). Note that the enrichment of Fe element was not found in the fine cellular microstructure (Figure 7a4). Although bend contours were often observed in the 530 °C/6 h annealed sample (Figure 7b), several coarsened Si particles and a plate-shaped intermetallic phase were observed. According to the EDS analysis, the Al, Si and Fe elements were detected in the intermetallic phase (Figure 7b2–b4). This result indicated that the intermetallic phase could be β-AlFeSi phase, which is in agreement with the three-phase region of α-Al + Si + β-AlFeSi at 530 °C in the calculated phase diagram (Figure 2a).

3.2. Mechanical Properties

Figure 8 shows a change in Vickers hardness measured in the sections parallel to the z axis of the LPBF-fabricated samples as a function of annealing temperature. The as-fabricated sample shows a relatively high hardness value of approximately 133 HV. In the sample annealed at 200 °C/2 h, the hardness decreased to approximately 115 HV. In the samples annealed at 300 °C to 350 °C/2 h, the hardness continuously decreased from 95 HV to 70 HV. In the samples annealed at 530 °C/6 h, the hardness was significantly reduced to approximately 55 HV. Figure 9 presents a variation in Vickers hardness of 300 °C/2 h and 530 °C/6 h annealed samples as a function of aging time at ambient temperature (natural aging time). In both annealed samples, the hardness is almost constant independent of natural aging time, indicating a slight hardening of the Al–12%Si by natural aging. This result is different from the natural aging behavior of the solution treated Al–10%Si–0.3%Mg (AlSi10Mg) alloy fabricated by LPBF process [18]. These results suggest the enhanced hardening presumably due to the formation of metastable phases associated with Mg2Si in the LPBF-fabricated Al–10%Si–0.3%Mg alloy at ambient temperature.
Figure 10 presents nominal stress-strain curves of the LPBF-fabricated Al–12%Si alloy specimens. The as-fabricated specimen shows a relatively high tensile strength above 400 MPa and a relatively low ductility of below 10% in total elongation. The relatively high tensile strength could be contributed to the characteristic microstructure of supersaturated α-Al matrix (Figure 5a,b) formed under a rapid cooling rate (105–107 Ks−1) during the LPBF process [29,30,31]. The annealed specimens exhibit a lower strength and larger elongation. This trend appears more pronounced in the specimen annealed at higher temperatures. The change in the tensile properties could be considered due to the microstructural development during annealing (Figure 5c–f). After annealing at high temperatures, the solute Si precipitated from the supersaturated α-Al matrix to form Si particles, resulting in a reduction in the solute Si in the α-Al matrix. The decrease in the Si content in the Al matrix would reduce the solid solution strengthening, resulting in lower strength and hardness (Figure 8 and Figure 10). It is noteworthy that the as-fabricated specimen exhibits different tensile ductility depending on the tensile direction (parallel or normal to the z axis). The total elongation in the specimen tensile-deformed along the parallel direction to z axis is approximately 10% (Figure 10a), which is larger than that in the specimen deformed along the normal direction to z axis (approximately 5%, as shown in Figure 10b). The direction dependence of tensile elongation is observed in the specimens annealed at different temperatures ranging from 200 °C to 330 °C, whereas in the 530 °C annealed specimen, the tensile elongation is almost constant of approximately 20% independent of the tensile direction.
The changes in tensile properties (maximum stress, total elongation, 0.2% proof stress and strain hardening exponent) as results of annealing at different temperatures are summarized in Figure 11 and Table 2. To evaluate the anisotropic tensile properties, the anisotropy (A) is defined as follows [40,41]:
A = X n X p X n × 100 %
where Xn and Xp represent the tensile properties (tensile stress and elongation) normal and parallel to the building direction (z axis), respectively. The as-fabricated specimens show high tensile strength values of approximately 462 MPa and 425 MPa in the tensile directions normal and parallel to the z axis, respectively (Figure 11a). The direction-dependence of 0.2% proof stress (yield strength) is also found in the as-fabricated specimen (Figure 11c). The anisotropic behaviors in tensile stress and elongation are significant in the as-fabricated specimens (Table 2). The similar direction-dependence of tensile properties were also reported in the LPBF-fabricated Al-Si alloy in the previous studies [18,33]. The tensile strength continuously decreases with increasing the annealing temperature (Figure 11a). The strength is reduced to approximately 160 MPa in both tensile directions after annealing at 530 °C/6 h. The tendency is consistent with the result of Vickers hardness test (Figure 8). A trend can be found that the tensile elongation increased with increasing the annealing temperature (Figure 11b). The direction dependence of the tensile elongation was not observed in the specimen annealed at a higher temperature of 530 °C, resulting in a low anisotropy of 4.5% in the elongation (Table 2). The as-fabricated specimen exhibits high values of strain hardening component (n), as presented in Figure 11d. The n values in the tensile-deformation along the parallel direction to z axis were approximately 0.25, which was higher than that along the normal direction (n = 0.22). The n value and its difference depending on the tensile direction become smaller in the specimen annealed at higher temperatures (Figure 11d). It is notable that the n value slightly decreased after annealing at high temperatures. It could be considered that the coarsened Si particles (Figure 5c–f) might play a role in the decrease in n values at high temperatures [42,43]. The anisotropic tensile properties were found in the LPBF-fabricated and annealed specimens (below 330 °C), whereas the anisotropy was less pronounced in the specimens annealed at higher temperatures.
Figure 12 shows the fracture surfaces of the tensile-ruptured specimens. In all specimens, numerous spherical dimples were observed on the fracture surface, indicating the ductile fracture mode. In the as-fabricated specimen, several band patterns were observed on the fracture surface of the ruptured specimen deformed along the direction parallel to the z axis (Figure 12b). The width of band patterns appears approximately 100 μm, which corresponds well to the columnar melt pool tracks observed by optical microscopy (Figure 3b). These fracture morphologies obviously indicate that the fracture preferentially occurred along the melt pool boundaries. The coarsened microstructure at melt pool boundaries (Figure 6) might lead to localized deformation, resulting in the preferential fracture occurred near the boundaries between adjacent melt pools. The preferential fracture could be a major factor in the observed direction-dependence of tensile ductility in the as-fabricated specimen. The fracture morphology was also found in the 300 °C annealed specimen (Figure 12d), whereas spherical dimples were found on the entire fracture surface of the 530 °C annealed specimen (Figure 12f). A slight direction-dependence of tensile elongation in the 530 °C annealed specimen (Figure 11b) is consistent with the formation of a homogeneous microstructure (Figure 3e,f). It is notable that the β-AlFeSi phases have negligible effect on the tensile properties due to the extremely low volume fraction (<1%). In consequence, for controlling the anisotropic tensile ductility in the LPBF-fabricated specimens, it is required to control the inhomogeneous microstructure characterized by melt pools (the selectively melted regions by scanning laser irradiation during the LPBF process).

4. Conclusions

The effect of annealing on microstructure and anisotropic tensile properties of Al–12%Si alloy fabricated by laser powder bed fusion (LPBF) process has been investigated. The main results are as follows:
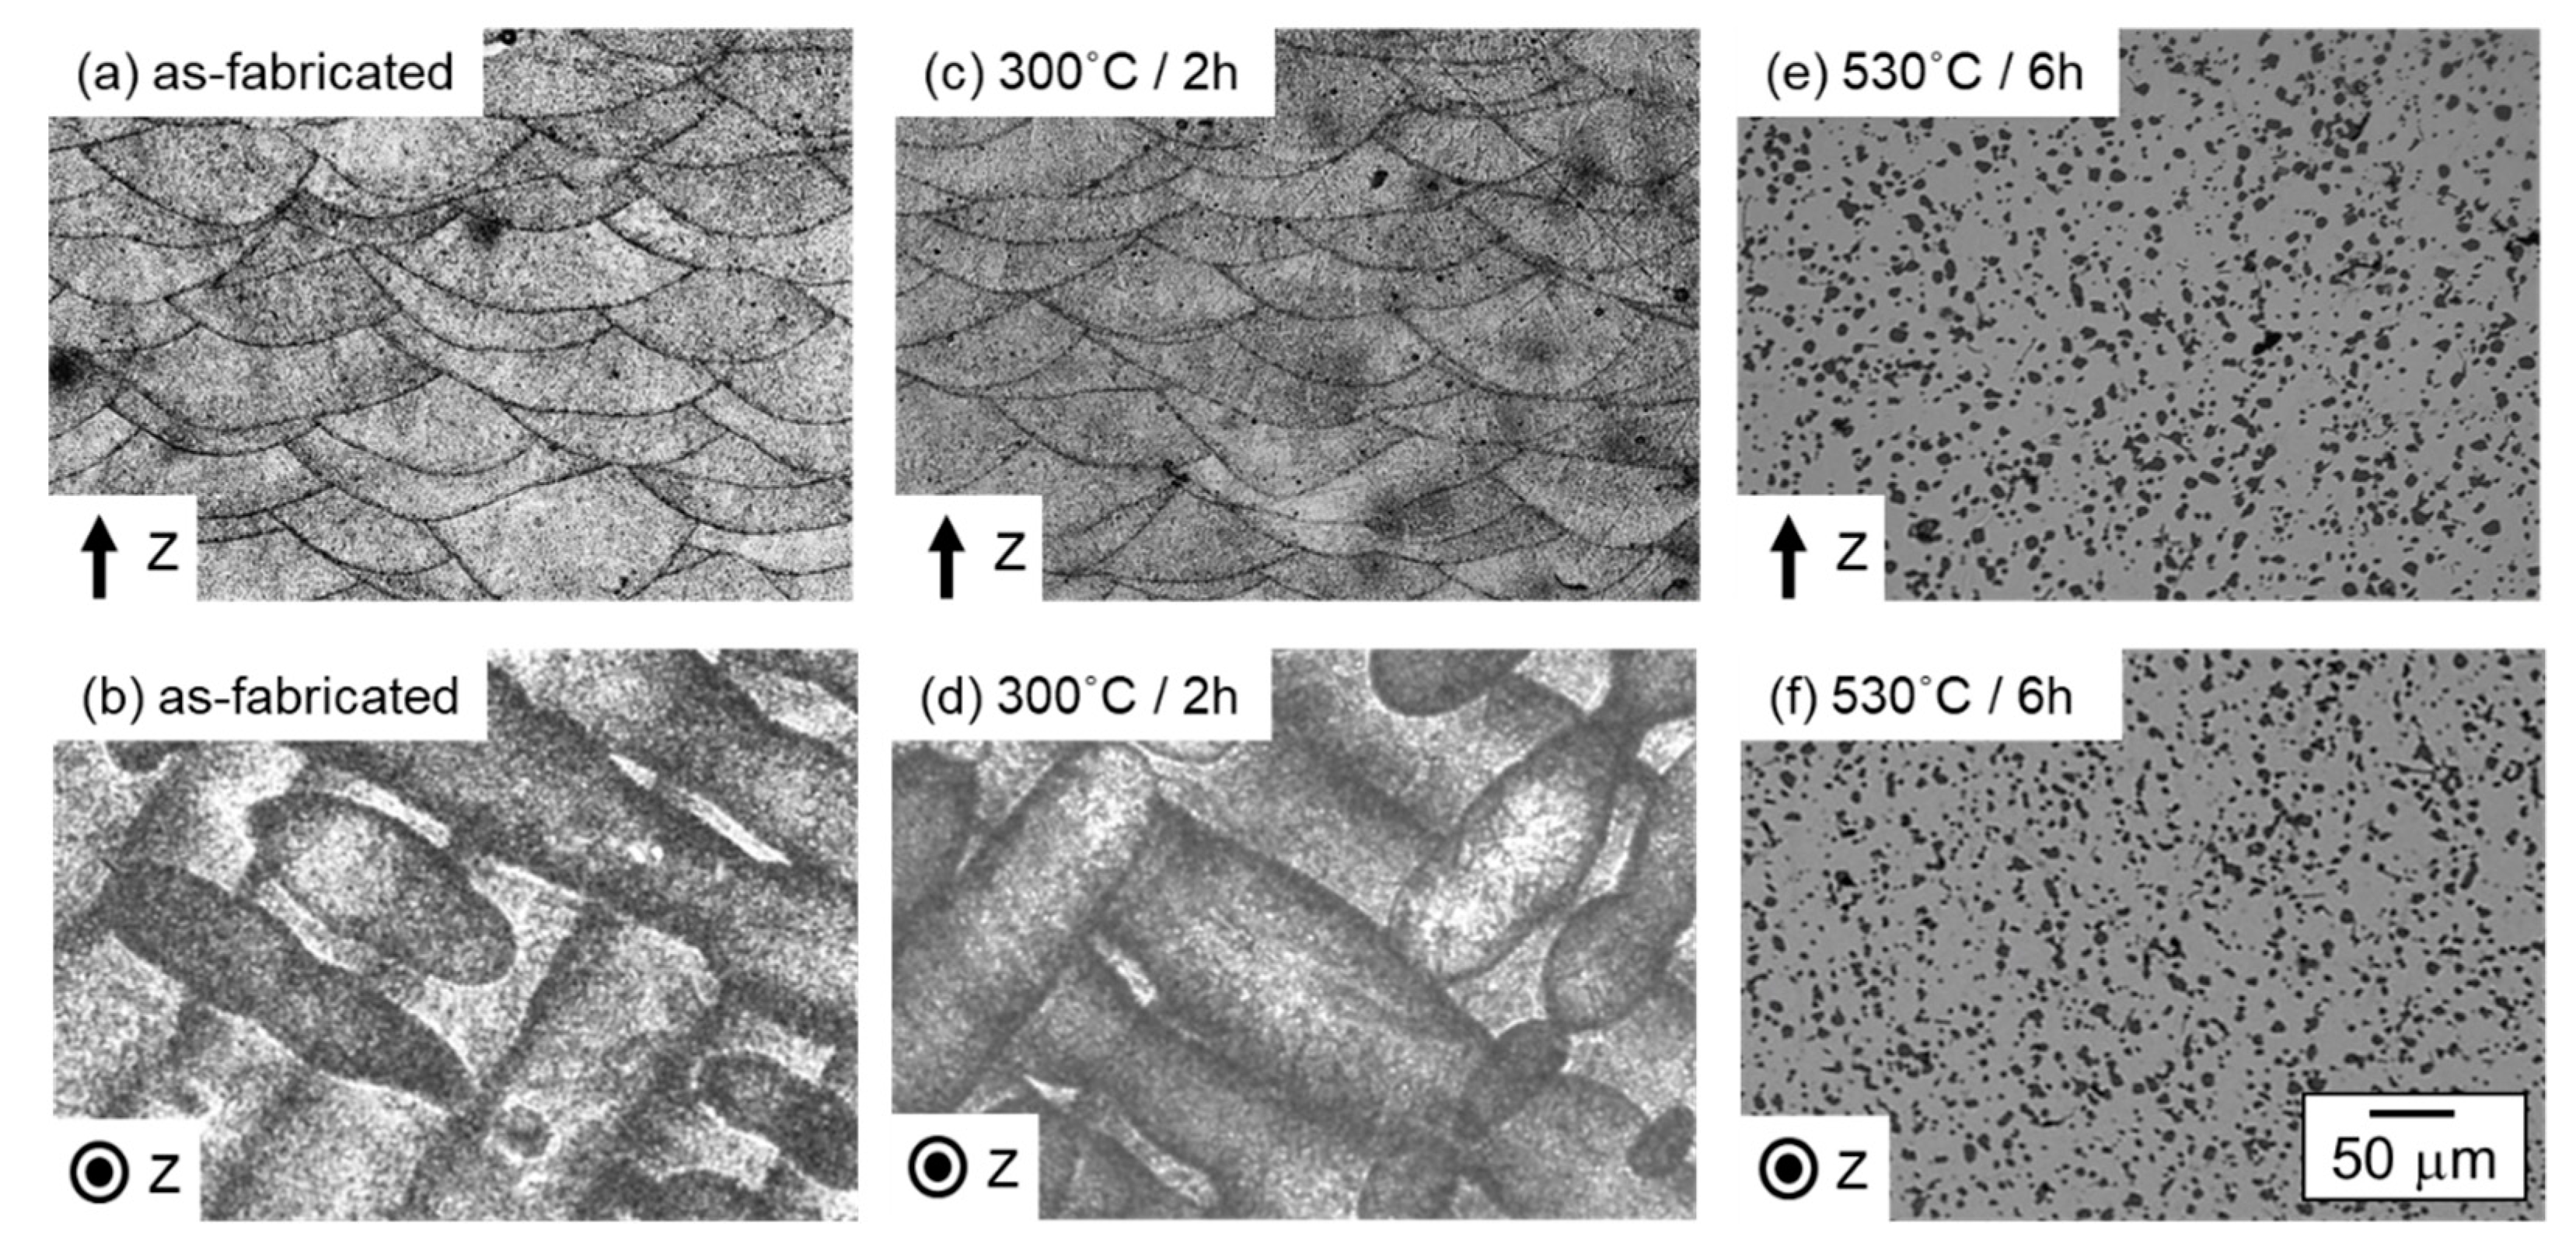
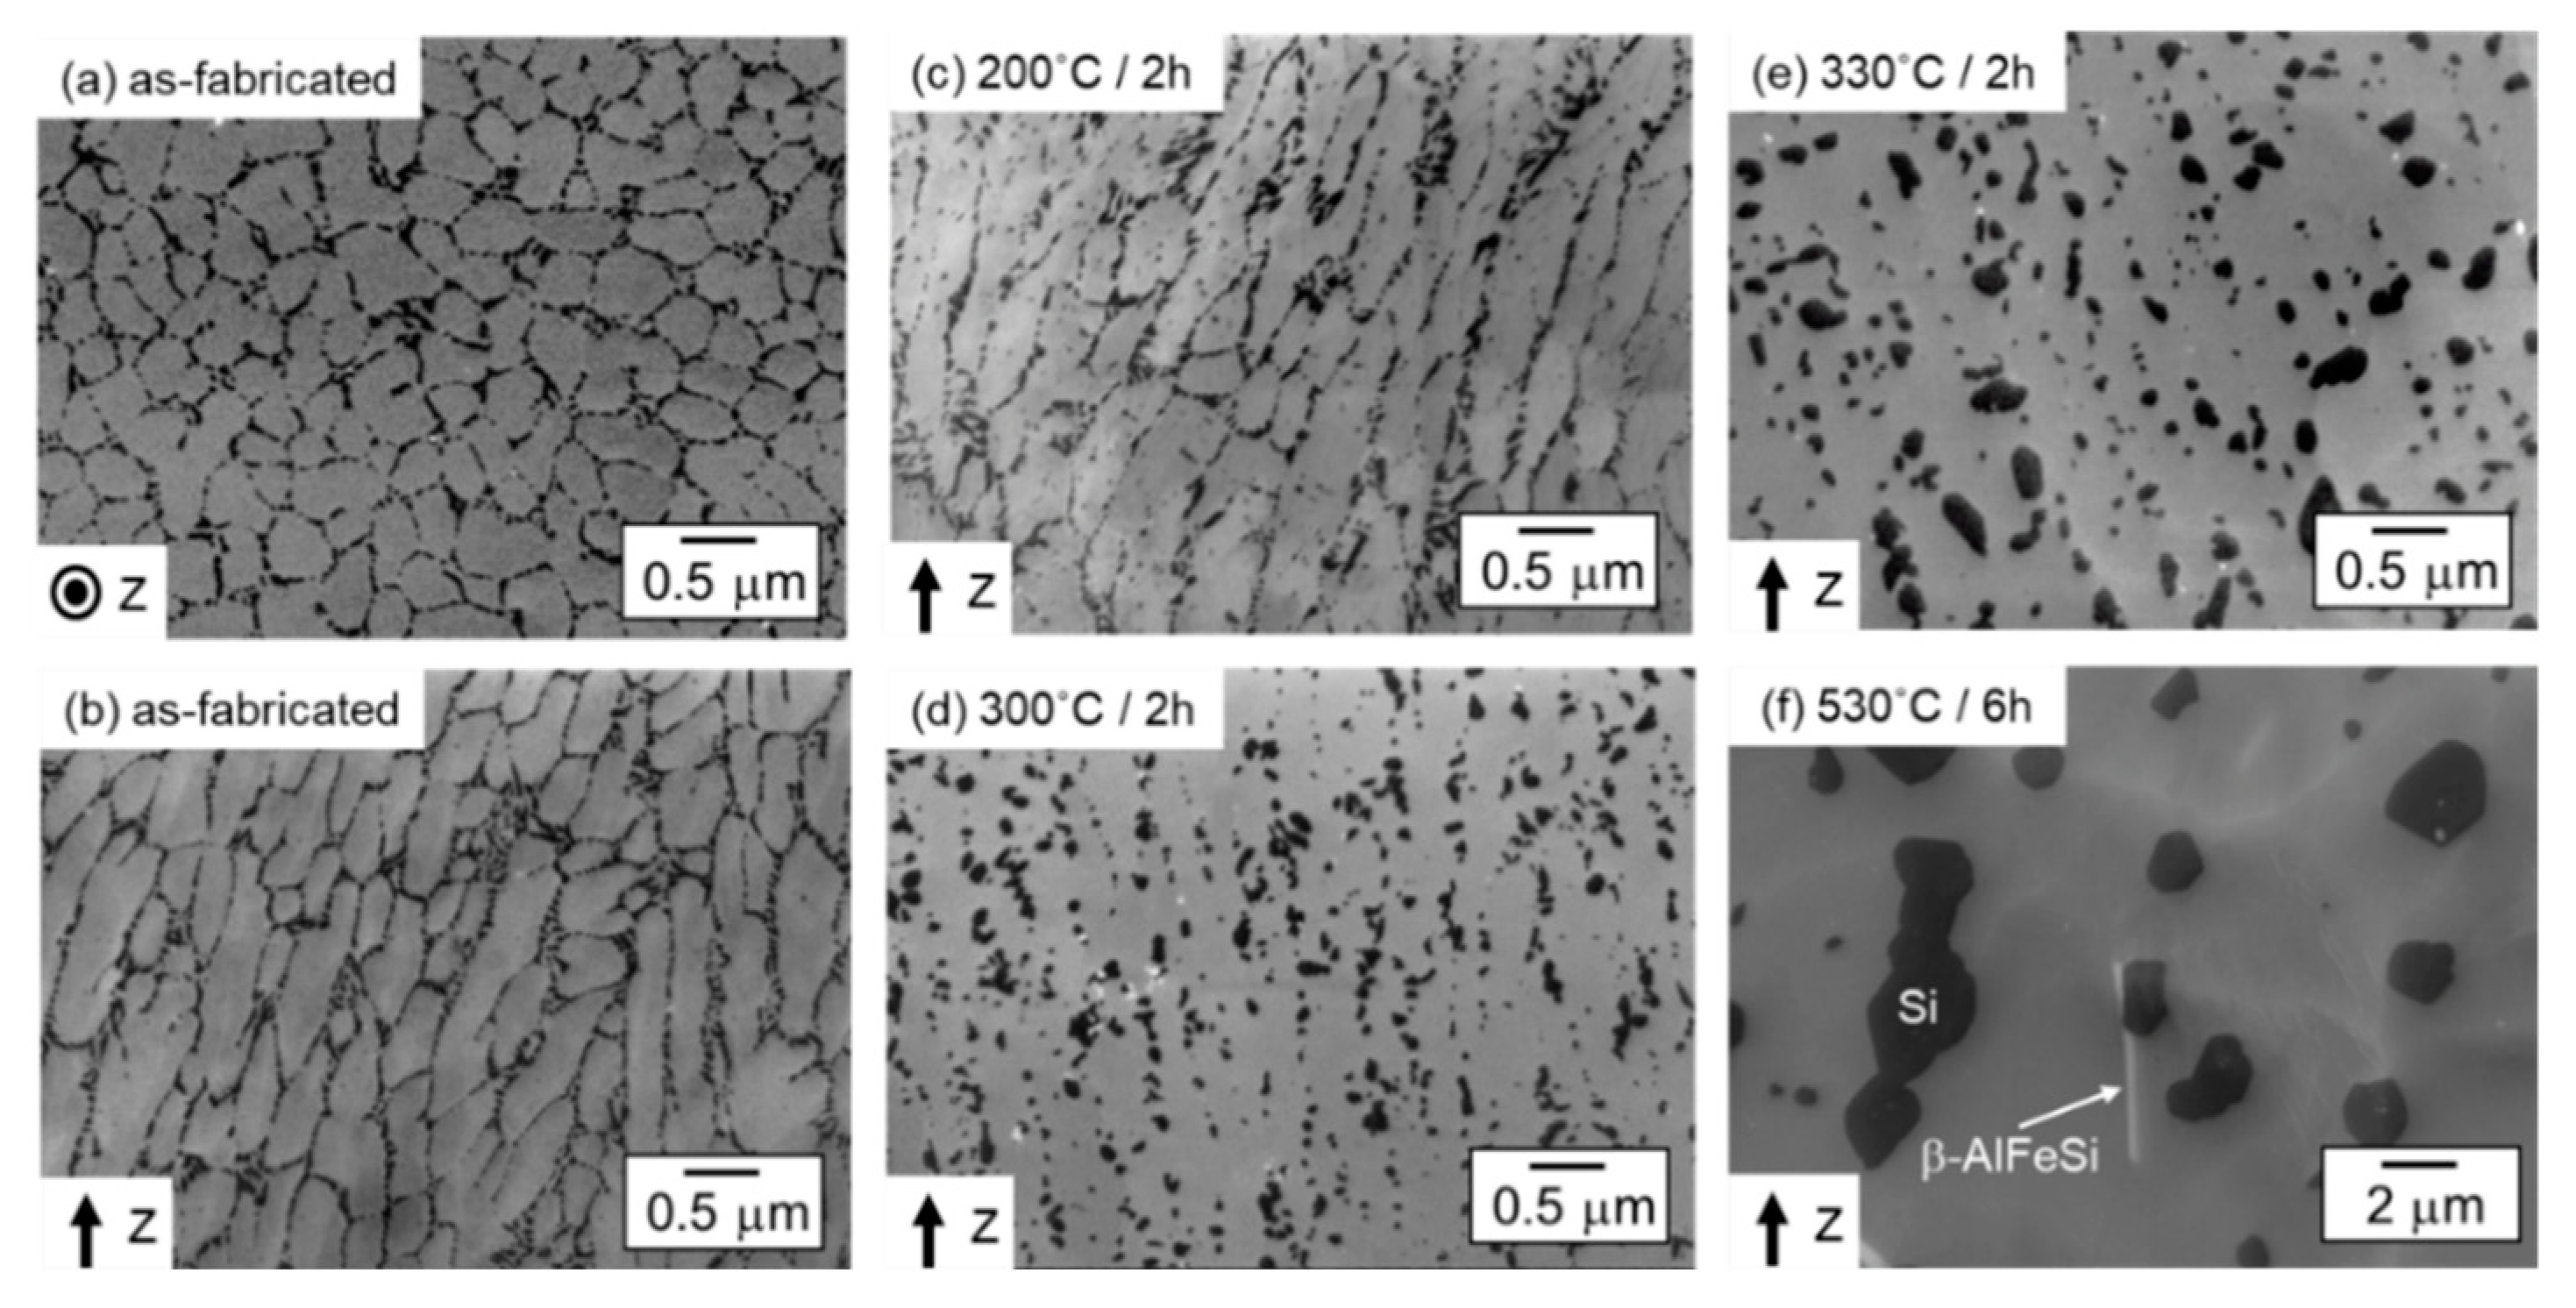
  • The as-fabricated sample shows the characteristic microstructure composed of a number of melt pools. Inside the melt pools, a cellular microstructure consists of columnar α-Al phase surrounded by fine particles of eutectic Si phase. The columnar α-Al grains are elongated along their preferred <001> orientation along the z axis.
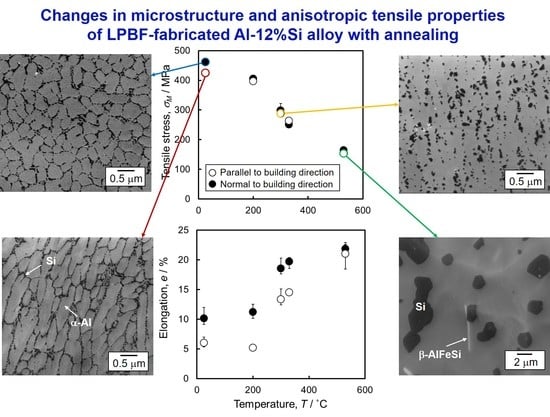
  • After annealing at 200 °C, the cellular microstructure was observed, whereas Si eutectic phase became relatively coarser and fine Si phase locally precipitated within the columnar α-Al phase. After the annealing at 300 °C or 330 °C, the eutectic Si phase appeared to agglutinate, resulting in a coarsened Si phase. The initial cellular microstructure completely disappeared and many coarsened Si phases and plate-shaped Fe-rich intermetallic (β-AlFeSi) phases were formed at annealing temperature of 530 °C. However, the grain morphology of the α-Al matrix remained after annealing.
  • The as-fabricated specimen showed a relatively high strength above 400 MPa and a low ductility of below 10% in total elongation. A different tensile ductility depending on the tensile direction was observed. The annealed specimens exhibited lower tensile strength and larger elongation, whereas the direction dependence of the tensile properties was not found in the specimen annealed at a high temperature of 530 °C. The change in tensile ductility was rationalized by the microstructural development during the annealing at various temperatures.

Author Contributions

Conceptualization, M.K. (Makoto Kobashi); methodology, N.T., T.W. and M.L.; validation, N.T., M.K. (Makoto Kobashi) and A.S.; formal analysis, M.L. and T.W.; investigation, M.L., T.W. and N.T.; resources, M.K. (Makoto Kobashi) and A.S.; data curation, M.L. and T.W.; writing—original draft preparation, M.L.; writing—review and editing, N.T., A.S., M.K. (Makoto Kobashi) and M.K. (Masaki Kato); visualization, T.W. and M.L.; supervision, M.K. (Makoto Kobashi) and N.T.; project administration, M.K. (Makoto Kobashi) and M.K. (Masaki Kato); funding acquisition, M.K. (Makoto Kobashi). All authors have read and agreed to the published version of the manuscript.

Funding

This research received no external funding.

Acknowledgments

The authors gratefully acknowledge the supports by the “Knowledge Hub Aichi”, a Priority Research Project of Aichi Prefectural Government.

Conflicts of Interest

The authors declare no conflict of interest.

References

  1. Gibson, I.; Rosen, D.; Stucker, B. Additive Manufacturing Technologies; Springer: New York, NY, USA, 2014; pp. 1–140. [Google Scholar]
  2. Sames, W.J.; List, F.A.; Pannala, S.; Dehoff, R.R.; Babu, S.S. The metallurgy and processing science of metal additive manufacturing. Int. Mater. Rev. 2016, 61, 315–360. [Google Scholar] [CrossRef]
  3. DebRoy, T.; Mukherjee, T.; Milewski, J.O.; Elmer, J.W.; Ribic, B.; Blecher, J.J.; Zhang, W. Scientific, technological and economic issues in metal printing and their solutions. Nat. Mater. 2019, 18, 1026–1032. [Google Scholar] [CrossRef] [PubMed]
  4. Apparatus for Production of Three-Dimensional Objects by Stereolithography. Available online: https://patents.google.com/patent/US4575330A/en (accessed on 19 October 2020).
  5. Patent and Litigation Trends for 3D Printing Technologies. Available online: https://www.iam-media.com/patent-and-litigation-trends-3d-printing-technologies (accessed on 19 October 2020).
  6. Herzog, D.; Seyda, V.; Wycisk, E.; Emmelmann, C. Additive manufacturing of metals. Acta Mater. 2016, 117, 371–392. [Google Scholar] [CrossRef]
  7. King, W.E.; Anderson, A.T.; Ferencz, R.M.; Hodge, N.E.; Kamath, C.; Khairallah, S.A.; Rubenchi, A.M. Laser powder bed fusion additive manufacturing of metals; physics, computational, and materials challenges. App. Phys. Rev. 2015, 2, 041304. [Google Scholar] [CrossRef]
  8. Gu, D.; Meiners, W.; Wissenbach, K.; Poprawe, R. Laser additive manufacturing of metallic components: Materials, processes and mechanisms. Int. Mater. Rev. 2012, 57, 133–164. [Google Scholar] [CrossRef]
  9. Fores, F.H. Advanced metals for aerospace and automotive use. Mater. Sci. Eng. A 1994, 184, 119–133. [Google Scholar] [CrossRef]
  10. Williams, J.C.; Starke, D.A., Jr. Progress in structural materials for aerospace systems. Acta Mater. 2003, 51, 5775–5799. [Google Scholar] [CrossRef]
  11. Lihui, L.; Kangning, L.; Cai, G.; Yang, X.; Guo, C.; Bu, G. A critical review on special forming processes and associated research for lightweight components based on sheet and tube materials. Manuf. Rev. 2014, 1, 9. [Google Scholar] [CrossRef]
  12. Trevisan, F.; Calignano, F.; Lorusso, M.; Pakkanen, J.; Aversa, A.; Ambrosio, E.P.; Lombardi, M.; Fino, P.; Manfredi, D. On the Selective Laser Melting (SLM) of the AlSi10Mg Alloy: Process, Microstructure, and Mechanical Properties. Materials 2017, 10, 76. [Google Scholar] [CrossRef] [Green Version]
  13. Olakanmi, E.O.; Cochrane, R.F.; Dalgarno, K.W. A review on selective laser sintering/melting (SLS/SLM) of aluminium alloy powders: Processing, microstructure, and properties. Prog. Mater. Sci. 2015, 74, 401–477. [Google Scholar] [CrossRef]
  14. Siddique, S.; Imran, M.; Wycisk, E.; Emmelmann, C.; Walther, F. Influence of process-induced microstructure and imperfections on mechanical properties of AlSi12 processed by selective laser melting. J. Mater. Process. Technol. 2015, 221, 205–213. [Google Scholar] [CrossRef]
  15. Liu, M.; Takata, N.; Suzuki, A.; Kobashi, M. Microstructural characterization of cellular AlSi10Mg alloy fabricated by selective laser melting. Mater. Des. 2018, 157, 478–491. [Google Scholar] [CrossRef]
  16. Kempf, A.; Hilgenberg, K. Influence of sub-cell structure on the mechanical properties of AlSi10Mg manufactured by laser powder bed fusion. Mater. Sci. Eng. A 2020, 776, 138976. [Google Scholar] [CrossRef]
  17. Zavala-Arredondo, M.; London, T.; Allen, M.; Maccio, T.; Ward, S.; Griffiths, D.; Allison, A.; Goodwin, P.; Hauser, C. Use of power factor and specific point energy as design parameters in laser powder-bed-fusion (L-PBF) of AlSi10Mg alloy. Mater. Des. 2019, 182, 108018. [Google Scholar] [CrossRef]
  18. Takata, N.; Kodaira, H.; Sekizawa, K.; Suzuki, A.; Kobashi, M. Change in microstructure of selectively laser melted AlSi10Mg alloy with heat treatments. Mater. Sci. Eng. A 2017, 704, 218–228. [Google Scholar] [CrossRef]
  19. Prashanth, K.G.; Eckert, J. Formation of metastable cellular microstructures in selective laser melted alloys. J. Alloys Compd. 2017, 707, 27–34. [Google Scholar] [CrossRef]
  20. Takata, N.; Kodaira, H.; Sekizawa, K.; Suzuki, A.; Kobashi, M. Microstructure and mechanical properties of Al–10Si–0.4Mg alloy fabricated by selective laser melting. J. Jpn. Inst. Light Met. 2017, 67, 582–588. [Google Scholar] [CrossRef] [Green Version]
  21. Liu, M.; Takata, N.; Suzuki, A.; Kobashi, M. Development of Gradient Microstructure in the Lattice Structure of AlSi10Mg Alloy Fabricated by Selective Laser Melting. J. Mater. Sci. Technol. 2020, 36, 106–107. [Google Scholar] [CrossRef]
  22. Zhou, L.; Mehta, A.; Schulz, E.; McWilliams, B.; Cho, K.; Sohn, Y. Microstructure, precipitates and hardness of selectively laser melted AlSi10Mg alloy before and after heat treatment. Mater. Charact. 2018, 143, 5–17. [Google Scholar] [CrossRef]
  23. Alghamdi, F.; Song, X.; Hadadzadeh, A.; Shalchi-Amirkhiz, B.; Mohammadi, M.; Haghshenas, M. Post heat treatment of additive manufactured AlSi10Mg: On silicon morphology, texture and small-scale properties. Mater. Sci. Eng. A 2020, 783, 139296. [Google Scholar] [CrossRef]
  24. Hadadzadeh, A.; Shalchi-Amirkhiz, B.; Odeshi, A.; Li, J.; Mohammadi, M. Role of hierarchical microstructure of additively manufactured AlSi10Mg on dynamic loading behavior. Addit. Manuf. 2019, 28, 1–13. [Google Scholar] [CrossRef]
  25. Hadadzadeh, A.; Shalchi-Amirkhiz, B.; Mohammadi, M. Contribution of Mg2Si precipitates to the strength of direct metal laser sintered AlSi10Mg. Mater. Sci. Eng. A 2019, 739, 295–300. [Google Scholar] [CrossRef]
  26. Prashanth, K.G.; Scudino, S.; Klauss, H.J.; Surreddi, K.B.; Lober, L.; Wang, Z.; Chaubey, A.K.; Kuhn, U.; Eckert, J. Microstructure and mechanical properties of Al–12Si produced by selective laser melting: Effect of heat treatment. Mater. Sci. Eng. A 2014, 590, 153–160. [Google Scholar] [CrossRef]
  27. Fousova, M.; Dvorsky, D.; Michalcova, A.; Vojtech, D. Changes in the microstructure and mechanical properties of additively manufactured AlSi10Mg alloy after exposure to elevated temperatures. Mater. Charact. 2018, 137, 119–126. [Google Scholar] [CrossRef]
  28. Hitzler, L.; Merkel, M.; Hall, W.; Ochsner, A. A Review of Metal Fabricated with Laser- and Powder-Bed Based Additive Manufacturing Techniques: Process, Nomenclature, Materials, Achievable Properties, and its Utilization in the Medical Sector. Adv. Eng. Mater. 2018, 20, 1700658. [Google Scholar] [CrossRef] [Green Version]
  29. Marola, S.; Manfredi, D.; Fiore, G.; Poletti, M.G.; Lombardi, M.; Fino, P.; Battezzati, L. A comparison of Selective Laser Melting with bulk rapid solidification of AlSi10Mg alloy. J. Alloys Compd. 2018, 742, 271–279. [Google Scholar] [CrossRef]
  30. Liu, X.; Zhao, C.; Zhou, X.; Shen, Z.; Liu, W. Microstructure of selective laser melted AlSi10Mg alloy. Mater. Des. 2019, 168, 107677. [Google Scholar] [CrossRef]
  31. Takata, N.; Liu, M.; Kodaira, H.; Suzuki, A.; Kobashi, M. Anomalous strengthening by supersaturated solid solutions of selectively laser melted Al–Si-based alloys. Addit. Manuf. 2020, 33, 101152. [Google Scholar] [CrossRef]
  32. Prashanth, K.G.; Scudino, S.; Eckert, J. Defining the tensile properties of Al-12Si parts produced by selective laser melting. Acta Mater. 2017, 126, 25–35. [Google Scholar] [CrossRef]
  33. Suryawanshi, J.; Prashanth, K.G.; Scudino, S.; Echert, J.; Prakash, O.; Ramamurty, U. Simultaneous enhancements of strength and toughness in an Al-12Si alloy synthesized using selective laser melting. Acta Mater. 2016, 115, 285–294. [Google Scholar] [CrossRef]
  34. Hirata, T.; Kimura, T.; Nakamoto, T. Effects of hot isostatic pressing and internal porosity on the performance of selective laser melted AlSi10Mg alloys. Mater. Sci. Eng. A 2020, 772, 138713. [Google Scholar] [CrossRef]
  35. Li, X.P.; Wang, X.J.; Saunders, M.; Suvorova, A.; Zhang, L.C.; Liu, Y.J.; Fang, M.H.; Huang, Z.H.; Sercombe, T.B. A selective laser melting and solution heat treatment refined Al–12Si alloy with a controllable ultrafine eutectic microstructure and 25% tensile ductility. Acta Mater. 2015, 95, 74–82. [Google Scholar] [CrossRef]
  36. Takata, N.; Nishida, R.; Suzuki, A.; Kobashi, M.; Kato, M. Crystallographic Features of Microstructure in Maraging Steel Fabricated by Selective Laser Melting. Metals 2018, 8, 440. [Google Scholar] [CrossRef] [Green Version]
  37. CompuTherm LLC, PanAluminum. Thermodynamic Database for Multi-Component Aluminum-Rich Casting and Wrought Alloys. Available online: https://computherm.com/?docs=pandat-database-manual/database-overview (accessed on 1 May 2020).
  38. Romming, C.; Hansen, V.; Gjonnes, J. Crystal structure of β-Al4.5FeSi. Acta Cystallogr. B 1994, 40, 307–312. [Google Scholar] [CrossRef]
  39. Marker, M.C.J.; Skolyszewska-Kuhberger, B.; Effenberger, H.S.; Schmetterer, C.; Richter, K.W. Phase equilibria and structural investigations in the system Al-Fe-Si. Intermetallics 2011, 19, 1919–1929. [Google Scholar] [CrossRef]
  40. Kok, Y.; Tan, X.P.; Wang, P.; Nai, M.L.S.; Loh, N.H.; Liu, E.; Tor, S.B. Anisotropy and heterogeneity of microstructure and mechanical properties in metal additive manufacturing: A critical review. Mater. Des. 2018, 139, 565–586. [Google Scholar] [CrossRef]
  41. Xiang, D.D.; Wang, P.; Tan, X.P.; Chandra, S.; Wang, C.; Nai, M.L.S.; Tor, S.B.; Liu, W.Q.; Liu, E. Anisotropic microstructure and mechanical properties of additively manufactured Co–Cr–Mo alloy using selective electron beam melting for orthopedic implants. Mater. Sci. Eng. A 2019, 765, 138270. [Google Scholar] [CrossRef]
  42. Fan, Z.; Mingzhi, H.; Deke, S. The relationship between the strain-hardening exponent n and the microstructure of metals. Mater. Sci. Eng. A 1989, 122, 211–213. [Google Scholar] [CrossRef]
  43. Mo, D.; He, G.; Hu, Z.; Liu, X.; Zhang, W. Effect of Microstructures on Strain Hardening Exponent Prediction of Cast Aluminum Alloy. Acta Metall. Sin. 2010, 46, 184–188. [Google Scholar] [CrossRef]
Figure 1. (a) Dimension of the tensile test specimen and (b) a photograph showing the appearance of the tensile test specimen used in the present study.
Crystals 10 01007 g001
Figure 2. (a) Vertical section of Al–0.1mass%Fe in Al–Si–Fe ternary phase diagram and (b) Scheil simulation for the fraction of solid phases at various temperatures.
Crystals 10 01007 g002
Figure 3. Optical micrographs showing microstructures of (a,b) as-fabricated, (c,d) 300 °C/2 h annealed and (e,f) 530 °C/6 h annealed samples observed from the sections (a,c,e) parallel and (b,d,f) normal to the building direction (z axis).
Crystals 10 01007 g003
Figure 4. (ad) Orientation color maps and (eh) corresponding (001) pole figures of (a,b,e,f) as-fabricated, (c,g) 300 °C/2 h annealed and (d,h) 530 °C/6 h annealed samples observed from the sections (a,e) normal and (bd,fh) parallel to the building direction (z axis).
Crystals 10 01007 g004
Figure 5. SEM micrographs showing microstructures of (a,b) as-fabricated, (c) 200 °C/2 h annealed, (d) 300 °C/2 h annealed, (e) 330 °C/2 h annealed and (f) 530 °C/6 h annealed samples observed from the sections (a) normal and (bf) parallel to the building direction (z axis).
Crystals 10 01007 g005
Figure 6. SEM micrographs showing microstructures near the melt pool boundaries of (a) as-fabricated and (b) 300 °C/2 h annealed samples observed from the sections parallel to the building direction (z axis).
Crystals 10 01007 g006
Figure 7. TEM bright-field micrographs showing microstructures of (a) as-fabricated and (b) 530 °C/6 h annealed samples. (a1,b1) STEM (scanning transmission electron microscopic) images and the corresponding EDS maps of (a2,b2) Al, (a3,b3) Si and (a4,b4) Fe.
Crystals 10 01007 g007
Figure 8. Change in Vickers hardness measured in the sections parallel to the building direction (z axis) of the LPBF-fabricated Al–12%Si alloy samples as a function of annealing temperature.
Crystals 10 01007 g008
Figure 9. Change in Vickers hardness measured in the sections parallel to the building direction (z axis) of 300 °C/2 h and 530 °C/6 h annealed samples as a function of aging time at ambient temperature.
Crystals 10 01007 g009
Figure 10. Nominal stress-strain curves of the LPBF-fabricated Al–12%Si alloy specimens measured at ambient temperature: (a) tensile direction normal and (b) tensile direction parallel to the building direction (z axis).
Crystals 10 01007 g010
Figure 11. Changes in (a) maximum tensile stress, (b) total elongation, (c) 0.2% proof stress (yield stress) and (d) strain hardening exponent of the LPBF-fabricated specimens with annealing temperature.
Crystals 10 01007 g011
Figure 12. Fracture morphology of (a,b) as-fabricated, (c,d) 300 °C /2 h annealed, (e,f) 530 °C/6 h annealed samples observed from (a,c,e) the sections normal to the building direction (z axis); (b,d,f) the sections parallel to the building direction (z axis).
Crystals 10 01007 g012
Table 1. The chemical composition of the LPBF-fabricated Al–12%Si alloy sample (mass%) analyzed by using inductively coupled plasma atomic emission spectrometry (ICP-AES).
AlSiCuFeMgZnCrNiMnTi
NominalBal.10.5~13.5≤0.1≤1.0≤1.0≤0.15≤0.55≤0.15
ICP-AES
Analyzed
Bal.11.870.07<0.01
Table 2. Mechanical properties of LPBF-fabricated Al-12Si alloy annealed at various temperatures.
Tensile DirectionTensile Stress
(σM/MPa)
Anisotropy in Stress (%)Elongation
(e/%)
Anisotropy in Elongation (%)Yield Stress
(σYS/MPa)
Strain Hardening
Exponent (n)
as-fabricatedNormal to z axiz463 ± 88.210 ± 240.0313 ± 30.22 ± 0.02
Parallel to
z axiz
425 ± 86 ± 1275 ± 100.25 ± 0.01
200 °C/2 hNormal to z axiz406 ± 32.211 ± 154.5289 ± 30.22 ± 0.06
Parallel to
z axiz
397 ± 15 ± 1269 ± 40.23 ± 0.01
300 °C/2 hNormal to z axiz299 ± 213.719 ± 131.6199 ± 120.22 ± 0.01
Parallel to
z axiz
288 ± 713 ± 1183 ± 100.22 ± 0.01
330 °C/2 hNormal to z axiz251 ± 11−5.220 ± 125.0174 ± 130.20 ± 0.01
Parallel to
z axiz
264 ± 115 ± 1178 ± 40.21 ± 0.01
530 °C/6 hNormal to z axiz164 ± 26.722 ± 14.5104 ± 40.19 ± 0.01
Parallel to
z axiz
153 ± 321 ± 299 ± 40.20 ± 0.02
Publisher’s Note: MDPI stays neutral with regard to jurisdictional claims in published maps and institutional affiliations.

