Article

Molecular Dynamics Investigation of Phenolic Oxidative Coupling Protein Hyp-1 Derived from Hypericum perforatum

Faculty of Physics and Applied Computer Science, AGH University of Science and Technology, 30-059 Krakow, Poland
*
Author to whom correspondence should be addressed.
Crystals 2021, 11(1), 43; https://doi.org/10.3390/cryst11010043
Submission received: 22 November 2020 / Revised: 29 December 2020 / Accepted: 1 January 2021 / Published: 6 January 2021
(This article belongs to the Special Issue Crystallographic Studies of Enzymes (Volume II))

Abstract

:
Molecular dynamics (MD) simulations provide a physics-based approach to understanding protein structure and dynamics. Here, we used this intriguing tool to validate the experimental structural model of Hyp-1, a pathogenesis-related class 10 (PR-10) protein from the medicinal herb Hypericum perforatum, with potential application in various pharmaceutical therapies. A nanosecond MD simulation using the all-atom optimized potentials for liquid simulations (OPLS–AA) force field was performed to reveal that experimental atomic displacement parameters (ADPs) underestimate their values calculated from the simulation. The average structure factors obtained from the simulation confirmed to some extent the relatively high compliance of experimental and simulated Hyp-1 models. We found, however, many outliers between the experimental and simulated side-chain conformations within the Hyp-1 model, which prompted us to propose more reasonable energetically preferred rotameric forms. Therefore, we confirmed that MD simulation may be applicable for the verification of refined, experimental models and the explanation of their structural intricacies.

1. Introduction

Since the first successful macromolecular simulation using molecular dynamics (MD) methods was performed in 1977 [1], MD simulations have grown into one of the most powerful tools for understanding the physical basis of the structure of proteins [2], their biological functions and the role of different types of interactions within macromolecules [3,4,5,6]. Over the past 40 years, timescales that can be covered by atomistic MD simulation are growing faster than Moore’s law [7]. Supercomputers have been built for studies on protein folding via large-scale simulation [8]. In response to the growing interest in physics-based methods of protein simulations during the current decade, the most popular MD simulation packages such as CHARMM [9], NAMD [10], GROMACS [11] and AMBER [12] have improved their atomistic simulation algorithms, computing performance, as well as their methods of comprehensive analysis and experimental validation of underlying physical models [13,14,15]. The calculation of the conformational energy landscape, approachable to protein molecules under certain force fields, connects information about structure and dynamics arising from the internal motion of molecules [16]. A meticulous study of individual atomic motions as a function of time provides insight into biomolecular properties of modeled systems, especially those which are difficult to verify experimentally by methods of X-ray crystallography or NMR spectroscopy [17]. As an excellent tool for studying specific interactions ruling the behavior of biological macromolecules, MD simulations have proven their effectiveness in the fields of protein folding [18,19,20], conformational change analysis [21], ligand binding [22] and ab initio structure refinement [23]. The proper interpretation of the results of MD simulation requires the consideration of some practical issues and artifacts. Apart from accidental programming and user errors or algorithmic issues, various known problems include the choice of force field, the impact of thermostatting, the “flying ice cube” effect, non-physical behavior of water molecules, method of electrostatic interactions computing or treatment of Lorentz–Berthelot rules for simulations of a mixture of different atoms [24]. Insufficient sampling can also limit applications of MD simulations due to the generation of rough energy landscapes with many local minima separated by high-energy barriers, making it easy to fall into a non-functional state that is hard to jump out of in most conventional simulations [25].
To date, nearly 85% of protein structures deposited in the RCSB Protein Data Bank (PDB) were solved using X-ray crystallographic methods. However, this technique provides only static, time- and ensemble-average representation of the molecular arrangement in a crystal [26], ignoring the fact that atomic motions never disappear completely, even at low temperatures [27]. Typically, individual isotropic/anisotropic atomic displacement parameters (ADPs, B-factors or temperature factors) described as
B   =   8 π 2 < u 2 > ,
where < u 2 > is the mean square atomic displacement of a given atom from the ideal position (called root-mean-square fluctuations, RMSF), reflect atoms’ oscillation amplitude around their equilibrium positions in a crystal structure. As experimental ADPs are strongly correlated with atomic form factors, electron density spreading during atomic motions results in a strong decrease in atom scattering power. The analysis of ADPs provides a range of information about the paths of thermal-controlled motions within protein cavities, model quality, preferred side-chain conformations, protein thermal stability, and local flexibility [28,29].
Potential static or dynamic conformational disorder, modeling, and parameterization errors may influence ADPs which makes their distribution a sensitive indicator of the degree of crystal disorder and model accuracy [30]. However, it may be difficult to distinguish actual thermal motions from positional dispersion affected by lattice disorder. Differences in ADP distribution along with protein crystal structure can imply regions of high thermal mobility, such as less stable side-chain conformations or crystal moieties [17,31]. While ADPs are not experimental observables and we do not have our high-resolution diffraction data, restraints assuming the isotropy or anisotropy of ADPs must be imposed on the model [32]. This simplification may lead to a significant deviation of experimental ADPs from reality and results in a growing number of PDB-deposited structures with unreliably high B factors. A possible way of considering correlated atomic motions in protein comes from using the translation–libration–screw model (TLS) that treats proteins as rigid bodies [33,34]. The key problem is the selection of the number of TLS groups and their range, which is typically performed based on the chemical knowledge of the rigidity of certain groups of atoms [35].
To verify existing protein crystal structures and avoid the unrealistic modeling of molecules, the urgent need to develop a model predicting reliable ADPs’ values has been growing [27,36]. Recently, it has been proven that the global distribution of ADPs is described by shifted inverse-gamma distribution (SIGD). The SIGD model demands a definition of three essential parameters: shape (α), scale (β), and shift (B0) of the distribution [28]. Starting values are iteratively improved in Fisher’s scoring method to obtain maximum convergence as well as the physical reliability of the estimated distribution parameters. The validation of macromolecular models proceeds through the juxtaposition of ADPs distribution from an existing model with a contour plot based on the calculated SIGD parameters. If ADP distribution for the whole structure or individual domains/chains obey particularly different SIGDs, such multimodality can indicate the presence of incorrectly modeled parts of molecules that require rigorous inspection.
The structure of proteins is mainly determined by different types of bonding interactions between the side-chain groups of the amino acids [37]. Some specific combinations of dihedral angles corresponding to given conformations of side-chain rotational isomers, so-called rotamers, are preferred [38,39]. In many experimental structures, part of the side-chain conformations is unfavorable, as indicated by the improper stereochemistry or unusually high ADP values [40]. When the definition of a side chain in electron density maps is blurred or local ADP parameters are suspiciously large, protein dynamics simulations may be helpful in the verification of the energetically favored local conformations or identification of non-rotameric states [41].
As the subject of our research, the model of the structure of the Hyp-1 protein obtained from the Hypericum perforatum medicinal herb commonly known as St. John’s wort was considered. The healing properties of St. John’s wort preparations have been known for millennia, with their main active component hypericin, a red-colored quinone derivative, acting as a remedy for depression [42]. As a light-sensitive compound, hypericin is also used in photodynamic anticancer and antiviral therapies [43]. It was initially suspected that hypericin synthesis from another natural anthraquinone, emodin, occurs in a complicated multi-step dimerization reaction catalyzed by the Hyp-1 protein. The analysis of sequence similarities (~50%) allows for the classification of Hyp-1 as a plant pathogenesis-related class 10 (PR-10) protein [44]. The PR-10 family proteins are typically produced in plants as a response to stressful environmental factors such as drought, salinity, or pathogen invasion. The exact biological activity of most of the PR-10 proteins remains unknown and widely disputed, which stands in opposition to their well described characteristic folding canon [43,44]. The presence of this hydrophobic pocket strongly suggests the ability of the Hyp-1 protein to bind various biological ligands such as melatonin [45]. Recent studies of Hyp-1 in the complex with fluorescent dye 8-anilinonaphthalene-1-sulfonate (ANS) revealed the formation of unique commensurately modulated and tetartohedrally twinned macromolecular superstructures [46]. In the present structure, the protein cavity is occupied by polyethylene glycol molecules of different chain lengths from the polyethylene glycol (PEG400) cryoprotectant solution. Although Hyp-1, as many other PR-10 proteins, remains monomeric in solution, crystallization under oxidating conditions in the complex with PEG leads to the formation of a compact dimer formed via covalent S–S linking involving Cys126 and the parallel association of the β1 strands with another Hyp-1 partner molecule [43].
A high-resolution Hyp-1 protein structure (PDB entry 3IE5) was solved at the P2_12_12_1 space group. Despite the high stereochemical quality of the model confirmed by the main-chain torsion distribution on the Ramachandran plot, the validation report still indicates that 1.8% of the side-chain conformations are classified as outliers, which is a common problem for protein structures. The overall clash score was equal to 10 which means that even 1% of atoms are involved in too-close contacts with neighboring residues.
We distinguished a physics-based approach such as MD simulation monitoring direct, atomic motions in the unit cell and knowledge-based X-Ray crystallography imposing many restraints as a complementary help to optimize a model even if a refinement process seems to be finished with some unresolved conformational problems. We also want to answer a question: to what extent our arbitrary knowledge of ADPs distribution strongly depends on restraints applied during refinement can be checked by the simulation of direct, individual atomic motions in the unit cell?
In the presented paper, we used pico- and nanoscale MD simulations as an energetically based auxiliary tool for the verification and improvement of the experimental protein structure model. We chose a high-resolution crystal structure model of Hyp-1 protein from St. John’s wort with potential in various medicinal therapies. The comparison between experimental ADPs and those calculated directly from atomic motions during the simulation was performed to check the validity of thermal factors distribution from the Hyp-1 structure. The side-chain angle distributions for different types of amino acids (nonpolar, polar, and aromatic) were measured to find energetically preferred rotamer forms, especially for conformations poorly visible in electron density maps or partially occupied. The verification of the average simulated protein structure was conducted by comparison between experimental, refined, and calculated from the MD model structure factors.

2. Materials and Methods

2.1. Hyp-1 Structure Model

As starting coordinates, we used PDB entry 3IE5 from Hypericum perforatum plant protein Hyp-1 at 1.69 Å resolution refined with Rwork/Rfree equal to 17.0/20.6%, respectively. The asymmetric part of the unit cell contains two independent protein molecules (A and B) forming a dimer through hydrogen bond interactions between their β-sheets. Chain A consists of 160 amino acids (159 residues labeled Met1-Ala159 from the main chain and artificial Thr-1 molecule as cloning artifact), whereas molecule B has 164 amino acids including 5 additional expression tags (Ile-5…Thr-1). In addition to proteins, the starting model contained different polyethylene glycol molecules from the PEG400 cryoprotectant solution bound within the internal cavity and on the protein surface. For MD simulation purposes, the whole structure model was used, but during the data analysis, the uninteresting glycol residues were omitted due to their high flexibility and relatively poor embedding in electron density maps. The final asymmetric unit cell used for the MD simulation contains two molecules of Hyp-1, 258 water molecules, a single Cl anion located by Lys56A residue, and 10 polyethylene glycol molecules of different chain lengths. The Hyp-1 molecules A and B bind in the internal cavities and 2 and 3 PEG molecules, respectively. Further PEG moieties are located at the protein surface mostly by interactions between protonated lysine and PEG molecules.

2.2. Molecular Dynamics Simulation

All molecular dynamics simulations were performed in the free and open source simulation package GROMACS 2019.3 [47,48,49,50,51,52]. The general purpose OPLS–AA force field was used [53,54,55,56,57,58,59,60,61] in all simulations. The TIP4P-Ew water model [62] was used. All Glu and Asp residues were treated as negatively charged and all Lys and Arg residues as positively charged, whereas the other residues were assumed to be neutral. The internal residue database of the simulation package was complemented with the topologies of the various glycols present in the simulated system. All of the necessary potentials were already defined in the force field. Partial charges of the atoms within glycol molecules were obtained by fitting point charges to the electrostatic potential calculated from the charge density obtained by DFT [63,64] calculations using the 6-311G** Gaussian type orbital basis set [65] with the B3LYP exchange-correlation potential [66,67] in the NWChem package [68].
The starting model for the series of simulations was the structure of Hyp-1 dimer as published in [43] with four units in the asymmetric unit duplicated in each direction (x, y, z) to form a 2 × 2 × 2 supercell of the structure. Therefore, the final system included 64 individual protein copies and 208,032 atoms in a 67.45 Å by 137.85 Å by 215.27 Å rectangular box.
The starting structure underwent an energy minimization (EM) procedure that quickly converged without significantly altering the structure (Table 1). Then, an equilibrating NVT simulation was performed. It consisted of 100,000 steps of 1 fs each, in which the temperature was coupled to 292 K (independently for groups of protein and non-protein residues) using a velocity rescaling thermostat with a coupling constant of 0.1 ps, short-range interactions (van der Waals and Coulomb) were cut off at a distance of 3.2 nm, long-range interactions were handled using the PME method [69,70], the Verlet cut off scheme [71] was used and the neighbor list was updated every 20 steps. Periodic boundary conditions were used in all three dimensions and the initial velocities of atoms were generated from a Maxwell distribution at 292 K.
The output structure from the first equilibrating simulation was further equilibrated in an NPT simulation of 1,000,000 steps of 1 fs each. The settings were the same as in the earlier simulation. In addition to those, an isotropic Parrinello–Rahman barostat with a coupling constant of 2 ps was applied to couple the pressure to 1 bar, with compressibility set to 4.5 × 10⁻⁵ bar−1.
The equilibrated structure obtained in the above simulation sequence was the basis of performing additional simulations with identical settings used for gathering data regarding atomic positions in 100 ps, 10 ps, and 1 ps time scales, consisting of a corresponding number of 1 fs time steps. The positions of atoms were written to the trajectory file every 200 fs, 20 fs, and 2 fs accordingly. These data were used for calculating the angles corresponding to rotamers (ROTs).
The equilibrated structure was cooled down to 100 K (temperature of X-Ray crystallographic measurements) in yet another simulation of 1,200,000 steps of 1 fs each (CD). The settings were the same as earlier, except for the coupling temperature, which varied in the course of the simulation. The temperature stayed at 292 K for the first 100 ps of the simulated time, was linearly decreased to 100 K during the next 1 ns of simulated time and stayed at 100 K for the final 100 ps of the simulated time. Although cooling too quickly can trap side-chain conformations in unnatural states, it can be prevented by a decelerated linear decrease in temperature during 1 ns as adopted in our CD protocol, which provides sufficient time for adaptive changes in the protein.
Finally, the cooled down structure underwent a simulation of 1,000,000 steps 1 fs each (RMSF) for gathering atom-positional RMSF data. Positions of atoms were written to the trajectory file every 2 ps.

2.3. Comparison between Experimental and Simulated Structure Model

We compared the experimental model marked as PDB entry 3IE5 and the simulated Hyp-1 structure to determine the extent ot which our simulation preserved the characteristic PR-10 fold of the protein. We also wanted to prevent some drastic conformational changes within the Hyp-1 model. For our average conformation calculated by superposing of 32 Hyp-1 dimers from the simulation box, structure factors were calculated using the phenix.fmodel from the PHENIX package [72]. Experimental (Fexp) and obtained from model structure factors (Fcalc) were recovered from the MTZ file accompanying the deposited 3IE5 structure. To determine the relative error, we compared the simulated (Fmd) structure factors with those calculated from the model and subsequently excluded those with an error percentage above 20%. Root-mean-square deviation (RMSD) of Cα atoms of experimental and simulated Hyp-1 model were calculated in gesamt [73] to highlight the similarity between both structures. Calculation of RMSD of Cα atoms was performed using the gesamt from the CCP4 package.

2.4. Application of MD Nanoscale Simulation to Calculate ADPs Distribution

ADPs of Cα and Cγ atoms from the MD simulation were calculated by averaging over all time steps for each of the 32 dimers from the 2 × 2 × 2 simulation box under previously described simulation conditions. Atoms lying on the surface of the simulation box were omitted in the calculation of individual ADPs. By that, isotropic ADPs were calculated with respect to the average MD structure after equilibration using Equation (1) for bulk atoms in the simulation box. The next step was aligning all selected conformations with respect to the first saved one to find the average protein structure in the simulation box. The coordinates of the average conformation were found using the root mean square fit of all CA and CG or CG2 atoms. Therefore, calculated ADPs averaged over all conformations were the mean of all atomic ADPs from 32 protein dimers inside the simulation box. The convergence of ADPs from the partial data set including conformational changes during the simulation was assessed by RMSD calculation with its standard error (SE) according to:
S E =     ( B i B ¯ ) 2 / N ( N 1 )
where Bi refers to an ADP of an i-th conformation, B ¯ is the ADP of the calculated average structure, and N is the number of conformations in the simulation box [74]. To determine MD-based ADPs not just from Equation (1), the average Hyp-1 model after the MD simulation was refined in 50 cycles with isotropic ADPs and using the TLS model with 5 TLS groups per each chain in Refmac [75].

2.5. Stereochemical Constraints of Main- and Side-Chain Conformations

Physics-based MD results were compared with the observed side-chain amino acid distribution in the experimental structure. An experimental PDB-derived model was refined using stereochemical restraints according to a standard library [76]. We excluded the risk of steric clashes restricting rotameric form using short-contact restraints with a cut-off limit at 3.2 nm. Partial occupancy of some side chains (Ile6A and B, Arg27A and B, Leu31A, Phe72A, Leu105B, Lys139B) was omitted during MD calculations with their higher occupied form approved. Additionally, we rejected residues introduced at the cloning stage. Allowed rotameric forms were determined based on The Richardson’s (Son of Penultimate) Rotamer Library [77] used commonly as a dataset in the post-refinement verification of structure model stereochemistry, e.g., in Coot [78] and Refmac programs and implemented during the refinement of the experimental Hyp-1 model. Calculations of energetically preferred rotameric forms involve different groups of amino acids: nonpolar (Leu, Met, Pro, and Val), aromatic (Phe, Tyr, His), polar (Asn, Gln, Cys, Ser, and Thr), basic (Lys, Arg) and acidic (Asp, Glu) residues in both α-helix and β-sheet backbone conformations. Table 2 contains definitions of χi backbone dihedral angles used during the simulation to monitor backbone angle variations. Values of dihedral angles for all 16 residues considered in this paper cover the range from 0° to 360°, except for χ2 angle in the case of Phe, Tyr, and His, which is connected with the possibility of aromatic ring inversion in these compounds [79].

2.6. Comparison between Experimental and Calculated Distributions of Side-Chain Dihedral Angles

The side-chain dihedral angles for each residue in the experimental Hyp-1 model were calculated using rotamer [77,80] from the CCP4i software package. By the analysis of the (Son of Penultimate) Rotamer database, the respective rotameric form has been assigned to each of them, and additionally, side-chain outliers were identified. The reference calculated dataset was created from additional simulations following structure equilibration performed to monitor the positions of atoms at each 100, 10, and 1 ps timescales with the corresponding 200, 20, and 2 fs steps. For each residue, the χi torsion angles between respective atoms as mentioned in Table 1 were calculated. Obtained values for both α-helix and β-sheet backbone regions were compared with The Richardson’s (Son of Penultimate) Rotamer Library content to identify predicted rotameric form. Model-based results were confronted with energetically favorable side-chain conformers from MD simulation. When some differences between the preferred rotameric form in the experimental and simulated structure were observed, we calculated the probability distribution of each side-chain dihedral angle P(χi), the number of samples in a small increment Δχ = 5° and then summed over all 60 protein conformations within a simulation box. Hence, we included the averaging of bond lengths, bond angles, and ω dihedral angles in different protein conformations. Each P(χi) distribution was normalized to fulfill the condition that   P ( χ i ) d x i = 1 . To organize our analysis, we separately calculated the monomodal dihedral angles distribution P(χ1) for Pro, Ser, Cys, Val and Thr residues, bimodal P(χ1, χ2) distributions for the groups of Leu, Asp, Asn and the aromatic residues (Phe, His, Tyr), three- P(χ1, χ2, χ3) or four-modal P(χ1, χ2, χ3, χ4) distributions for residues with longer side chains, e.g., Glu, Gln, Met, Arg, and Lys.

3. Results and Discussion

3.1. Impact of MD Simulation Parameters and Possible Artifacts

In many previous studies of proteins, the cutoff of atom and residue contacts was selected arbitrarily in the range of 3.8–9.0 Å based on the properties of a particular system and the optimization of data processing, although some attempts to rationalize this process were presented [81,82,83]. In our simulation, long-range cutoff was used to not strongly affect the structural properties of the folded state as well as to provide simulation convergence in a given time. As the simple truncation of the electrostatic interactions at too short cutoff can create artificial boundary problems and even neglect important long-range interactions, we decided to use the value of 3.2 nm to maximally broaden the range of included van der Waals forces regarding accessible computational power and the large size of the protein [84]. The inclusion of longer-range electrostatic interactions is mostly limited by computational costs [85] and did not have a negative impact on our simulation. Moreover, neglecting long-range interactions may cause unacceptable large atomic fluctuations of protein residues, which cannot be explained in plain terms of environmental differences between X-ray studies and simulation. The simulation time of 1.2 ns for the longest trajectory was found to be sufficient to catch conformational changes and thermal motions in the Hyp-1 protein system. The convergence of simulation was confirmed by the observation of the atom-positional RMSD calculated against the experimental structure for each protein molecule over time and averaged over 64 individual protein copies inside the simulation box (Figure 1). Starting from experimental data, our system was not far from equilibrium, which results in the successful stabilization of RMSD values after 100 ps of the second 1 ns NPT simulation. Longer simulations are typically efficient in the much more complicated atomistic modeling of protein folding, structure dynamics, or protein-ligand interactions.

3.2. Accuracy of Experimental and Simulated Hyp-1 Structure Model

For the experimental Hyp-1 model, 39,745 unique reflections were collected, with 1590 of them used as a test set. Accordingly, we obtained a set of 39,737 reflections from the simulated average model using phenix.fmodel. A maximum relative error equal to 20% was applied to exclude those reflections for which structure factors exhibit high differences and low level of comparability. Therefore, 24,080 reflections have had an acceptable degree of compliance to be presented in the logarithmic scale on the respective Fcalc/Fmd and Fmd/Fexp plots (Figure 2).
The calculated R-factor between all Fmd and Fcalc was equal to 10.6%, while the analogous one between Fexp and Fmd data reaches 23.6%. Although reflections between experimental and simulated models have been fitted with only a small spread, we observed a blur of reflections on Fmd/Fexp plot. This is apparently connected with an imperfect refinement of the structure model, or the multiple scattering phenomena, which was observed in many complex metallic alloy systems, e.g., quasicrystals [85,86,87]. Within the original Hyp-1 model dimer, both A and B molecules superpose with the high RMSD of their Cα atoms equal to 1.21 Å, while structural discrepancies between the PR-10 group proteins are included in the range from 1.64 even to 2.76 Å [43]. Calculated in gesamt, the Cα RMSD between the experimental model and our Hyp-1 average low-energy conformation reaches 2.38 Å, resulting from the general flexibility of PR-10 fold and the medium size of the protein. The main secondary structure motifs were well conserved, while, as expected, most of the conformational changes occur in less stable regions of L3 and L5 loops [43]. The structural variation of Hyp-1 during simulation is also restricted by intermolecular contacts and restraints corresponding to van der Waals short-range interactions.

3.3. Actual and Experimental ADPs Comparison

In the presented ADP calculations, the simulation of the starting conformation model included several sequences: (i) 100 ps stage of the system temperature setting to 292 K, (ii) 1 ns of equilibrating simulation and (iii) 1.2 ns of the cooling of structure to 100 K followed by a sampling of the atomic positional fluctuations within the protein structure (CD and RMSF). As typically RMSDs provide a distinction between restrained and mobile parts of the molecule, we observed a reduction of flexible Cγ atoms motions under the OPLS–AA force field. This fact indicates that using the given simulation setup, we successfully generated a set of structurally diverse ensembles with high conformational heterogeneity independent from rigid-body motions or lattice defects. As the crystallographically determined Hyp-1 conformation was used as the starting model, we assumed that the resulting 64 individual protein molecules (32 dimers) are a sufficient number to present a conformational variety of Hyp-1 crystals. Positional restraints, solvent inclusion, and RMSD data acquisition from the cooled structure provided conditions similar to the experimental and possibly a high resemblance to the physical model.
Overall mean isotropic ADP for the experimental Hyp-1 model structure was equal to 27.53 Å2, while ADPs for individual chains A and B were 23.7 Å2 and 26.5 Å2, respectively. The high lability and mobility of long PEG ligand chains were reflected by their increased average B factors in the range from 49 up to 71 Å2 for the internal PEG molecules [43]. These high values result mostly from the lack of strong, directional protein–ligand interaction showing the exact composition of the PEG solution. In some cases, ligand representation in electron density maps were so uncertain that the conclusion of whether observed electron density corresponds to the full-length molecule or merely a fragment of the elongated, disordered chain was impossible. The distribution of the experimental ADPs reflects the contrast between restrained main-chain segments (Figure 3a,b) and side-chain conformational diversity (expressed by increased ADPs of Cγ atoms in Figure 3c,d). The highest values of thermal mobility of Cγ atoms were observed for side chains of Glu132, Arg93, Glu106, and Asp48 involved in hydrogen contacts to each other or with water molecules at the protein surface (Figure 3c,d).
Calculated from the simulation, the atomic RMSF maintains low values with an average ~0.2 Å within the whole simulation box and a maximum near to ~0.25 Å. Therefore, calculated ADP distribution seems to be more uniform with generally increased values of thermal factors compared to the experimental ones. Under the OPLS–AA force field and at the nanosecond timescale, the calculated mean ADPs are equal to 50.49 Å2 (molecule A) and 47.81 Å2 (molecule B). Their RMSD between the experimental and calculated ADPs of Cα atoms reaches values (mean ± SE) of 31.11 ± 2.63 Å2 in chain A and 26.22 ± 2.17 Å2 in chain B, while the total RMSD between the experimental and calculated Cα ADPs is equal to 30.51 ± 1.70 Å2. Interestingly, the calculated Cγ ADPs seem to be more similar to the experimental distribution with their RMSD and SEs equal to 24.33 ± 2.47 Å2 and 19.36 ± 2.00 Å2 in relation to chains A and B, respectively. Overall, Cγ RMSD reaches 25.95 ± 1.57 Å2. It was observed that the means and SEs of the ADPs are growing with the time of simulation (Pang, 2016)—calculated deviations between experimental and calculated ADPs of Hyp-1 protein can be explained as a result of a longer 1.2 ns trajectory.
After the re-refinement of the simulated Hyp-1 model with isotropic ADPs, diversity between residues within the structure was restored, although mean Cα ADPs for chains A and B are equal to 39.31 and 38.76 Å2, respectively, with RMSD 20.66 ± 3.03 Å2 (chain A) and 18.78 ± 2.56 (chain B) relative to the experimental values. This fact confirmed the systematic underestimation of X-ray experimental ADPs announced in previous studies [17]. Analogous values for Cγ atoms reach 51.25 (molecule A) and 50.88 Å2 (molecule B), and their total RMSD to PDB entry is 17.85 ± 2.75 Å2. We decided to use five TLS groups per each protein chain as it was implemented in the starting structure to avoid modeling whole protein as a rigid body and freezing of protein translation and rotation within the crystal structure. The distribution of ADPs within the average simulated Hyp-1 model refined with five TLS groups per each chain strongly resembles those with isotropic thermal factors. We determined the overall RMSD between isotropic and TLS-modelled ADPs at the level of 2.57 ± 0.45 Å2 for Cα atoms and 1.68 ± 0.33 Å2 in the case of Cγ atoms. The high flexibility of long side chains of Lys27, Glu48, Arg93, Glu102, Lys139, Glu142, and Glu149 was observed for both PDB entry and re-refined models. By introducing TLS groups and the subsequent refinement of average Hyp-1 model, simulated ADPs contained a contribution from correlated motions between neighboring atoms in the protein, which results in restricting of atomic fluctuations and a general lowering of ADPs. Contrary to MD-based ADPs, standard thermal motions cannot always accurately reflect dynamical changes in the protein crystal structure, although we found that the simple RMSF-based calculation of ADPs is also not sufficient, probably due to the high impact of static disorder from the averaging procedure.

3.4. Side-Chain Angles Probability Distribution P(χ1) for Pro, Ser, Cys

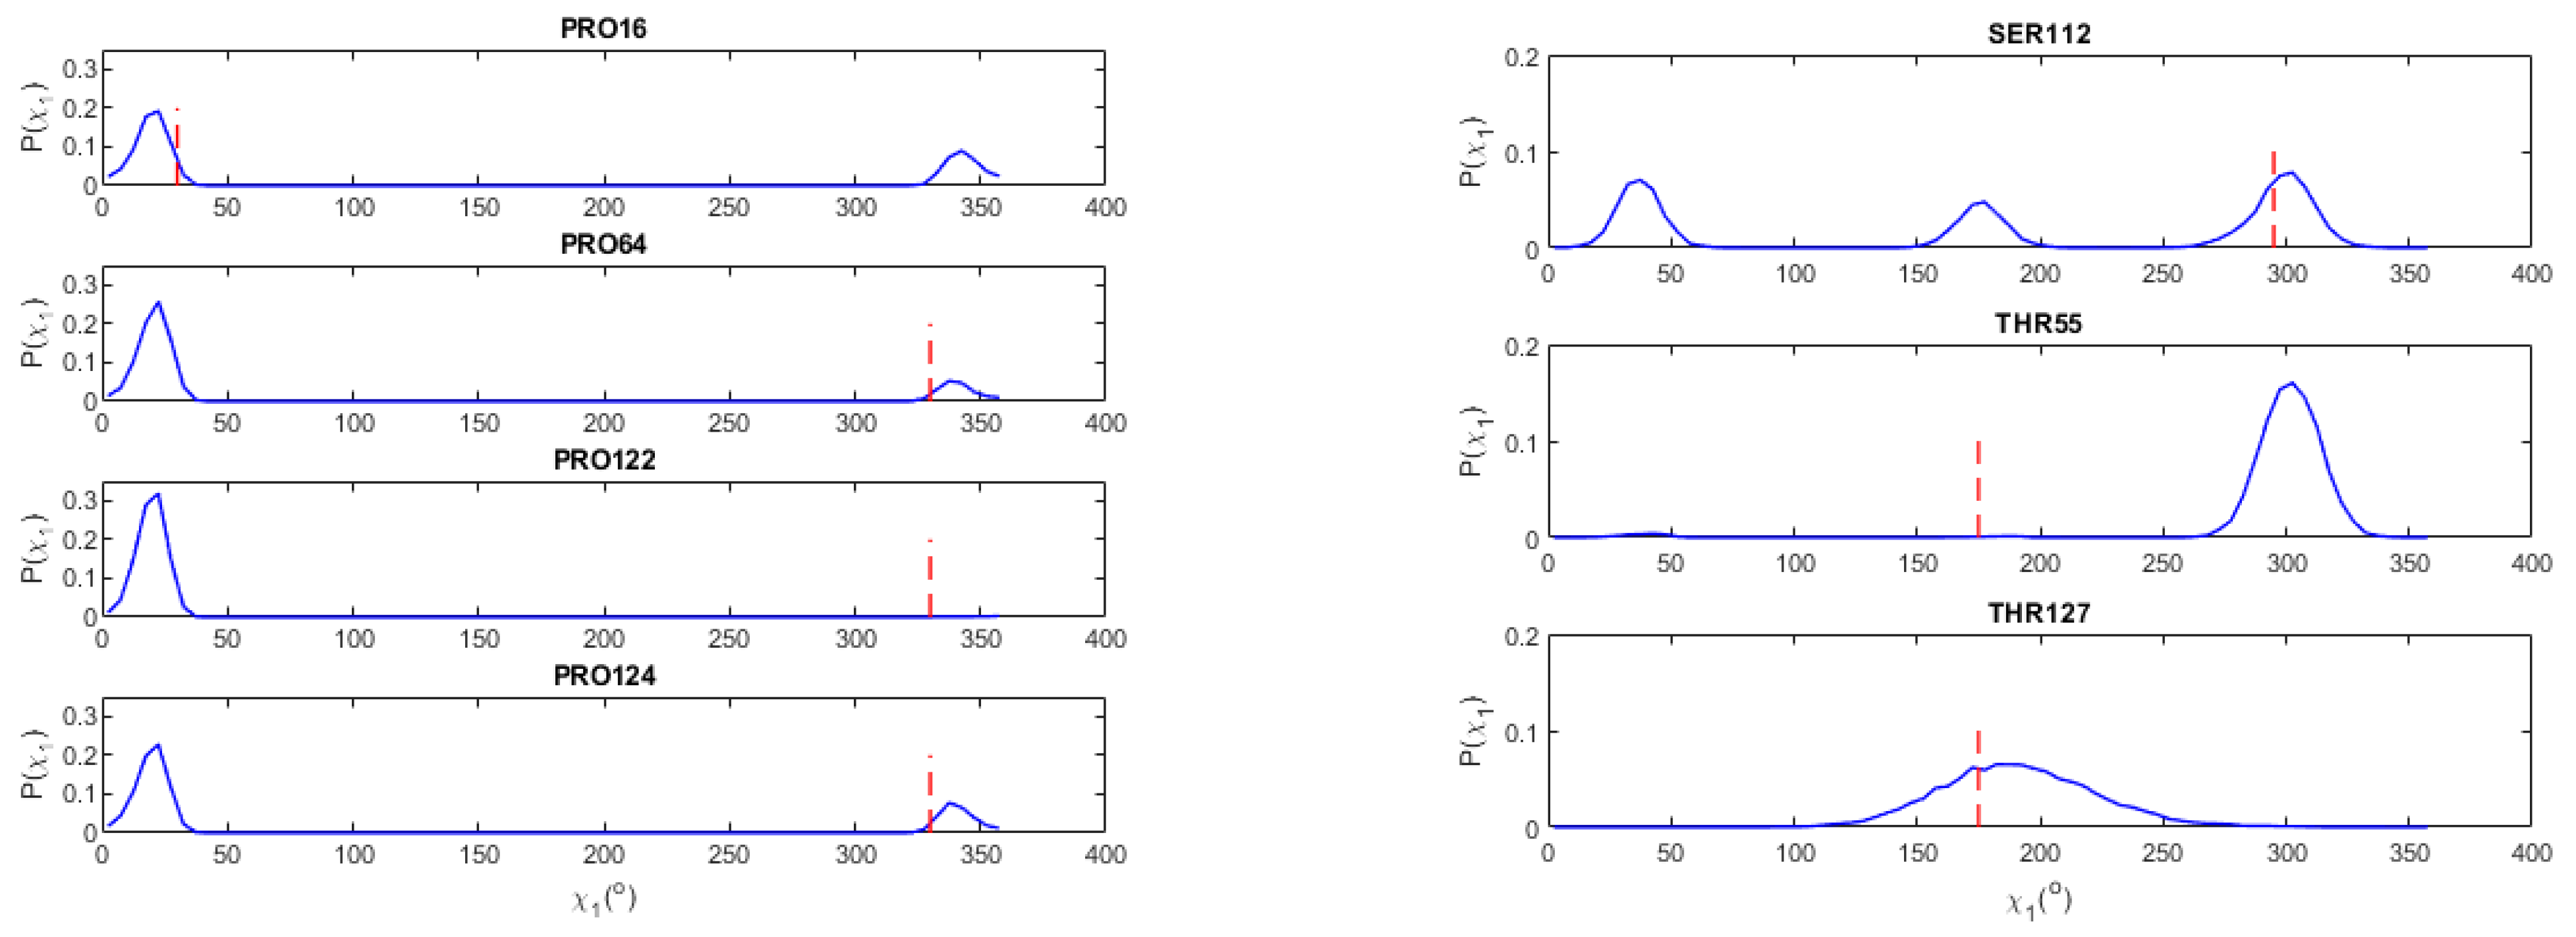
The amino acid sequence of the Hyp-1 protein contains seven Pro, three Ser, and two Cys residues in a monomeric state. Proline molecules tend to adopt endo or exo conformation depending on whether displaced γ carbon is located above or below the plane formed by other α, β, δ, and N atoms [88]. Within the Hyp-1 dimer experimental model, seven Cγ-endo and seven Cγ-exo conformations of proline were expected at χ1 = 30° and 330°, respectively. However, observed after the MD simulation, the distributions reveal interconversion between endo and exo states for Pro16, Pro64, Pro122, and Pro124 (Figure 4) marked by predicted P(χ1) peaks at χ1 values contrary to those resulting from experimental structure conformation.
The high flexibility of the pyrrolidine ring and the dynamic tendency toward rapid endo–exo and vice versa conversion at the Cγ atom was previously confirmed by the analysis of the 1H NMR spectrum of proline in aqueous solution [88]. Although the Cγ atom in most of Pro residues exists in one of endo–exo conformation for both A and B protein molecules, their P(χ1) distributions show that conversion to energetically preferred χ1 = 30° (endo form) is incomplete. Only for Pro122, a peak by χ1 = 330° is nearly absent, indicating a low affinity for this conformation. Due to the location of most proline residues in loop areas of the Hyp-1 structure (except for Pro16 from short helix α1), they possess high conformational freedom facilitating the transformation to more stable endo conformation. For serine and cysteine molecules, three highly probable side-chain conformations can be expected at χ1 = 62° (p), χ1 = 183° (t form) and χ1 = 295° (m). We did not find any discrepancies between experimental and predicted Cys rotameric form, which indicates the convergence of knowledge-based and physics-based approaches. As shown in Figure 4, a disproportion between experimental and predicted rotameric form was found in Ser112 from the L8 loop, where highly probable p conformation is expected at χ1 = 295°. Calculated P(χ1) distribution reveals three peaks at 295°, 183°, and 30°, suggesting the creation of different energy minima for each conformation. The deviation of peak value at χ1 = 30° from the preferred 62° value suggests some geometrical distortion from the experimentally defined model or energetic affinity to one of the non-rotameric states.

3.5. Val and Thr

According to the Rotamer Library, three mostly preferred Val and Thr side-chain conformations can be expected near χ1 = 60°, 175° and 300°. The native protein sequence of Hyp-1 contains 18 valine residues and 16 of them, regardless of their location in secondary structure, adopt dominant t rotameric state from the Penultimate Library. Surprisingly, we noted differences between the experimental and simulated side-chain conformations for 17 of 18 Hyp-1 valine residues, so their predicted P(χ1) distribution almost always has a peak at nearly 300° respective to the second most probable rotamer m. The occurrence of lesser-populated rotameric states parallel to more extended or rarer conformations indicates dynamic conformational changes within the model structure during MD simulation. This conformational transformation towards lower energy states was expressed by a probability shift from the t to m rotamer and the resulting switch in χ1 preference. In the case of nine Thr molecules from the Hyp-1 sequence, eight residues have a different simulated rotamer with probability shifted significantly from preferred p (49% independent probability) and m (43% of probability) to the least populated of the three top Thr conformations t form. As recommended by The International Union of Pure and Applied Chemistry IUPAC, different definitions of χ1 in side-chain methyl group, χ1 = 175° in Val and χ1 = 295° in Thr are equivalent. For β-branched Thr55, we noticed the reversion between two dominating rotameric states as it was for many Val residues (Figure 4). When it comes to Thr127 in a less ordered loop area, a decrease in the t probability and subsequent shift toward preferred m rotamer was observed (Figure 4). More details on the side-chain torsions probability density distributions for Val residues can be found in Figures S1–S3 (see Supplementary Materials).

3.6. Leu, Phe, Tyr, His

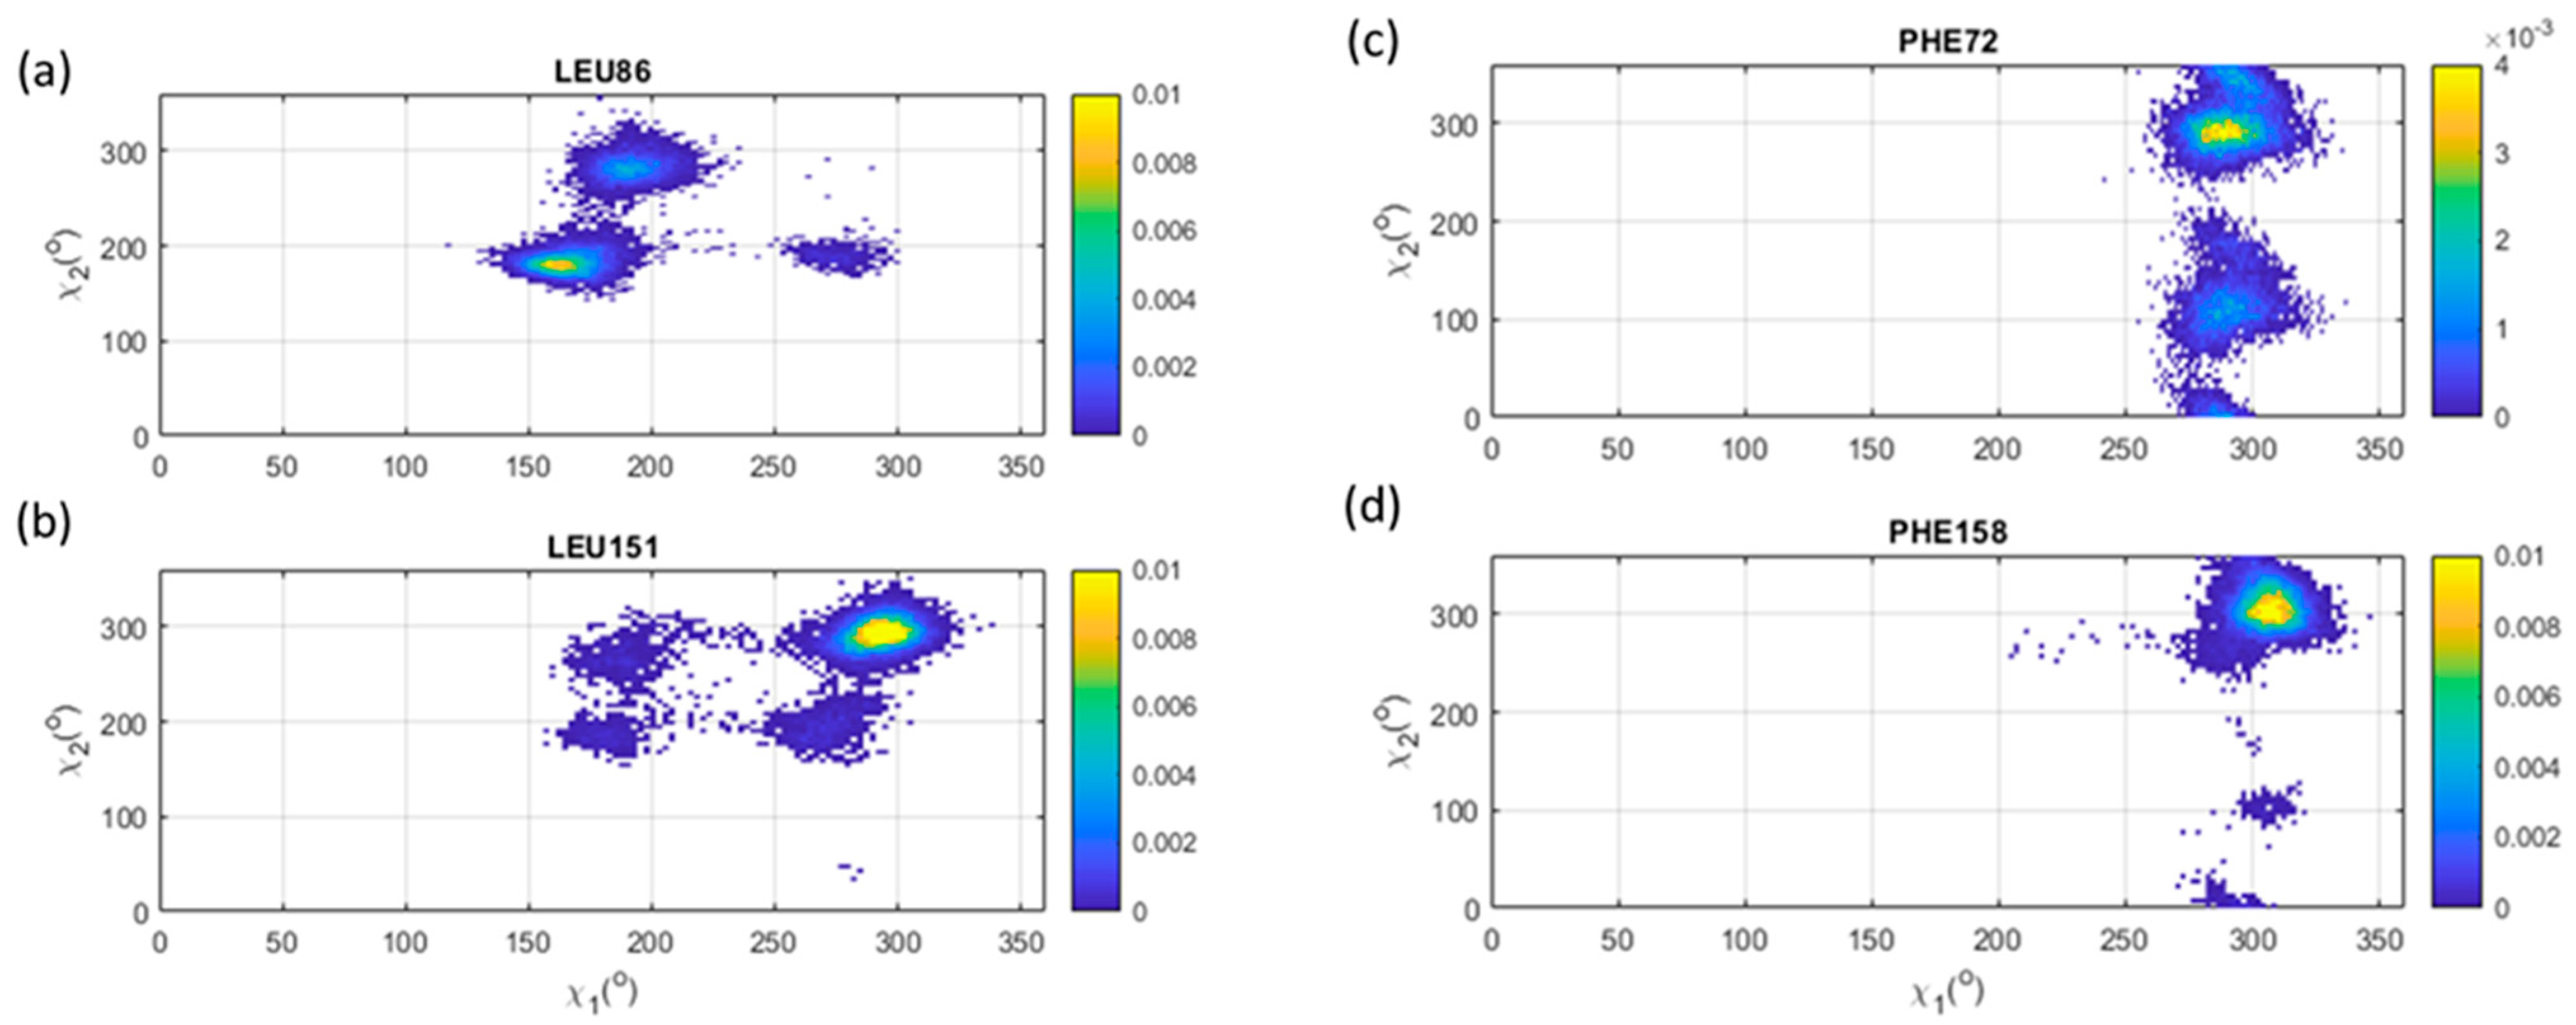
Preferred side-chain conformations for Leu and aromatic Phe, Tyr, His residues were modeled using dihedral angles bimodal P(χ1, χ2) distributions. Although the Hyp-1 native sequence contains 10 hydrophobic Leu residues, only two of them were marked to have different rotameric forms in experimental and simulated structure models. For β-branched Leu86, χ1 and χ2 are expected near to 175° and 65°, respectively, while in the calculated distribution “vertical” χ2 transition to ~180° was noted resulting in rare side-chain conformations (Figure 5a). Because of the known fact that sparsely populated rotamers coincide with higher-energy parts of energy landscapes [89] and knowing positions of potential catalytic active sites in structure, it is particularly interesting, because Leu86 was introduced into Hyp-1 as a substituent for original Ile86 and therefore considered as one of the mutations blocking the enzymatic activity of Hyp-1 in hypericin synthesis [43].
Figure 5b presents that another rotamer outlier from the experimental model was observed for Leu151 in the helix α3 region, where the calculated χ1 distribution is centered around the rotameric value of 295° with a non-rotameric peak of χ2 around 300°. We typically suspect at least one non-rotameric torsion in many side chains, especially those long and characterized by many torsions, but it remains an inquisitive observation in the case of the shorter, aliphatic Leu molecule. This side-chain conformation anomaly suggests the high energy perturbations in the carboxylic terminal group of Leu151, evidenced by its increased Cγ ADP value (Figure 3c,d). MD simulation studies showed considerable freedom of the Leu151 side-chain conformation suggesting its possible role in substrate recognition. Indeed, further analysis of the Hyp-1/ANS complex revealed that typically very non-reactive, hydrophobic Leu151 can be involved in ligand binding. We did not find any differences between the experimental and simulated rotameric forms in the dipeptide mimic of Leu, Ile.
Aromatic Phe amino acid in the Hyp-1 structure is represented by eight residues in each protein molecule, most of them buried in a hydrophobic internal cavity. We compared the experimental rotamers with their simulated forms revealing differences at Phe72 and Phe158 (Figure 5c,d). The first of them was initially modeled into electron density with a double side-chain conformation, m-30, and less occupied m-85. Both experimental and calculated χ1 are close to 295°, whereas the observed χ2 distribution has a maximum of around 270°. The second densely populated χ2 region occupies the area in the proximity of 90°, resulting from a 180° ring inversion and the subsequent creation of two indistinguishable side-chain conformations. Contrarily, the χ2 pair from the experimental model should show peaks around 330° and 150°, even if calculated P(χ2) distribution clearly reveals minor probabilities in these regions. A subtle difference was observed for the simulation of C-terminal Phe158 residue with a preference of χ2 torsion distribution to ~300° value. The previous exploration of the Phe conformation richness in protein structures revealed that χ1 = 300° could be strongly limited by steric clashes between the aromatic ring and the carbonyl group of adjoining residues, especially within α-helical regions [79]. However, we found this value most representative for five of eight Phe amino acids in each Hyp-1 chain. Moreover, we discovered using a physics-based approach that the m-85 rotamer is the energetically favorable conformation of the Phe72 side chain, which was unclear during refinement with arbitrarily selected and incorrectly refined occupancies of different side chains.
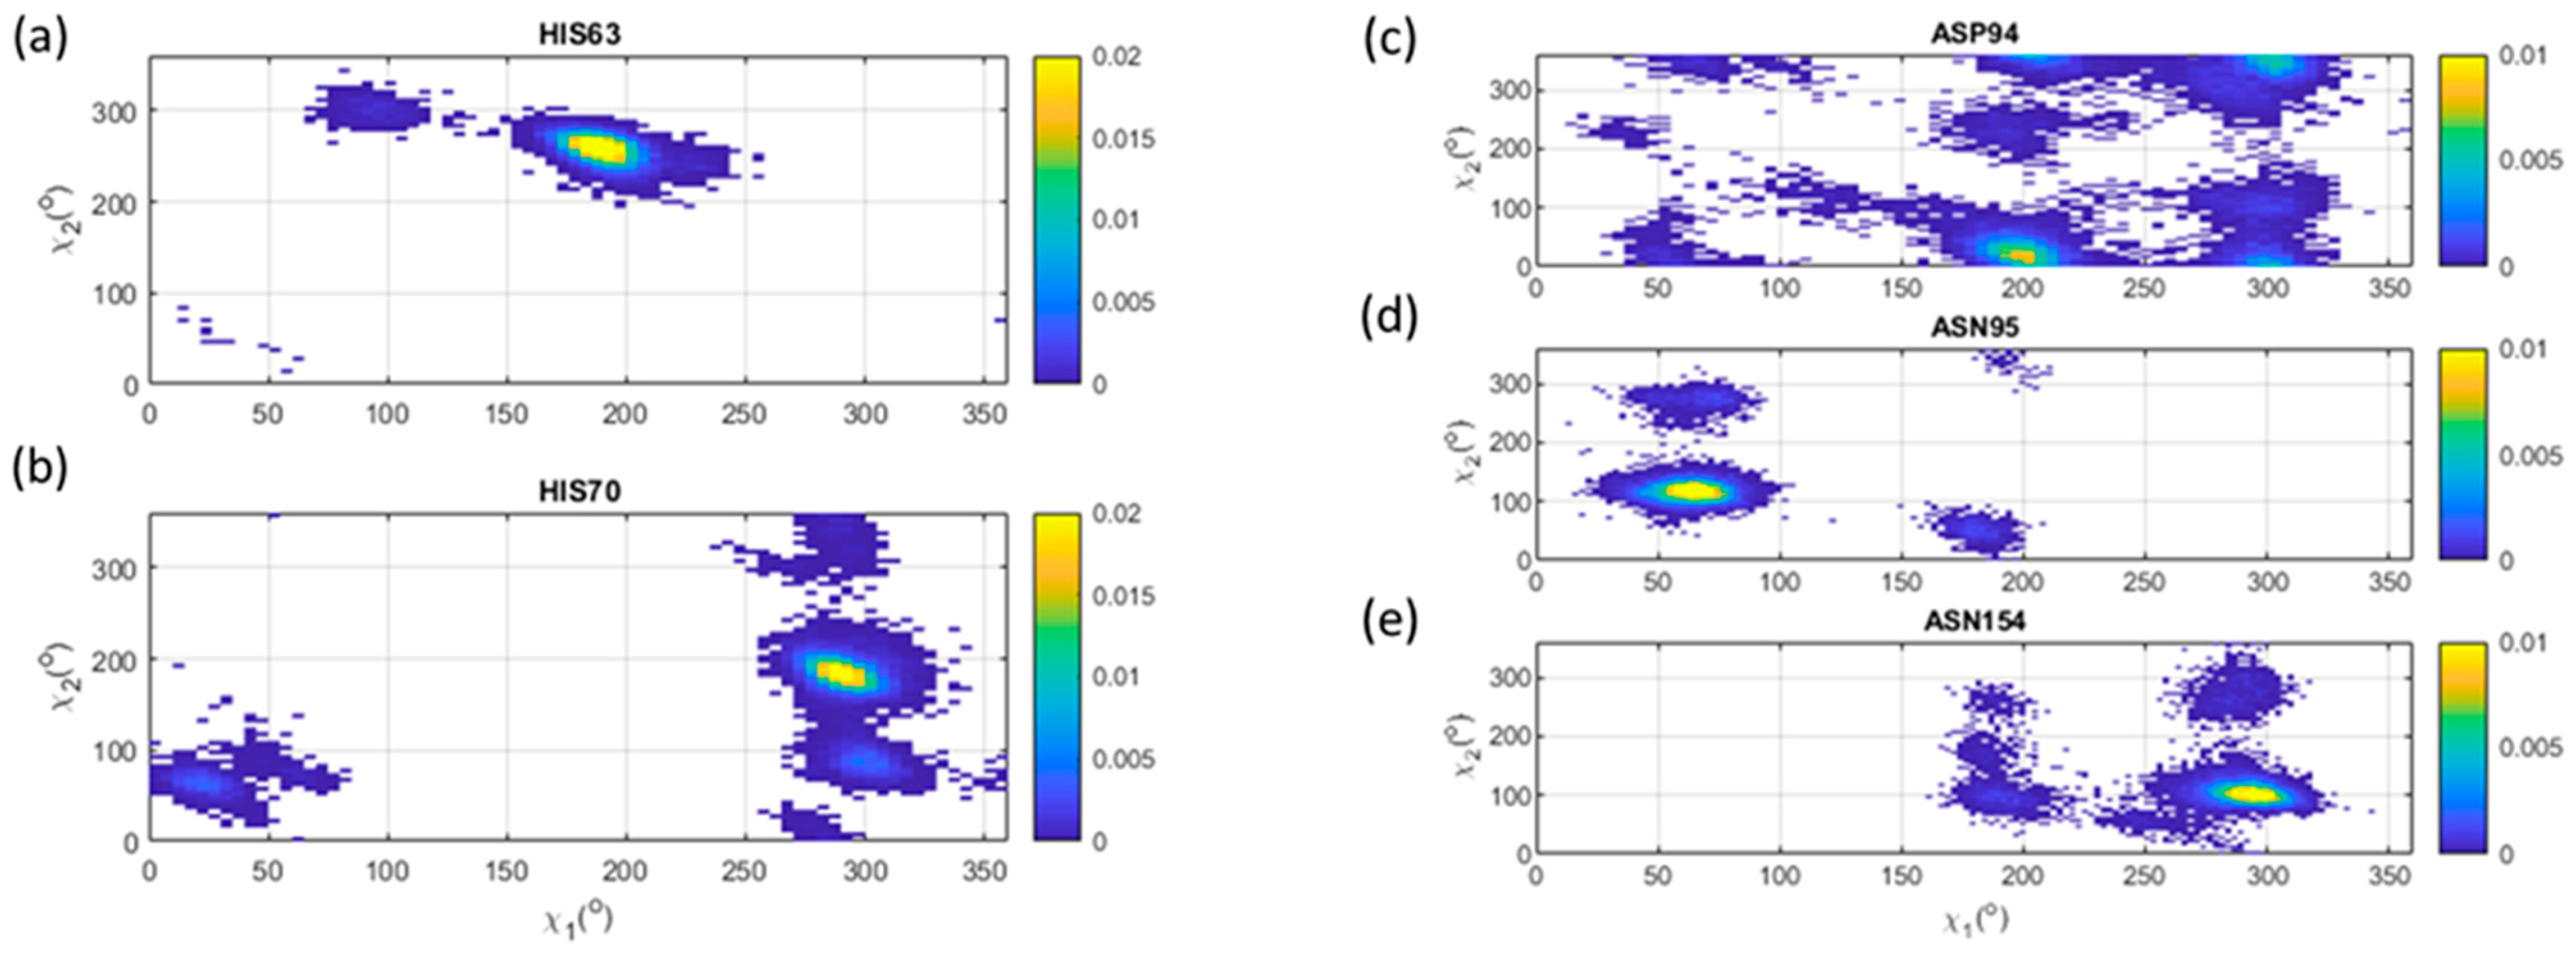
Among six His residues from the Hyp-1 protein sequence, our hard-sphere calculations revealed two main derogations from experimental side-chain stereochemistry (Figure 6a,b). For His63, strong peaks at χ1 = 180° and χ2 = 260° correspond to t-80 rotamer from the structure model. However, the large patch in P(χ1, χ2) distribution was observed around χ1 = 295° and χ2 = 290° respective to dominant m-70 state populated 29% of the time, although this conformation was absent in the initial dataset. A second noticeable sample is pocket-hidden His70 with the experimental second most preferred rotamer m801 = 295°, χ2 = 80°). The calculated distribution indicates rather on less observed m170 form (7% of probability) in agreement with the observation of χ1 and χ2 peaks near 295° and 165°.
We observed no differences between the experimental and calculated rotameric form of Tyr with analogous to Phe aromatic side chain. Despite the structural resemblance between both amino acids and the ease of their mutual substitution, we found Tyr to be a generally more stable residue in the Hyp-1 protein structure with low sensibility on energy-driven conformational changes.

3.7. Asp, Asn

Although the native sequence of Hyp-1 contains 6 Asp residues, we found only one disagreement between experimental and simulated Asp94 rotamers. As in the PDB-derived Hyp-1 model, we might expect two highly populated clusters around χ1 = 290° and χ2 = 345° corresponding to the most populated m-20 conformation. On the contrary, we found in Figure 6c a significant blur of allowed side-chain torsions in the calculated P(χ1, χ2) distribution of Asp94, where strong peaks were found at χ1~200° and χ2 near to 0°. Troubles with assigning the central value and standard deviation to the suggested conformation mark a high level of conformational heterogeneity of the Asp94 residue confirmed by the higher ADP of its Cγ atom (Figure 3c,d). Furthermore, our studies imply that the transition to rare rotameric states is energetically preferred. Similar conclusions emerge from the analysis of P(χ1, χ2) distribution in Asn95 and Asn154 (Figure 6d,e). Both of them exist in uncommon p-10 and m-80 conformations that should have a frequent population near χ1 = 62° and 295°, respectively. Our P(χ1, χ2) calculations clearly confirm that despite the well preserved χ1 value, the more mobile outermost χ2 torsion determines the rotamer form and plays a crucial role in the examination of preferred Asn conformations. For Asn95, the χ2 peak near 90° favors more popular p30 conformation and in the case of Asn154, the rare m120 rotamer is suspected because of the P(χ2) area around 100°. The known problem with Asn conformers is that its P(χ2) distribution is typically broad and ambiguous, and the strict value of χ2 can differ by 180° due to the possible flip of identical side-chain amide N and O atoms [90]. As an effect, symmetric sparsely populated regions with χ2 changing by 180° are observed on our calculated P(χ1, χ2) distribution. We overcome this problem with the poor clustering of χ torsions and the less meaningful analysis of allowed Asn conformations. Our P(χ1, χ2) shows separated local clusters of χ2 values clearly determining the preferred Asn rotamer. We observed a lack of these sharp, clear clusters for Asp94, which we assigned to large mobility of partially disordered side chains and high-energy perturbations within the terminal carboxylic group.

3.8. Glu, Gln

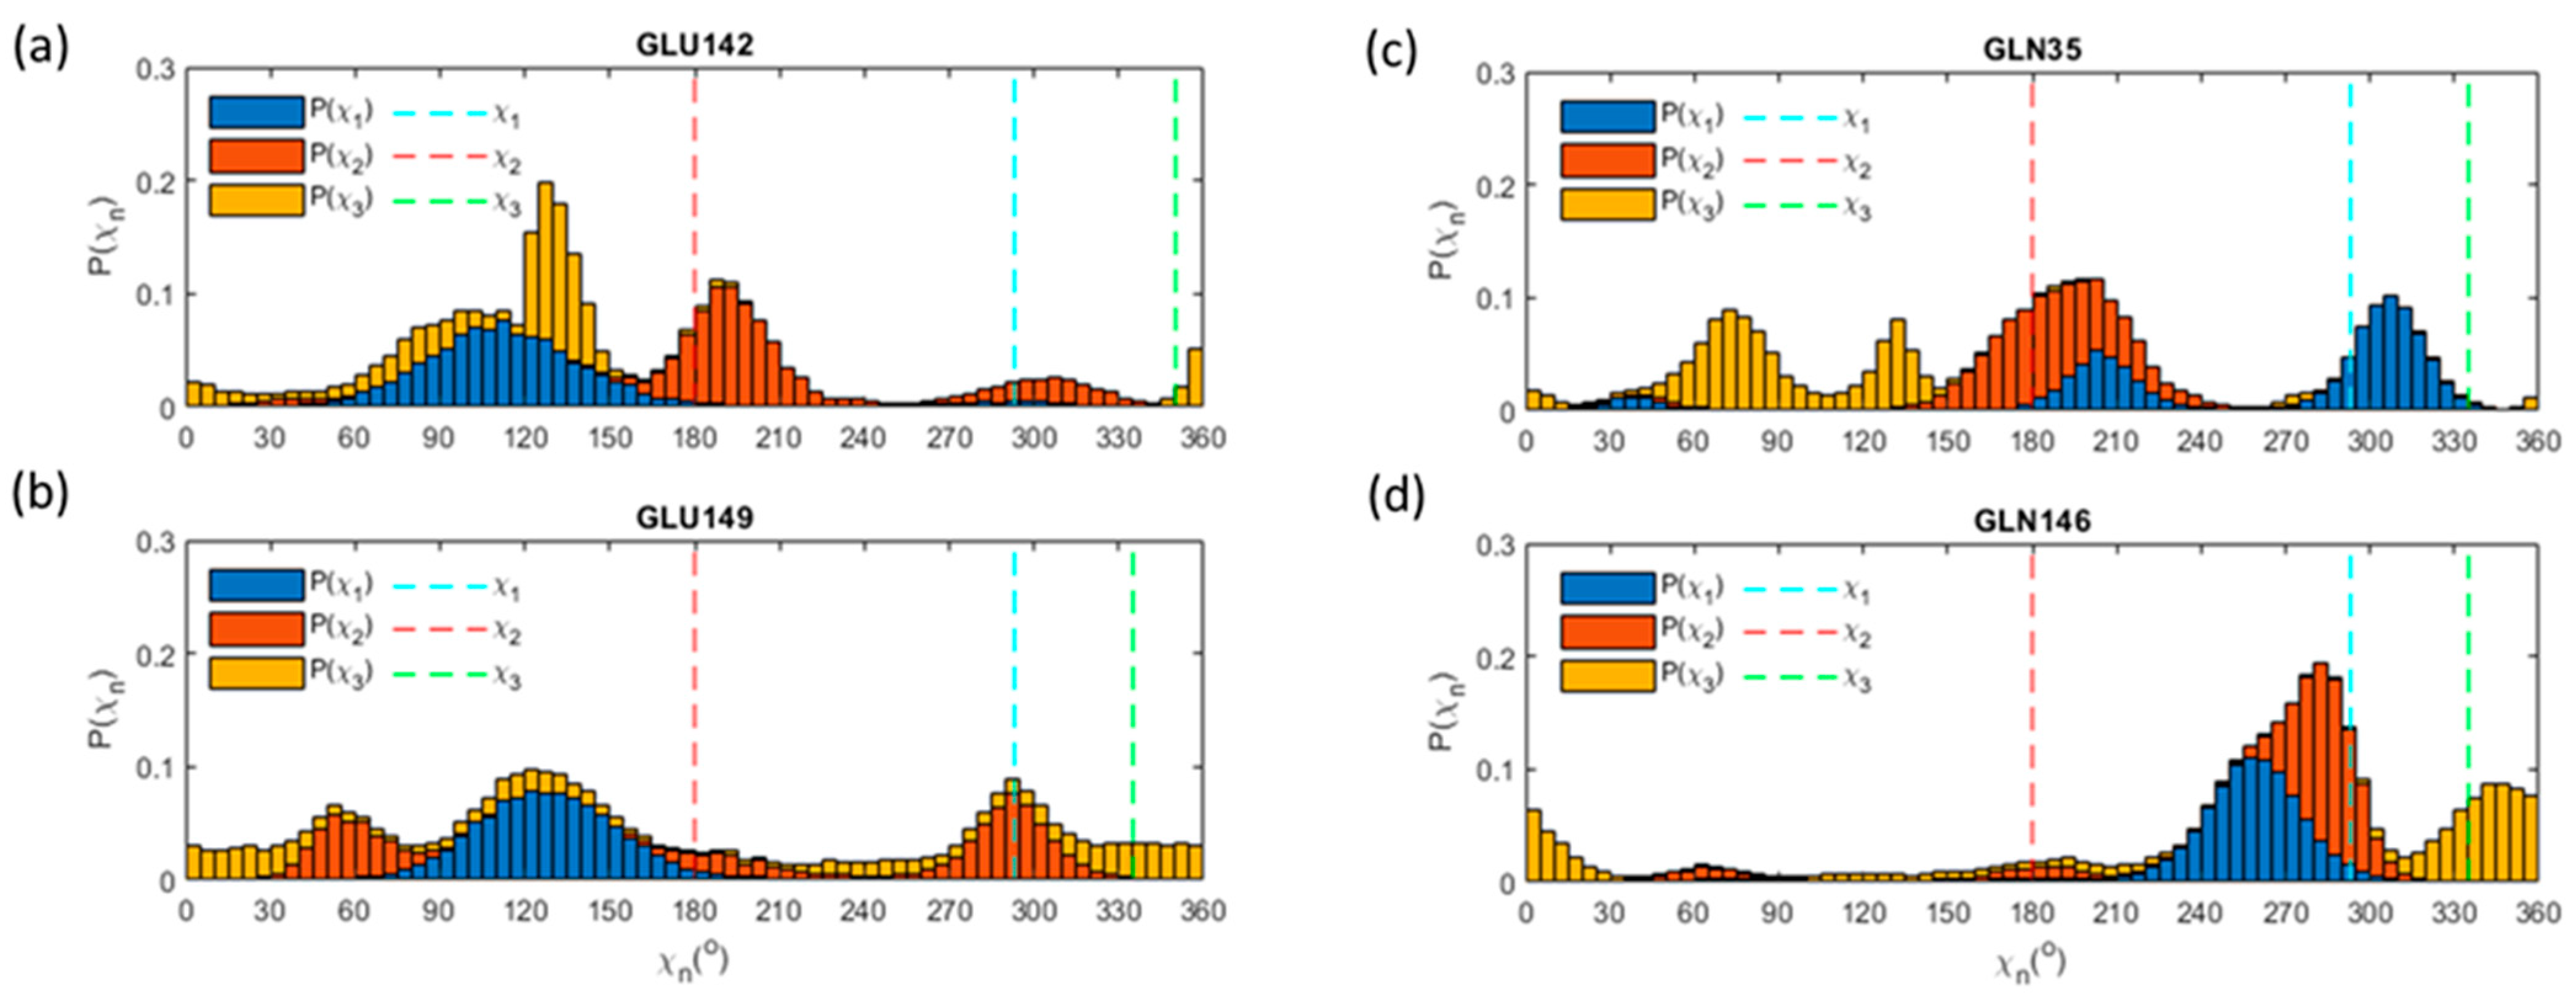
We investigated experimental rotamers with the full density distribution of χ1, χ2, χ3 dihedral angles for each of 19 Glu and three Gln residues in a single Hyp-1 chain. Deviations were noticed for six polar, surface Glu amino acids modeled in most common rotamers, mt-10 (33% of probability), or tt0 (24% of all Glu) in accordance with the Penultimate Rotamer Library. Under the simulation regime, we found the tendency of these residues to adopt rare side-chain conformations, e.g., tm-20 and tp10. The broadening of individual χ distributions (especially for terminal χ3 between sp3 and sp2 hybridized atoms) complicates the determination of the rotameric state (Figure 7a,b). As in the case of the experimental Hyp-1 structure model, simulated Glu conformations are mainly stabilized by H-bonds between solvent and side-chain amide or carboxyl group. For α3-helical Glu142 by cavity entrance EB (Figure 7a), pairing with the protonated amino group of adjacent Asn134 may occur and impose the characteristic codependency of χ dihedral angles to preserve this preferred interaction. A comparison between the experimental and simulated Hyp-1 models have shown rotamer outliers on Gln35 and Gln146 (Figure 7c,d).
On the basis of the experimental Hyp-1 structure, strong peaks at P(χ1, χ2, χ3) distribution for the most common rotamer mt-30 are expected near χ1 = 290°, χ2 = 180° and χ3 = 330°. The complementary rotameric form was stabilized by mutual hydrogen interactions of carboxyl and amino groups. This strengthening pattern was broken under simulation conditions, in which steric restraints and greater solvent accessibility reversed Gln35 and Gln146 side-chain conformations. In our simulated model, less common rotamers tt0, mm-40, and mm100 are favored and stabilized by interactions with surrounding solvent molecules. Preference to adopt rare rotamers in long side chains of Glu and Gln arises from their susceptibility to dynamic changes, surface exposition, and the possible lack of strong intramolecular interactions [39]. Due to this, it is usually recommended to model such side chains using only one or several most common rotamers [38]. Analyzing the rotamericity of Glu/Gln side-chain conformations, we found this approach to be insufficient, because some certain, energetically favored conformations can be omitted. As a result, we noticed some inexplicable ADP peaks at the Cγ atom of Glu132 from the experimental Hyp-1 structure (Figure 3c,d), although the residue was modeled in dominant rotameric form. The swap to supposedly less popular conformation minimizes the thermal motions of Glu132 indicating lower energy conformation.

3.9. Met

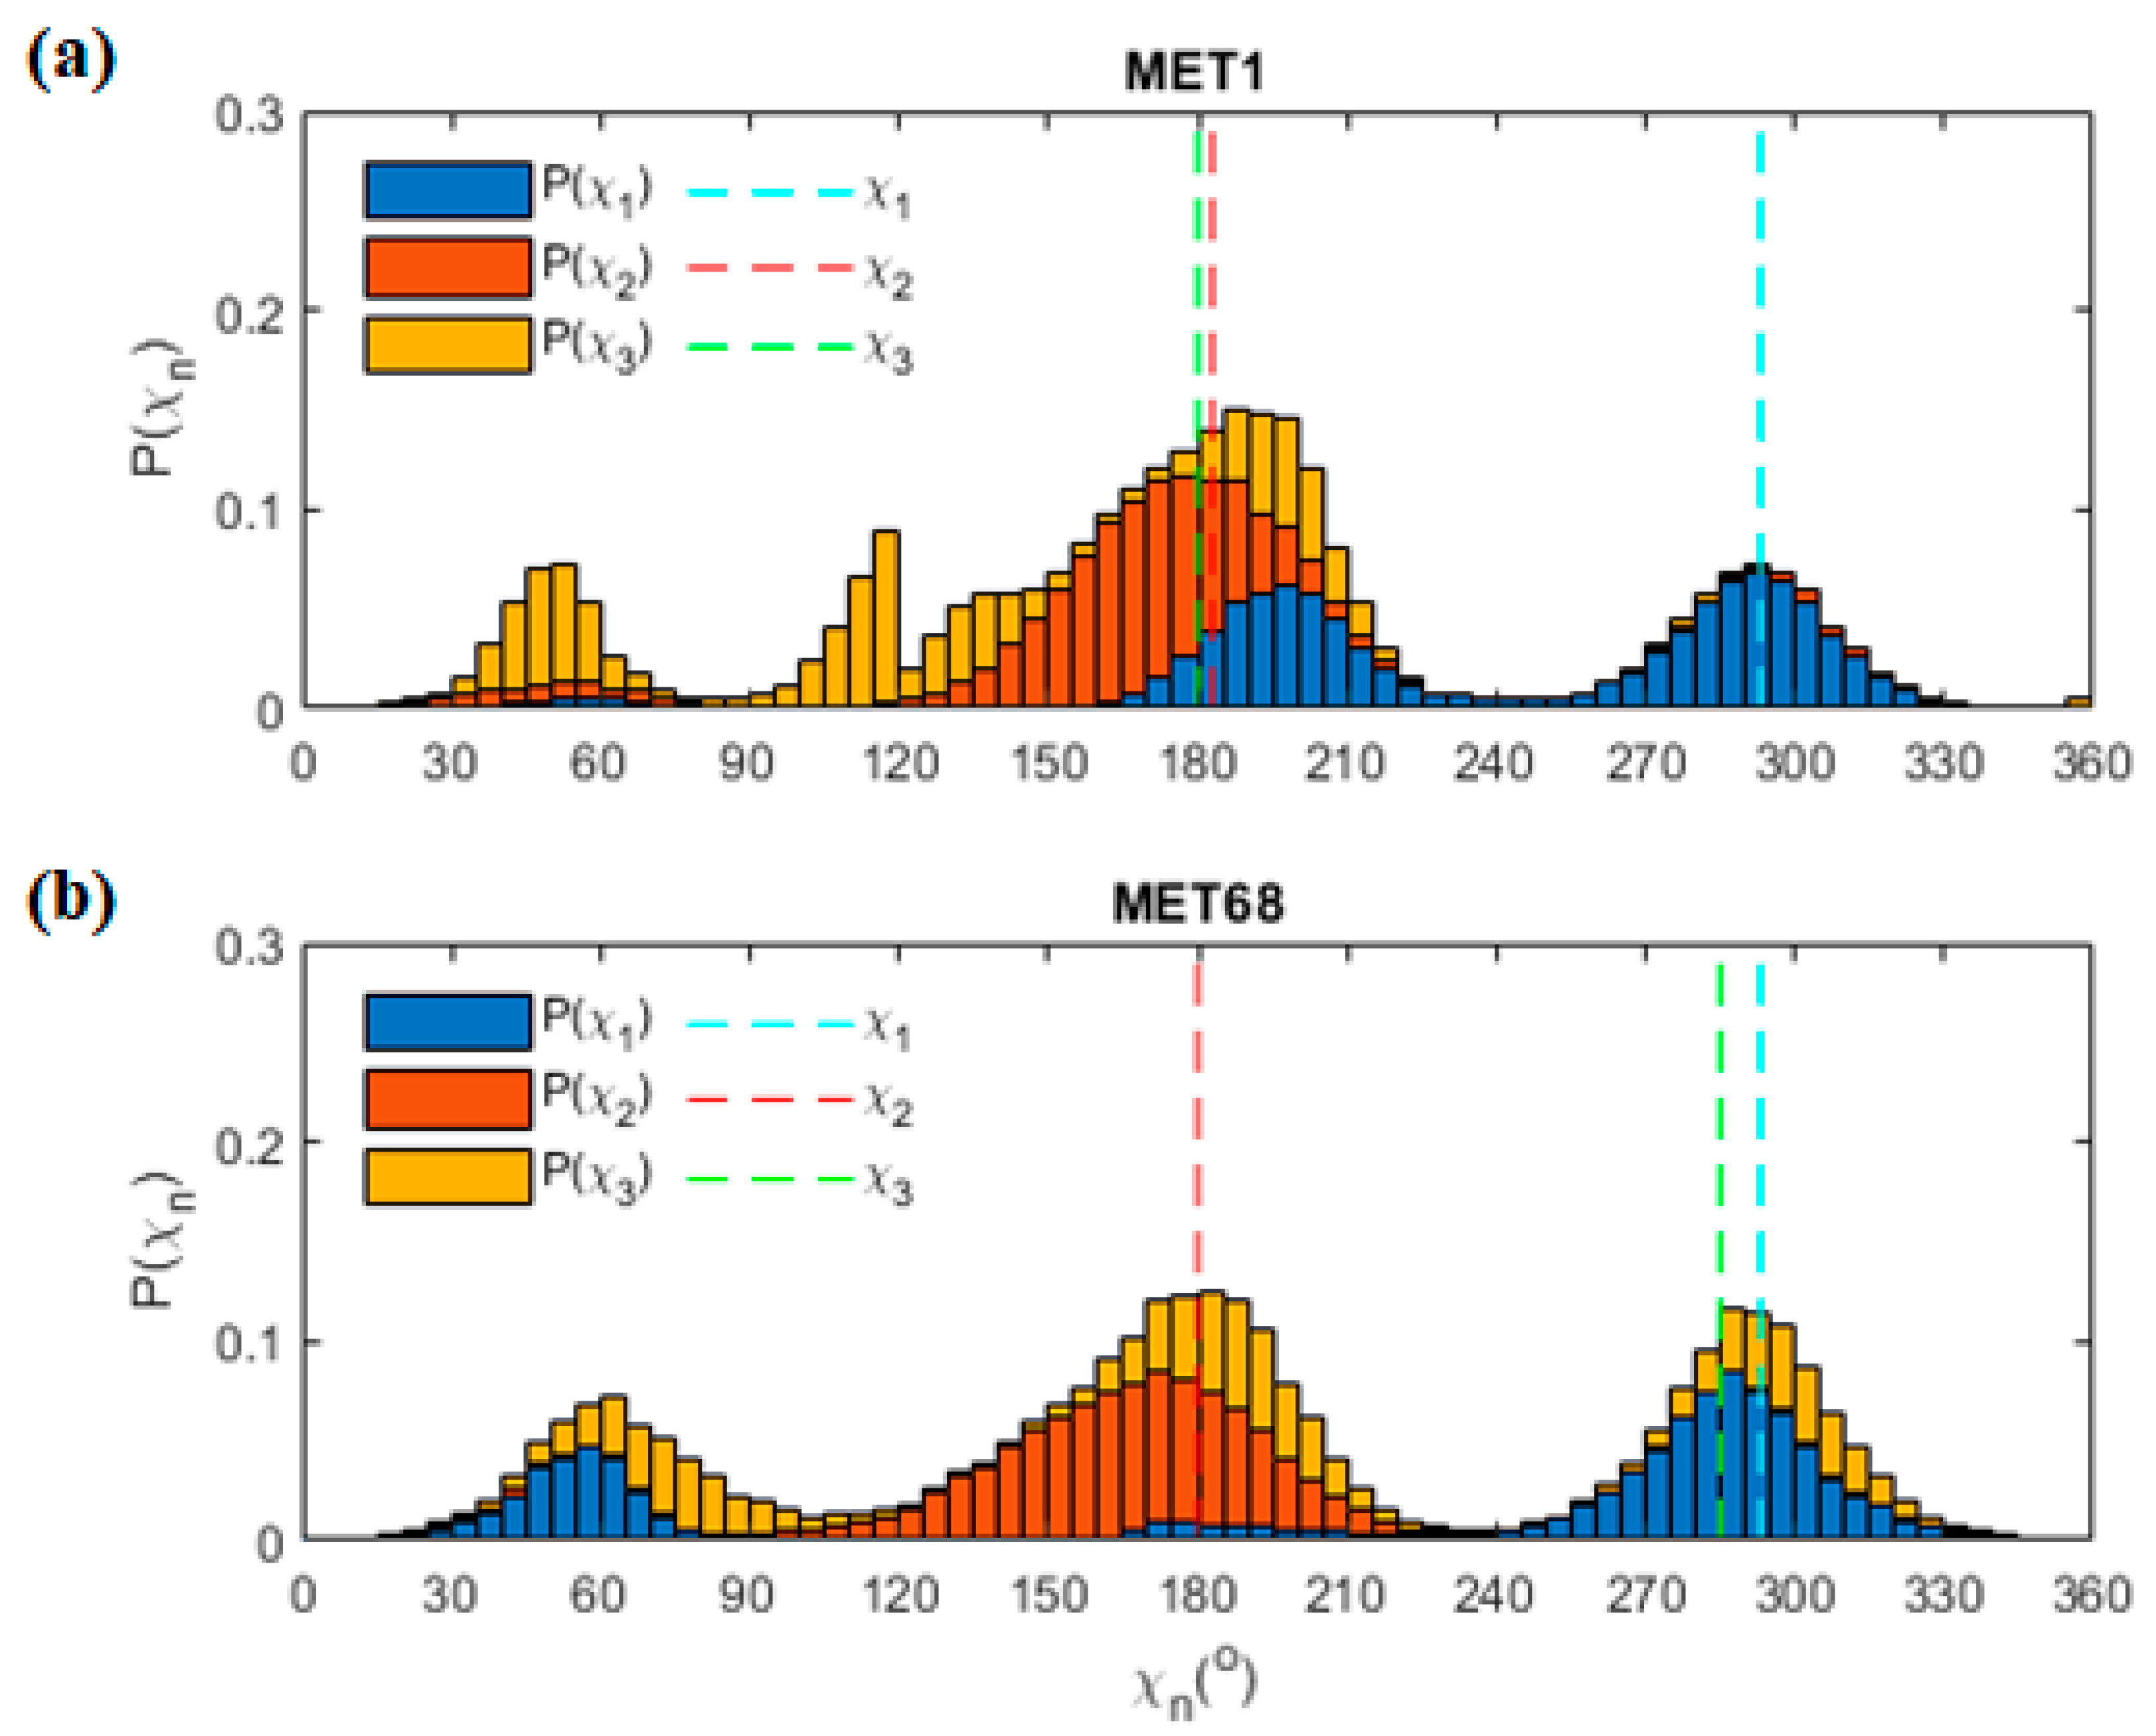
Amino-acid sequence of Hyp-1 contains only two Met residues, N-terminal Met1, and β-branched Met68, in each of the protein molecules within the dimer. According to the experimental rotamers, one might expect P(χ1, χ2, χ3) distribution peaks at χ1 = 293°, χ2 = 180° and χ3 = 180° or χ3 = 285°. The value of χ3 clearly determines the available rotamer, as other dihedral angles were the same for both conformations, mtt, and mtm. They belong to less populated rotamer states, with 8 and 11% of appearance according to Penultimate Library. In our studies, both simulated Met rotamers diverge from those experimental, mainly towards more popular mtp conformation indicated by χ3 near 75° (Figure 8a,b). Our physics-based approach confirmed well the preservation of two χ1, χ2 angles between sp3 atoms attached to the δ atom [91]. The main difference lies in the terminal χ3 due to the elongated C–S bond and accompanying a low rotational barrier in comparison to other all-carbon tetrahedral torsions. High conformational freedom of Met residues could be also a result of a lack of directional interactions stabilizing the C-terminal part of the side chain. In our simulated model, the choice of rotamer is dictated by bonds with penetrating solvent as well as strong repulsing restraints imposed during a simulation. The supposed conformation of Met68 seems to be particularly important, as this residue was involved in ligand binding and the forming of Hyp-1 protein complexes.

3.10. Lys, Arg

Long side chains of Arg and Lys characterized by four dihedral angles can occur in many combinations. Among 16 Lys residues in a single Hyp-1 molecule, all of them adopt rare rotameric states with Lys123 mttt (20% of samples) as the most popular one. In eight cases (Lys8, 21, 33, 40, 83, 113, 138 and 145), the deviations between experimental and simulated rotamers were observed, each of them suggesting a more populated conformation (Figure 9a,b, Figures S8–S10 (see Supplementary Materials)).
The disordered structure of Lys8 prevents bonding with the PEG501 molecule, while in our studies, the favored mttt conformation provides optimal hydrogen interactions with both the surrounding ligand and solvent. In the Hyp-1 structure, Lys side chains tend to form partially ordered supramolecular crown ethers adducts with PEG ligands, first observed for Lys33 in molecule A. Specific interaction with PEG ligands restricts rare conformations of Lys33, while our simulation suggests that conformational changes of the Lys33A side chain can improve the hydrogen interaction with the lysine terminal amino group. In chain B, a different orientation of Lys33 blocks the possibility of effective PEG binding and imposes another conformation of the ligand. Positively charged Lys residues can be easily replaced by Arg, while three of them exist in rare mtp180 and ptm-85 rotamers in each protein chain. Our calculated 4-dimensional probability distribution of torsion angles reveals conformational changes in Arg27 and Arg93. P(χ1, χ2, χ3, χ4) distribution of Arg27 side-chain angles clearly exhibits the most populated sharp clusters referring to each torsion. Although Arg27 was modeled in double conformation in an experimental Hyp-1 structure as a result of stabilizing interaction absence, during the simulation we found ttp-105 to be the most preferred rotamer. Therefore, H-bonds with an adjacent hydroxyl group of Tyr85 and backbone Leu24 carboxyl group are responsible for the stabilization of simulated rotamer and its anchoring within the protein interior. Within the probability distribution of Arg93 side-chain torsions, we found broad conformational regions of terminal χ3 and χ4 angles (Figure 9d). Due to this reason, the conformational diversity of Arg93 is expressed as a mixture of differently populated rotamers. MD simulation can indicate some beneficial regions in the energy landscape of structure, especially for mtt85 rotamer, in which interactions of the guanidinium group of Arg93 side chain by EB entrance define the internal pocket availability for ligands.

4. Conclusions

In the presented work, we compared the experimental and deposited in the PDB database protein structure of Hyp-1 with the results of the molecular dynamics simulations. We tried to use a physics-based approach as complementary to the knowledge-based method of protein structure validation. Our results confirmed that multistep MD simulation can successfully maintain the secondary structure of the protein and its characteristic fold without disturbances of main secondary structure motifs, e.g., α helices, and β strands. Calculated Cα RMSD equal to 2.38 Å results mainly from the high conformational freedom of protein side chains and is comparable with the results of ns-scale protein simulation mentioned in other papers. Direct observation of atomic trajectories during simulation allows calculating individual RMSD and ADPs, which are typically >10 Å2 higher than experimental ones. Our averaged Hyp-1 model was re-refined with isotropic ADPs and using the TLS model, which restored diversity between ADPs within the structure due to more defined restraints imposed on the backbone and side chains and inclusion of correlated atomic motions in opposition to pure dynamic changes during simulation. We found our result consistent with other MD simulations of protein models, in which experimental ADPs appear to be systematically understated. Comparing average structure factors, a high level of similarity between those calculated and simulated was observed. We used the MD method as a tool for the verification of experimental Hyp-1 rotamers because at least part of them was arbitrarily modeled into electron density indicated by increased ADPs at their Cγ atoms and simulation seems to provide more rigorous insight into dynamical properties of the system. Based on the normalized probability density distribution of χi torsion angles from the optimal 1 ns simulation, we proposed energetically preferred rotameric forms at 292 K differentt to thoset resulting from the refinement. We explained how their existence was connected with the structural properties of the Hyp-1 protein, especially in the context of possible biologically active ligand binding. A complete comparison of rotamer outliers within Hyp-1 experimental and simulated structures, partially with a calculated probability of each angle samples within 40° × 40° boxes, is provided in Tables S1 and S2 of Supplementary Content (see Supplementary Materials). The method of MD simulation appears to be particularly useful for the examination and validation of post-refinement protein structures complementary to the currently used knowledge-based techniques. A near-experimental approach is a key factor in a proper understanding of the functional role of the protein. Using MD-based sampling simulations, some structural irregularities in bonds, angles, or rotameric states can be corrected with sufficient accuracy to monitor the biological activity of the protein. It is crucial in the case of seemingly uncomplicated protein structures such as Hyp-1 with potentially high potential in medicine and affinity to various ligand binding. We affirmed MD methods as a useful tool in the verification of experimental protein models and the explanation of “blank spaces” in poorly refined regions of electron density maps. In the future, we would like to develop this approach on a larger scale and use it to explain other structural ambiguities, mainly in larger Hyp-1 complexes with different ligands and their bizarrely modulated phases.

Supplementary Materials

The following are available online at https://www.mdpi.com/2073-4352/11/1/43/s1.

Author Contributions

Conceptualization, J.S. and R.S.; methodology, T.K.; software, T.K.; validation, T.K., J.S., R.S. and I.B.; formal analysis, R.S. and J.W.; investigation, J.S.; resources, J.S. and T.K.; data curation, T.K.; writing—original draft preparation, J.S.; writing—review and editing, R.S. and T.K.; visualization, J.S.; supervision, J.W.; project administration, J.W.; funding acquisition, J.W. All authors have read and agreed to the published version of the manuscript.

Funding

Joanna Smietanska is partly supported by an EU Project POWR.03.02.00-00-I004/16. Authors acknowledge financial support from Polish National Science Center under grants no. 2019/33/B/ST3/02063 and 2020/37/N/ST3/01501.

Informed Consent Statement

Informed consent was obtained from all subjects involved in the study.

Data Availability Statement

The data presented in this study are available in Supplementary Material.

Acknowledgments

We would like to show our gratitude to the Mariusz Jaskolski from Center for Biocrystallographic Research in Poznan, Poland, for many discussions and his insightful comments that greatly improved the manuscript.

Conflicts of Interest

The authors declare no conflict of interest.

Correction Statement

This article has been republished with a minor correction to the Funding statement. This change does not affect the scientific content of the article.

References

  1. McCammon, J.A.; Gelin, B.R.; Karplus, M. Dynamics of folded proteins. Nat. Cell Biol. 1977, 267, 585–590. [Google Scholar] [CrossRef]
  2. Gaalswyk, K.; Muniyat, M.I.; Maccallum, J.L. The emerging role of physical modeling in the future of structure determination. Curr. Opin. Struct. Biol. 2018, 49, 145–153. [Google Scholar] [CrossRef]
  3. Patodia, S.; Bagaria, A.; Chopra, D. Molecular Dynamics Simulation of Proteins: A Brief Overview. J. Chem. Phys. Biophys. 2014, 4. [Google Scholar] [CrossRef]
  4. Karplus, M.; Kuriyan, J. Molecular dynamics and protein function. Proc. Natl. Acad. Sci. USA 2005, 102, 6679–6685. [Google Scholar] [CrossRef]
  5. Shaw, D.E.; Maragakis, P.; Lindorff-Larsen, K.; Piana, S.; Dror, R.O.; Eastwood, M.P.; Bank, J.A.; Jumper, J.M.; Salmon, J.K.; Shan, Y.; et al. Atomic-Level Characterization of the Structural Dynamics of Proteins. Science 2010, 330, 341–346. [Google Scholar] [CrossRef]
  6. Freddolino, P.L.; Arkhipov, A.S.; Larson, S.B.; McPherson, A.; Schulten, K. Molecular Dynamics Simulations of the Complete Satellite Tobacco Mosaic Virus. Structure 2006, 14, 437–449. [Google Scholar] [CrossRef]
  7. Perez, A.; Morrone, J.A.; Simmerling, C.; Dill, K.A. Advances in free-energy-based simulations of protein folding and ligand binding. Curr. Opin. Struct. Biol. 2016, 36, 25–31. [Google Scholar] [CrossRef]
  8. Allen, F.; Almasi, G.; Andreoni, W.; Beece, D.; Berne, B.J.; Bright, A.; Brunheroto, J.; Cascaval, C.; Castanos, J.; Coteus, P.; et al. Blue Gene: A vision for protein science using a petaflop supercomputer. IBM Syst. J. 2001, 40, 310–327. [Google Scholar] [CrossRef]
  9. Brooks, B.R.; Bruccoleri, R.E.; Olafson, B.D.; States, D.J.; Swaminathan, S.; Karplus, M. CHARMM: A program for macromolecular energy, minimization, and dynamics calculations. J. Comput. Chem. 1983, 4, 187–217. [Google Scholar] [CrossRef]
  10. Phillips, J.C.; Braun, R.; Wang, W.; Gumbart, J.; Tajkhorshid, E.; Villa, E.; Chipot, C.; Skeel, R.D.; Kalé, L.; Schulten, K. Scalable molecular dynamics with NAMD. J. Comput. Chem. 2005, 26, 1781–1802. [Google Scholar] [CrossRef] [PubMed]
  11. Abraham, M.J.; Murtola, T.; Schulz, R.; Pall, S.; Smith, J.C.; Hess, B.; Lindahl, E. GROMACS: High performance molecular simulations through multi-level parallelism from laptops to supercomputers. SoftwareX 2015, 1, 19–25. [Google Scholar] [CrossRef]
  12. Cornell, W.D.; Cieplak, P.; Bayly, C.I.; Gould, I.R.; Merz, K.M.; Ferguson, D.M.; Spellmeyer, D.C.; Fox, T.; Caldwell, J.W.; Kollman, P.A. A Second Generation Force Field for the Simulation of Proteins, Nucleic Acids, and Organic Molecules. J. Am. Chem. Soc. 1995, 117, 5179–5197. [Google Scholar] [CrossRef]
  13. Lee, M.R.; Tsai, J.; Baker, D.; Kollman, P.A. Molecular dynamics in the endgame of protein structure prediction. J. Mol. Biol. 2001, 313, 417–430. [Google Scholar] [CrossRef] [PubMed]
  14. Karplus, M.; McCammon, J.A. Molecular dynamics simulations of biomolecules. Nat. Struct. Biol. 2002, 9, 646–652. [Google Scholar] [CrossRef]
  15. Dror, R.O.; Dirks, R.M.; Grossman, J.; Xu, H.; Shaw, D.E. Biomolecular Simulation: A Computational Microscope for Molecular Biology. Annu. Rev. Biophys. 2012, 41, 429–452. [Google Scholar] [CrossRef]
  16. Chen, J.; Brooks, C.L. Can molecular dynamics simulations provide high-resolution refinement of protein structure? Proteins Struct. Funct. Bioinform. 2007, 67, 922–930. [Google Scholar] [CrossRef]
  17. Kuzmanic, A.; Pannu, N.S.; Zagrovic, B. X-ray refinement significantly underestimates the level of microscopic heterogeneity in biomolecular crystals. Nat. Commun. 2014, 5. [Google Scholar] [CrossRef]
  18. Piana, S. How robust are protein folding simulations with respect to force field parameterization? Biophys. J. 2011, 101, 1015. [Google Scholar] [CrossRef]
  19. Izmailov, S.A.; Podkorytov, I.S.; Skrynnikov, N.R. Simple MD-based model for oxidative folding of peptides and proteins. Sci. Rep. 2017, 7, 9293. [Google Scholar] [CrossRef]
  20. Ensign, D.L.; Kasson, P.M.; Pande, V.S. Heterogeneity Even at the Speed Limit of Folding: Large-scale Molecular Dynamics Study of a Fast-folding Variant of the Villin Headpiece. J. Mol. Biol. 2007, 374, 806–816. [Google Scholar] [CrossRef]
  21. Stumpff-Kane, A.W.; Maksimiak, K.; Lee, M.S.; Feig, M. Sampling of near-native protein conformations during protein structure refinement using a coarse-grained model, normal modes, and molecular dynamics simulations. Proteins Struct. Funct. Bioinform. 2007, 70, 1345–1356. [Google Scholar] [CrossRef] [PubMed]
  22. Wereszczynski, J.; McCammon, J.A. Statistical mechanics and molecular dynamics in evaluating thermodynamic properties of biomolecular recognition. Q. Rev. Biophys. 2011, 45, 1–25. [Google Scholar] [CrossRef] [PubMed]
  23. Adiyaman, R.; McGuffin, L.J. Methods for the Refinement of Protein Structure 3D Models. Int. J. Mol. Sci. 2019, 20, 2301. [Google Scholar] [CrossRef] [PubMed]
  24. Wong-Ekkabut, J.; Karttunen, M. The good, the bad and the user in soft matter simulations. Biochim. Biophys. Acta Biomembr. 2016, 1858, 2529–2538. [Google Scholar] [CrossRef]
  25. Bernardi, R.C.; Melo, M.C.R.; Schulten, K. Enhanced sampling techniques in molecular dynamics simulation of biological systems. Biochim. Biophys. Acta 2015, 1850, 872–877. [Google Scholar] [CrossRef] [PubMed]
  26. Feig, M.; Mirjalili, V. Protein structure refinement via molecular-dynamics simulations: What works and what does not? Proteins Struct. Funct. Bioinform. 2015, 84, 282–292. [Google Scholar] [CrossRef]
  27. Pang, Y.-P. Use of multiple picosecond high-mass molecular dynamics simulations to predict crystallographic B-factors of folded globular proteins. Heliyon 2016, 2. [Google Scholar] [CrossRef]
  28. Masmaliyeva, R.C.; Murshudov, G.N. Analysis and validation of macromolecular B values. Acta Crystallogr. Sect. D Struct. Biol. 2019, 75, 505–518. [Google Scholar] [CrossRef]
  29. Caldararu, O.; Kumar, R.; Oksanen, E.; Logan, D.T.; Ryde, U. Are crystallographic B-factors suitable for calculating protein conformational entropy? Phys. Chem. Chem. Phys. 2019, 21, 18149–18160. [Google Scholar] [CrossRef]
  30. Parthasarathy, S.; Murthy, M. Analysis of temperature factor distribution in high-resolution protein structures. Protein Sci. 2008, 6, 2561–2567. [Google Scholar] [CrossRef]
  31. Carugo, O.; Argos, P. Correlation between side chain mobility and conformation in protein structures. Protein Eng. Des. Sel. 1997, 10, 777–787. [Google Scholar] [CrossRef] [PubMed]
  32. Meinhold, L.; Smith, J.C. Fluctuations and Correlations in Crystalline Protein Dynamics: A Simulation Analysis of Staphylococcal Nuclease. Biophys. J. 2005, 88, 2554–2563. [Google Scholar] [CrossRef] [PubMed]
  33. Kuriyan, J.; Weis, W.I. Rigid protein motion as a model for crystallographic temperature factors. Proc. Natl. Acad. Sci. USA 1991, 88, 2773–2777. [Google Scholar] [CrossRef]
  34. Soheilifard, R.; Makarov, D.E.; Rodin, G.J. Critical evaluation of simple network models of protein dynamics and their comparison with crystallographic B-factors. Phys. Biol. 2008, 5, 026008. [Google Scholar] [CrossRef] [PubMed]
  35. Winn, M.D.; Isupovb, M.N.; Murshudov, G.N. Use of TLS parameters to model anisotropic displacements in macromolecular refinement. Acta Cryst. 2001, 57, 122–133. [Google Scholar] [CrossRef] [PubMed]
  36. Carugo, O. How large B-factors can be in protein crystal structures. BMC Bioinform. 2018, 19. [Google Scholar] [CrossRef] [PubMed]
  37. Kato, K.; Nakayoshi, T.; Fukuyoshi, S.; Kurimoto, E.; Oda, A. Validation of Molecular Dynamics Simulations for Prediction of Three-Dimensional Structures of Small Proteins. Molecules 2017, 22, 1716. [Google Scholar] [CrossRef]
  38. Hintze, B.J.; Lewis, S.M.; Richardson, J.S.; Richardson, D.C. Molprobity’s Ultimate Rotamer-Library Distributions for Model Validation. Proteins 2016, 84, 1177–1189. [Google Scholar] [CrossRef]
  39. Towse, C.-L.; Rysavy, S.J.; Vulovic, I.M.; Daggett, V. New Dynamic Rotamer Libraries: Data-Driven Analysis of Side-Chain Conformational Propensities. Structure 2016, 24, 187–199. [Google Scholar] [CrossRef]
  40. Harder, T.; Boomsma, W.; Paluszewski, M.; Frellsen, J.; Johansson, K.E.; Hamelryck, T. Beyond rotamers: A generative, probabilistic model of side chains in proteins. BMC Bioinform. 2010, 11. [Google Scholar] [CrossRef]
  41. Haddad, J.; Vojtech, A.; Heger, Z. Rotamer Dynamics: Analysis of Rotamers in Molecular Dynamics Simulations of Proteins. Biophys. J. 2019, 116, 2062–2072. [Google Scholar] [CrossRef] [PubMed]
  42. Butterweck, V. Mechanism of action of St. John’s wort in depression: What is known? CNS Drugs 2003, 17, 539–562. [Google Scholar] [CrossRef] [PubMed]
  43. Michalska, K.; Fernandes, H.; Sikorski, M.M.; Jaskolski, M. Crystal structure of Hyp-1, a St. John’s wort protein implicated in the biosynthesis of hypericin. J. Struct. Biol. 2010, 169, 161–171. [Google Scholar] [CrossRef] [PubMed]
  44. Sliwiak, J.; Dauter, Z.; Jaskolski, M. Hyp-1 protein from St John’s wort as a PR-10 protein. Biotechnology 2013, 1, 47–50. [Google Scholar] [CrossRef]
  45. Sliwiak, J.; Dauter, Z.; Jaskolski, M. Crystal Structure of Hyp-1, a Hypericum perforatum PR-10 Protein, in Complex with Melatonin. Front. Plant Sci. 2016, 7, 668. [Google Scholar] [CrossRef]
  46. Sliwiak, J.; Dauter, Z.; Kowiel, M.; McCoy, A.; Read, R.J.; Jaskolski, M. ANS complex of St. John’s wort PR-10 protein with 28 copies in the asymmetric unit: A fiendish combination of pseudosymmetry with tetartohedral twinning. Acta Cryst. 2015, D71, 829–843. [Google Scholar] [CrossRef]
  47. Berendsen, H.; Van Der Spoel, D.; Van Drunen, R. GROMACS: A message-passing parallel molecular dynamics implementation. Comput. Phys. Commun. 1995, 91, 43–56. [Google Scholar] [CrossRef]
  48. Lindahl, E.; Hess, B.; Van Der Spoel, D. GROMACS 3.0: A package for molecular simulation and trajectory analysis. J. Mol. Model. 2001, 7, 306–317. [Google Scholar] [CrossRef]
  49. Van Der Spoel, D.; Lindahl, E.; Hess, B.; Groenhof, G.; Mark, A.E.; Berendsen, H.J.C. GROMACS: Fast, flexible, and free. J. Comput. Chem. 2005, 26, 1701–1718. [Google Scholar] [CrossRef]
  50. Hess, B.; Kutzner, C.; Van Der Spoel, D.; Lindahl, E. GROMACS 4: Algorithms for Highly Efficient, Load-Balanced, and Scalable Molecular Simulation. J. Chem. Theory Comput. 2008, 4, 435–447. [Google Scholar] [CrossRef]
  51. Pronk, S.; Páll, S.; Schulz, R.; Larsson, P.; Bjelkmar, P.; Apostolov, R.; Shirts, M.R.; Smith, J.C.; Kasson, P.M.; Van Der Spoel, D.; et al. GROMACS 4.5: A high-throughput and highly parallel open source molecular simulation toolkit. Bioinformatics 2013, 29, 845–854. [Google Scholar] [CrossRef] [PubMed]
  52. Pall, S.; Abraham, M.J.; Kutzner, C.; Hess, B.; Lindahl, E. Tackling Exascale Software Challenges in Molecular Dynamics Simulations with GROMACS. In Solving Software Challenges for Exascale; Markidis, S., Laure, E., Eds.; Springer: Cham, Switzerland, 2015; pp. 3–27. [Google Scholar]
  53. Abraham, M.J.; van der Spoel, D.; Lindahl, E.; Hess, B.; GROMACS Development Team. GROMACS User Manual Version 2018. Available online: www.gromacs.org (accessed on 2 November 2020).
  54. Jorgensen, W.L.; Tirado-Rives, J. The OPLS [optimized potentials for liquid simulations] potential functions for proteins, energy minimizations for crystals of cyclic peptides and crambin. J. Am. Chem. Soc. 1988, 110, 1657–1666. [Google Scholar] [CrossRef] [PubMed]
  55. Jorgensen, W.L.; Maxwell, D.S.; Tirado-Rives, J. Development and testing of the OPLS all-atom force field on conformational energetics and properties of organic liquids. J. Am. Chem. Soc. 1996, 118, 11225–11236. [Google Scholar] [CrossRef]
  56. Jorgensen, W.L.; McDonald, N.A. Development of an all-atom force field for heterocycles. Properties of liquid pyridine and diazenes. J. Mol. Struct. Theochem 1998, 424, 145–155. [Google Scholar] [CrossRef]
  57. McDonald, N.A.; Jorgensen, W.L. Development of an All-Atom Force Field for Heterocycles. Properties of Liquid Pyrrole, Furan, Diazoles, and Oxazoles. J. Phys. Chem. B 1998, 102, 8049–8059. [Google Scholar] [CrossRef]
  58. Rizzo, R.C.; Jorgensen, W.L. OPLS All-Atom Model for Amines: Resolution of the Amine Hydration Problem. J. Am. Chem. Soc. 1999, 121, 4827–4836. [Google Scholar] [CrossRef]
  59. Price, M.L.P.; Ostrovsky, D.; Jorgensen, W.L. Gas-phase and liquid-state properties of esters, nitriles, and nitro compounds with the OPLS-AA force field. J. Comput. Chem. 2001, 22, 1340–1352. [Google Scholar] [CrossRef]
  60. Watkins, E.K.; Jorgensen, W.L. Perfluoroalkanes: Conformational Analysis and Liquid-State Properties from ab Initio and Monte Carlo Calculations. J. Phys. Chem. A 2001, 105, 4118–4125. [Google Scholar] [CrossRef]
  61. Kaminski, G.A.; Friesner, R.A.; Tirado-Rives, J.; Jorgensen, W.L. Evaluation and Reparametrization of the OPLS-AA Force Field for Proteins via Comparison with Accurate Quantum Chemical Calculations on Peptides. J. Phys. Chem. B 2001, 105, 6474–6487. [Google Scholar] [CrossRef]
  62. Horn, H.W.; Swope, W.C.; Pitera, J.W.; Madura, J.D.; Dick, T.J.; Hura, G.L.; Head-Gordon, T. Development of an improved four-site water model for biomolecular simulations: TIP4P-Ew. J. Chem. Phys. 2004, 120, 9665–9678. [Google Scholar] [CrossRef]
  63. Hohenberg, P.; Kohn, W. Inhomogeneous electron gas. Phys. Rev. 1964, 136, B864–B871. [Google Scholar] [CrossRef]
  64. Kohn, W.; Sham, L.J. Self-Consistent Equations Including Exchange and Correlation Effects. Phys. Rev. 2002, 140, A1133–A1138. [Google Scholar] [CrossRef]
  65. EMSL Basis Set Exchange. Available online: https://bse.pnl.gov/bse/portal (accessed on 5 November 2020).
  66. Becke, A.D. Density-functional exchange-energy approximation with correct asymptotic behavior. Phys. Rev. A 1988, 38, 3098–3100. [Google Scholar] [CrossRef] [PubMed]
  67. Lee, C.; Yang, W.; Parr, R.G. Development of the Colle-Salvetti correlation-energy formula into a functional of the electron density. Phys. Rev. B 1988, 37, 785–789. [Google Scholar] [CrossRef]
  68. Valiev, M.; Bylaska, E.J.; Govind, N.; Kowalski, K.; Straatsma, T.P.; van Dam, H.J.J.; Wang, D.; Nieplocha, J.; Apra, E.; Windus, T.L.; et al. NWChem: A comprehensive and scalable open-source solution for large scale molecular simulations. Comp. Phys. Commun. 2010, 181, 1477–1489. [Google Scholar] [CrossRef]
  69. Darden, T.A.; York, D.M.; Pedersen, L. Particle mesh Ewald: An N⋅log(N) method for Ewald sums in large systems. J. Chem. Phys. 1993, 98, 10089–10092. [Google Scholar] [CrossRef]
  70. Essmann, U.; Perera, L.; Berkowitz, M.L.; Darden, T.; Lee, H.; Pedersen, L.G. A smooth particle mesh Ewald method. J. Chem. Phys. 1995, 103, 8577–8593. [Google Scholar] [CrossRef]
  71. Páll, S.; Hess, B. A flexible algorithm for calculating pair interactions on SIMD architectures. Comput. Phys. Commun. 2013, 184, 2641–2650. [Google Scholar] [CrossRef]
  72. Liebschner, D.; Afonine, P.V.; Baker, M.L.; Bunkóczi, G.; Chen, V.B.; Croll, T.I.; Hintze, B.; Hung, L.-W.; Jain, S.; McCoy, A.J.; et al. Macromolecular structure determination using X-rays, neutrons and electrons: Recent developments in Phenix. Acta Crystallogr. Sect. D Struct. Biol. 2019, 75, 861–877. [Google Scholar] [CrossRef]
  73. Krissinel, E. Enhanced fold recognition using efficient short fragment clustering. J. Mol. Biochem. 2012, 1, 76–85. [Google Scholar]
  74. Pang, Y.-P. At least 10% shorter C–H bonds in cryogenic protein crystal structures than in current AMBER forcefields. Biochem. Biophys. Res. Commun. 2015, 458, 352–355. [Google Scholar] [CrossRef] [PubMed]
  75. Murshudov, G.N.; Skubák, P.; Lebedev, A.A.; Pannu, N.S.; Steiner, R.A.; Nicholls, R.A.; Winn, M.D.; Long, F.; Vagin, A.A. REFMAC5 for the refinement of macromolecular crystal structures. Acta Crystallogr. Sect. D Biol. Crystallogr. 2011, 67, 355–367. [Google Scholar] [CrossRef]
  76. Engh, R.A.; Huber, R. Accurate bond and angle parameters for X-ray protein structure refinement. Acta Crystallogr. Sect. A Found. Crystallogr. 1991, 47, 392–400. [Google Scholar] [CrossRef]
  77. Lovell, S.C.; Word, J.M.; Richardson, J.S.; Richardson, D.C. The penultimate rotamer library. Proteins 2000, 40, 389–408. [Google Scholar] [CrossRef]
  78. Emsley, P.; Lohkamp, B.; Scott, W.G.; Cowtan, K. Features and development of Coot. Acta Crystallogr. Sect. D Biol. Crystallogr. 2010, 66, 486–501. [Google Scholar] [CrossRef]
  79. Zhou, A.Q.; O’Hern, C.S.; Regan, L.J. Predicting the side-chain dihedral angle distributions of nonpolar, aromatic, and polar amino acids using hard sphere models. Proteins Struct. Funct. Bioinform. 2014, 82, 2574–2584. [Google Scholar] [CrossRef]
  80. Hooft, R.W.W.; Vriend, G.; Sander, C.; Abola, E.E. Errors in protein structures. Nature 1996, 381, 272. [Google Scholar] [CrossRef]
  81. Steinbach, P.J.; Brooks, B.R. New spherical-cutoff methods for long-range forces in macromolecular simulation. J. Comput. Chem. 1994, 15, 667–683. [Google Scholar] [CrossRef]
  82. Da Silveira, C.H.; Pires, D.E.H.; Minardi, R.C.; Ribeiro, C.; Veloso, C.J.M.; Lopes, J.C.D.; Meira, W.; Neshich, G.; Ramos, C.H.I.; Habesch, R.; et al. Protein cutoff scanning: A comparative analysis of cutoff dependent and cutoff free methods for prospecting contacts in proteins. Proteins 2009, 74, 727–743. [Google Scholar] [CrossRef]
  83. Reif, M.M.; Krautler, V.; Kastenholz, M.A.; Daura, X.; Hunenberger, P.H. Molecular dynamics simulations of a reversibly folding beta-heptapeptide in methanol: Influence of the treatment of long-range electrostatic interactions. J. Phys. Chem. B 2009, 113, 3112–3128. [Google Scholar] [CrossRef]
  84. Piana, S.; Lindorff-Larsen, K.; Dirks, R.M.; Salmon, J.K.; Dror, R.O.; Shaw, D.E. Evaluating the Effects of Cutoffs and Treatment of Long-range Electrostatics in Protein Folding Simulations. PLoS ONE 2012, 7. [Google Scholar] [CrossRef] [PubMed]
  85. Strzalka, R.; Buganski, I.; Smietanska, J.; Wolny, J. Structural Disorder in Quasicrystals. Arch. Metall. Mater. 2020, 65, 291–294. [Google Scholar]
  86. Wolny, J.A.; Buganski, I.; Kuczera, P.; Strzałka, R. Pushing the limits of crystallography. J. Appl. Crystallogr. 2016, 49, 2106–2115. [Google Scholar] [CrossRef]
  87. Buganski, I.; Strzalka, R.; Wolny, J. Phason-flips refinement of and multiple-scattering correction for the d-AlCuRh quasicrystal. Acta Cryst. 2019, A75, 352–361. [Google Scholar] [CrossRef] [PubMed]
  88. Mantsyzov, A.B.; Savelyev, O.Y.; Ivantcova, P.M.; Bräse, S.; Kudryavtsev, K.V.; Polshakov, V.I. Theoretical and NMR Conformational Studies of β-Proline Oligopeptides with Alternating Chirality of Pyrrolidine Units. Front. Chem. 2018, 6. [Google Scholar] [CrossRef] [PubMed]
  89. Caballero, D.; Smith, W.W.; O’Hern, C.S.; Regan, L.J. Equilibrium transitions between side-chain conformations in leucine and isoleucine. Proteins Struct. Funct. Bioinform. 2015, 83, 1488–1499. [Google Scholar] [CrossRef] [PubMed]
  90. Shapovalov, M.V.; Dunbrack, R.L. A Smoothed Backbone-Dependent Rotamer Library for Proteins Derived from Adaptive Kernel Density Estimates and Regressions. Structure 2011, 19, 844–858. [Google Scholar] [CrossRef]
  91. Virrueta, A.; O’Hern, C.S.; Regan, L.J. Understanding the physical basis for the side-chain conformational preferences of methionine. Proteins Struct. Funct. Bioinform. 2016, 84, 900–911. [Google Scholar] [CrossRef]
Figure 1. Average all-atom root-mean-square deviation (RMSD) calculated over time for the Hyp-1 protein structure during 1 ns of NPT equilibration. The values shown were averaged over 64 monomers in the crystal.
Crystals 11 00043 g001
Figure 2. Fcalc/Fmd and Fmd/Fexp plots for the Hyp-1 protein structure. The maximal permissible relative error between reflections with identical indices was established at a level of 20%. The red dashed line at 45° should serve as a guide to the eye and tool to visualize trends in changes of reflection intensity.
Crystals 11 00043 g002
Figure 3. Plots of Hyp-1 ADPs: calculated directly from atom-positional RMSF (red line), experimental from the Protein Data Bank (PDB) entry 3IE5 (blue line), from model re-refined with isotropic thermal motions (green line) and model re-refined using translation–libration–screw model (TLS) groups (purple line). In individual panels ADPs for all CA (Cα) and CG (Cγ) atoms separated on chains A (a,c) and B (b,d) were shown. Differences in ADPs’ values for both protein chains were calculated between corresponding Cα (e) and Cγ (f) atoms.
Crystals 11 00043 g003
Figure 4. Side-chain torsions probability density distributions P(χ1) (solid blue lines) for Pro16, Pro64, Pro122, and Pro124 (left column) and Ser112, Thr55, and Thr127 (right column). Values of χ1 angles observed in the experimental Hyp-1 model were marked as dashed red lines.
Crystals 11 00043 g004
Figure 5. Color map of side-chain torsions probability density distributions P(χ1, χ2) for Leu86, Leu151 (a,b) and aromatic residues Phe72, Phe158 (c,d). The probability values within each of the 5° × 5° bins increase from deep blue to yellow according to the color map.
Crystals 11 00043 g005
Figure 6. Color map of the side-chain torsions probability density distributions P(χ1, χ2) for aromatic residues His63, His70 (a,b), and Asp94, Asn95, and Asn154 (ce). The probability values within each of the 5° × 5° bins increase from deep blue to yellow according to the color map.
Crystals 11 00043 g006
Figure 7. Stacked bar graph of side-chain χ1, χ2, χ3 torsions probability distributions for Glu142, Glu149 (a,b), and Gln35, Gln146 (c,d). The probability values within 5° × 5° bins for separate torsion angles were marked as blue, orange, and yellow, respectively. Appropriate values of χ1, χ2, χ3 angles from the experimental Hyp-1 model were presented sequentially as light blue, orange, and light green dashed lines.
Crystals 11 00043 g007
Figure 8. Stacked bar graph of side-chain χ1, χ2, χ3 torsions probability distributions for Met1 (a), and Met68 (b). The probability values within 5° × 5° bins for separate torsion angles were marked as blue, orange, and yellow, respectively. Appropriate values of χ1, χ2, χ3 angles from the experimental Hyp-1 model were presented sequentially as light blue, orange, and light green dashed lines.
Crystals 11 00043 g008
Figure 9. Stacked bar graph of side-chain χ1, χ2, χ3, χ4 torsions probability distributions for Lys33 (a), Lys40 (b), Arg27 (c) and Arg93 (d). Each probability distribution of χi was normalized so that   P ( χ i ) d x i = 1 . The probability values within 5° × 5° bins for separate torsion angles were marked as blue, orange, yellow, and purple, respectively. Appropriate values of χ1, χ2, χ3 angles from the experimental Hyp-1 model were presented sequentially as light blue, orange, and light green dashed lines. If one χi value was common for multiple torsion angles in the side chain, we marked them as a single line with a proper index to prevent line overlap and confusion during figure interpretation.
Crystals 11 00043 g009
Table 1. Simulation steps with their IDs and the number of steps/time step.
Simulation StepIDNumber of Steps/Time Step (fs)
Energy minimizationEM100,000/1
NVT equilibrationNVT100,000/1
NPT equilibrationNPT1,000,000/1
Simulation of rotamer 1ROT1100/200
Simulation of rotamer 2ROT210/20
Simulation of rotamer 3ROT31/2
Cooling downCD1,200,000/1
RMSF gatheringRMSF1,000,000/1
Table 2. Definitions of the torsion angles used for the calculation of χi dihedral angles and the determination of side-chain conformation.
Initial Torsion AngleIntermediate Torsion AnglesTerminal Torsion Angle
ArgN-CA-CB-CGCA-CB-CG-CD
CB-CG-CD-NE
CG-CD-NE-CZ
AsnN-CA-CB-CG CA-CB-CG-OD1
AspN-CA-CB-CG CA-CB-CG-OD1
CysN-CA-CB-SG
GlnN-CA-CB-CGCA-CB-CG-CDCB-CG-CD-OE1
GluN-CA-CB-CGCA-CB-CG-CDCB-CG-CD-OE1
HisN-CA-CB-CG CA-CB-CG-ND1
LeuN-CA-CB-CG CA-CB-CG-CD1
LysN-CA-CB-CGCA-CB-CG-CD
CB-CG-CD-CE
CG-CD-CE-NZ
MetN-CA-CB-CGCA-CB-CG-SDCB-CG-SD-CE
PheN-CA-CB-CGCA-CB-CG-CD1
ProN-CA-CB-CG
SerN-CA-CB-OG
ThrN-CA-CB-OG1
TyrN-CA-CB-CGCA-CB-CG-CD1
ValN-CA-CB-CG1
Publisher’s Note: MDPI stays neutral with regard to jurisdictional claims in published maps and institutional affiliations.