Article

Prediction of Properties of FRP-Confined Concrete Cylinders Based on Artificial Neural Networks

1
Department of Civil Engineering, University of Engineering and Technology, Taxila 47080, Pakistan
2
Department of Civil Engineering and Energy Technology, OsloMet—Oslo Metropolitan University, 0166 Oslo, Norway
*
Author to whom correspondence should be addressed.
Crystals 2020, 10(9), 811; https://doi.org/10.3390/cryst10090811
Submission received: 20 July 2020 / Revised: 6 September 2020 / Accepted: 7 September 2020 / Published: 14 September 2020
(This article belongs to the Special Issue Numerical Study of Concrete)

Abstract

:
Recently, the use of fiber-reinforced polymers (FRP)-confinement has increased due to its various favorable effects on concrete structures, such as an increase in strength and ductility. Therefore, researchers have been attracted to exploring the behavior and efficiency of FRP-confinement for concrete structural elements further. The current study investigates improved strength and strain models for FRP confined concrete cylindrical elements. Two new physical methods are proposed for use on a large preliminary evaluated database of 708 specimens for strength and 572 specimens for strain from previous experiments. The first approach is employing artificial neural networks (ANNs), and the second is using the general regression analysis technique for both axial strength and strain of FRP-confined concrete. The accuracy of the newly proposed strain models is quite satisfactory in comparison with previous experimental results. Moreover, the predictions of the proposed ANN models are better than the predictions of previously proposed models based on various statistical indices, such as the correlation coefficient (R) and mean square error (MSE), and can be used to assess the members at the ultimate limit state.

Graphical Abstract

1. Introduction

The lateral confinement due to fiber-reinforced polymers (FRPs) increases the efficiency of concrete compression members by enhancing their axial load carrying capacity and ductility. The increase in axial strength and strain of reinforced concrete (RC) columns is the main reason for using FRP confinement techniques. Over the last decade, the use of FRP composites for the rehabilitation, retrofitting, strengthening, and ductility enhancement of RC compression members has been one of the most popular techniques due to its advantages [1]. The advantages of the FRP composites include not only the corrosion resistance and low weight, but also provide a high strength to weight ratio. The critical parameters affecting FRP are the thickness of FRP (nt), angle of orientation of FRP wraps, the elastic modulus of FRP (Ef), total number of FRP sheets, and the unconfined strength of concrete material (fco) [2]. FRPs offer many advantages, such as easy handling, low disturbance of concrete members, easy installation, and little time for application [3]. Due to these advantages, FRPs are preferred over the use of conventional steel jacketing techniques [4].
The technique of strengthening RC structures using FRPs is very vital for increasing the capacity of RC structural members at the ultimate limit state (ULS) [5,6]. Poor and low strength concrete or concrete structures damaged due to lateral seismic loading usually lose strength, and they need retrofitting and rehabilitation to regain their strength at ULS [7]. The use of fiber and plastic makes the FRP high corrosion resistance and suitable for use in undersea structures [8]. The applications of FPRs are not limited to RC building members but are also extended to RC bridge piers, girders, and slabs to enhance their strength at ULS [9,10,11,12,13,14,15,16].
Many researchers have done work for estimating the axial strength and strain of externally confined concrete members [17,18,19,20,21,22,23,24] based on empirical techniques [25,26,27,28,29,30,31,32,33,34,35,36,37,38,39,40,41], i.e., Karbhari et al., Miyauchi et al. [42,43], Lam and Teng [44], and Mander et al. [45], as described in Table 1. These proposed empirical equations predict the strength and strain capacity of confined concrete members with low accuracy [46]. The use of artificial neural networks (ANNs) for modeling various complex problems in structural engineering is increasing [47,48,49,50,51,52]. One can determine and capture the interactions between various variables of a complex system by using ANNs, despite the unknown and usually unpredictable nature of these interactions. ANN models can predict the compressive strength of confined plastic concrete accurately [53,54,55,56]. Khademi et al. [57] and Reddy [58] used ANN techniques for the prediction of the axial strength of confined concrete. Moreover, various researchers proposed analytical models for the prediction of the ultimate conditions of confined concrete members using different techniques such as ANN, regression analysis, soft computing, and genetic programming [25,26,27,28,29,30,31,32,33,34,35]. An attempt has been made [59,60] to determine the confinement effects of the FRP on RC members at the ULS.
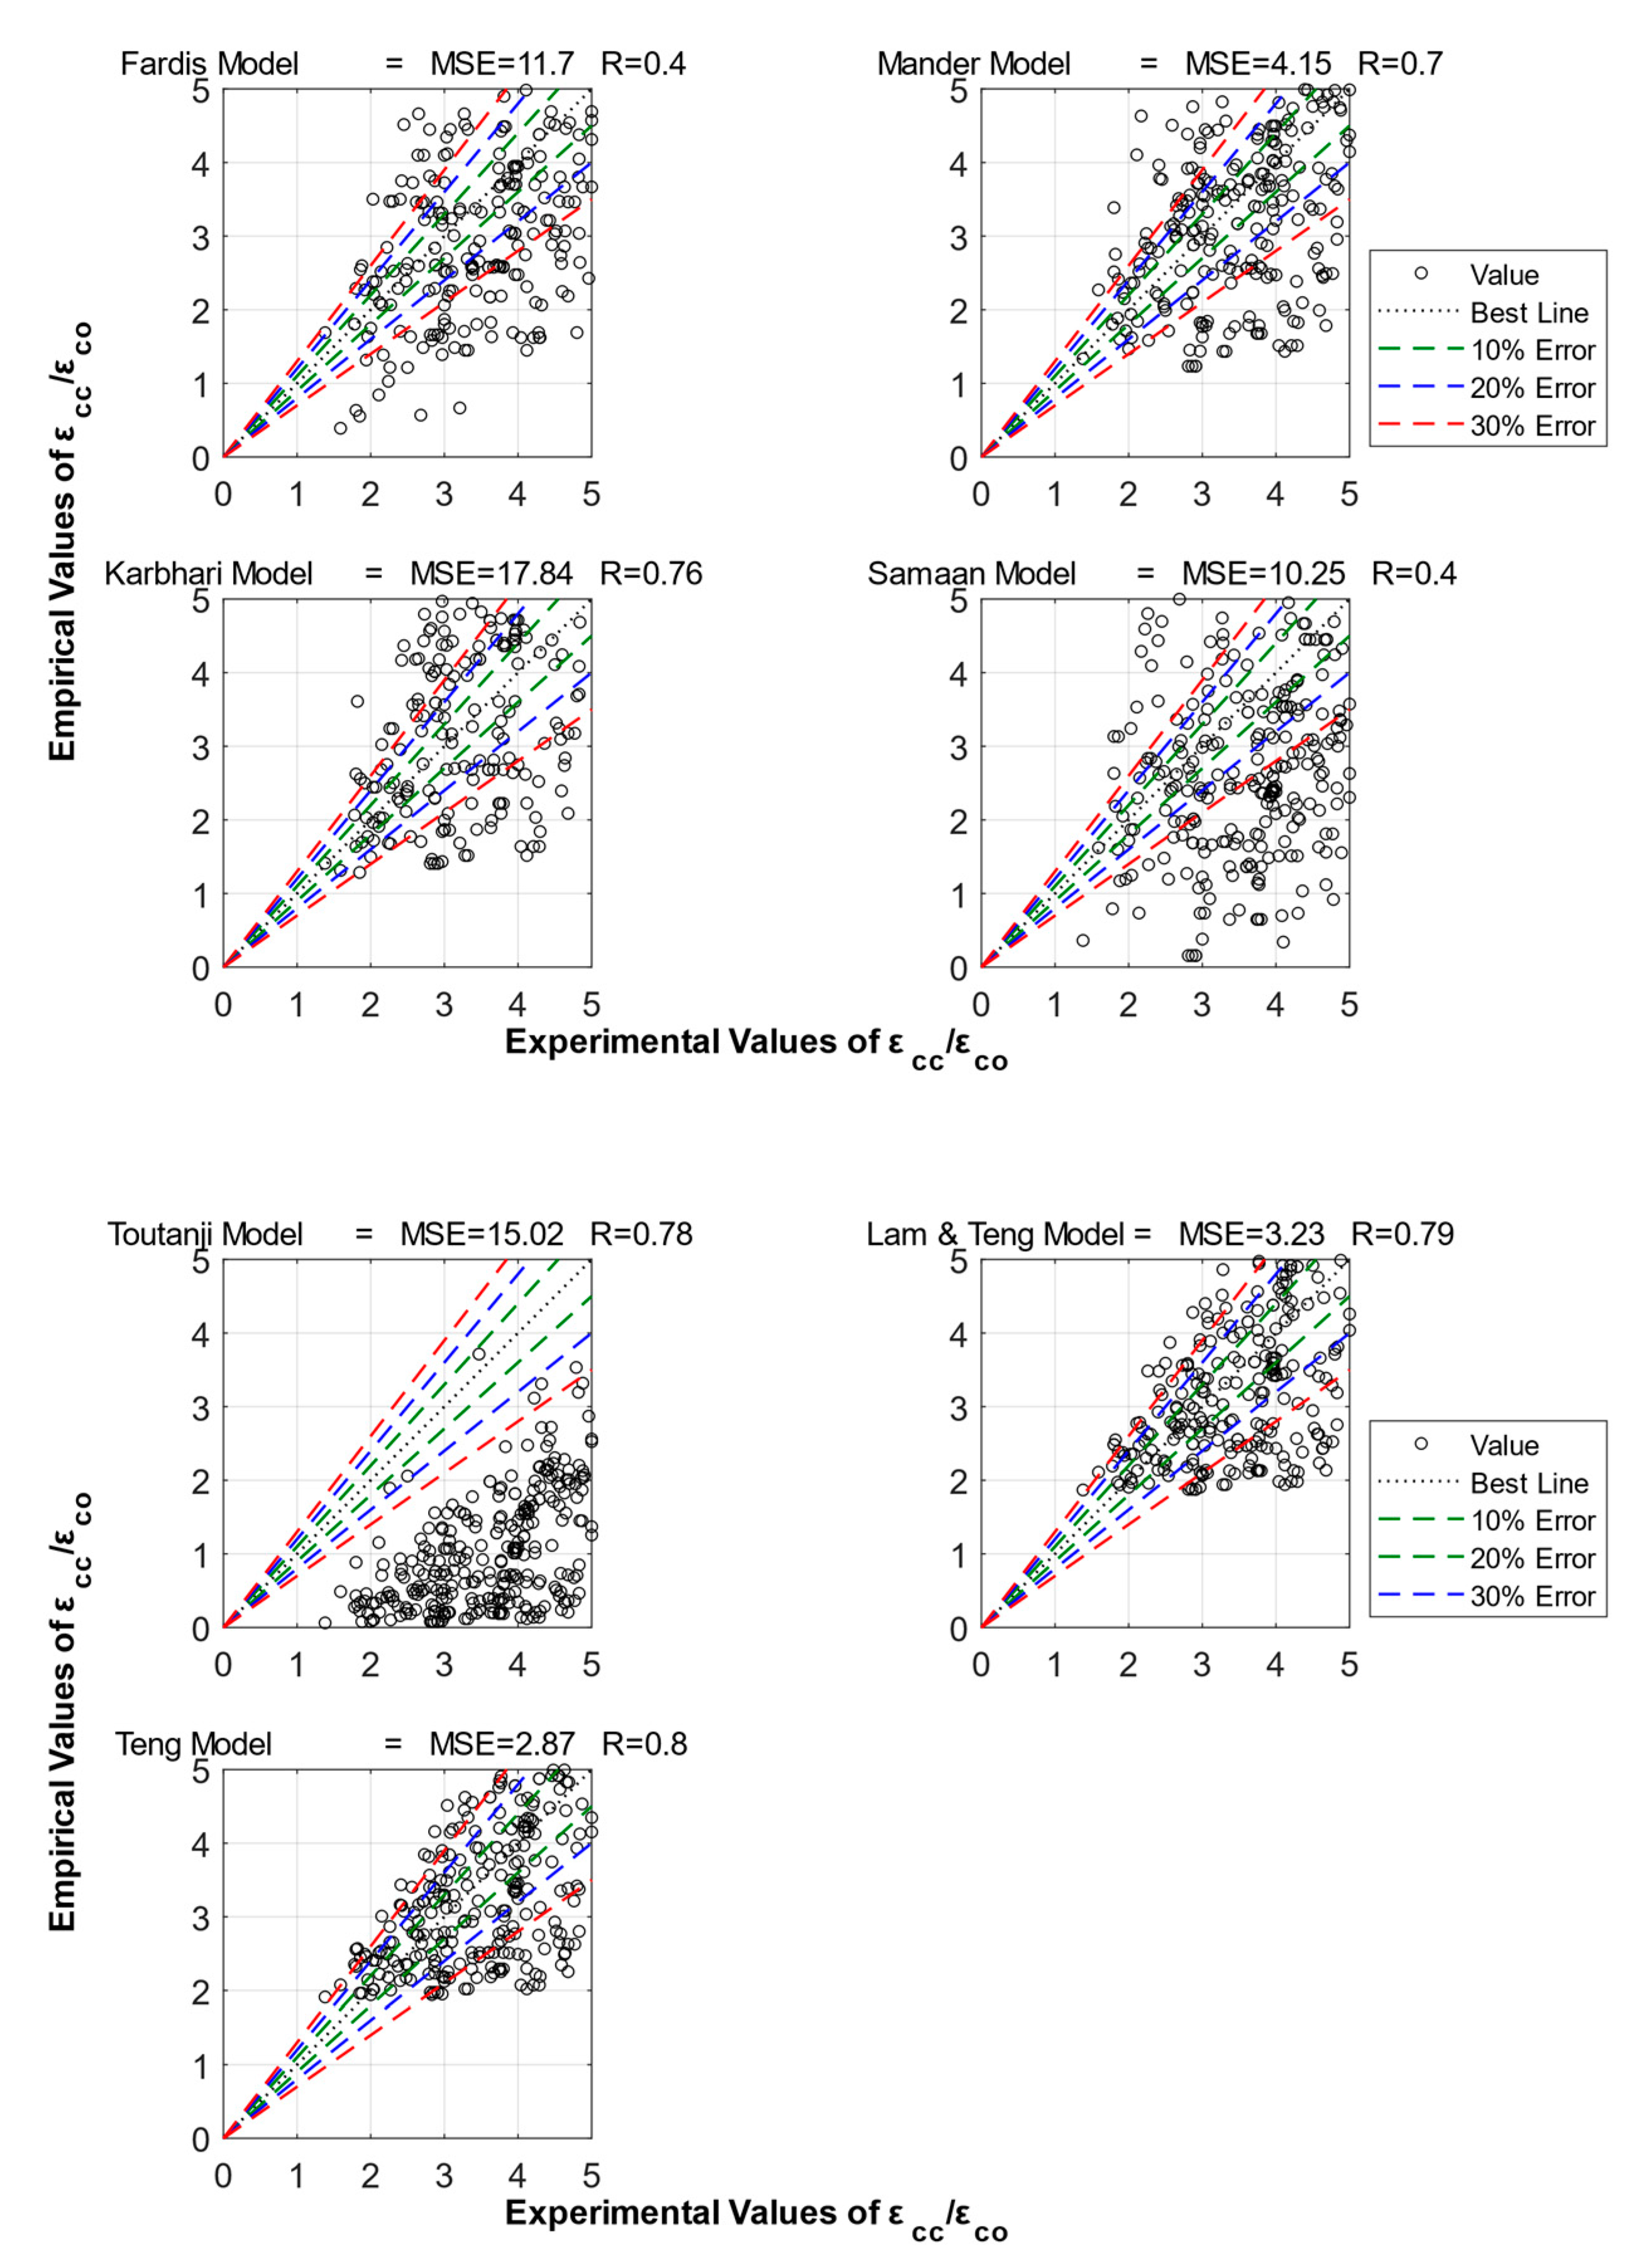
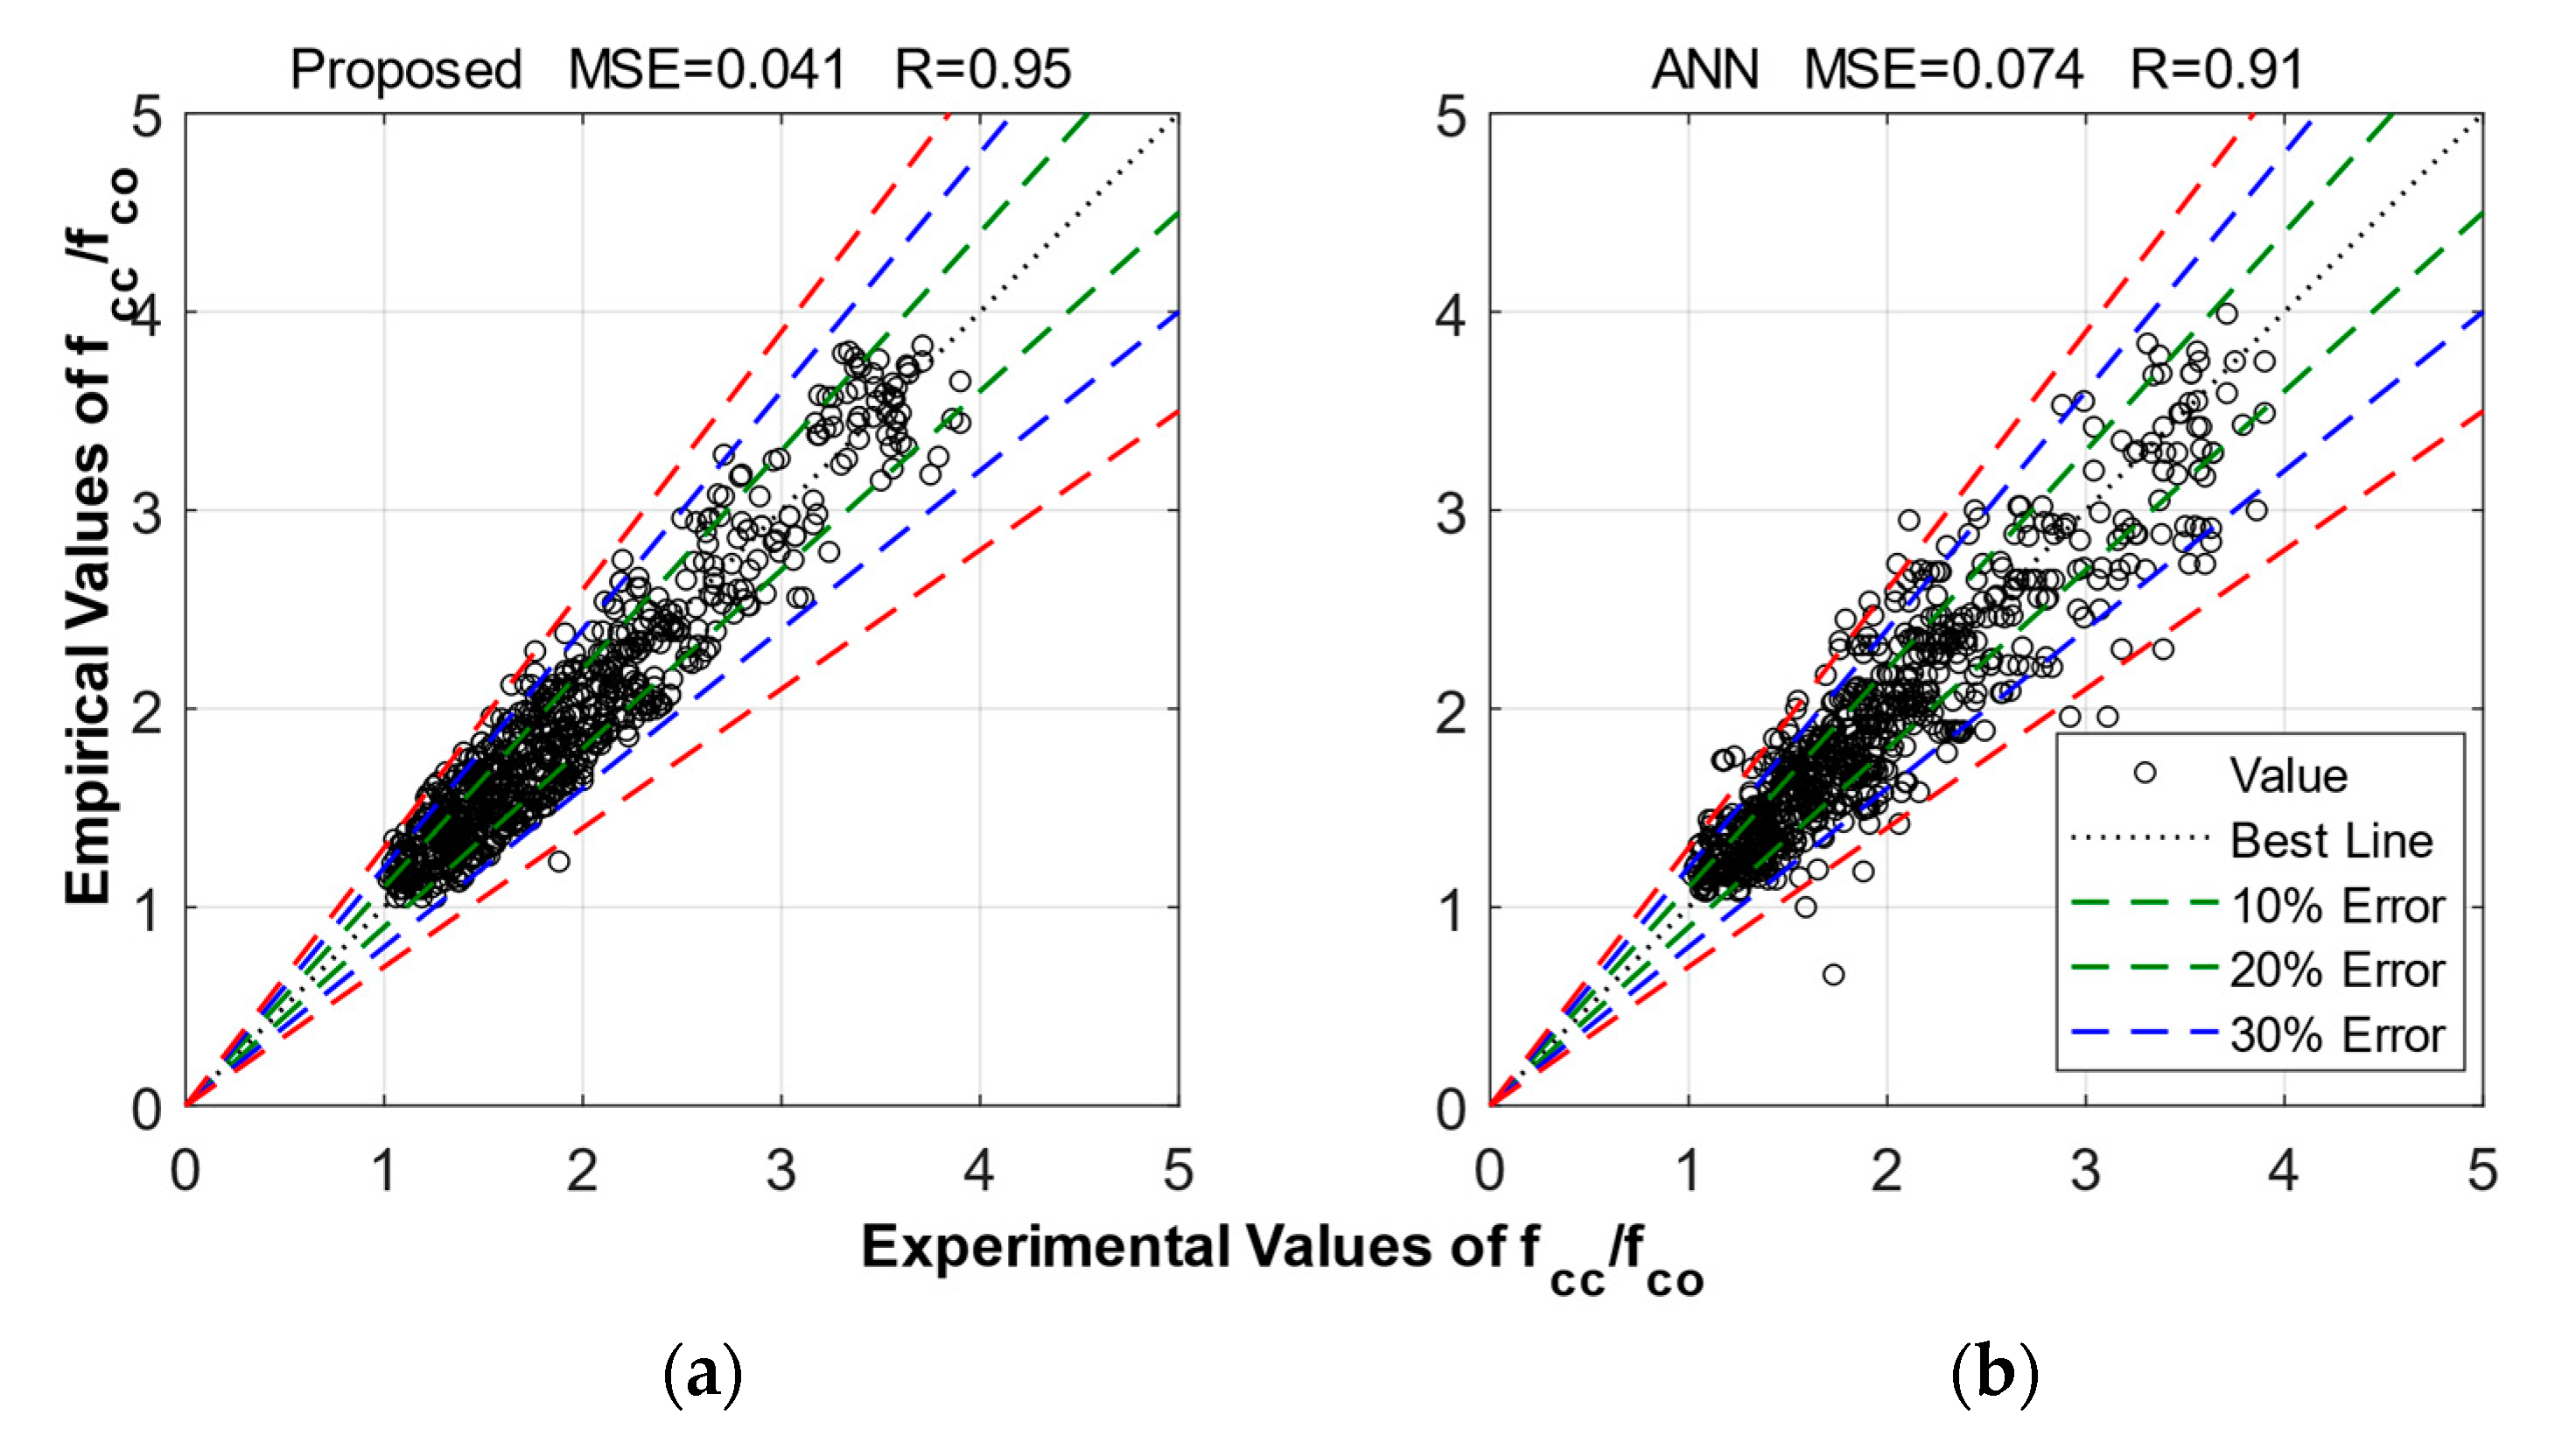
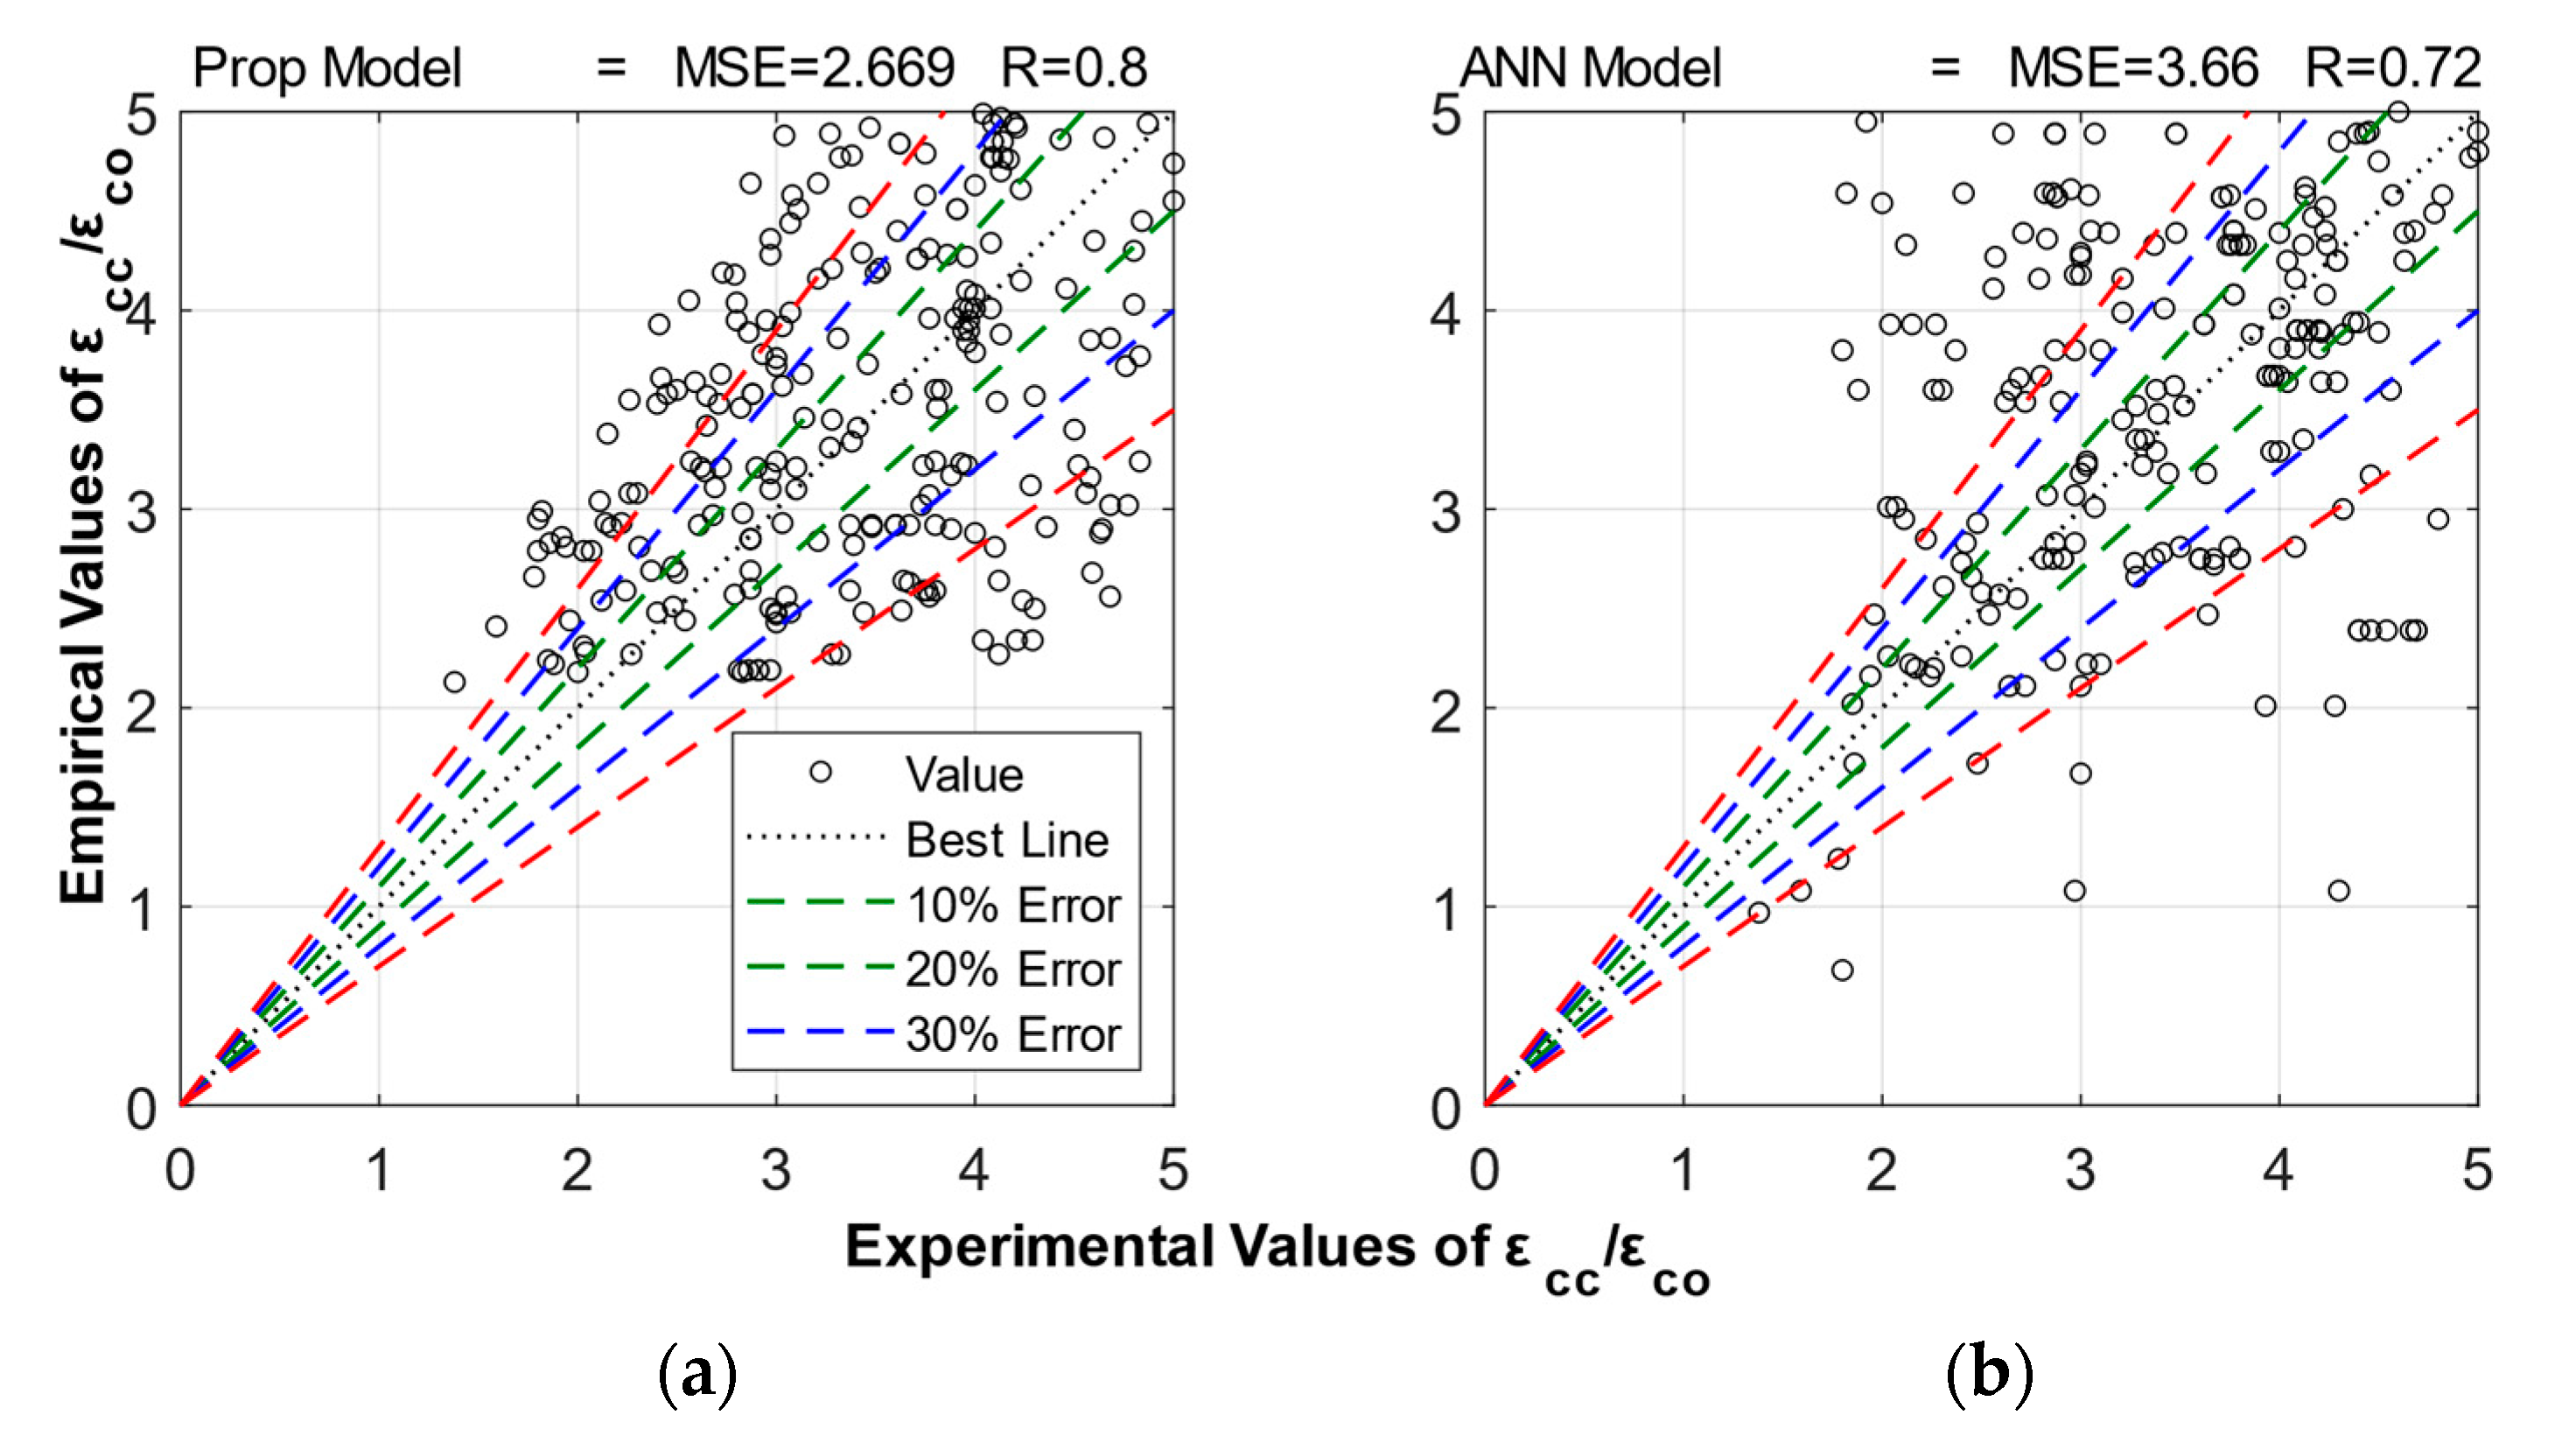
The present work aims to propose a prediction model for the axial strength and axial strain models for FRP-confined concrete cylinders. Similar approaches have already been proposed in the past, mainly for strength models [18], using only a limited database. In the present work, previous experimental results of concrete cylinders externally confined with FRPs, in particular 708 specimens for strength and 512 for strain, were collected and evaluated based on some statistical indices, such as the correlation coefficient (R) and mean square error (MSE). This was done using the previously proposed models for the ultimate conditions of FRP-confined concrete members. In addition, ANN and empirical models are proposed for the prediction of strength and strain of concrete members with FRPs. The evaluation of previous and currently proposed models for the ultimate conditions of FRP-confined concrete members show that the proposed models provide superior performance. The significance of the present study is that the proposed models can also accurately capture the axial strain behavior of confined concrete, which is useful for the analysis and design of confined concrete members.

2. Mechanics of FRP Confinement

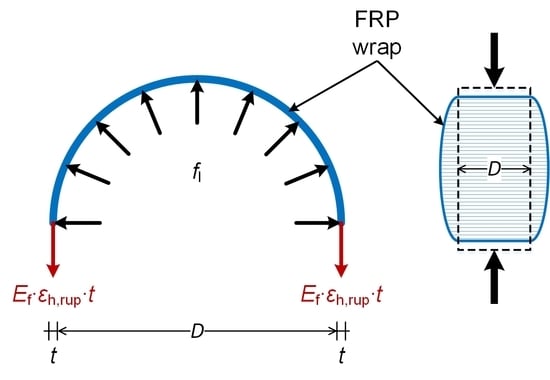
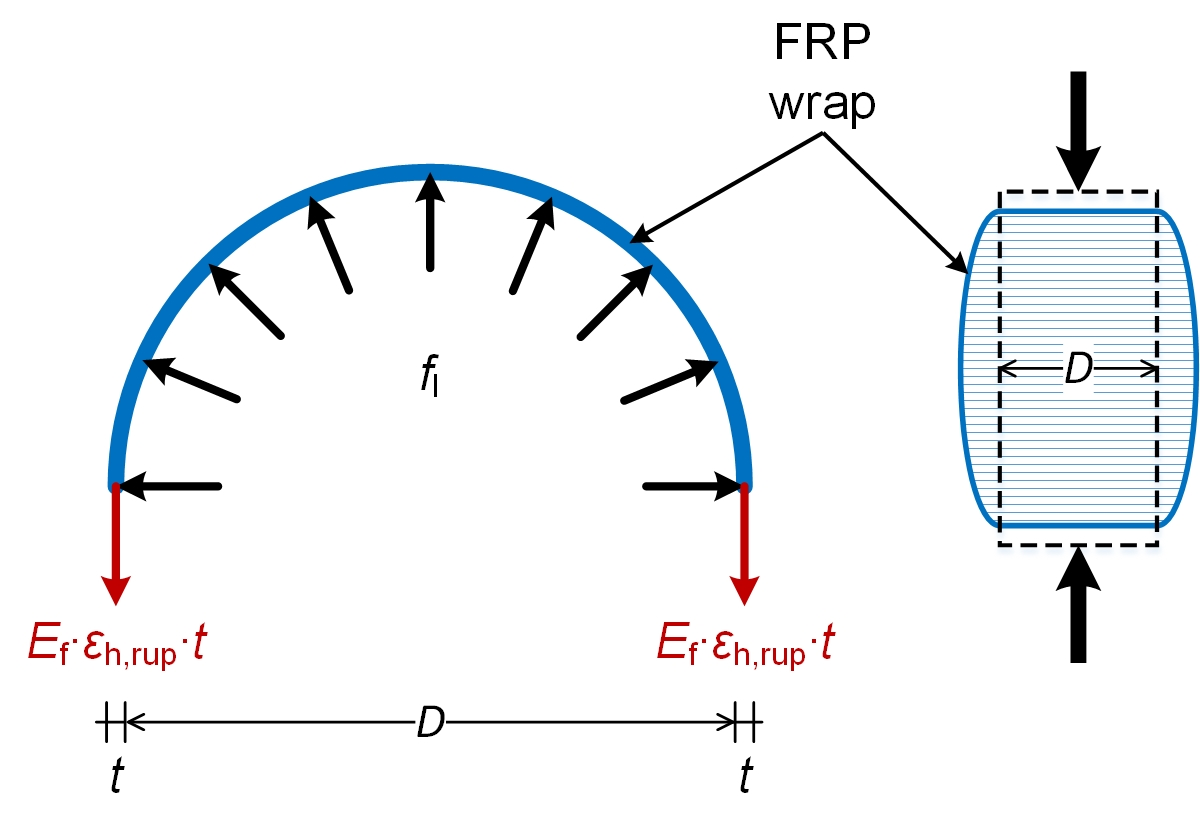
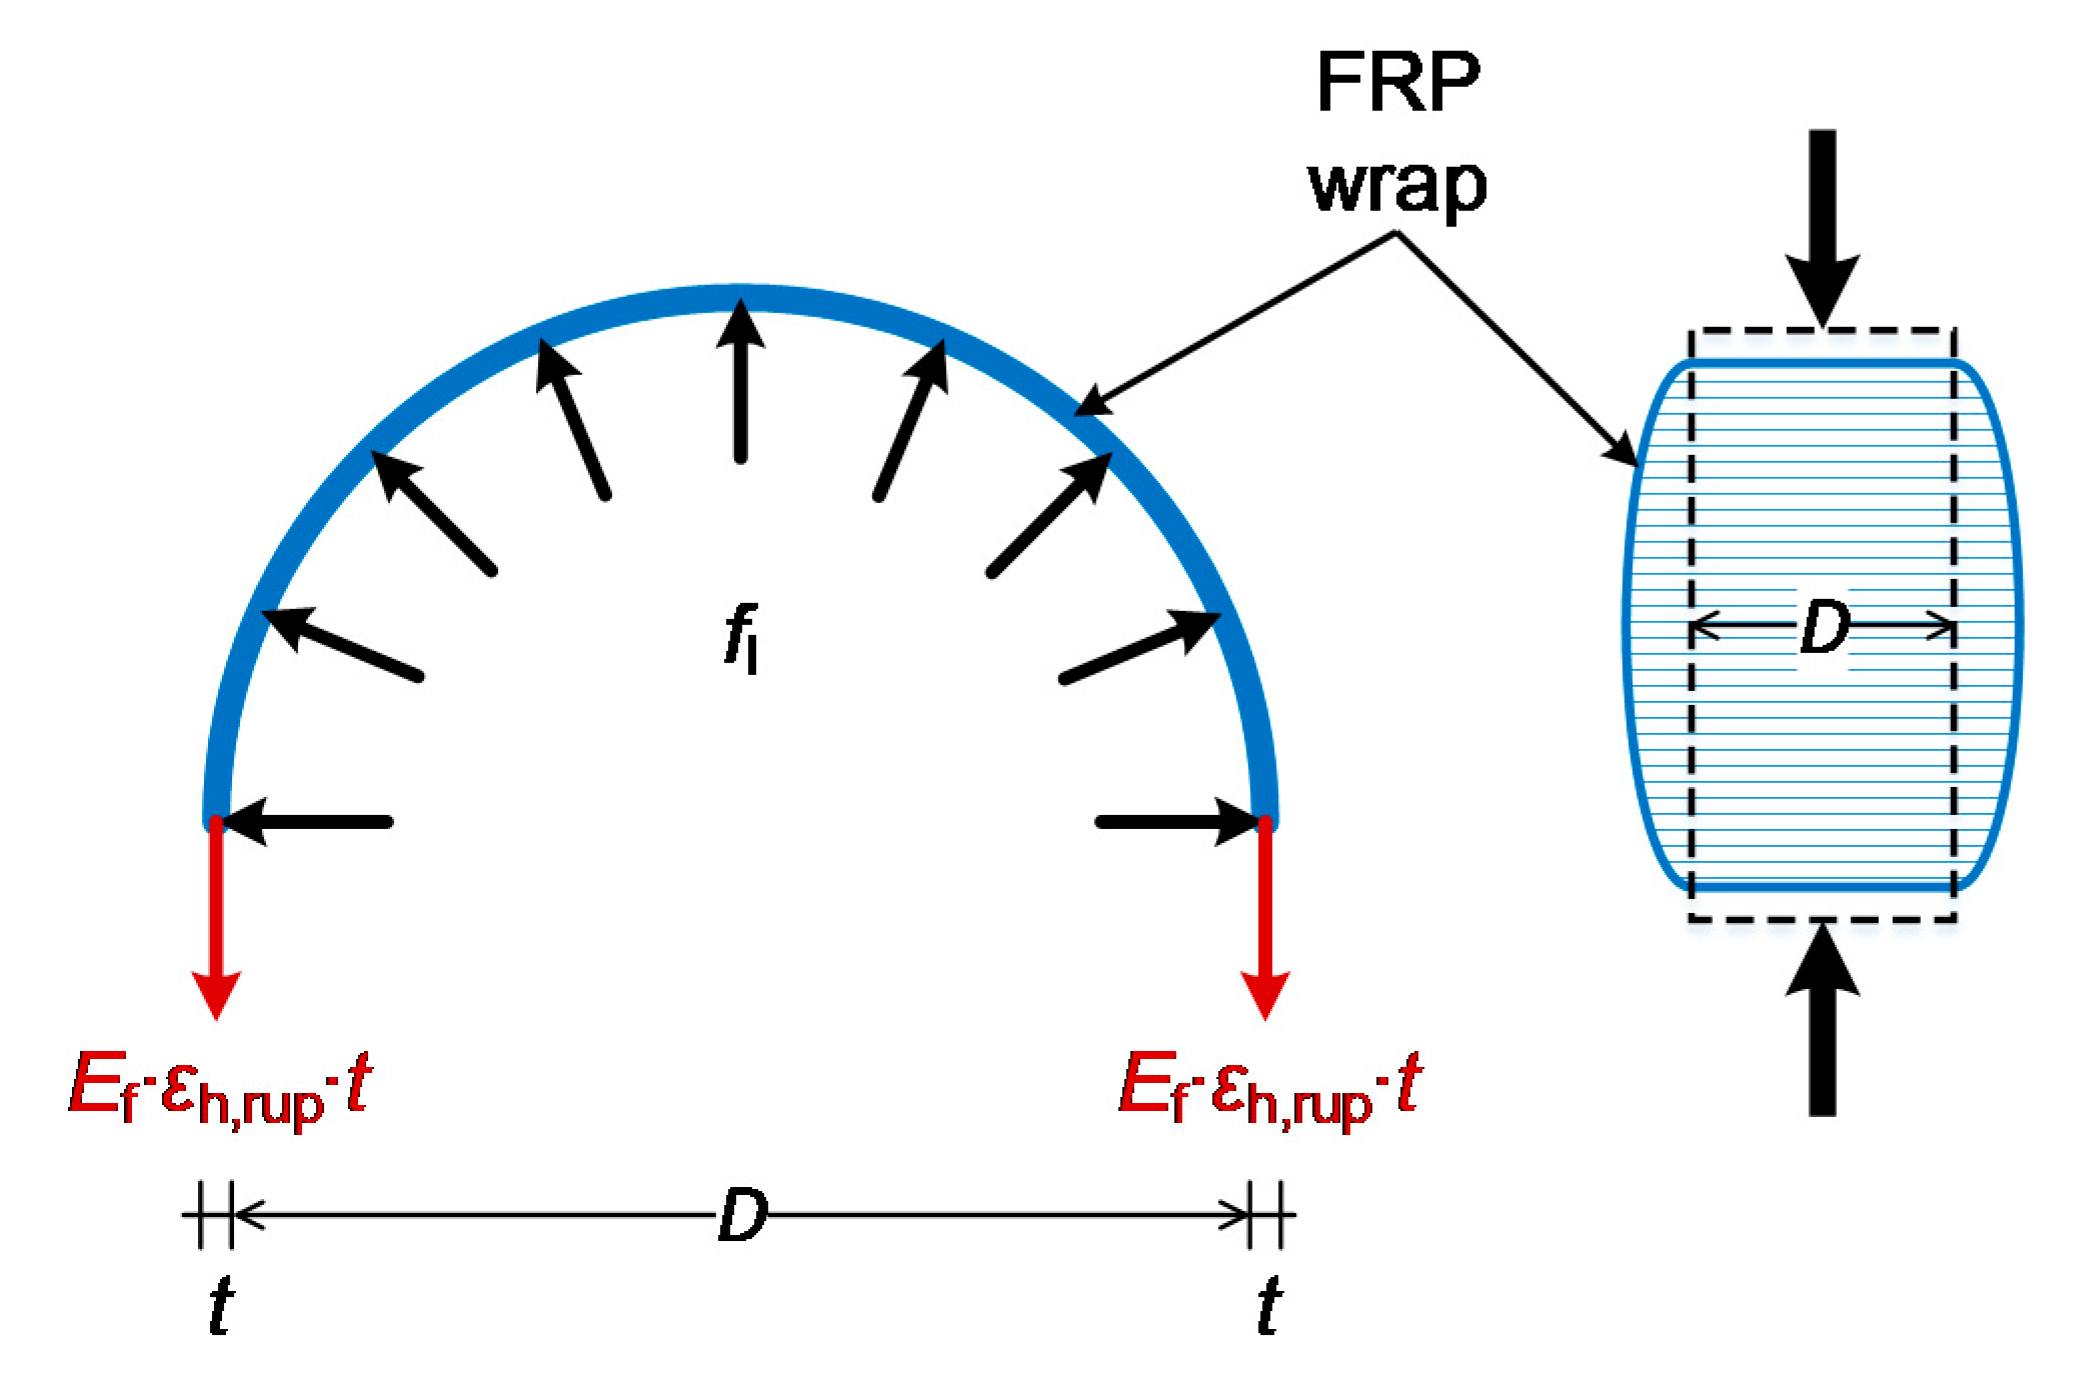
It was observed that the models for the ultimate conditions of FRP-confinement contain some common variables, such as confinement stiffness ratio (ρk), strain ratio (ρε), hoop rupture strain of fibers (εh,rup), and maximum confinement stress (fl). The relations for ρk and ρε have been presented by Teng et al. [61], as described in Equation (1) and Equation (2).
ρ ε = ε h , r u p ε c o
ρ k = 2 E f t ( f c o ε c o ) D
where εco is the axial strain of unconfined concrete, t is the thickness of FRP wraps, fco is the unconfined strength of concrete, and Ef is the tensile modulus of confinement sheets in the transverse direction of the specimen. Figure 1 represents the confinement stresses due to FRP-wraps with a hoop diameter D.
The relationship between confinement stress and some critical variables is illustrated in Figure 1 and Equation (3). The hoop rupture strain can be represented by Equation (4) [62].
f l = ρ ε ρ κ f c o = 2 E f ε h , r u p t D
ε h , r u p = ε f f c o 0.125
where εf is the maximum tensile strain of fibers, and fco is expressed as in MPa units. The initial strength and strain model for the FRP confinement was given by Fardis and Khalili [63] based on the concept that the maximum strain of FRP confined concrete is increased with the enhancement of the circumferential stiffness. Mander et al. [45] proposed a model for the predictions of the axial compressive strain of FRP that was initially implemented by ACI 440-2R-02 [64]. Samaan et al. [59] proved this concept to be wrong by developing a strain model with the concept that the actual hoop rupture strain is less than the maximum tensile strength of FRPs at the failure stage. Karbhari and Gao [42] proposed a model for strain by assuming that the FRP wraps reach their ultimate tensile strength during the application of load, which is not possible for the actual conditions. By considering the concept of the actual rupture strain of FRPs, Toutanji [65] suggested a new strain model. Lam and Teng [44] proposed a new strain model by considering the actual failure strain of FRPs. Later on, Teng et al. [66] refined this model by performing tests on 18 FRP confined concrete members.
Table 1. Previously proposed strength and strain models of fiber-reinforced polymers (FRP) confined concrete specimens.
ModelRelationship for StrengthRelationship for Strain
Karbhari and Gao [42] f c c f c o = 1 + 2.1 ( f l f c o ) 0.87 ε c c = ε c o + 0.01 f l f c o
Saafi et al. [67] f c c f c o = 1 + 2.2 ( f l f c o ) 0.84 -
Matthys et al. [60] f c c f c o = 1 + 2.3 ( f l f c o ) 0.85 -
Fardis and Khalili [63] f c c f c o = 1 + 3.7 ( f l f c o ) 0.86 ε c c = 0.002 + 0.001 E f t D f c o
Richart et al. [68] f c c f c o = 1 + 4.1 f l f c o -
Newman and Newman [69] f c c f c o = 1 + 3.7 ( f l f c o ) 2 -
Mander et al. [45] f c c f c o = 2.254 1 + 7.94 f l f c o 2 f l f c o 1.254 ε c c ε c o = 1 + 5 ( f c c f c o 1 )
Lam and Teng [44] f c c f c o = 1 + 3.3 f l f c o ε c c ε c o = 1.75 + 12 ρ k ρ ε 1.45
Toutanji [65] f c c f c o = 1 + 3.3 f l f c o ε c c ε c o = 1 + ( 310.57 ε h , r u p + 1.90 ) ( f c c f c o 1 )
Samaan et al. [59] f c c = f c o + 6.0 f l 0.70 ε c c = f c c f o E 2
where   f o = 0.872 f c o + 0.371 f l + 6.258 and   E 2 = 245.61 f c o 0.2 + 1.3456 E f t D
Teng et al. [61] f c c f c o = 1 + 3.5 ( ρ K 0.01 ) ρ ε ε c c ε c o = 1.75 + 6.5 ρ K 0.8 ρ ε 1.45
Miyauchi et al. [70] f c c f c o = 1 + 3.485 f l f c o -

Constructed Database for Modeling

A large database was prepared in a previous experimental work, which contains 708 specimens for strength. Most of the works also contain data for strain, but not all of them. Therefore, the specimens for strain are fewer (572), and these strain specimens are essentially a subset of the full set of specimens used for stress. All essential parameters associated with the strength and strain enhancement of concrete cylinders confined with FRPs are included in the databases. Table 2 and Table 3 provide the statistical information about the variation of certain parameters associated with the specimens considered for the strength and the strain model data, respectively. The field Range means the difference between the maximum and the minimum value for each quantity (Range = Max–Min). StDev denotes the standard variation, while CV is the coefficient of variation, i.e., the standard deviation divided by the mean value.

3. Artificial Neural Networks (ANN)

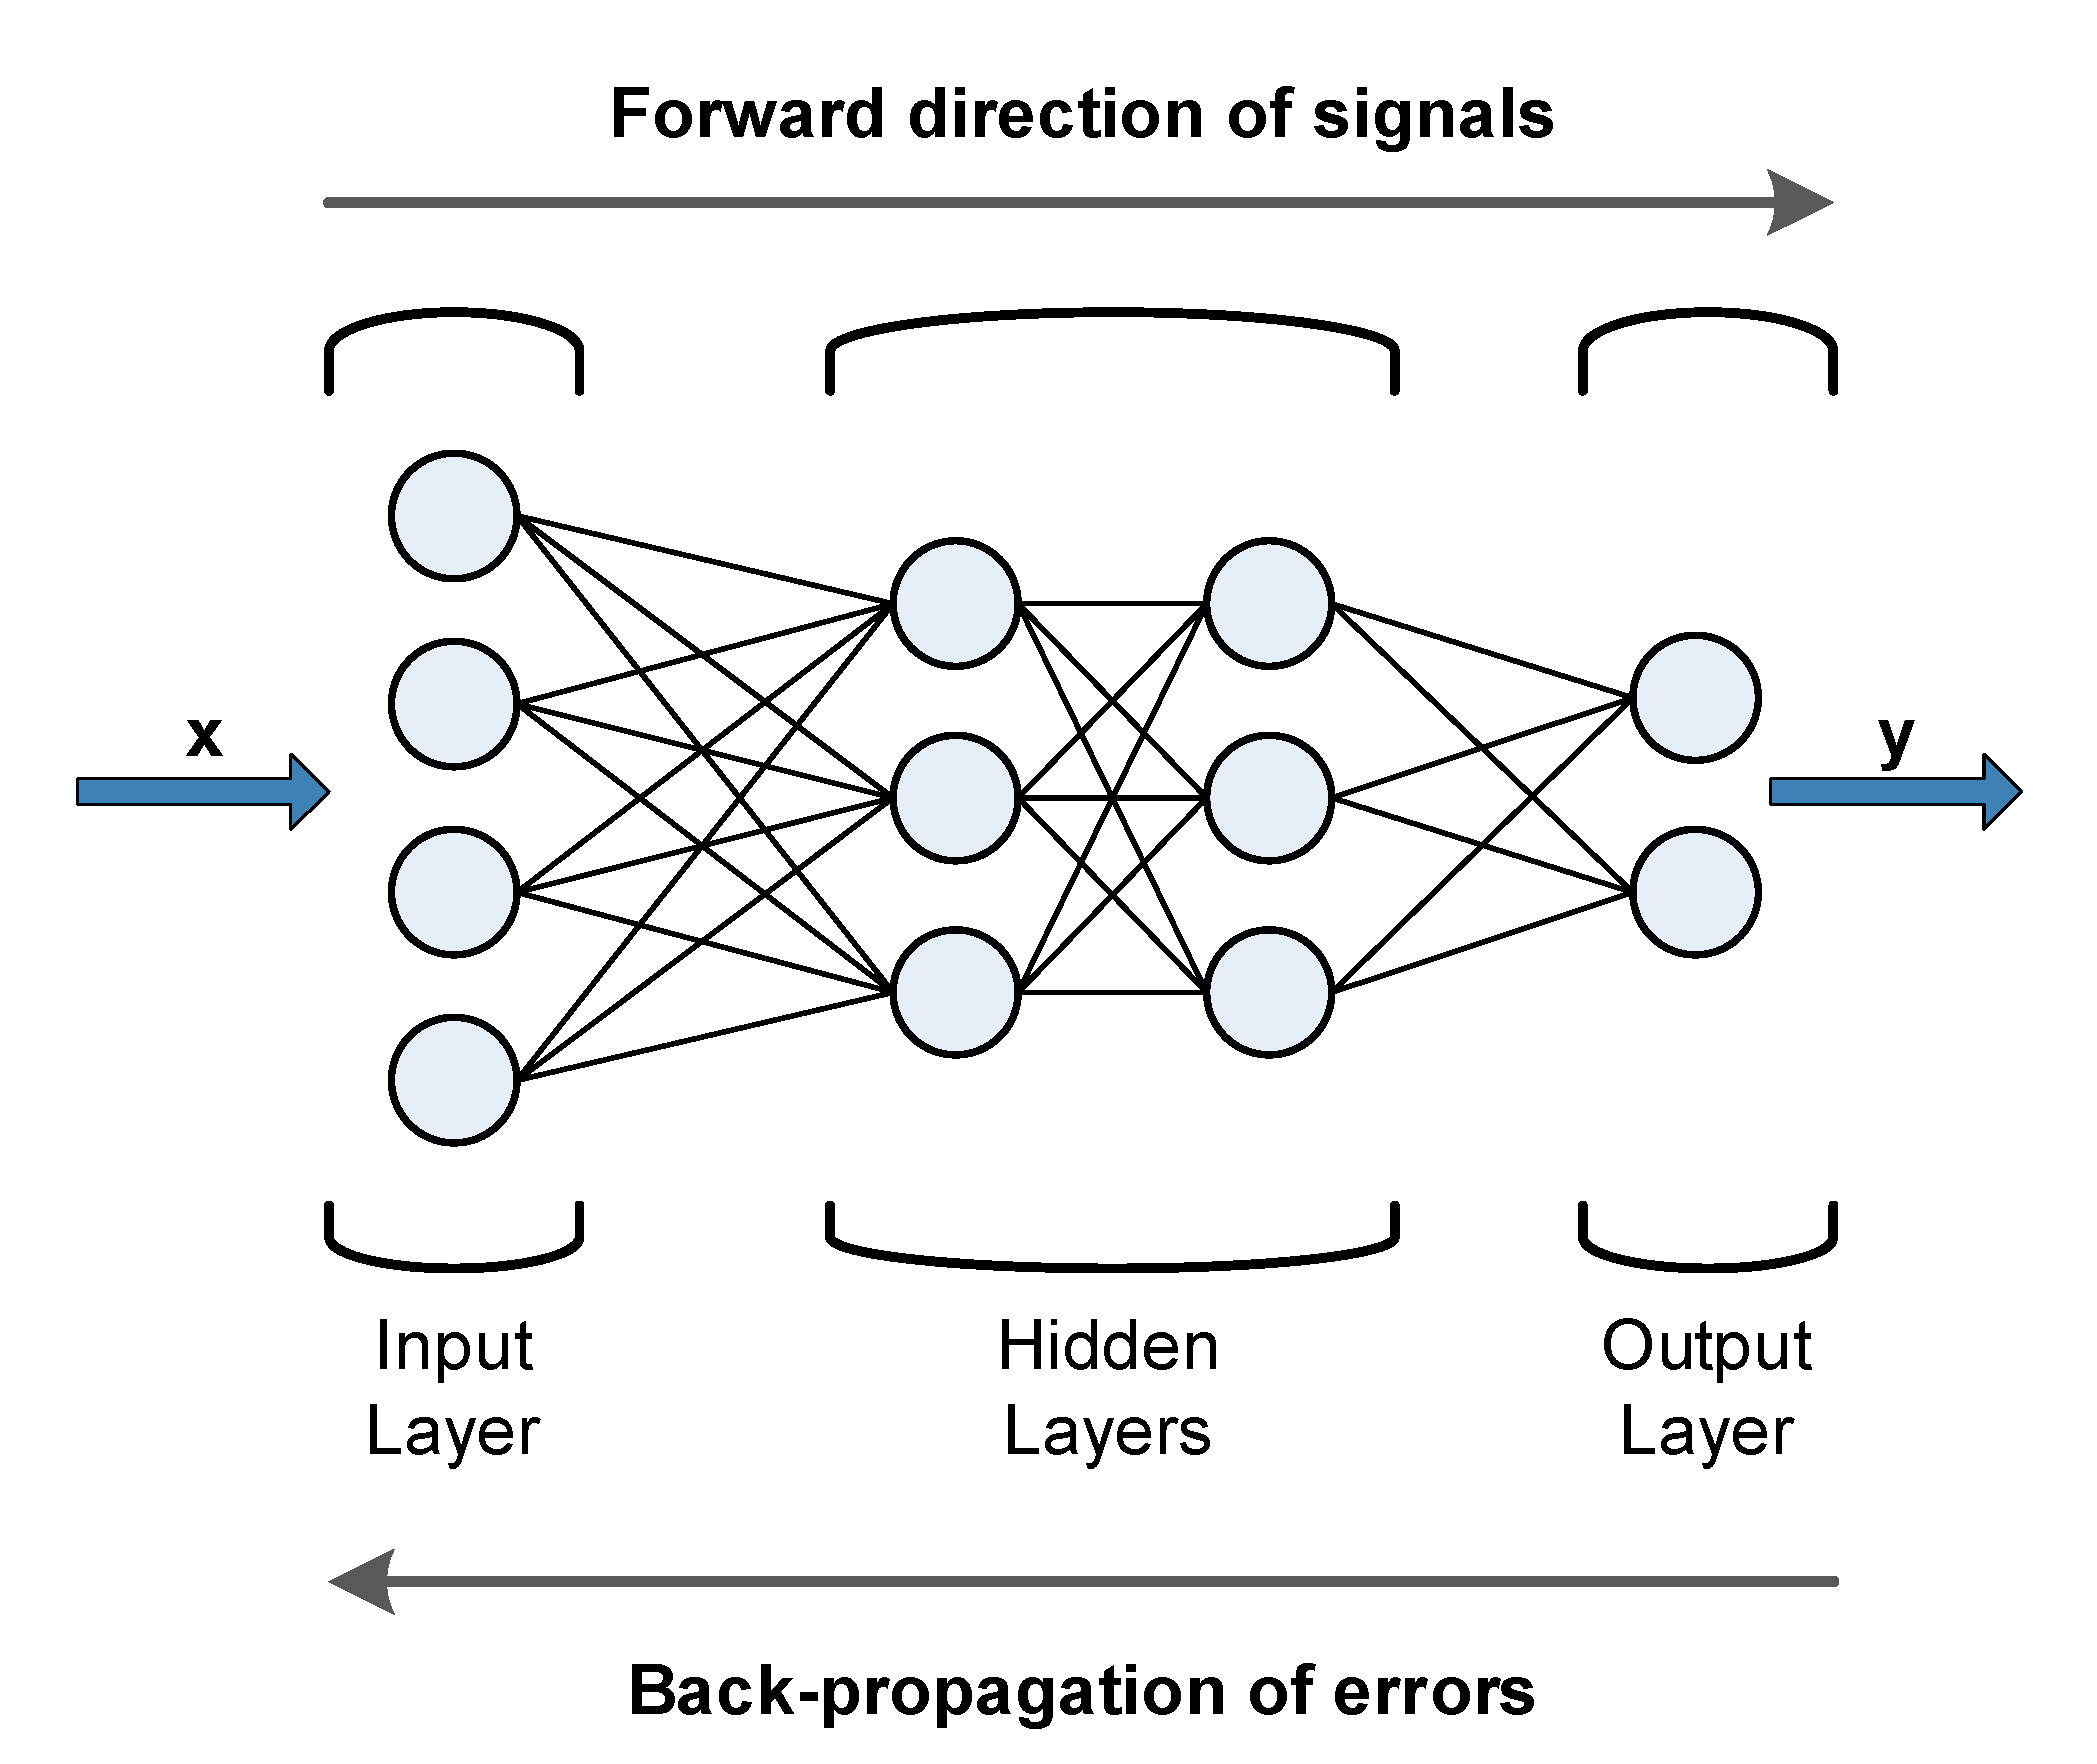
In neuroscience, a (biological) neural network describes a population of physically interconnected neurons or a group of disparate neurons whose inputs or signaling targets define a circuit. It was found that mammalian brains learn as connections between neurons are strengthened. ANNs mimic the biological neural networks and, like human beings, learn by example. ANNs can evaluate the complex functions of numerous variables whose interrelationships are not clear. Learning, categorization, and generalization are processes that are adopted by the ANNs to predict the outputs. The ANNs perform these tasks because of their ability to save the calculation data in memory during the training process. They contain a number of hidden layers consisting of a complex interrelationship of hidden “neurons”. There is a link between every two neurons of consecutive layers, having a specific weight. The predictions of neurons are then multiplied with these weights. During the latter process, the predictions of neurons are transferred through the links and added to the bias, as presented in Figure 2 [71].
Based on experience [72,73], it is considered that the multilayer feed-forward ANNs (MLFNNs) are the most suitable for this type of problem. In MLFNNs, there is an input layer, an output layer, and one or several hidden layers. In this study, we particularly use back-propagation neural networks (BPNNs). A back-propagation neural network is a feed-forward, multilayer network of standard structure, i.e., neurons are not interconnected within a layer, but they are connected with all the neurons of the previous layer and the subsequent layer. In this type of ANN, the output values are cross-checked with the target answer to get the error value. To reduce the error value, different techniques are used [72,73] by changing the weights of each connection during a large number of training cycles. In this case, one would say that the network has learned a certain target function. As the algorithm’s name implies, the errors propagate backwards from the output nodes to the input nodes. The selected architecture of the NN defines the number of hidden layers and the number of neurons in each layer. Figure 2 depicts an example of a BPNN composed of one input layer with four neurons, two hidden layers with three neurons each, and an output layer with two neurons, i.e., a 4-3-3-2 BPNN with two hidden layers.
As shown in Figure 2, a BPNN consists of several layers, and each layer contains a complex system of interconnected “neurons”. There is a link between neurons of subsequent layers, having a specific weight. The values generated by the neurons are then multiplied with these weights. During the latter process, the values generated by the neurons are shifted via links and then summed with bias, as shown in Figure 3, which depicts a single node (neuron) of a hidden layer, with a single R-element input vector.
This summation is then presented into a predefined activation function, as shown in Equation (5).
a = f ( w i p i + b )
where a is the output of the neuron, wi is the weight coefficients, pi the input values, and b is the bias value. In matrix form, the above equation can be written as Equation (6),
a = f ( w p + b )
where the sum wp, is the dot product of the (single row) matrix w = {w1, …, wR} and the vector p = [p1, …, pR]T.
The outputs of the activation function generate the values for the input process of neurons of the next layer. The final values of the weights are obtained from the learning process based on available data after assigning random initial weights in the beginning. In the present study, ANNs are utilized to predict the axial compressive strength and the axial compressive strain of confined concrete cylindrical elements. The error resulting from this process can be calculated by Equation (7),
E ( w ) = 1 2 i ( T i O i ) 2
where T is the target defined in the database, and O is the output value predicted by the ANN. For the strength model, we use a BPNN model, where the five input parameters are the diameter of the cylinder D, the height of the cylinder H, the total thickness nt, the elastic modulus of FRP Ef, and the compressive strength of unconfined concrete fco. The single output parameter is the compressive strength of confined concrete fcc. For the strain model, we similarly used a BPNN model, where the five input parameters are D, H, nt, Ef, and the compressive strain εco. In this model, the single output parameter is the compressive strain εcc corresponding to the compressive strength of confined concrete fcc. The parameters for both NN models are shown in Table 4.
The back-propagation technique or Delta rule [74] was used to minimize the error of Equation (7). This iterated search process was carried out in the opposite direction, i.e., from right to left of the NN, as shown in Figure 2. This process aimed to adjust the values of the various weights, which were randomly selected in the beginning so that the output values realistically agreed with the required target values of the database. This process was repeated until there was no further improvement in the mean square error value, and the errors became acceptable. In the end, the trained ANN can be used to predict results even for data that have not been presented to it before, with small error.

3.1. ANN Architecture

A number of parameters need to be set up for the ANN, for example, the activation functions between consequent layers, the total number of neurons in each layer, the activation functions between the hidden layers and the output layer, and others. The choice of these parameters depends on the given problem and can be determined by a trial and error process. For this investigation, we took six ANN architectures into account, as shown in Table 5. The 6 + 6 Models (6 for strength and 6 for strain) had different numbers of hidden layers and nodes in every hidden layer. The logistic and hyperbolic activation functions were utilized between the input and the middle layer, based on the authors’ experience [71], while the hyperbolic activation function was utilized between the output layer and its previous layer.

3.2. Normalization of the Databases

The ANNs work best with normalized data for inputs and outputs. This process helps avoid low learning rate issues [48]. In the present study, all the parameters associated with confined concrete cylinders were normalized using Equation (8). This process made all the parameters unitless despite the different units that were used to describe the various inputs or outputs.
X = Δ X Δ x x + ( X max Δ X Δ x x max )
In Equation (8), x is the actual value, X is the new normalized value, Δx is the difference between the maximum and minimum x value, xmax is the maximum x value, and Xmax and ΔX are the new desired maximum value of X and the new desired difference between the maximum and minimum X value, respectively. In our case, we used the parameters Xmax = 0.9 and ΔX = 0.8 to end up with normalized values that were in the range [0.1, 0.9]. The same equation, Equation (8), in a rearranged form, was used for the denormalization of the strength and strain values, i.e., to end up to the real values of strength and strain from the normalized ones provided by the NN.

3.3. Performance of the Various ANN Models

It is very important to calibrate the proposed ANN models based on the experimental results to investigate the accuracy of the generated model. The multilayer free forward back-propagation (MLFFBP) process [48] and the testing results were used for the calibration of the current ANN model. The training process of ANN was adopted as described in the authors’ work [75].
Overtraining (or over-fitting) can be a problem as it causes the ANN to lose its generalization capability. To avoid overtraining, the size of the network and the number of training epochs should be in correspondence with the complexity of the problem, especially if the training data contains a significant amount of noise. An excessive number of training epochs, or an excessive size of the neural network, can cause network overtraining. In our case, to enhance the performance of ANN and to avoid overtraining, the data were divided into three sets: one for training, one for validation, and one for testing purposes. Sixty percent of sample points were used for training, 20% were used validation, and 20% were used for testing purposes. The ANN models were developed using MATLAB [49].
There were 100 epochs for the training of each ANN model that included the MLFFBP process. The MLFFBP process continued until any of the following conditions was completed: (i) 20 failures occurred in the validation process during the iteration, to avoid overtraining, (ii) the performance goal (the difference between the target and the output values) became equal to a preset value of 0.0001, (iii) the minimum performance gradient became equal to 10−10. The rate at which the MLFFBP process adjusts the weights of the sample points is known as the minimum performance gradient. These conditions were used, as suggested by the Levenberg–Marquardt back-propagation technique [49]. This technique is a second-order algorithm that works with second derivatives.
Table 6 and Table 7 present some statistical information about the ANN model predictions (target values) for the strength and the strain models, respectively. The tables contain the minimum values (min), the maximum values (max), the difference between the two (Range = MaxMin), the average values (Mean), the median values (Median), the standard deviation (StDev) and the coefficient of variation (CV = StDev/Mean). Some negative values can be found for the Min values of fcc/fco and εcc/εco in the table, which make no sense and are only artifacts of the method that do not affect the overall results.
Equations (9)–(11) show the formulas used for the calculation of the correlation factor R, the mean squared error (MSE), and the mean absolute error (MAE), respectively. These three metrics were used to evaluate the different models. When the ANN outputs O match the targets T perfectly, then R→1, MSE→0, MAE→0 [76,77,78].
R = i = 1 n [ ( T i T ¯ ) ( O i O ¯ ) ] i = 1 n ( T i T ¯ ) 2 i = 1 n ( O i O ¯ ) 2
MSE = i = 1 n ( T i O i ) 2 n
MAE = i = 1 n | T i O i | n
In the above formulas, Ti and Oi are the values established experimentally (target values) and with the use of the ANN, respectively. The number of data points is denoted by n, while T ¯ and O ¯ are the average values of the experimental and the predicted values, respectively.
Table 8 shows the prediction performance of the six NN models for strength and strain. It has to be noted that these values correspond to the normalized values of fcc/fco and εccco, for the strength and strain models, respectively.
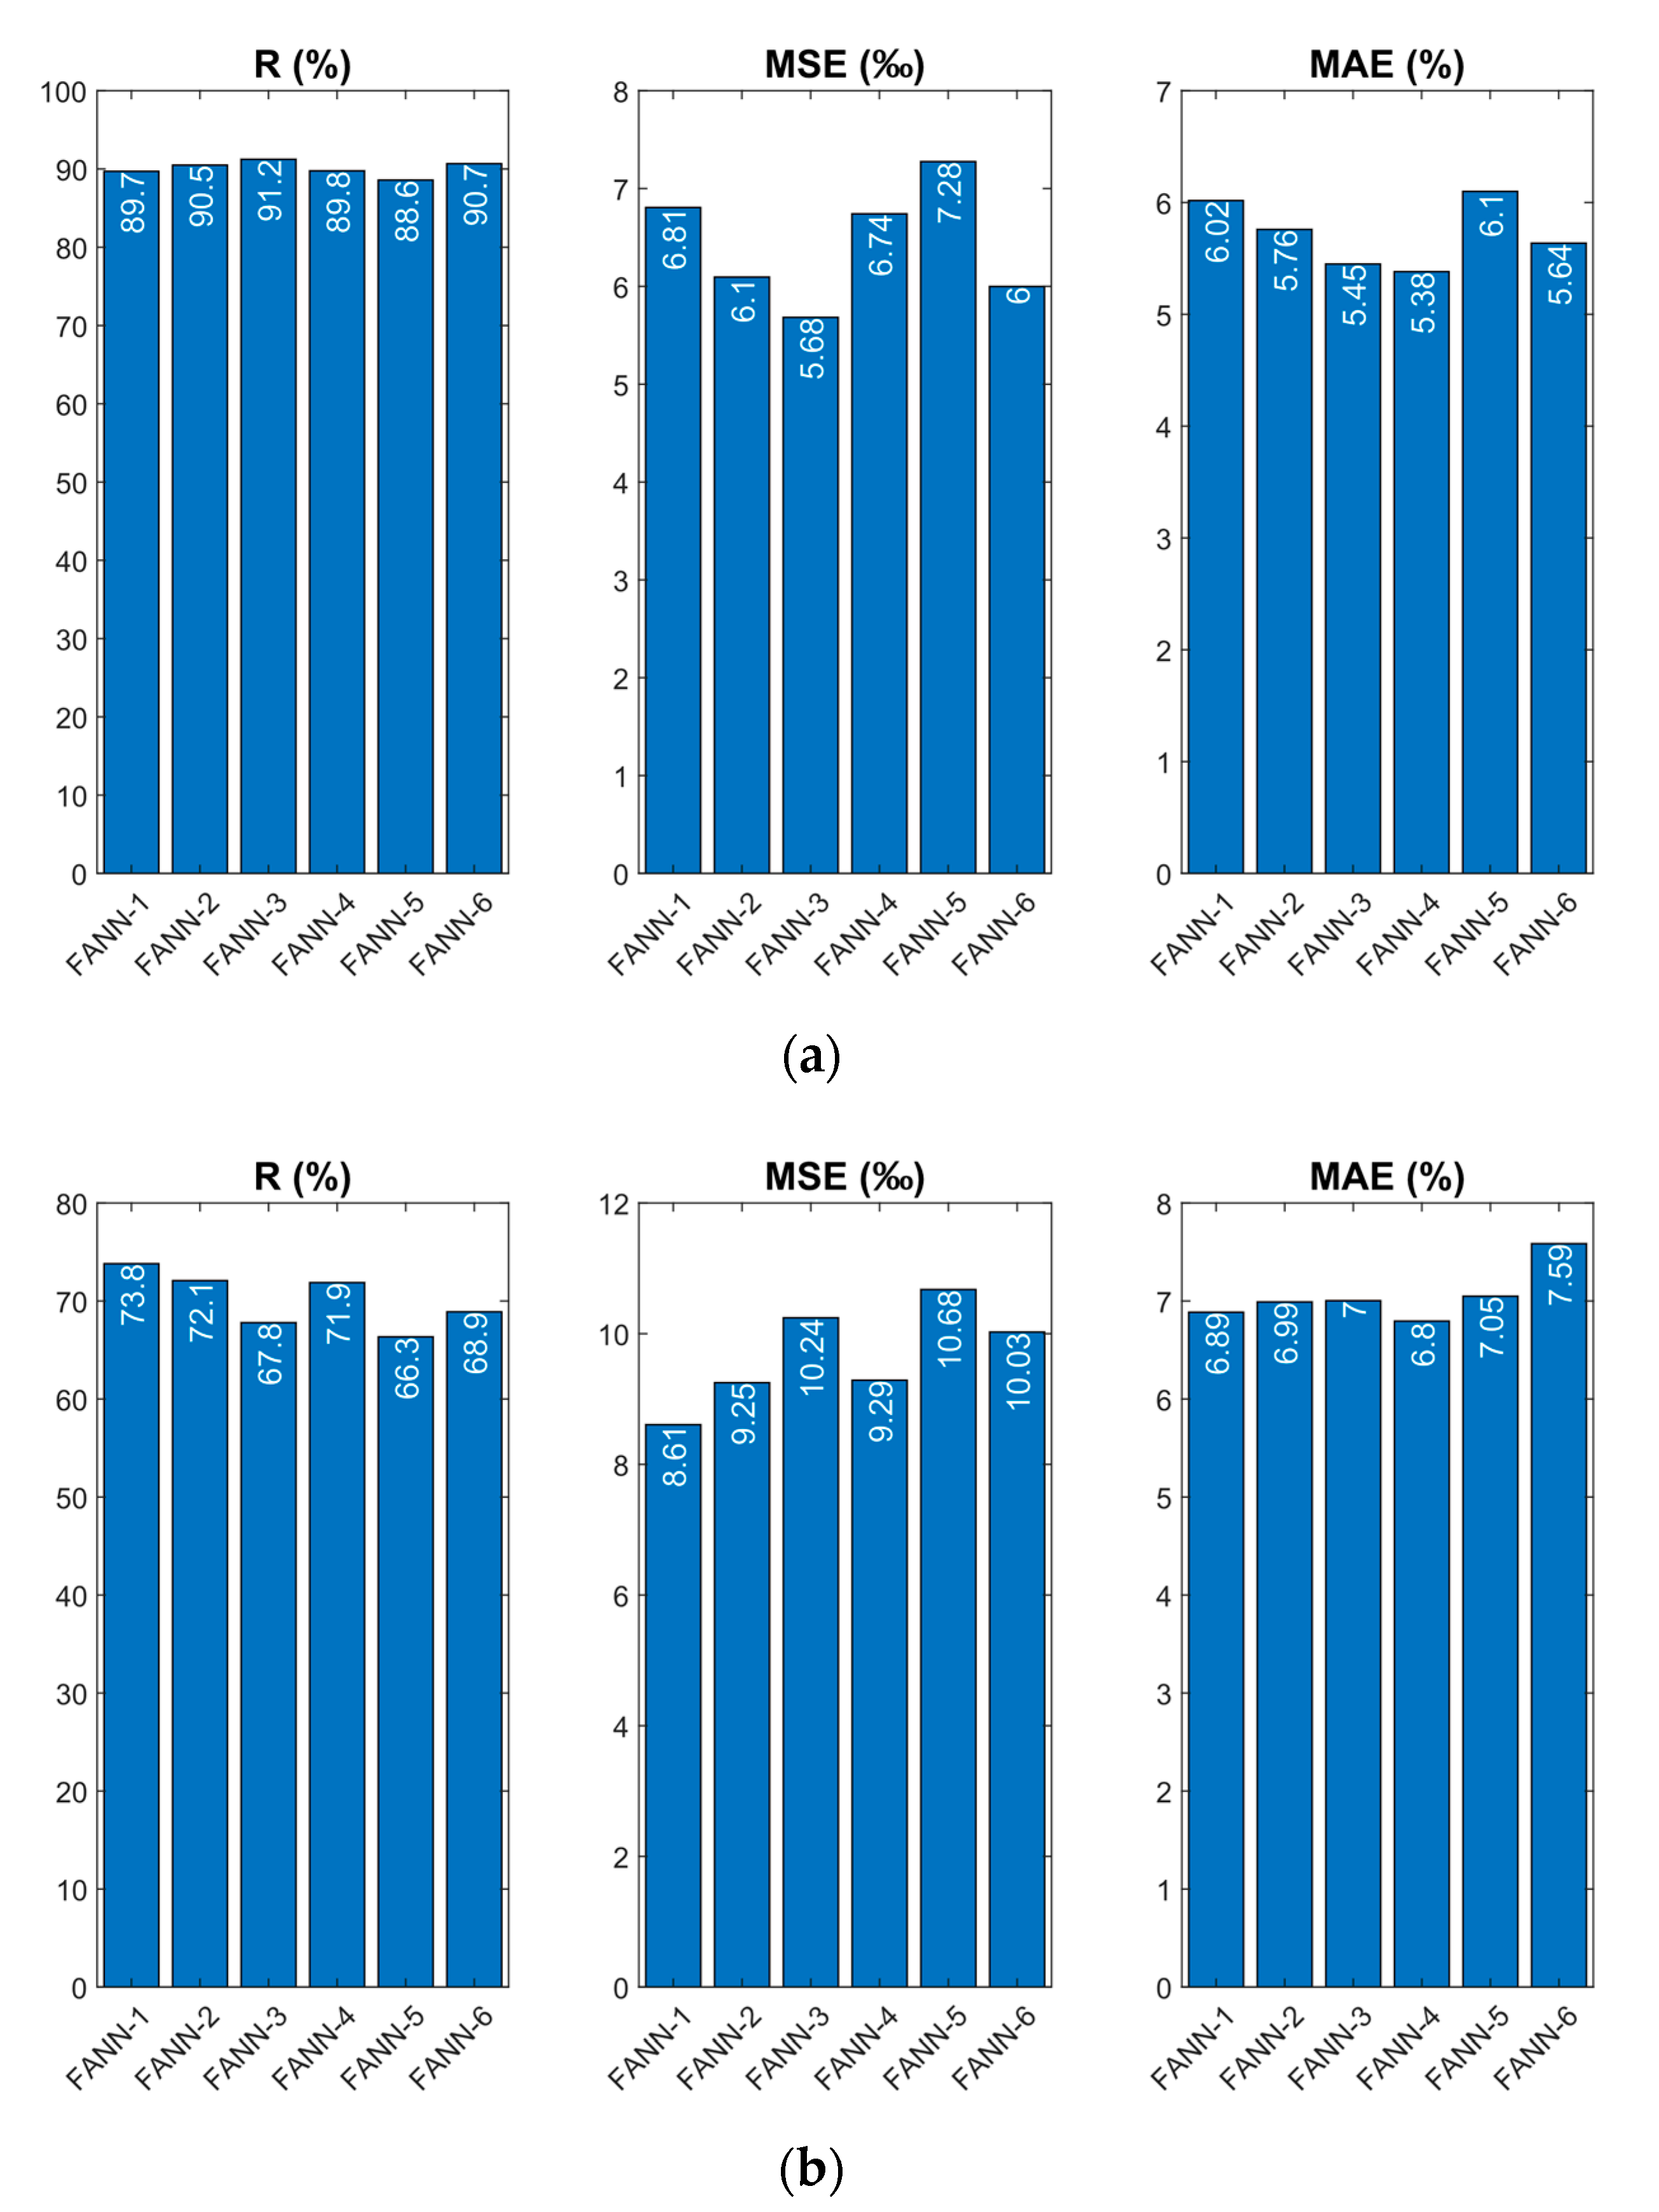
Figure 4 shows the values of MSE, MAE, and R for the six different NN models for strength and strain. The models corresponding to the least values of MAE and MSE and the highest value of R can be considered as the best models which can accurately predict the axial strength or strain of confined concrete. It can be concluded that the ANN strength model with the highest value of R (91.2%), together with the lowest values of MSE (5.68%) and MAE (5.45%), was the third model, i.e., FANN-3.
Similarly, the ANN strain model with the highest value of R (71.9%) along with the lowest values of MSE (9.29‰) MAE (6.80%) was the fourth model, i.e., EANN-4. Thus, FANN-3 (5-5-5-1 architecture) and EANN-4 (5-10-10-1 architecture) were selected as the final models for the prediction of the axial strength and axial strain of cylinders.
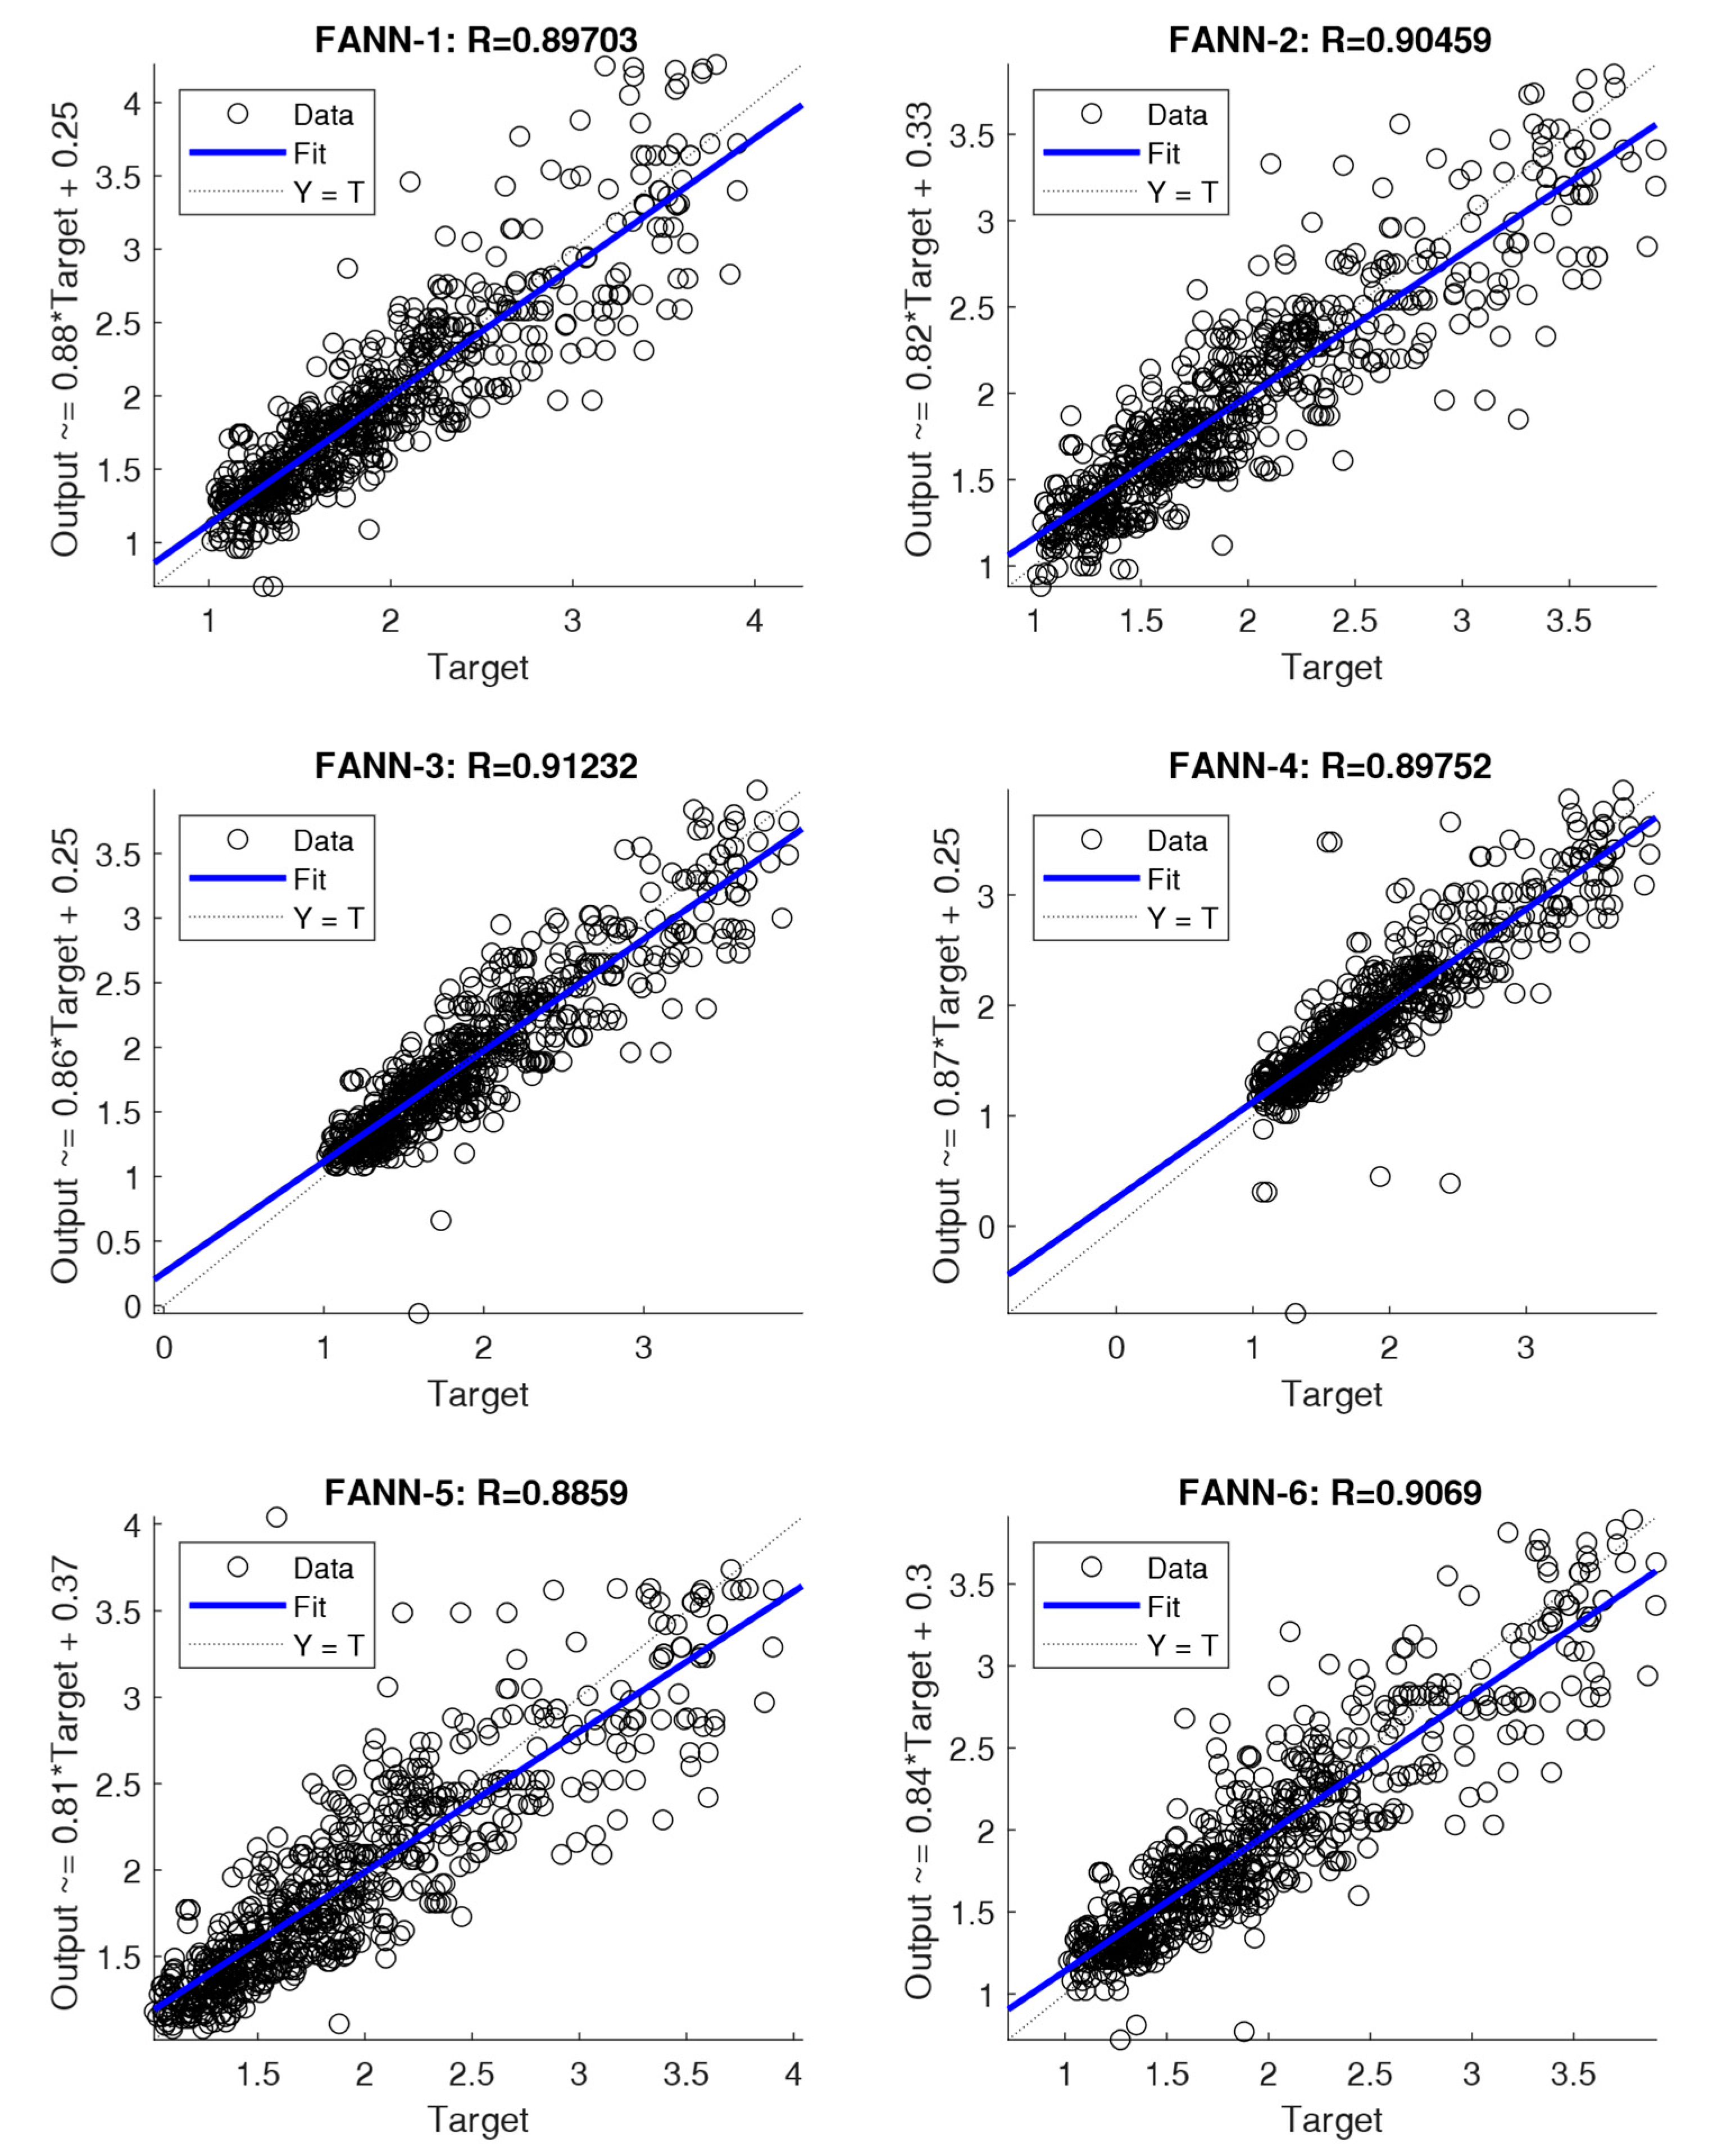
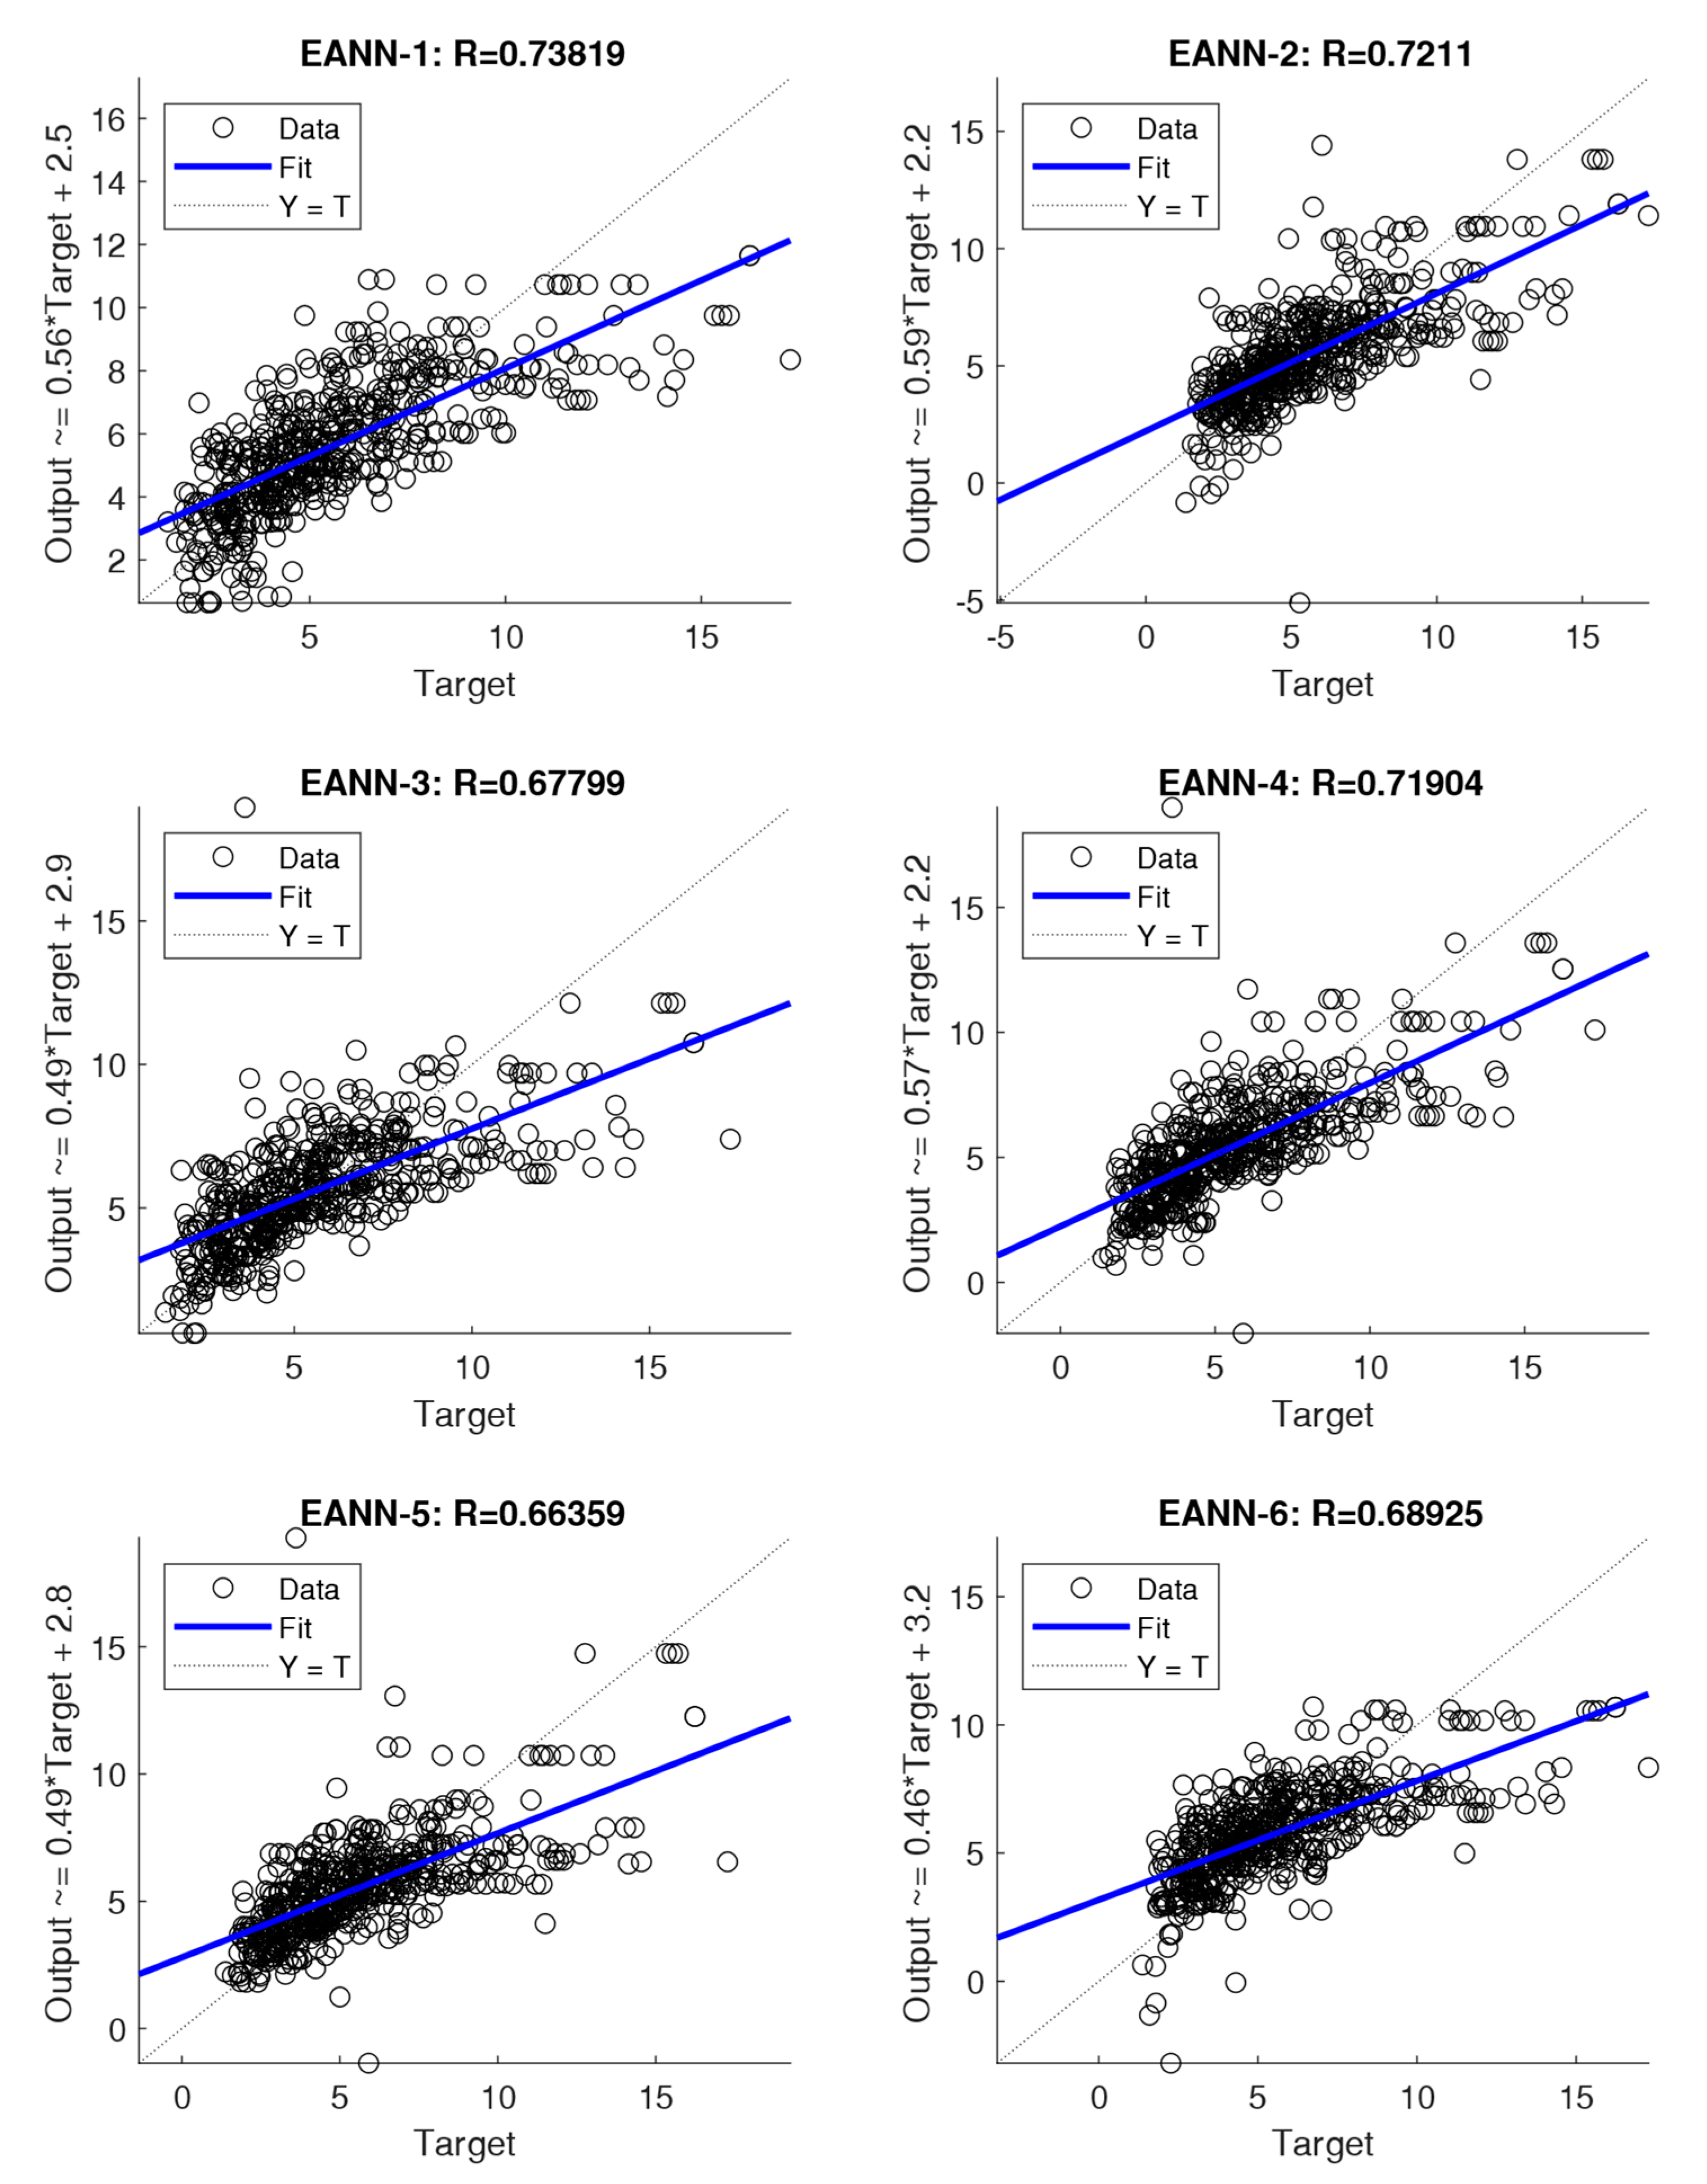
 Figure 5 and Figure 6 depict the output values of the different NN models vs. the target values for strength and strain graphically, respectively.

4. Analytical Models

4.1. Analytical Models from the Literature

In the present work, design-oriented strength and strain models were proposed based on large experimental databases of 708 confined concrete cylinders for strength and 572 for strain. The whole process was performed using ANN techniques giving the best fit after minimizing certain statistical parameters, such as R, MSE, and MAE, between the predictions of models and the experimental values.
Next, we evaluated the performance of other strength and strain models proposed in the literature using the collected database. Namely, for strength, we examined the following twelve models: 1. Richart et al. [68], 2. Fardis and Khalili [63], 3. Newman and Newman [69], 4. Mander et al. [45], 5. Karbhari and Gao [42], 6. Samaan et al. [59], 7. Toutanji [65], 8. Lam and Teng [44], 9. Teng et al. [61], 10. Saafi et al. [67], 11. Miyauchi et al. [70], 12. Matthys et al. [60]. Figure 7 shows the performance of these twelve strength models.
For strain, we examined the following seven models: 1. Fardis and Khalili [63], 2. Mander et al. [45], 3. Karbhari and Gao [42], 4. Samaan et al. [59], 5. Toutanji [65], 6. Lam and Teng [44], 7. Teng et al. [66]. Figure 8 shows the performance of these seven strain models. The values of R and MSE are given in the titles of the sub-figures, for each examined model, for both strength (Figure 7) and strain (Figure 8). Looking at the figures, it is obvious that the strength models were more successful than the strain models, in general. The spread of the strain models was larger, and the error of these models was above the 30% threshold (red dashed line) in many cases.

4.2. Proposed Analytical Model

In this section, we propose two new analytical models, one for strength and one for strain, based on regression analysis. Regression Analysis is a statistical tool used to determine the probable change in one variable for a given amount of change in another. This means the value of the unknown variable can be estimated from the known value of another variable.

4.3. Proposed Equation for Strength

The form of the new proposed analytical strength model was based on the mechanics of published models, as represented by Equation (12),
f c c f c o = 1 + k ( f l f c o ) n
where k and n are constants. Using general regression analysis, we end up with the values k = 3.1 and n = 0.83 for the two variables of Equation (13) and the final equation becomes
f c c f c o = 1 + 3.1 ( f l f c o ) 0.83
Thus, the FRP confined concrete axial compressive strength can be finally expressed by Equation (14)
f c c = f c o + 3.1 f c o ( f l f c o ) 0.83
Figure 9 shows the performance of the newly proposed analytical model for strength (on the left) and the corresponding performance of the best ANN model for strength (on the right). It has to be noted that the R-value was better for the analytical model compared to the ANN model (0.95 > 0.91), and the same trend was found for the MSE value of the analytical model compared to the one of the ANN model (0.041 < 0.074). The performance of the proposed analytical model for strength was superior to any of the examined models in the literature, exhibiting better values for both R and MSE.

4.4. Proposed Equation for Strain

As shown in Figure 8, the published strain model proposed by Fardis and Khalili [63] exhibited a poor performance with R = 0.4 and MSE = 11.7 for predicting the strain of confined concrete cylinders at ULS. Furthermore, the Mander et al. [45] model showed a relatively good performance with R = 0.7 and MSE = 4.15. This is the model that has been recommended by the American Concrete Institute ACI 440-2R-02 [64]. Therefore, to propose a new analytical equation for strain, the general form of this model was selected as given by Equation (15), with a total of four parameters to adjust (α, β, λ1, λ2).
ε c c ε c o = a + β ρ κ λ 1 ρ ε λ 2
Using general regression analysis, we ended up with the values α = 1.85, β = 7.46, λ1 = 0.71, and λ2 = 1171 and the final equation becomes
ε c c ε c o = 1.85 + 7.46 ρ κ 0.71 ρ ε 1.171
Finally, the relationship for the axial compressive strain of FRP confined concrete compression members can be written as
ε c c = ( 1.85 + 7.46 ρ κ 0.71 ρ ε 1.171 ) ε c o
Figure 10 shows the performance of the proposed analytical model for strain (on the left) and the corresponding performance of the ANN model for strain (on the right). Again, the R-value was better for the analytical model compared to the ANN model (0.8 > 0.72), and the same trend was found for the MSE value of the analytical model, compared to the one of the ANN model (2669 < 3.66). Again, the performance of the proposed analytical model for strain was superior to any of the examined models in the literature, exhibiting better values for both R and MSE.

5. Comparative Study

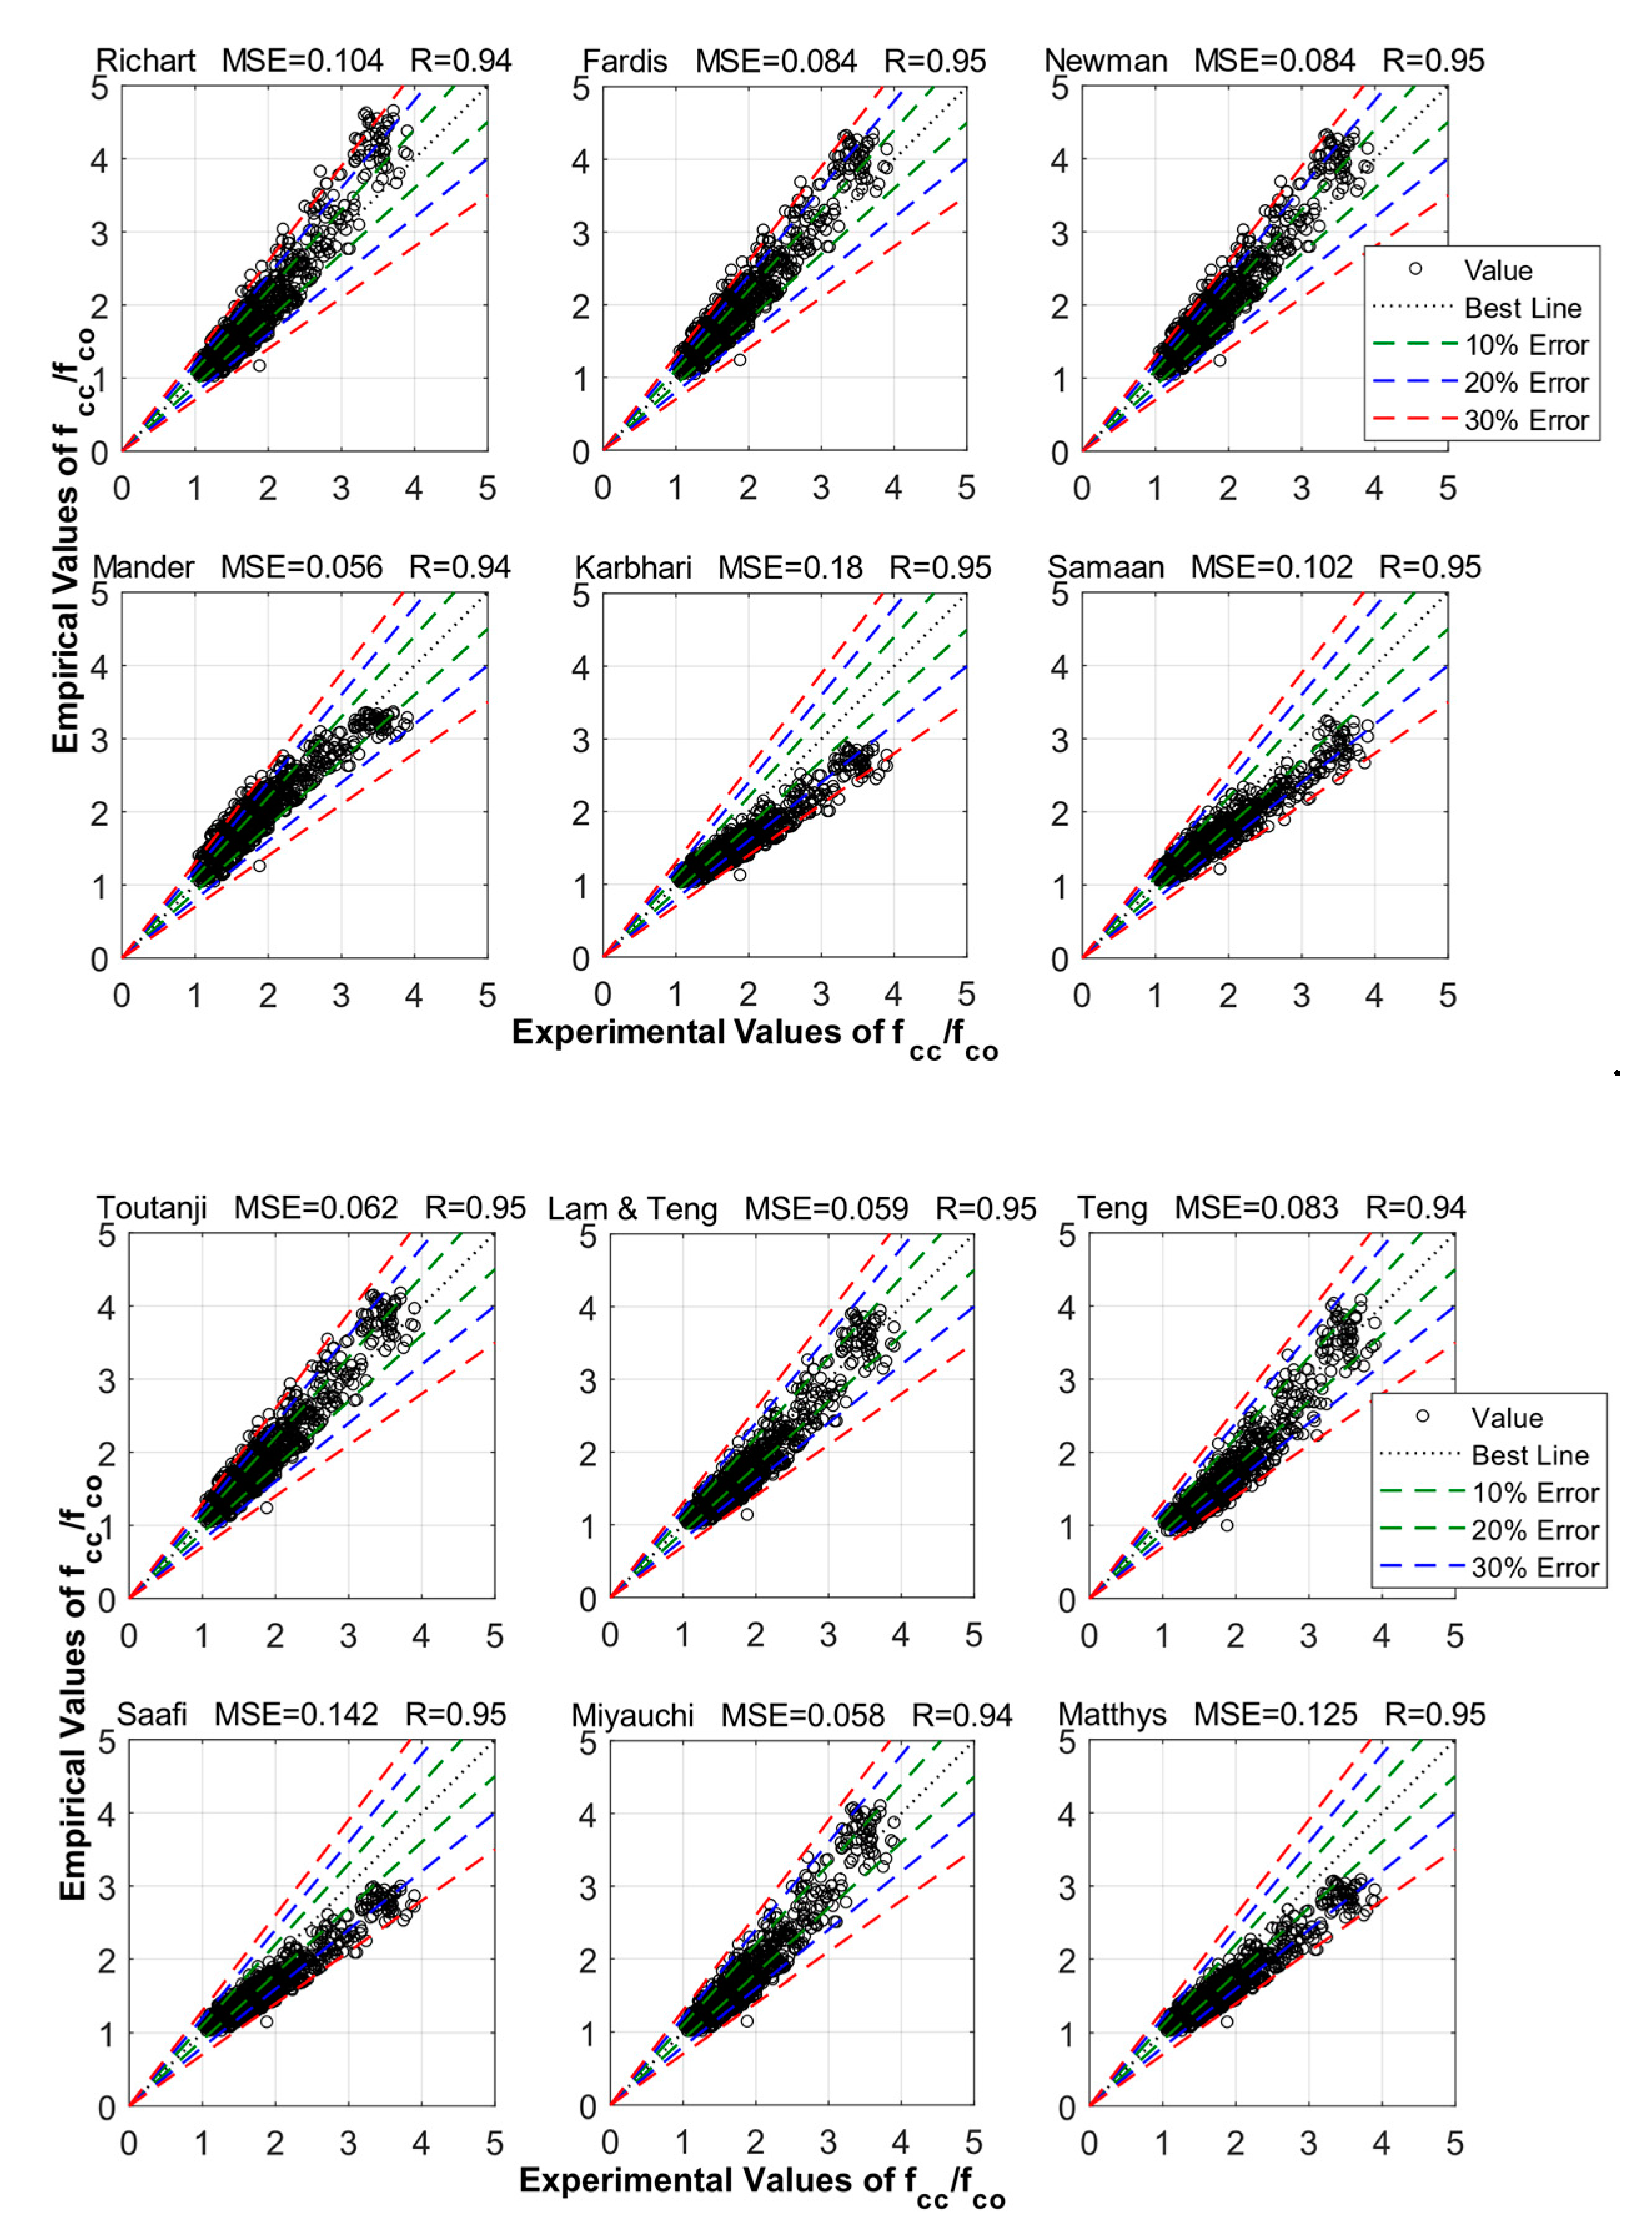
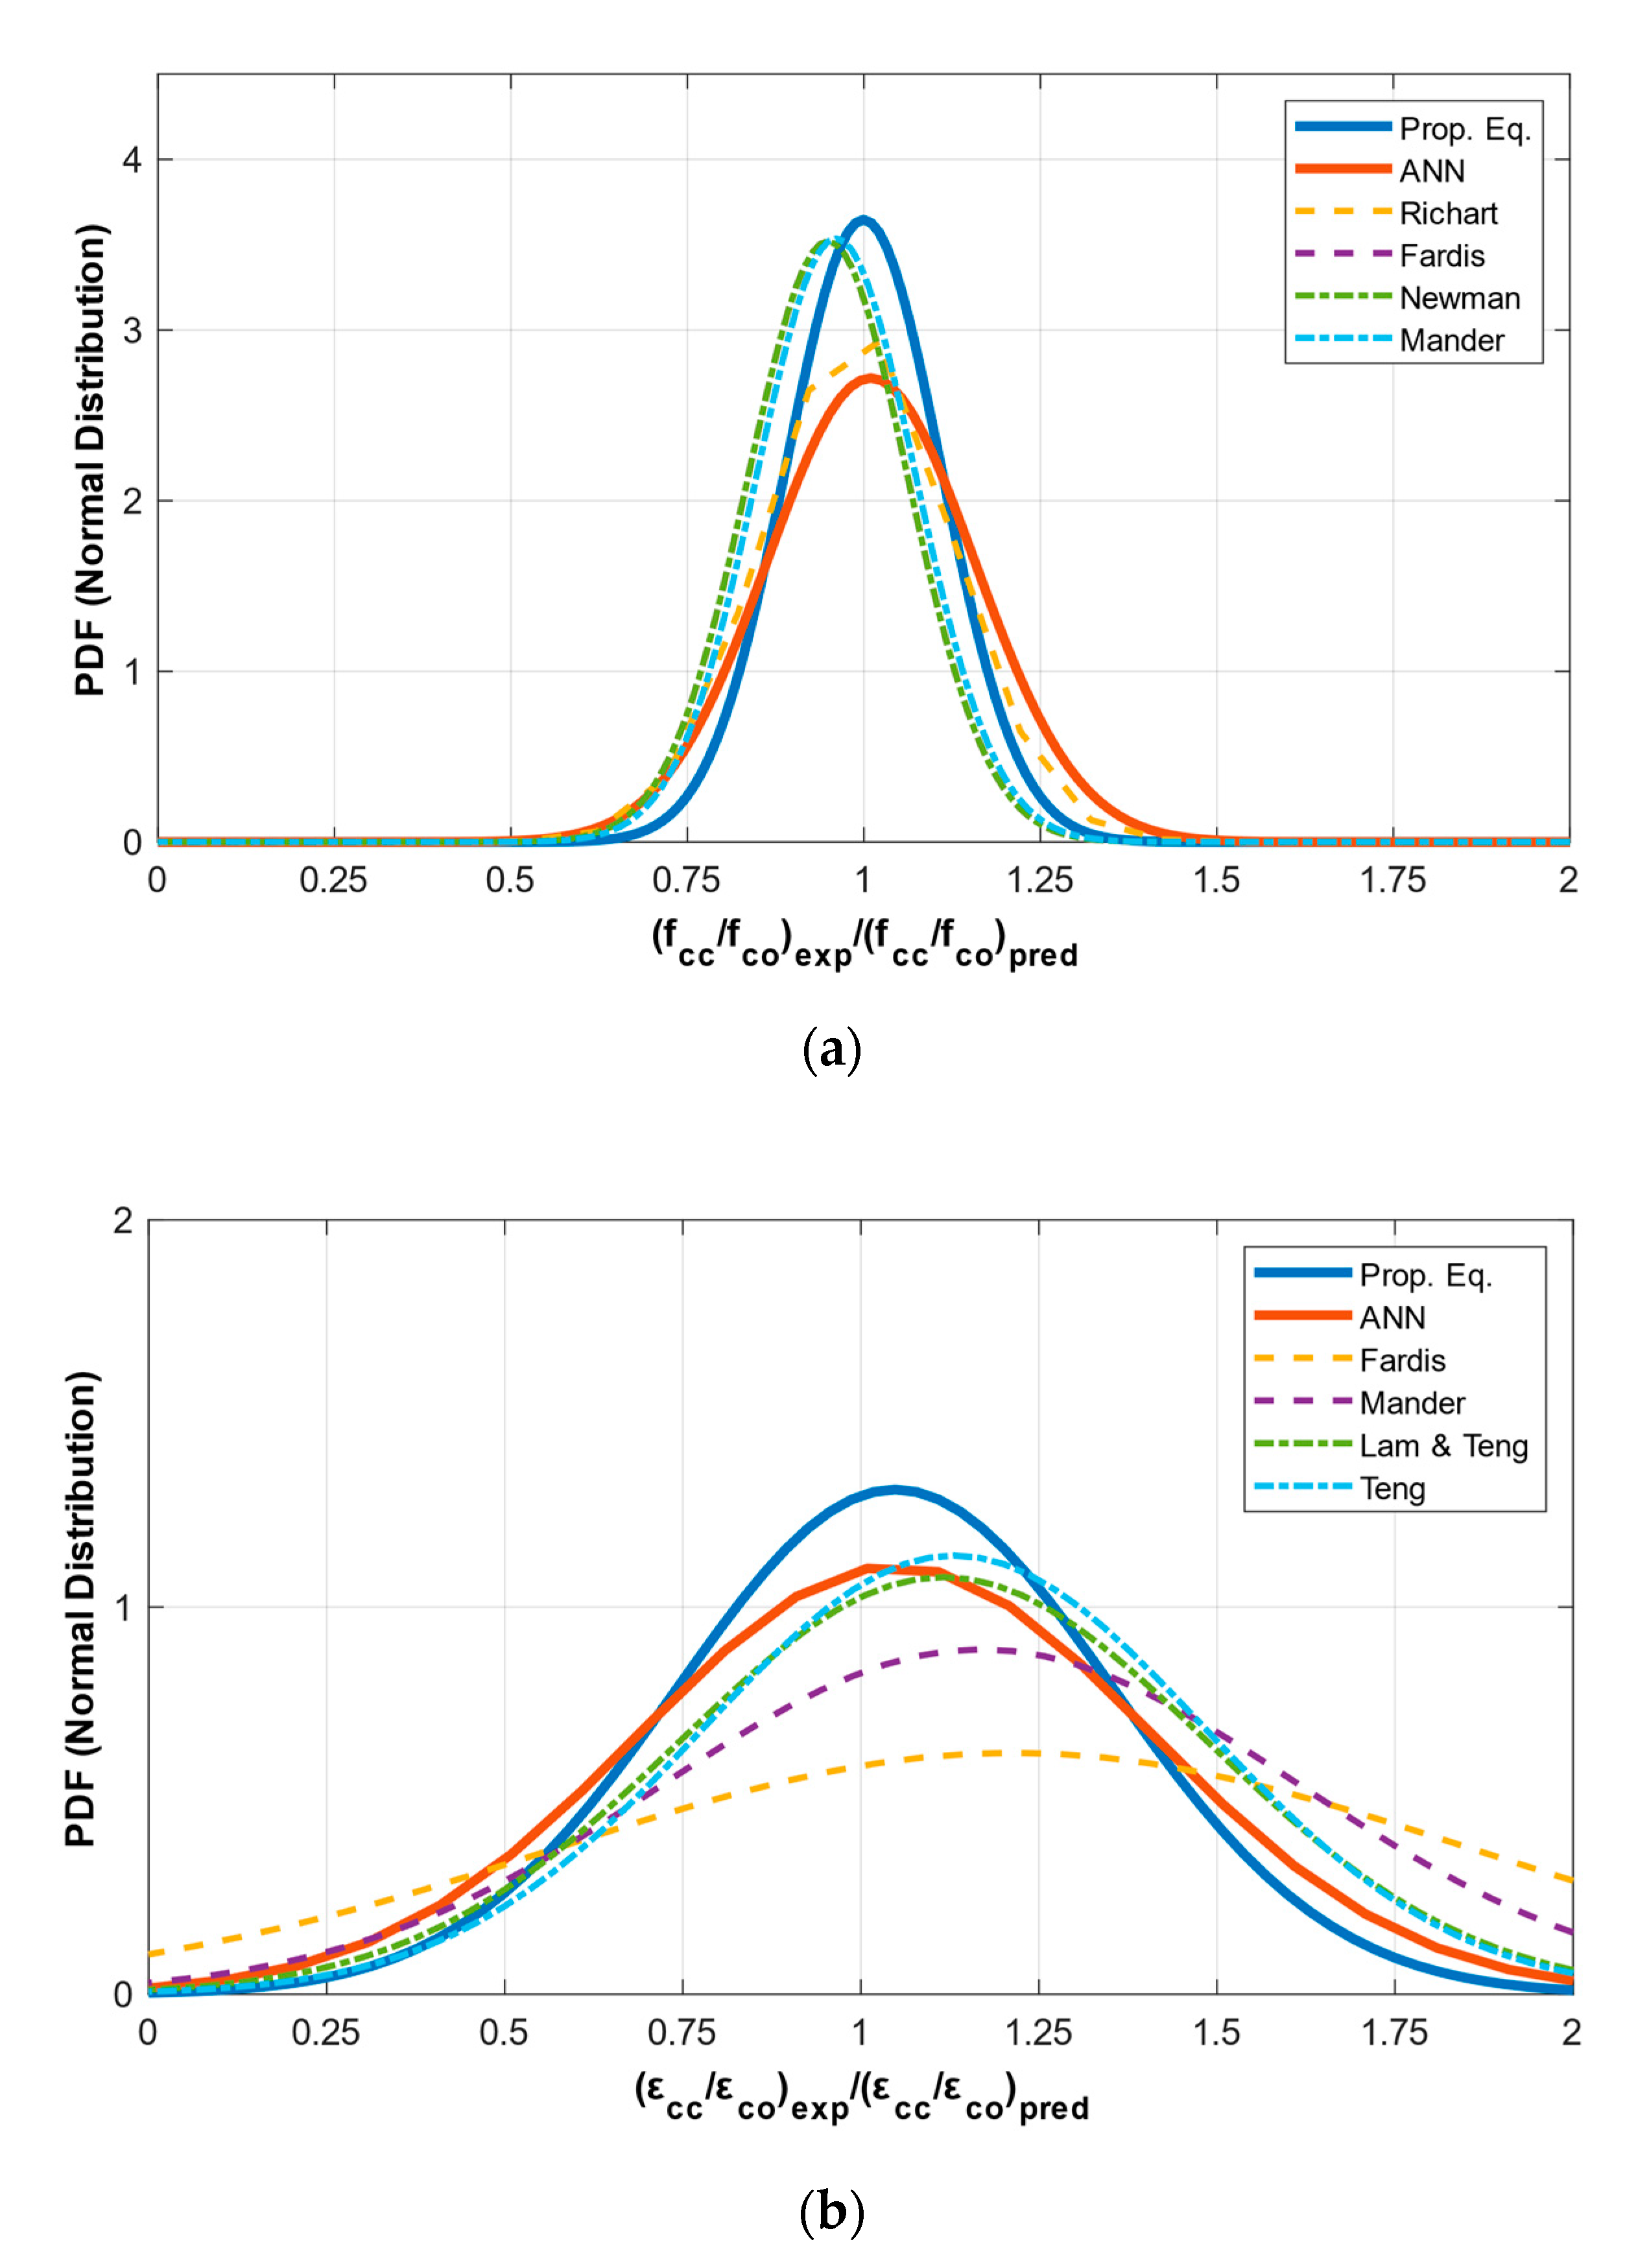
For a comparative study of the proposed ANN model, the proposed analytical model, and other models from the literature, we drew the probability density functions (PDFs) of the results of the various methods as normal distributions based on the mean value and the standard deviation of the experimental ratio (fcc/fco and εcc/εco) divided by the corresponding predicted ratio for each method. A good prediction would mean an average value close to 1 and the PDF curve being tall and as narrow as possible (standard deviation as low as possible). Wider curves denote a higher standard deviation from the mean value.
Figure 11 shows the results for the strength (a) and the strain (b) models. For illustration purposes, for the strength model, the comparison was made with the results from Richart [68], Fardis [63], Newman [69], and Mander [45], while for the strain model, the results were compared with the ones from Fardis [63], Mander [45], Lam and Teng [44], and Teng [61].
For the strength model, the proposed analytical model and the proposed ANN model showed the best results with mean values close to 1 (1.00 and 1.01, respectively), while from the other models, the one of Richart had the best mean value (0.99) with a standard deviation of 0.132. The standard deviation of the proposed analytical model and the proposed ANN model were 0.109 and 0.146, respectively.
For the strain model, again, the two proposed models showed very good results with a mean value of 1.05 (for both) and standard deviations 0.306 for the proposed equation and 0.360 for the proposed ANN. For comparison, the Teng and the Lam and Teng models had mean values of 1.13 and 1.12, respectively, with standard deviations 0.352 and 0.370.
It should be noted that the results were better for the strength models in general (better mean values and smaller deviation), compared to the strain model. The proposed models for confined concrete are capable of providing accurate results for confined concrete strength and strain, in comparison to other models in the literature.
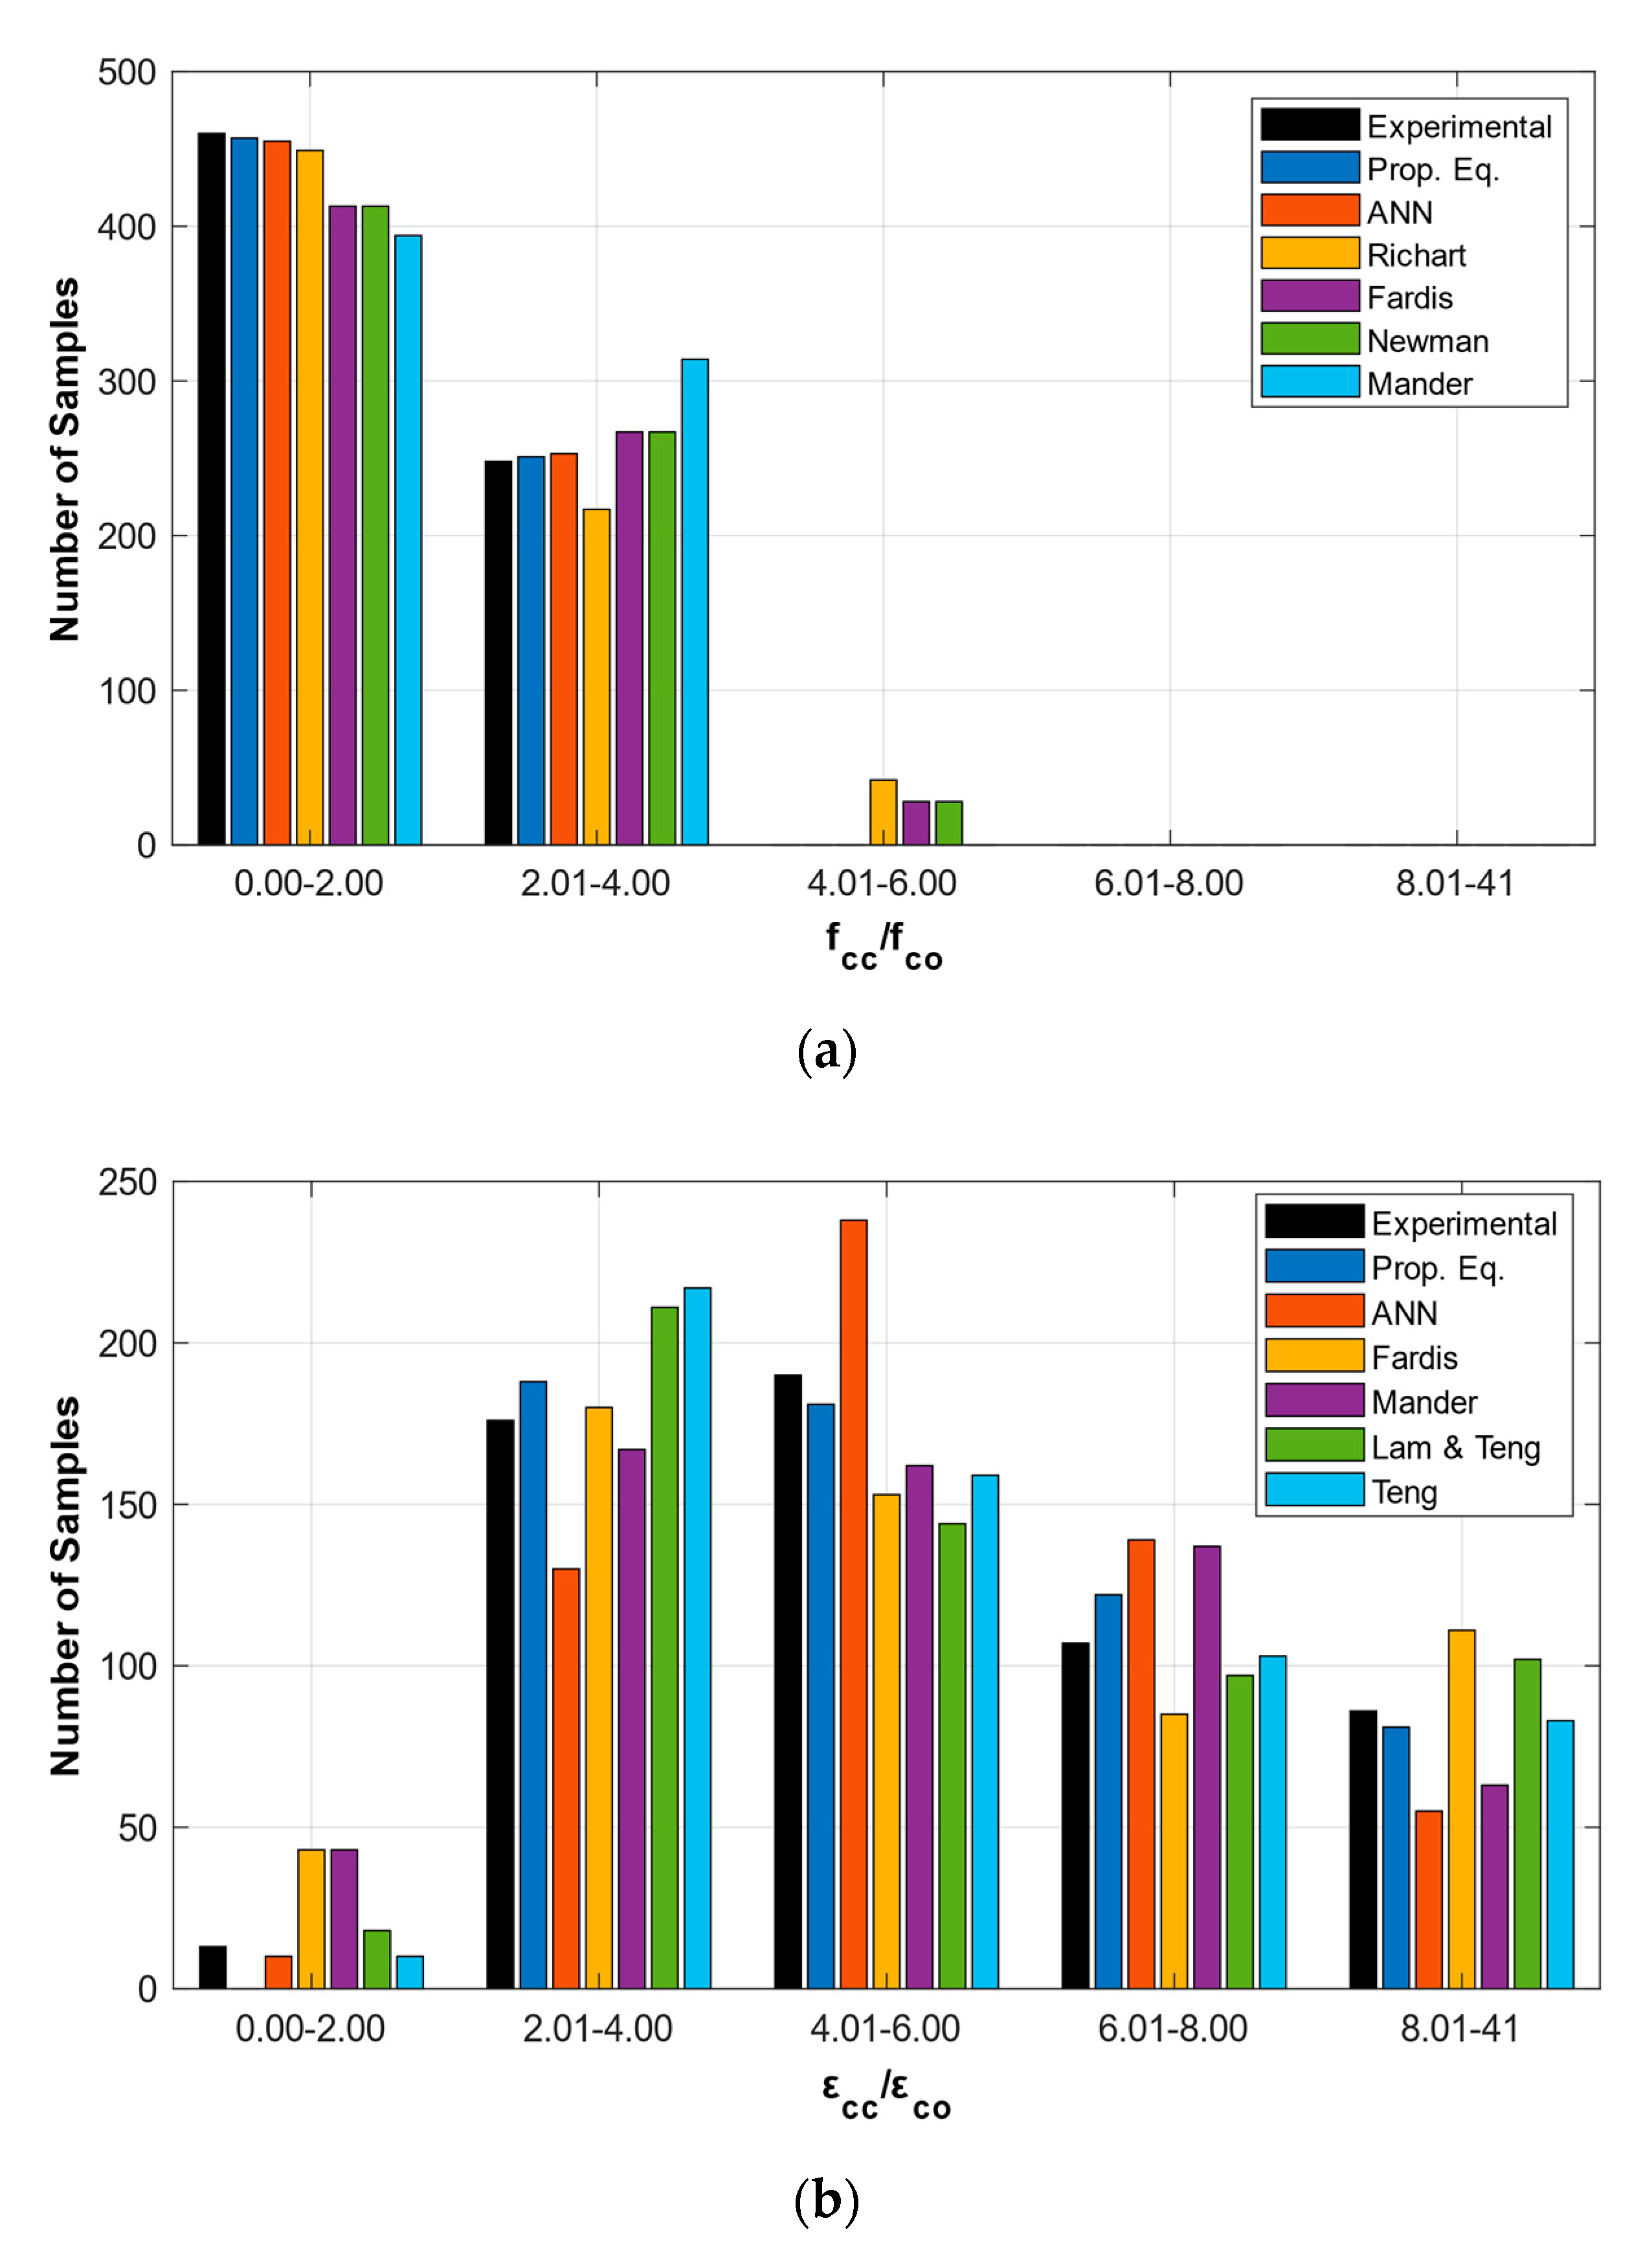
Figure 12 shows the distributions of the ratios fcc/fco and εcc/εco provided by each method. The black bar denotes the experimental (target) values. Again, the proposed equation and the proposed ANN model gave the best results with distributions that were closer to the targets.

6. Conclusions

In the current study, a large database for FRP-confined concrete compression members was constructed from data available in the literature. The database contained 708 specimens for strength and 572 specimens for strain. A preliminary evaluation of previously proposed models for ultimate conditions of FRP-confined concrete compression members was performed to select more general forms of the proposed empirical models by using statistical metrics, such as R, MSE, and MAE. The outcome of the present work is summarized as follows.
  • Six different ANN models were generated for the strength (FANNs) and the strain (EANNs) of FRP-confined concrete compression members, separately. The ANN strength model with the highest value of R, together with the lowest values of MAE and MSE for the normalized values, was FANN-3, which is a double layer ANN model with five neurons in each hidden layer (5-5-5-1 network architecture).
  • Similarly, the ANN strain model with the highest value of R along with the lowest values of MAE and MSE for the normalized values was EANN-4, which is again a double layer ANN model with 10 neurons in each hidden layer (5-10-10-1 network architecture).
  • Two analytical models were also proposed for strength and strain, based on general formulas and regression analysis procedures. The performance of the proposed analytical models was superior to any one of the examined models in the literature, exhibiting better values for both R and MSE when applied to the databases. The analytical models also performed slightly better than the ANN models in terms of the R and MSE values achieved.
  • The proposed ANN and the proposed analytical models can predict the axial behavior of FRP-confined concrete with high accuracy and can be helpful tools for designers in analyzing and designing confined concrete compression members. Both the ANN and the analytical proposed models outperformed other empirical models in their predictions. Once trained, the ANN models need only trivial computational time to provide their outputs.

Author Contributions

Conceptualization, A.A. and Q.-u.-Z.K.; methodology, V.P.; software, A.A. and V.P.; validation, A.A. and V.P.; formal analysis, A.A. and V.P.; investigation, Q.-u.-Z.K.; resources, V.P.; data curation, A.A.; writing—original draft preparation, A.A. and Q.-u.-Z.K.; writing—review and editing, V.P.; visualization, V.P.; supervision, Q.-u.-Z.K.; project administration, A.A. and V.P.; funding acquisition, V.P. All authors have read and agreed to the published version of the manuscript.

Funding

This research received no external funding. The Article Processing Charge (APC) was funded by the Oslo Metropolitan University (OsloMet).

Acknowledgments

The authors acknowledge the help of OsloMet and the University of Engineering and Technology, Taxila, in providing the necessary facilities. The support of OsloMet in covering the APC is also greatly acknowledged and appreciated.

Conflicts of Interest

The authors declare no conflict of interest.

References

  1. Hollaway, L.C.; Chryssanthopoulos, M.; Moy, S.S. Advanced Polymer Composites for Structural Applications in Construction: ACIC 2004; Woodhead Publishing: Cambridge, UK, 2004. [Google Scholar]
  2. Parvin, A.; Jamwal, A.S. Effects of wrap thickness and ply configuration on composite-confined concrete cylinders. Compos. Struct. 2005, 67, 437–442. [Google Scholar] [CrossRef]
  3. Li, G.; Kidane, S.; Pang, S.-S.; Helms, J.E.; Stubblefield, M.A. Investigation into FRP repaired RC columns. Compos. Struct. 2003, 62, 83–89. [Google Scholar] [CrossRef]
  4. Demers, M.; Neale, K.W. Confinement of reinforced concrete columns with fibre-reinforced composite sheets-an experimental study. Can. J. Civ. Eng. 1999, 26, 226–241. [Google Scholar] [CrossRef]
  5. Prota, A.; Manfredi, G.; Cosenza, E. Ultimate behavior of axially loaded RC wall-like columns confined with GFRP. Compos. Part B Eng. 2006, 37, 670–678. [Google Scholar] [CrossRef]
  6. Li, L.; Guo, Y.; Liu, F.; Bungey, J. An experimental and numerical study of the effect of thickness and length of CFRP on performance of repaired reinforced concrete beams. Constr. Build. Mater. 2006, 20, 901–909. [Google Scholar] [CrossRef]
  7. Ţăranu, N.; Oprişan, G.; Enţuc, I.; Munteanu, V.; Cozmanciuc, C. The Efficiency of Fiber Reinforced Polymer Composites Solutions in the Construction Industry. In Proceedings of the 6th International Conference on Management of Technological Changes, MTC, Alexandroupolis, Greece, 3–5 September 2009; pp. 733–736. [Google Scholar]
  8. De Lorenzis, L.; Tepfers, R. Comparative study of models on confinement of concrete cylinders with fiber-reinforced polymer composites. J. Compos. Constr. 2003, 7, 219–237. [Google Scholar] [CrossRef]
  9. Takemura, H.K.K. Effect of loading hysteresis on ductility capacity of reinforced concrete bridge piers. J. Struct. Eng. 1997, 43, 849–858. [Google Scholar]
  10. Hoshikuma, J.; Kawashima, K.; Nagaya, K.; Taylor, A.W. Stress-strain model for confined reinforced concrete in bridge piers. J. Struct. Eng. 1997, 123, 624–633. [Google Scholar] [CrossRef]
  11. Kawashima, K.; Shoji, G.; Sakakibara, Y. A cyclic loading test for clarifying the plastic hinge length of reinforced concrete piers. J. Struct. Eng. 2000, 46, 767–776. [Google Scholar]
  12. Saeed, H.Z.; Ahmed, A.; Ali, S.M.; Iqbal, M. Experimental and finite element investigation of strengthened LSC bridge piers under Quasi-Static Cyclic Load Test. Compos. Struct. 2015, 131, 556–564. [Google Scholar] [CrossRef]
  13. Tahir, M.F.; Ahmad, A.; Iqbal, M. Seismic Evaluation of Repaired and Retrofitted Circular Bridge Piers of Low-Strength Concrete. Arab. J. Sci. Eng. 2015, 40, 3057–3066. [Google Scholar]
  14. Khan, Q.U.; Ahmad, A.; Mehboob, S.; Iqbal, M. Energy dissipation characteristics of retrofitted damaged low strength concrete bridge pier. In Proceedings of the Institution of Civil Engineers—Bridge Engineering; Thomas Telford Services Ltd.: London, UK, 2020; pp. 1–29. [Google Scholar]
  15. Ahmad, A.; Mehboob, S.; Nouman, M. Experimental and numerical investigation of T-joint enhanced confinement using flat steel strips. Asian J. Civ. Eng. 2020, 21, 1–10. [Google Scholar]
  16. Raza, A.; Khan, Q.U.; Ahmad, A. Prediction of Axial Compressive Strength for FRP-Confined Concrete Compression Members. KSCE J. Civ. Eng. 2020. [Google Scholar] [CrossRef]
  17. Ann, K.; Cho, C.-G. Constitutive behavior and finite element analysis of FRP composite and concrete members. Materials 2013, 6, 3978–3988. [Google Scholar] [CrossRef] [Green Version]
  18. Cascardi, A.; Micelli, F.; Aiello, M.A. An Artificial Neural Networks model for the prediction of the compressive strength of FRP-confined concrete circular columns. Eng. Struct. 2017, 140, 199–208. [Google Scholar] [CrossRef]
  19. Naderpour, H.; Nagai, K.; Fakharian, P.; Haji, M. Innovative models for prediction of compressive strength of FRP-confined circular reinforced concrete columns using soft computing methods. Compos. Struct. 2019, 215, 69–84. [Google Scholar] [CrossRef]
  20. Stamopoulos, A.; Tserpes, K.; Dentsoras, A. Quality assessment of porous CFRP specimens using X-ray Computed Tomography data and Artificial Neural Networks. Compos. Struct. 2018, 192, 327–335. [Google Scholar] [CrossRef]
  21. Micelli, F.; Cascardi, A.; Aiello, M.A. A Study on FRP-Confined Concrete in Presence of Different Preload Levels. In Proceedings of the 9th International Conference on Fibre-Reinforced Polymer (FRP) Composites in Civil Engineering—CICE, Paris, France, 17–19 July 2018; pp. 17–19. [Google Scholar]
  22. Ghiassi, M.; Saidane, H.; Zimbra, D. A dynamic artificial neural network model for forecasting time series events. Int. J. Forecast. 2005, 21, 341–362. [Google Scholar] [CrossRef]
  23. Cascardi, A.; Micelli, F.; Aiello, M. Analytical model based on artificial neural network for masonry shear walls strengthened with FRM systems. Compos. Part B Eng. 2016, 95, 252–263. [Google Scholar] [CrossRef]
  24. Liu, H.-J.; Xue, X.-H. Artificial neural network model for prediction of seismic liquefaction of sand soil. Rock Soil Mech. 2004, 12. Available online: http://en.cnki.com.cn/Article_en/CJFDTotal-YTLX20041200G.htm (accessed on 13 September 2020).
  25. Cevik, A.; Cabalar, A.F. A genetic-programming-based formulation for the strength enhancement of fiber-reinforced-polymer-confined concrete cylinders. J. Appl. Polym. Sci. 2008, 110, 3087–3095. [Google Scholar] [CrossRef]
  26. Cevik, A.; Guzelbey, I.H. Neural network modeling of strength enhancement for CFRP confined concrete cylinders. Build. Environ. 2008, 43, 751–763. [Google Scholar] [CrossRef]
  27. Cevik, A.; Göğüş, M.T.; Güzelbey, İ.H.; Filiz, H. Soft computing based formulation for strength enhancement of CFRP confined concrete cylinders. Adv. Eng. Softw. 2010, 41, 527–536. [Google Scholar] [CrossRef]
  28. Naderpour, H.; Kheyroddin, A.; Amiri, G.G. Prediction of FRP-confined compressive strength of concrete using artificial neural networks. Compos. Struct. 2010, 92, 2817–2829. [Google Scholar] [CrossRef]
  29. Wu, Y.-B.; Jin, G.-F.; Ding, T.; Meng, D. Modeling confinement efficiency of FRP-confined concrete column using radial basis function neural network. In Proceedings of the 2nd International Workshop on Intelligent Systems and Applications (ISA), Wuhan, China, 22–23 May 2010; pp. 1–6. [Google Scholar]
  30. Cevik, A. Modeling strength enhancement of FRP confined concrete cylinders using soft computing. Expert Syst. Appl. 2011, 38, 5662–5673. [Google Scholar] [CrossRef]
  31. Oreta, A.W.; Ongpeng, J. Modeling the confined compressive strength of hybrid circular concrete columns using neural networks. Comput. Concr. 2011, 8, 597–616. [Google Scholar] [CrossRef]
  32. Elsanadedy, H.; Al-Salloum, Y.; Abbas, H.; Alsayed, S.H. Prediction of strength parameters of FRP-confined concrete. Compos. Part B Eng. 2012, 43, 228–239. [Google Scholar] [CrossRef]
  33. Jalal, M.; Ramezanianpour, A.A. Strength enhancement modeling of concrete cylinders confined with CFRP composites using artificial neural networks. Compos. Part B Eng. 2012, 43, 2990–3000. [Google Scholar] [CrossRef]
  34. Mashrei, M.A.; Seracino, R.; Rahman, M.J.C.; Materials, B. Application of artificial neural networks to predict the bond strength of FRP-to-concrete joints. Constr. Build. Mater. 2013, 40, 812–821. [Google Scholar] [CrossRef]
  35. Pham, T.M.; Hadi, M.N. Predicting stress and strain of FRP-confined square/rectangular columns using artificial neural networks. J. Compos. Constr. 2014, 18, 04014019. [Google Scholar] [CrossRef] [Green Version]
  36. Di Trapani, F.; Malavisi, M.; Marano, G.C.; Sberna, A.P.; Greco, R. Optimal seismic retrofitting of reinforced concrete buildings by steel-jacketing using a genetic algorithm-based framework. Eng. Struct. 2020, 219, 110864. [Google Scholar] [CrossRef]
  37. Papavasileiou, G.S.; Charmpis, D.C.; Lagaros, N.D. Optimized seismic retrofit of steel-concrete composite buildings. Eng. Struct. 2020, 213, 110573. [Google Scholar] [CrossRef]
  38. Falcone, R.; Carrabs, F.; Cerulli, R.; Lima, C.; Martinelli, E. Seismic retrofitting of existing RC buildings: A rational selection procedure based on Genetic Algorithms. In Structures; Elsevier: Amsterdam, The Netherlands; pp. 310–326.
  39. Cavaleri, L.; Trapani, F.; Ferrotto, M.; Davi, L. Stress-strain models for normal and high strength confined concrete: Test and comparison of literature models reliability in reproducing experimental results. Ing. Sismica 2017, 34, 114–137. [Google Scholar]
  40. Ahmad, A.; Raza, A. Reliability analysis of strength models for CFRP-confined concrete cylinders. Compos. Struct. 2020, 244, 112312. Available online: https://www.sciencedirect.com/science/article/pii/S0263822319327503 (accessed on 13 September 2020). [CrossRef]
  41. Raza, A.; Ahmad, A. Reliability analysis of proposed capacity equation for predicting the behavior of steel-tube concrete columns confined with CFRP sheets. Comput. Concr. 2020, 25, 383–400. [Google Scholar]
  42. Karbhari, V.M.; Gao, Y. Composite jacketed concrete under uniaxial compression—Verification of simple design equations. J. Mater. Civ. Eng. 1997, 9, 185–193. [Google Scholar] [CrossRef]
  43. Miyauchi, K.; Inoue, S.; Kuroda, T.; Kobayashi, A. Strengthening effects of concrete column with carbon fiber sheet. Trans. Jpn. Concr. Inst. 2000, 21, 143–150. [Google Scholar]
  44. Lam, L.; Teng, J. Design-oriented stress-strain model for FRP-confined concrete. Constr. Build. Mater. 2003, 17, 471–489. [Google Scholar] [CrossRef]
  45. Mander, J.B.; Priestley, M.J.; Park, R. Theoretical stress-strain model for confined concrete. J. Struct. Eng. 1988, 114, 1804–1826. [Google Scholar] [CrossRef] [Green Version]
  46. Bisby, L.A.; Dent, A.J.S.; Green, M.F. Comparison of confinement models for fiber-reinforced polymer-wrapped concrete. ACI Struct. J. 2005, 102, 62–72. [Google Scholar]
  47. Ashrafi, H.R.; Jalal, M.; Garmsiri, K. Prediction of load–displacement curve of concrete reinforced by composite fibers (steel and polymeric) using artificial neural network. Expert Syst. Appl. 2010, 37, 7663–7668. [Google Scholar] [CrossRef]
  48. Asteris, P.G.; Plevris, V. Anisotropic masonry failure criterion using artificial neural networks. Neural Comput. Appl. 2017, 28, 2207–2229. [Google Scholar] [CrossRef]
  49. Lagaros, N.D.; Plevris, V.; Papadrakakis, M. Neurocomputing strategies for solving reliability-robust design optimization problems. Eng. Comput. 2010, 27, 819–840. [Google Scholar] [CrossRef]
  50. Plevris, V.; Asteris, P.G. Modeling of masonry failure surface under biaxial compressive stress using Neural Networks. J. Constr. Build. Mater. 2014, 55, 447–461. [Google Scholar] [CrossRef]
  51. Shah, V.S.; Shah, H.R.; Samui, P.; Murthy, A.R.; Merono, P.; Gomez, F.; Marin, F.; Zhang, W.; Ni, P.; Liu, B. Prediction of fracture parameters of high strength and ultra-high strength concrete beams using minimax probability machine regression and extreme learning machine. J. Comput. Mater. Contin. 2014, 44, 73–84. [Google Scholar]
  52. Zhuang, X.; Zhou, S. The Prediction of Self-Healing Capacity of Bacteria-Based Concrete Using Machine Learning Approaches. J. Comput. Mater. Contin. 2019, 1, 57–77. [Google Scholar] [CrossRef] [Green Version]
  53. Ghanizadeh, A.R.; Abbaslou, H.; Amlashi, A.T.; Alidoust, P. Modeling of bentonite/sepiolite plastic concrete compressive strength using artificial neural network and support vector machine. Front. Struct. Civ. Eng. 2019, 13, 215–239. [Google Scholar] [CrossRef]
  54. Yuvaraj, P.; Murthy, A.R.; Iyer, N.R.; Sekar, S.; Samui, P. ANN model to predict fracture characteristics of high strength and ultra high strength concrete beams. J. Comput. Mater. Contin. 2014, 41, 193–213. [Google Scholar]
  55. Yıldızel, S.; Öztürk, A. A study on the estimation of prefabricated glass fiber reinforced concrete panel strength values with an artificial neural network model. J. Comput. Mater. Contin. 2016, 52, 42–51. [Google Scholar]
  56. Yang, Q.; Du, S. Prediction of Concrete Cubic Compressive Strength Using ANN Based Size Effect Model. J. Comput. Mater. Contin. 2015, 47, 217–236. [Google Scholar]
  57. Khademi, F.; Akbari, M.; Jamal, S.M.; Nikoo, M. Multiple linear regression, artificial neural network, and fuzzy logic prediction of 28 days compressive strength of concrete. Front. Struct. Civ. Eng. 2017, 11, 90–99. [Google Scholar] [CrossRef]
  58. Reddy, T.C. Predicting the strength properties of slurry infiltrated fibrous concrete using artificial neural network. Front. Struct. Civ. Eng. 2018, 12, 490–503. [Google Scholar] [CrossRef]
  59. Samaan, M.; Mirmiran, A.; Shahawy, M. Model of concrete confined by fiber composites. J. Struct. Eng. 1998, 124, 1025–1031. [Google Scholar] [CrossRef]
  60. Matthys, S.; Toutanji, H.; Audenaert, K.; Taerwe, L. Axial load behavior of large-scale columns confined with fiber-reinforced polymer composites. ACI Struct. J. 2005, 102, 258. [Google Scholar]
  61. Teng, J.; Jiang, T.; Lam, L.; Luo, Y.Z. Refinement of a design-oriented stress-strain model for FRP-confined concrete. J. Compos. Constr. 2009, 13, 269–278. [Google Scholar] [CrossRef] [Green Version]
  62. Lim, J.C.; Karakus, M.; Ozbakkaloglu, T. Evaluation of ultimate conditions of FRP-confined concrete columns using genetic programming. Comput. Struct. 2016, 162, 28–37. [Google Scholar] [CrossRef]
  63. Fardis, M.N.; Khalili, H.H. FRP-encased concrete as a structural material. Mag. Concr. Res. 1982, 34, 191–202. [Google Scholar] [CrossRef]
  64. Bakis, C.E.; Ganjehlou, A.; Kachlakev, D.I.; Schupack, M.; Balaguru, P.; Gee, D.J.; Karbhari, V.M.; Scott, D.W.; Ballinger, C.A.; Gentry, T.R.; et al. Guide for the design and construction of externally bonded FRP systems for strengthening concrete structures (ACI-440.2R-02). Rep. ACI Comm. 2002. Available online: https://citeseerx.ist.psu.edu/viewdoc/download?doi=10.1.1.455.4053&rep=rep1&type=pdf (accessed on 13 September 2020).
  65. Toutanji, H. Stress-strain characteristics of concrete columns externally confined with advanced fiber composite sheets. Mater. J. 1999, 96, 397–404. [Google Scholar]
  66. Teng, J.G.; Yu, T.; Wong, Y.; Dong, S. Hybrid FRP-concrete-steel tubular columns: Concept and behavior. Constr. Build. Mater. 2007, 21, 846–854. [Google Scholar] [CrossRef]
  67. Saafi, M.; Toutanji, H.A.; Li, Z. Behavior of concrete columns confined with fiber reinforced polymer tubes. Mater. J. 1999, 96, 500–509. [Google Scholar]
  68. Richart, F.E.; Brandtzæg, A.; Brown, R.L. Failure of Plain and Spirally Reinforced Concrete in Compression; College of Engineering, University of Illinois at Urbana Champaign: Champaign, IL, USA, 1929. [Google Scholar]
  69. Newman, K.; Newman, J.B. Failure theories and design criteria for plain concrete. Struct. Solid Mech. Eng. Des. 1971, 963–995. Available online: https://www.abebooks.com/Structure-Solid-Mechanics-Engineering-Design-Proceedings/22384738675/bd (accessed on 14 September 2020).
  70. Miyauchi, K. Estimation of strengthening effects with carbon fiber sheet for concrete column. In Proceedings of the 3rd International Symposium on Non-Metallic (FRP) Reinforcement for Concrete Structures, Sapporo, Japan, 14–16 October 1997; pp. 217–224. [Google Scholar]
  71. Ahmad, A.; Kotsovou, G.; Cotsovos, D.M.; Lagaros, N.D. Assessing the accuracy of RC design code predictions through the use of artificial neural networks. Int. J. Adv. Struct. Eng. 2018. [Google Scholar] [CrossRef] [Green Version]
  72. Cladera, A.; Marí, A. Shear design procedure for reinforced normal and high-strength concrete beams using artificial neural networks. Part I: Beams without stirrups. Eng. Struct. 2004, 26, 917–926. [Google Scholar] [CrossRef]
  73. Cladera, A.; Mari, A. Shear design procedure for reinforced normal and high-strength concrete beams using artificial neural networks. Part II: Beams with stirrups. Eng. Struct. 2004, 26, 927–936. [Google Scholar] [CrossRef]
  74. LeCun, Y.A.; Bottou, L.; Orr, G.B.; Müller, K.-R. Efficient backprop. In Neural Networks: Tricks of the Trade; Springer: Berlin/Heidelberg, Germany, 2012; pp. 9–48. [Google Scholar]
  75. Ahmad, A.; Cotsovos, D.M.; Lagaros, N.D. Framework for the development of artificial neural networks for predicting the load carrying capacity of RC members. SN Appl. Sci. 2020, 2, 1–21. [Google Scholar] [CrossRef] [Green Version]
  76. Krogh, A.; Vedelsby, J. Neural Network Ensembles, Cross Validation, and Active Learning. Adv. Neyral Inf. Process. Syst. 1995, 7, 21–238. [Google Scholar]
  77. Utans, J.; Moody, J.; Rehfuss, S.; Siegelmann, H. Input Variable Selection for Neural Networks: Application to Predicting the U.S. Business Cycle. In Proceedings of the Conference on Computational Intelligence for Financial Engineering, New York, NY, USA, 9–11 April 1995; pp. 118–122. [Google Scholar]
  78. Castellano, G.; Fanelli, A.M. Variable Selection Using Neural-Network Models. Neurocomputing 2000, 31, 1–13. [Google Scholar] [CrossRef]
Figure 1. Mechanism of confinement in fiber-reinforced polymers (FRP)-confined concrete.
Crystals 10 00811 g001
Figure 2. A three-layer 4-3-3-2 back-propagation neural network (BPNN) (input typically not counted as a layer).
Crystals 10 00811 g002
Figure 3. A neuron with a single correlation coefficient (R)-element input vector.
Crystals 10 00811 g003
Figure 4. Performance of the various ANN models for the case of cylinders: (a) strength models (FANN); (b) strain models (EANN).
Crystals 10 00811 g004
Figure 5. Predictions of the six examined ANN models for strength.
Crystals 10 00811 g005
Figure 6. Predictions of the six examined ANN models for strain.
Crystals 10 00811 g006
Figure 7. Performance of previously proposed strength models of confined concrete on the developed database.
Crystals 10 00811 g007
Figure 8. Performance of previously proposed strain models of confined concrete on the developed database.
Crystals 10 00811 g008
Figure 9. Performance for strength, for: (a) the proposed analytical model; (b) the corresponding ANN model.
Crystals 10 00811 g009
Figure 10. Performance for strain, for: (a) the proposed analytical model; (b) the corresponding ANN model).
Crystals 10 00811 g010
Figure 11. Probability density functions (as normal distributions) for the various prediction models: (a) strength; (b) strain.
Crystals 10 00811 g011
Figure 12. Distribution of values for FRP-wrapped cylinders: (a) strength (fcc/fco); (b) strain (εccco).
Crystals 10 00811 g012
Table 2. Statistic properties of the parameters included in the constructed database of the strength model (708 samples).
MinMaxRangeMeanMedianStDevCV
D (mm)51406355153.33152.0043.150.281
H (mm)102812710306.86304.0086.320.281
nt (mm)0.095.95.810.880.471.041.182
Es (GPa)10663653174.68219.00118.800.680
fco (MPa)12.41188.2175.7942.4837.7022.380.527
fcc (MPa)18.5302.2283.776.2567.9135.000.459
Table 3. Statistic properties of the parameters included in the constructed database of the strain model (572 samples).
MinMaxRangeMeanMedianStDevCV
D (mm)51406355154.16152.0041.970.272
H (mm)102812710307.99304.0084.450.274
nt (mm)0.095.95.810.880.461.051.194
Es (GPa)10663653163.08118.34121.320.744
εco (%)0.1681.531.3620.2680.240.1460.543
εcc (%)0.334.624.291.3941.250.6450.462
Table 4. The five inputs and the single output of the neural network (NN) strength and strain models examined.
NN ModelInputs (5)Outputs (1)
Strength modelD, H, nt, Ef, fcofcc
Strain modelD, H, nt, Ef, εcoεcc
Table 5. Architectures of the examined artificial neural network (ANN) strength (F) and strain (E) models.
NN ModelNumber of Hidden LayersNumber of Neurons in the Hidden Layer(s)
FANN-1 and EANN-115
FANN-2 and EANN-2110
FANN-3 and EANN-325-5
FANN-4 and EANN-4210-10
FANN-5 and EANN-535-5-5
FANN-6 and EANN-6310-10-10
As will be shown in detail in the next sections, the best performance was the one of the third models for strength and the fourth model for the strain (FANN-3 and EANN-4), corresponding to 5 and 10 neurons in each of the two hidden layers, respectively. These have been highlighted in Table 5 with bold.
Table 6. Performance of the different ANN models for strength (values of fcc/fco) on the training data set.
MinMaxRangeMeanMedianStDevCV
Experimental (target values)1.023.902.891.921.760.660.345
FANN-10.704.263.561.931.790.650.335
FANN-20.883.852.971.921.790.600.315
FANN-3−0.063.994.051.911.760.630.328
FANN-4−0.793.954.741.931.800.650.334
FANN-51.084.042.961.921.760.610.315
FANN-60.723.893.171.911.770.610.321
Table 7. Performance of the different ANN models for strain (values of εcc/εco) on the training data set.
MinMaxRangeMeanMedianStDevCV
Experimental (target values)1.3817.2715.905.564.882.730.492
EANN-10.6411.6511.015.605.442.070.369
EANN-2−5.1114.4119.525.485.232.230.406
EANN-30.6318.9618.335.595.521.970.352
EANN-4−2.0419.0021.045.435.182.180.402
EANN-5−1.3619.2620.625.515.382.010.365
EANN-6−3.1910.7113.905.765.711.840.320
Table 8. Prediction performance of the different ANN models for strength and strain (for the normalized values of fcc/fco and εccco, respectively.
Strength ModelsStrain Models
ModelR (%)MSE (‰)MAE (%)ModelR (%)MSE (‰)MAE (%)
FANN-189.76.816.02EANN-173.88.616.89
FANN-290.56.105.76EANN-272.19.256.99
FANN-391.25.685.45EANN-367.810.247.00
FANN-489.86.745.38EANN-471.99.296.80
FANN-588.67.286.10EANN-566.410.687.05
FANN-690.76.005.64EANN-668.910.037.59

