Library of UV-Visible Absorption Spectra of Rare Earth Orthophosphates, LnPO4 (Ln = La-Lu, except Pm)

 , ,
, ,  and
and
Abstract
1. Introduction
2. Materials and Methods
2.1. Single Crystal Growth
2.2. Instrumentation
3. Results and Discussion
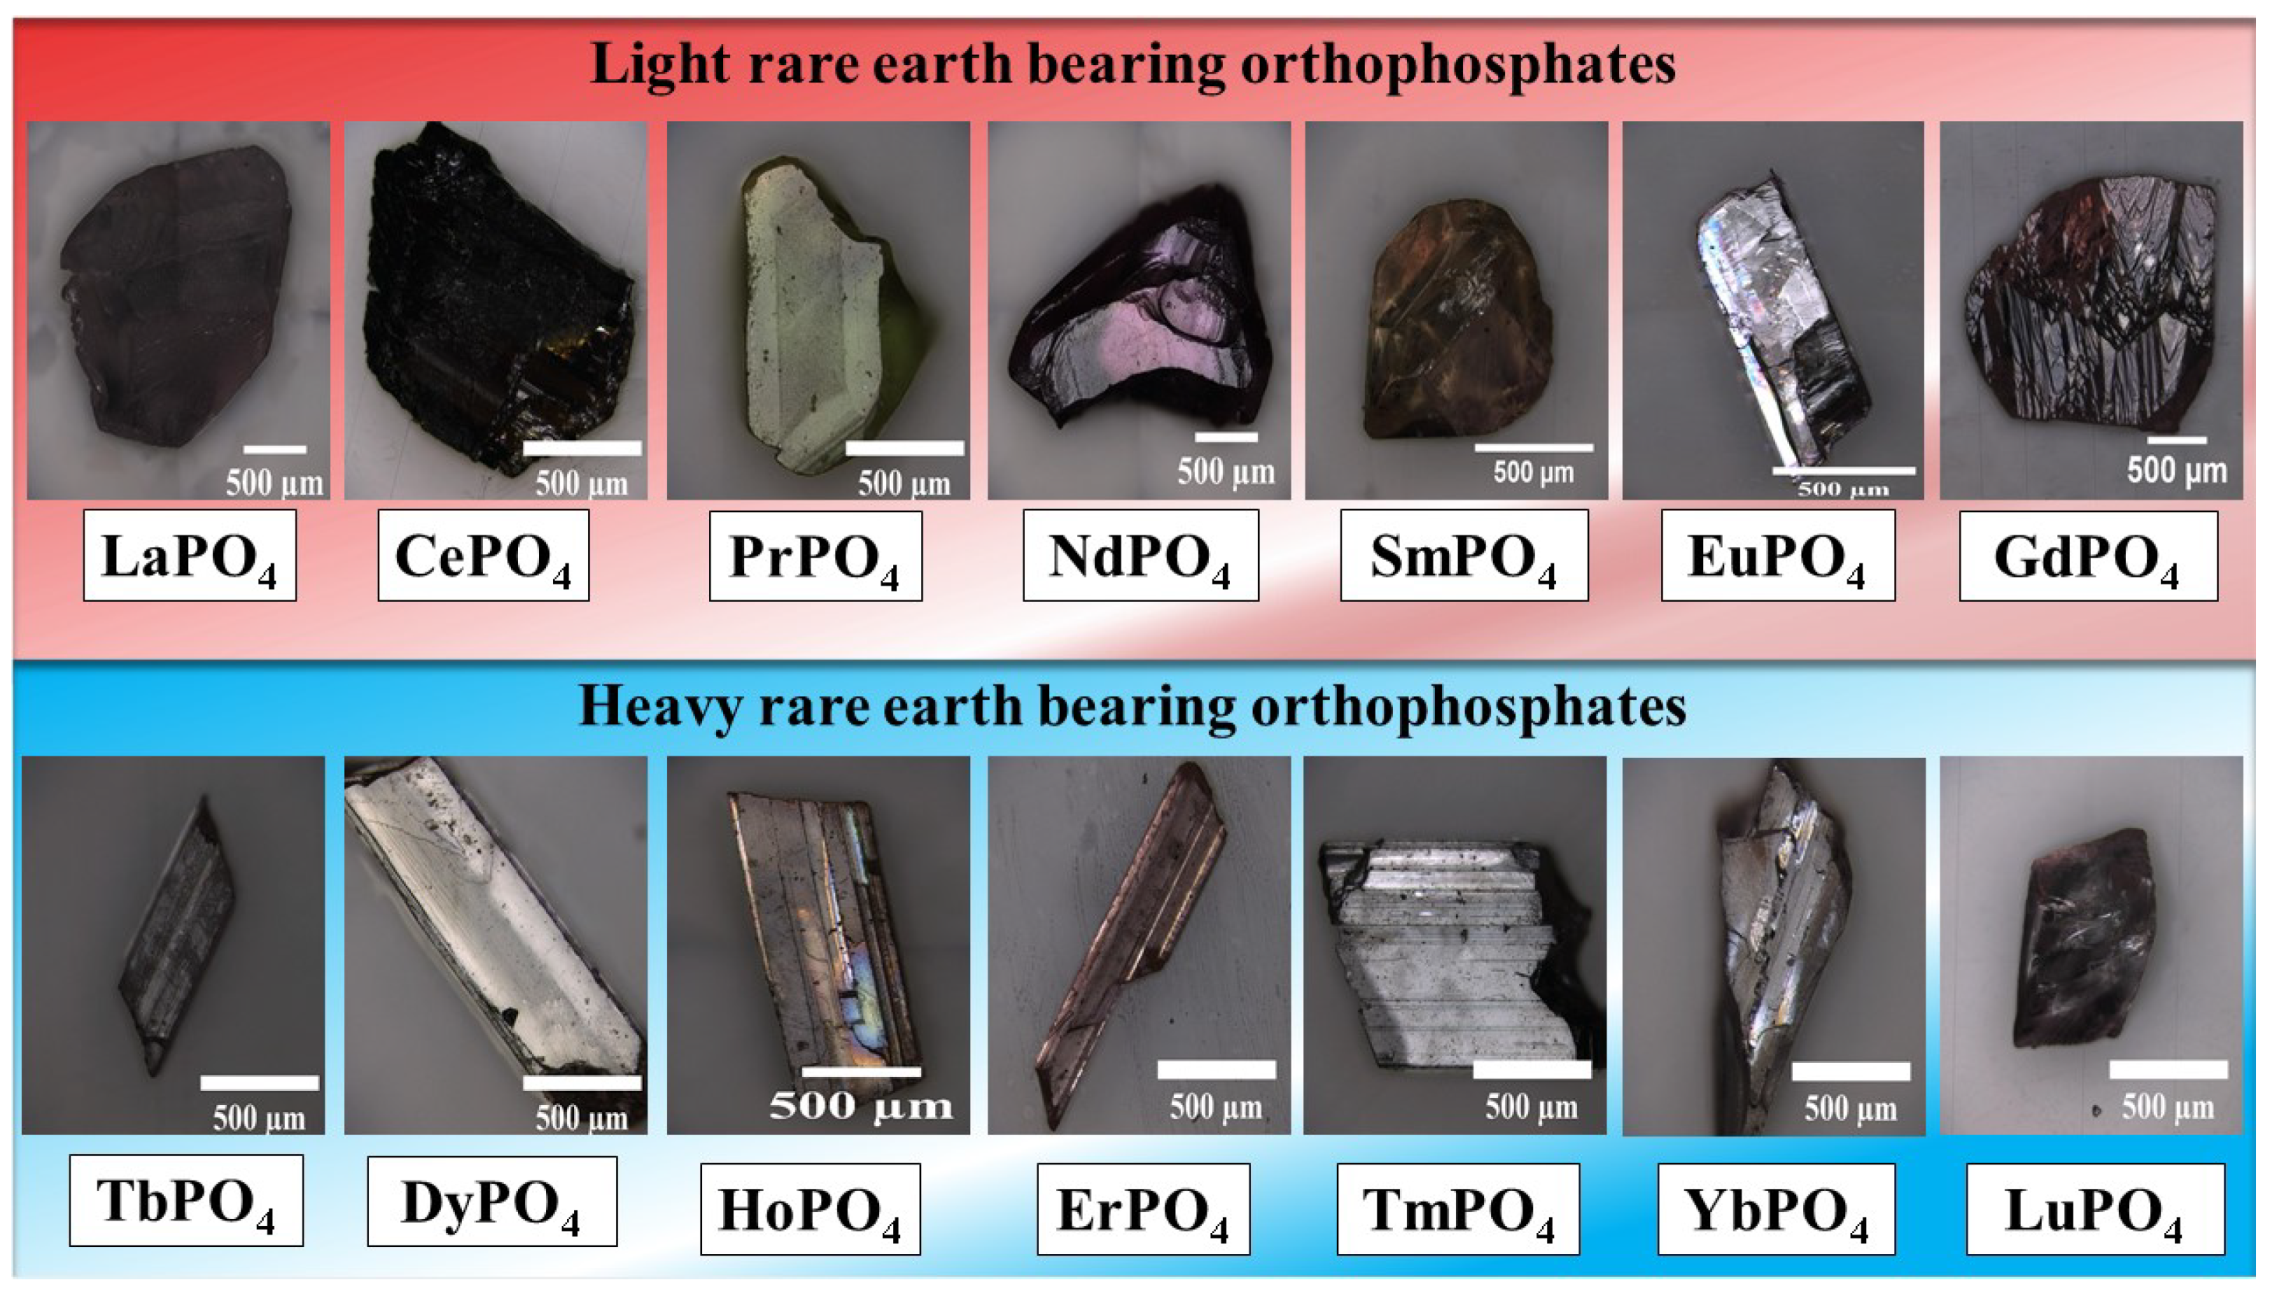
3.1. Surface Investigation
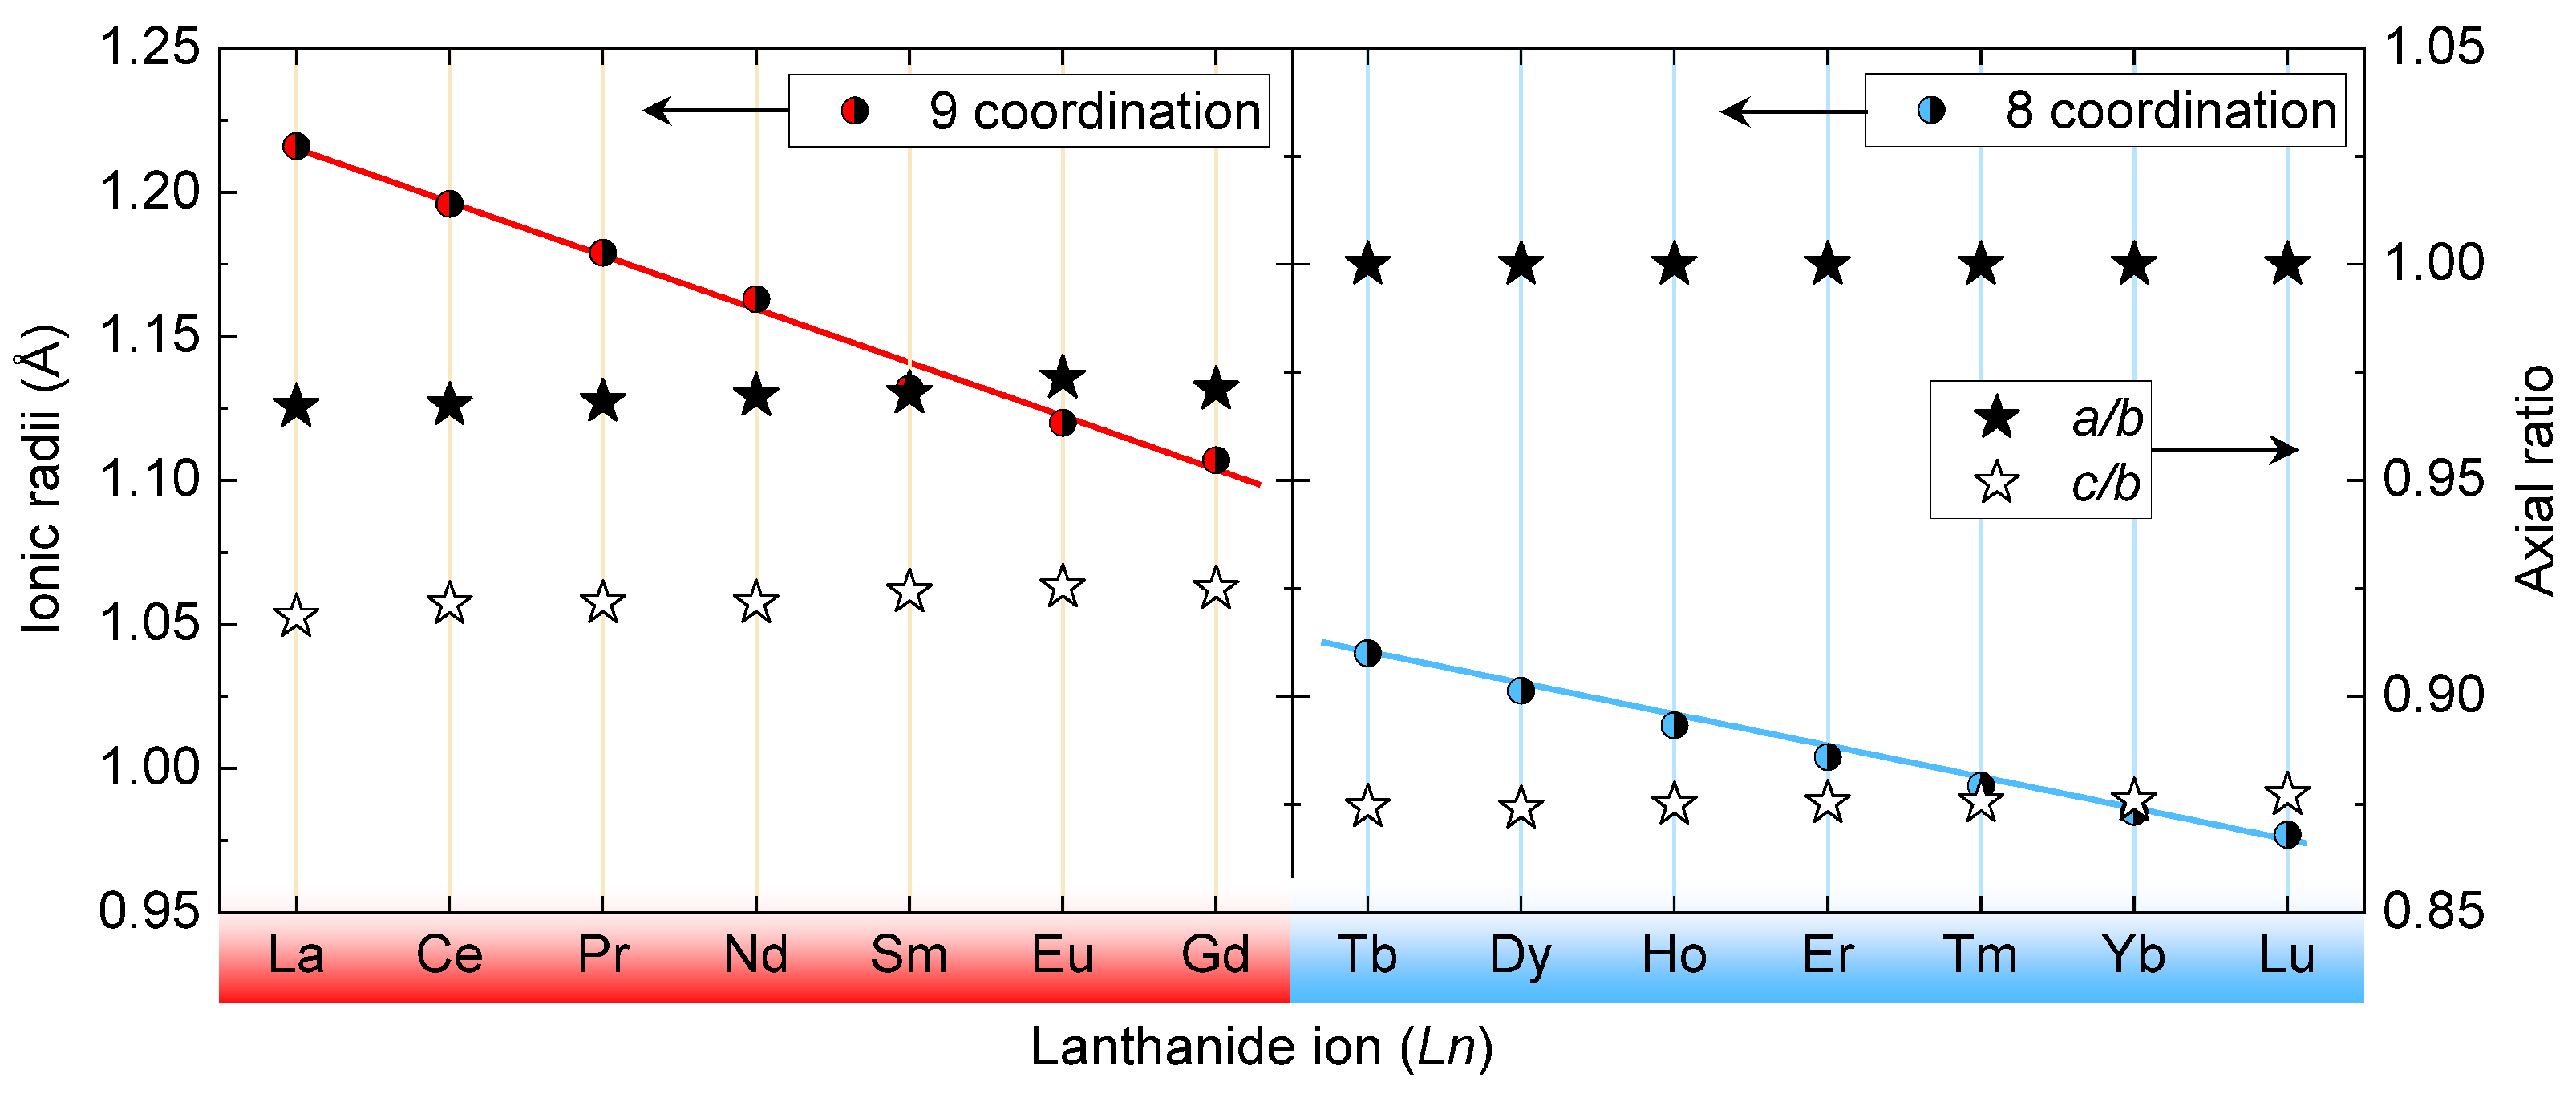
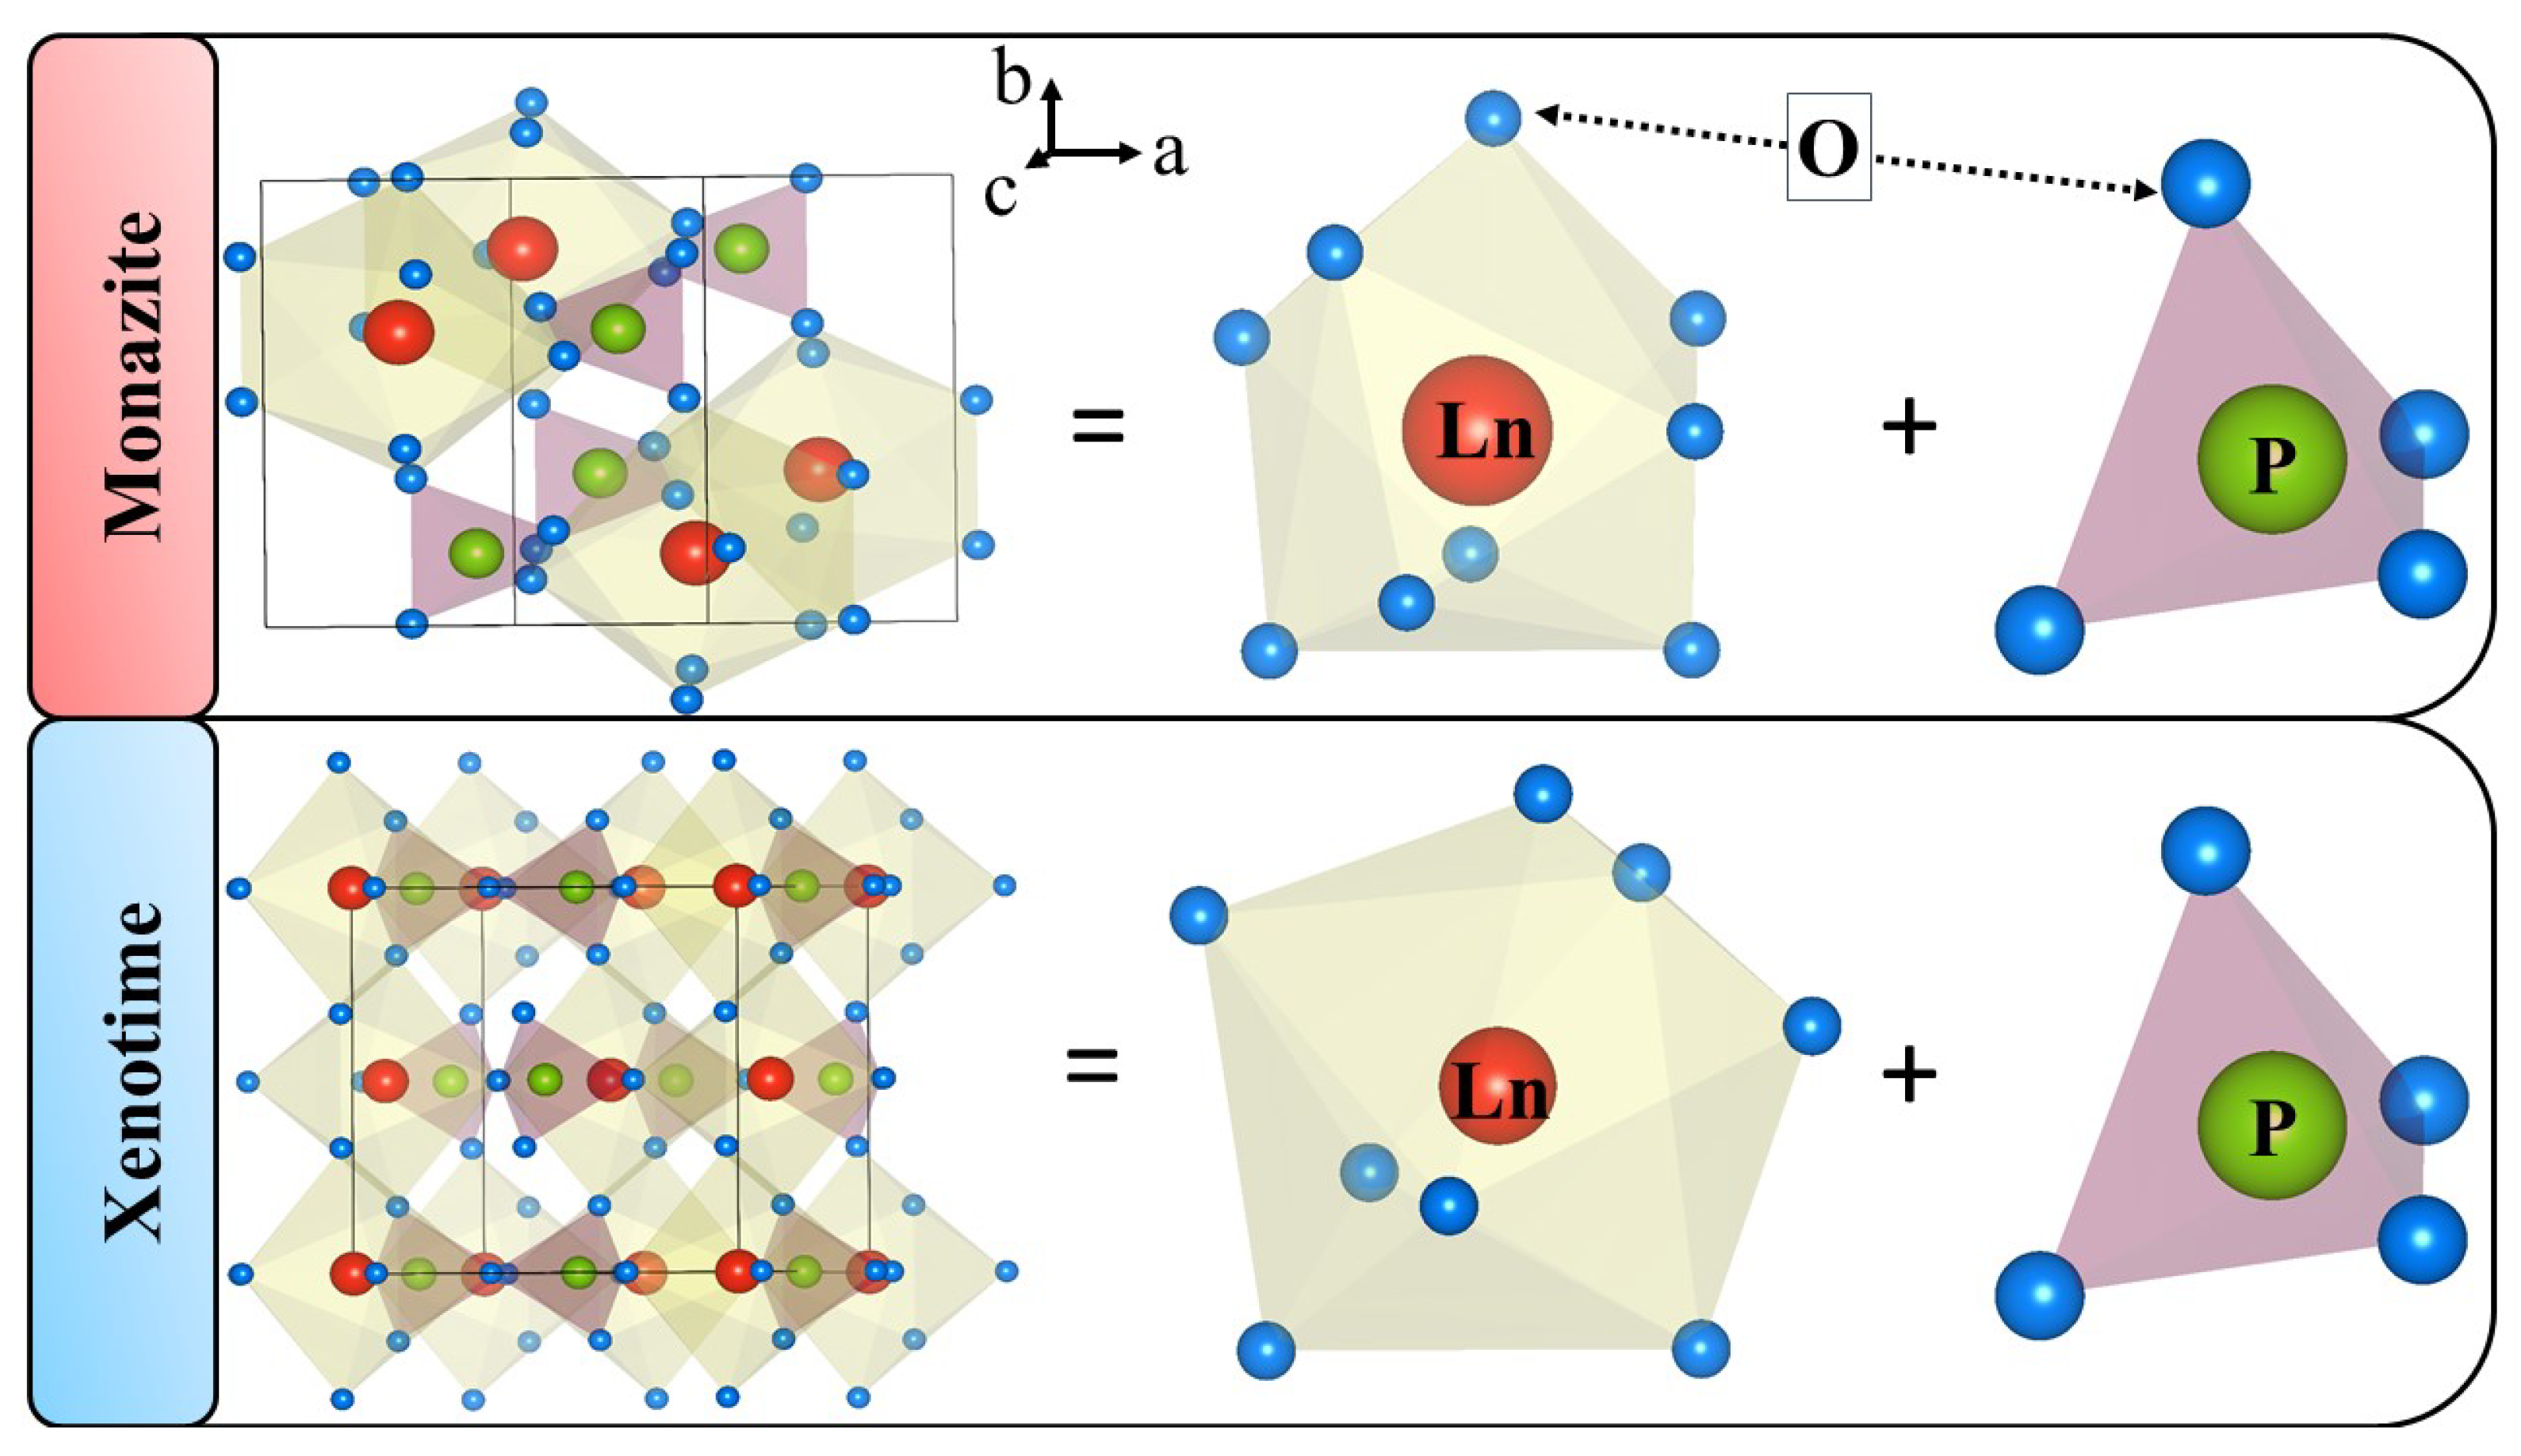
3.2. Structural Evaluation
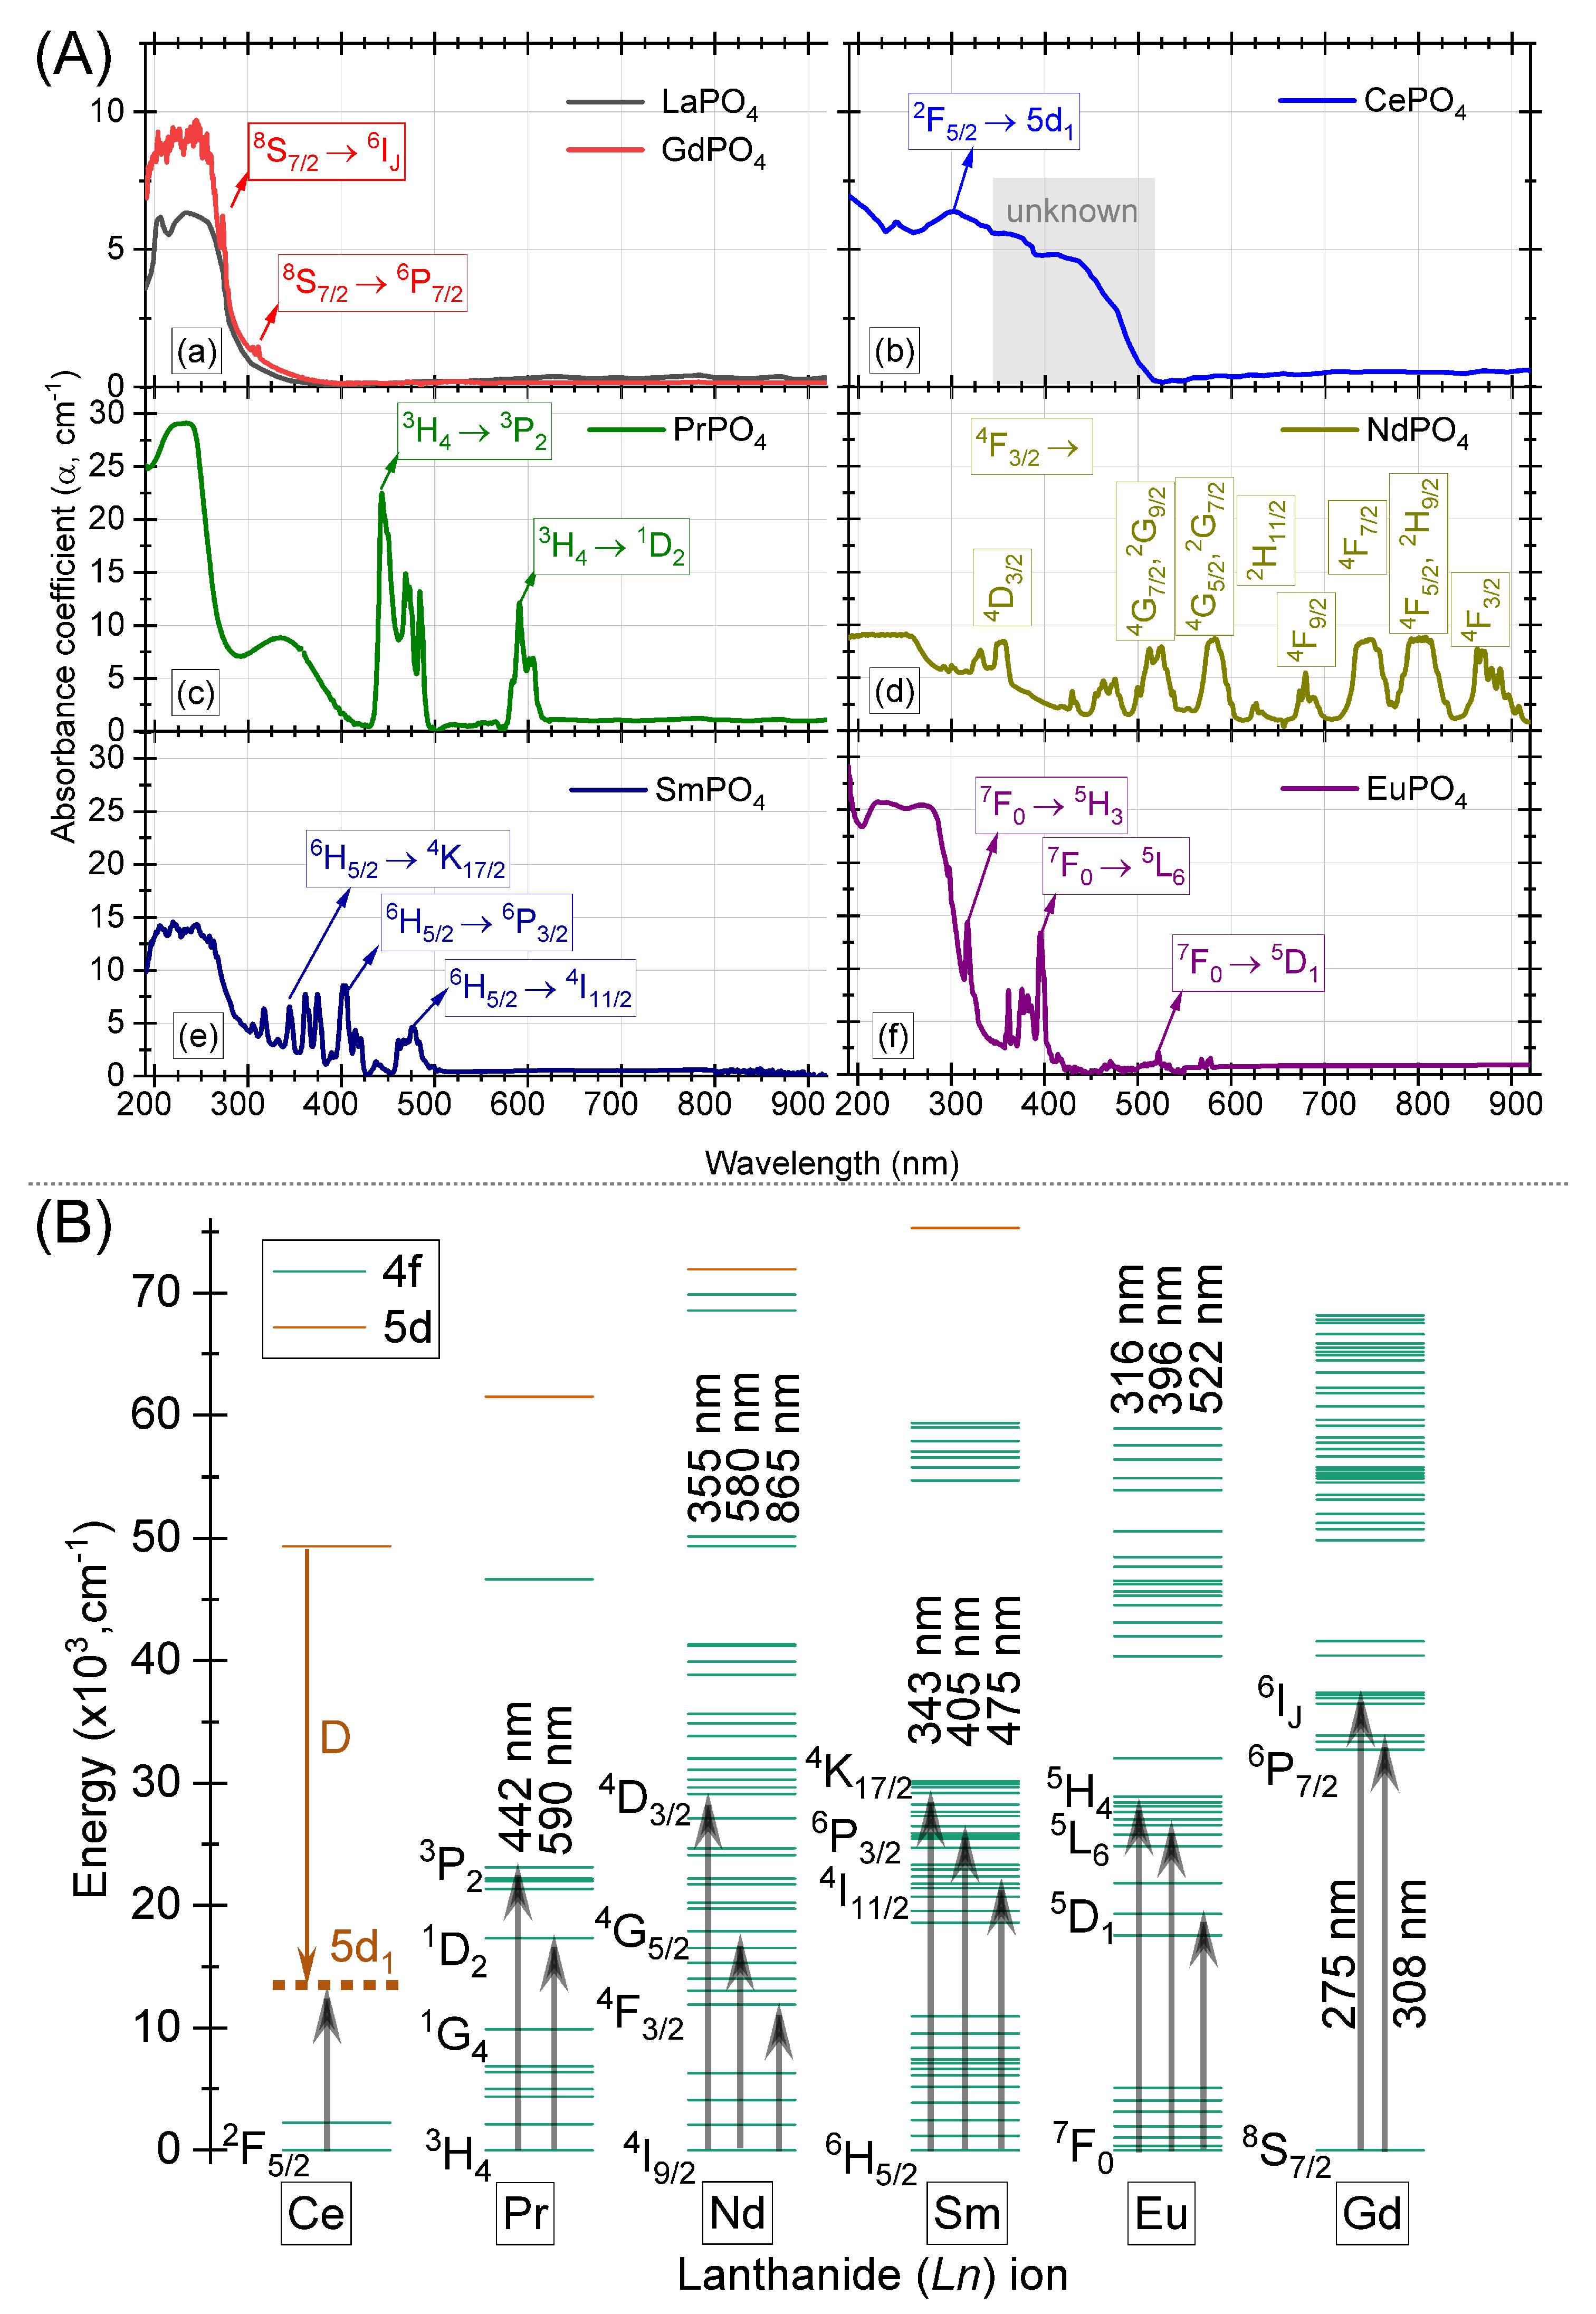
3.3. Absorption Spectra
3.3.1. Light Bearing Orthophosphates
LaPO4 and GdPO4
CePO4
PrPO4
NdPO4
SmPO4
EuPO4
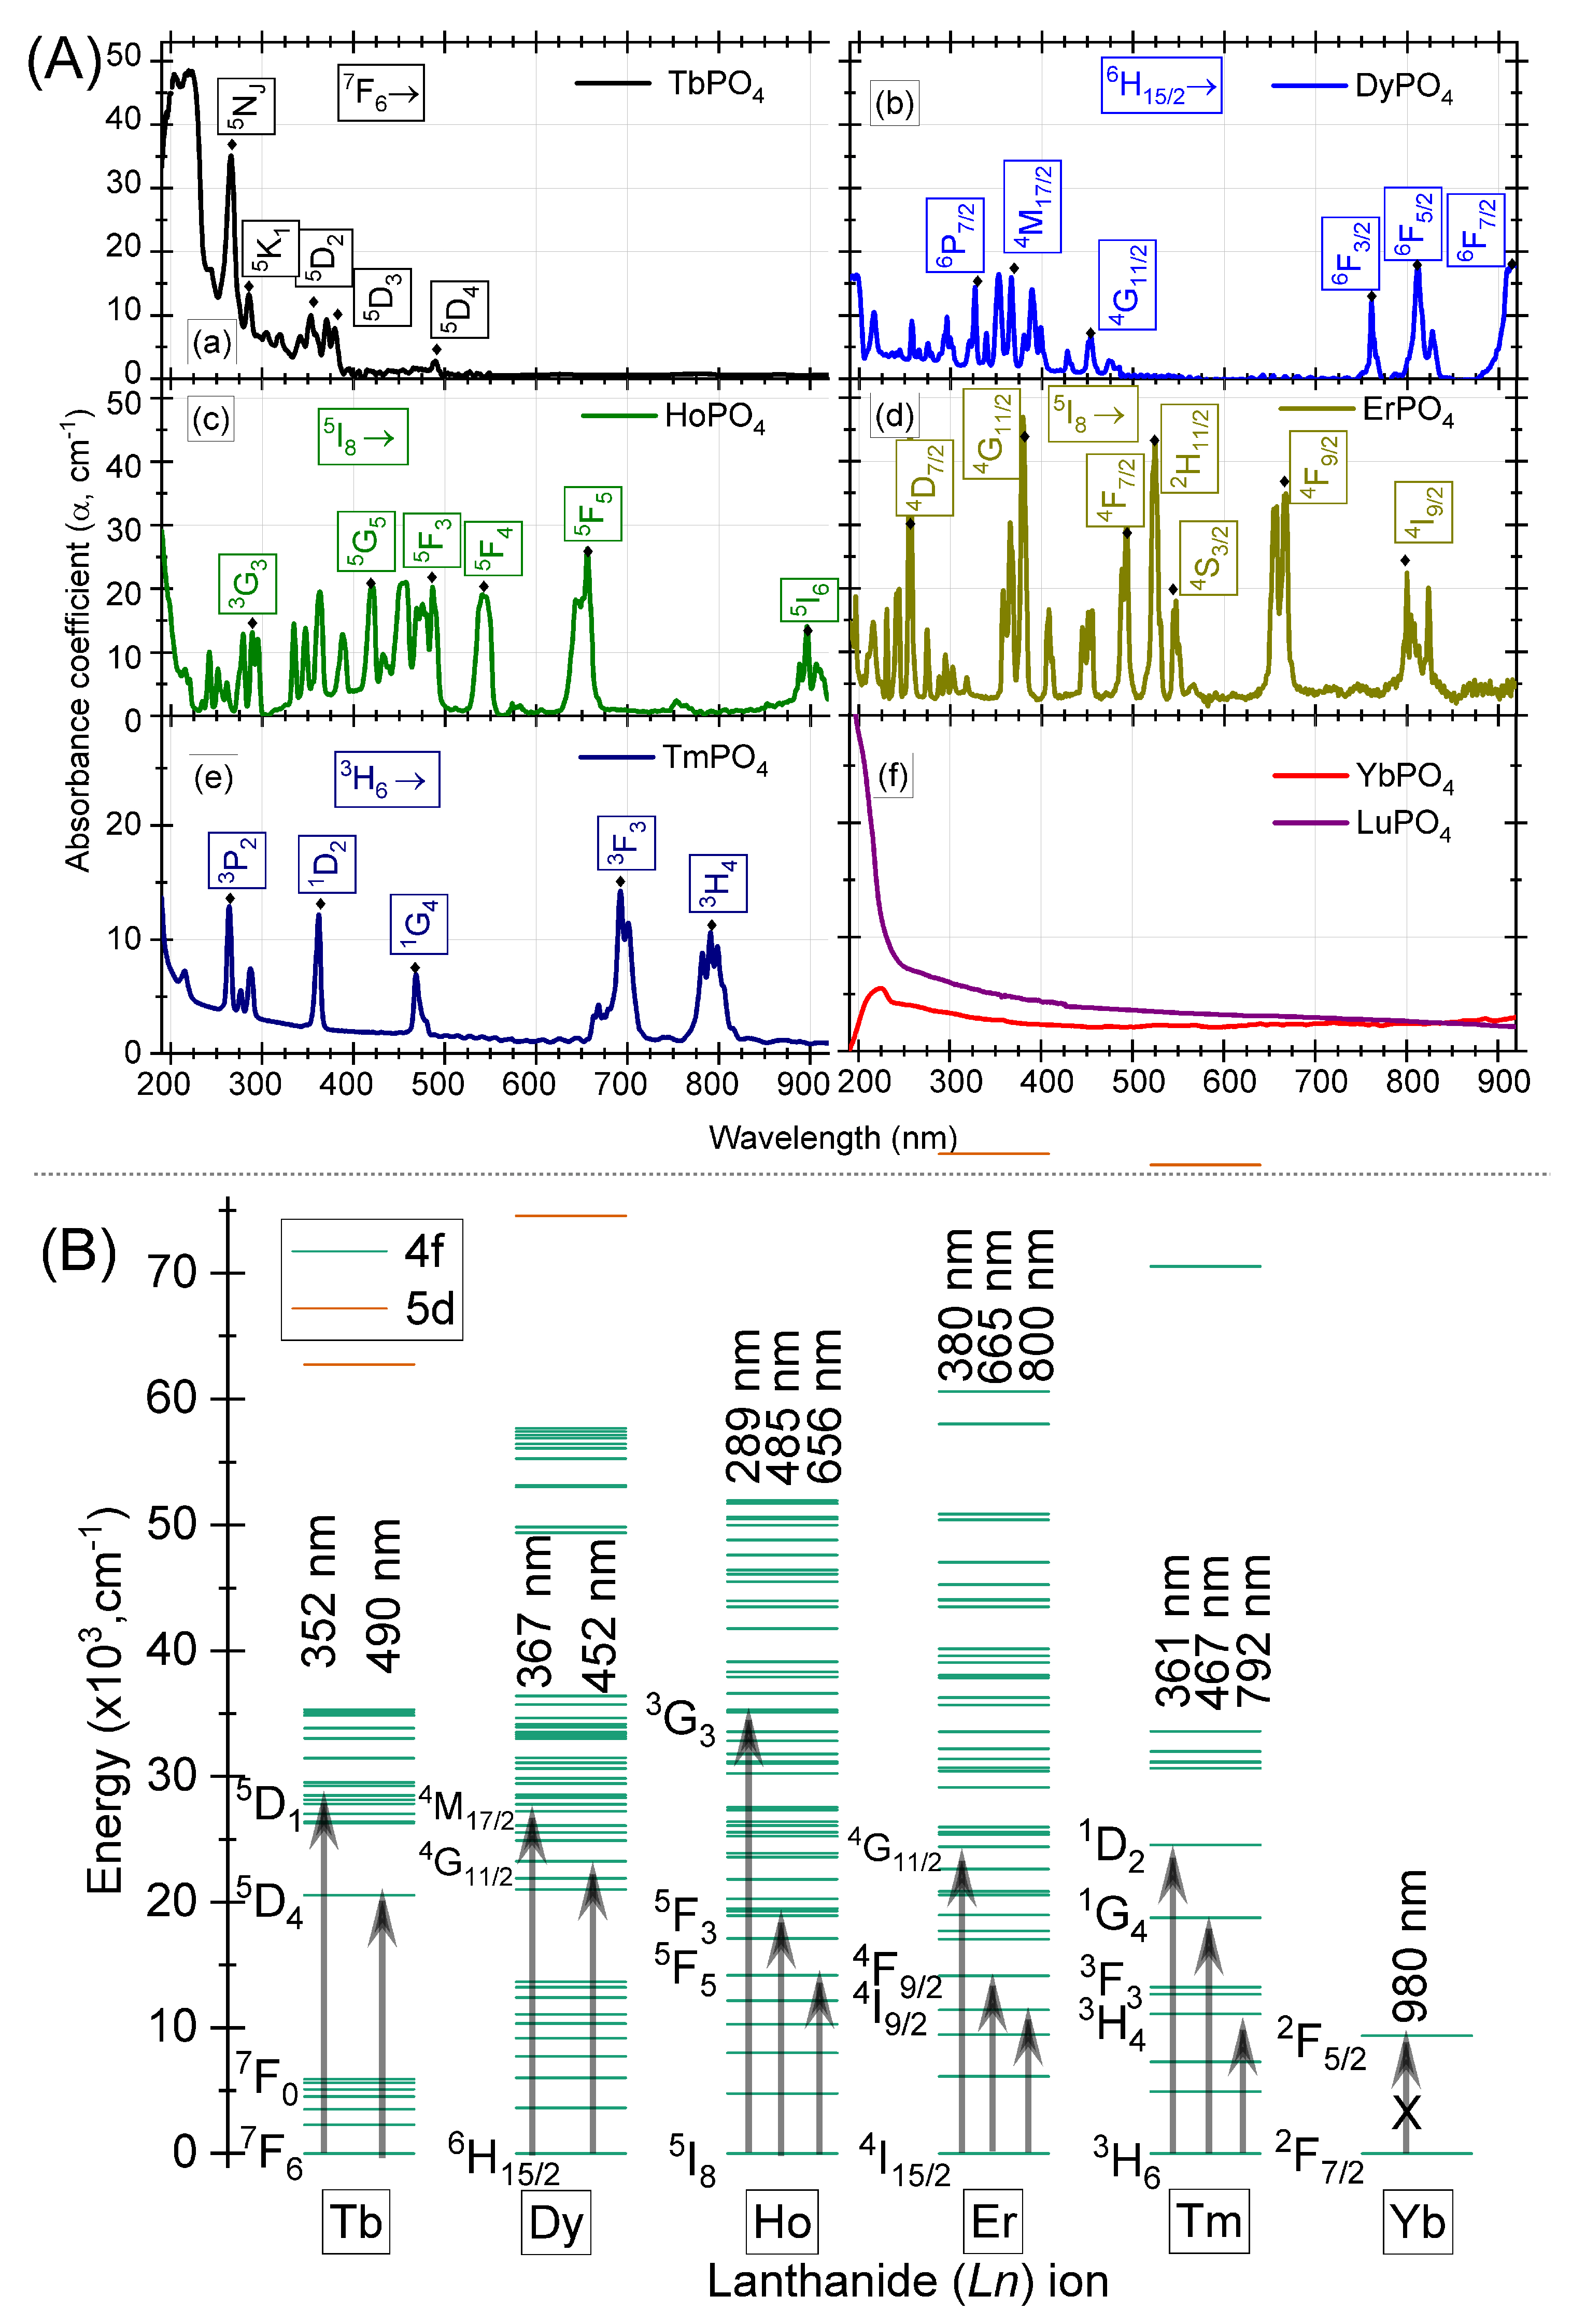
3.3.2. Heavy Bearing Orthophosphates
TbPO4
DyPO4
HoPO4
ErPO4
TmPO4
YbPO4 and LuPO4
4. Conclusions
- All the orthophosphates can be categorized with either or structure for light and heavy bearing PO hosts, respectively.
- All the orthophosphates have a bandgap greater than 8.00 eV, with a change of ∼0.60 eV for LuPO when compared to LaPO.
- The PO does not absorb wavelengths >200 nm with a peak absorption ∼180 nm. The absorption peak around 275 nm as observed mostly for light rare earth bearing orthophosphates, can be assigned to the defect absorption in the host lattice (charge transfer from an oxygen belonging to PO center and/or oxygen vacancy).
- Some of the orthophosphates were already explored for numerous applications and the host possesses a fantastic opportunity for researchers working in the field.
- For the PO hosts, where the oxygen atoms are covalently bonded within the phosphate group, the luminescence efficiency is expected to be much lower. This is due to inherently higher saturation of charge within the PO groups when compared to a single oxygen atom whose 2p shells remain unfilled in an ionic matrix.
Author Contributions
Funding
Acknowledgments
Conflicts of Interest
References
- Haque, N.; Hughes, A.; Lim, S.; Vernon, C. Rare Earth Elements: Overview of Mining, Mineralogy, Uses, Sustainability and Environmental Impact. Resources 2014, 3, 614–635. [Google Scholar] [CrossRef]
- Achary, S.; Bevara, S.; Tyagi, A. Recent progress on synthesis and structural aspects of rare-earth phosphates. Coord. Chem. Rev. 2017, 340, 266–297. [Google Scholar] [CrossRef]
- Bao, Z.; Zhao, Z. Geochemistry of mineralization with exchangeable REY in the weathering crusts of granitic rocks in South China. Ore Geol. Rev. 2008, 33, 519–535. [Google Scholar] [CrossRef]
- Sharma, S.K.; Beyer, J.; Gloaguen, R.; Heitmann, J. Non-quenching photoluminescence emission up to at least 865 K upon near-UV excitation in a single crystal of orange-red emitting SmPO4. Phys. Chem. Chem. Phys. 2019, 21, 25669–25677. [Google Scholar] [CrossRef]
- Sharma, S.K.; Kohler, T.; Beyer, J.; Fuchs, M.; Gloaguen, R.; Heitmann, J. Extending the temperature sensing range using Eu3+ luminescence up to 865 K in a single crystal of EuPO4. Phys. Chem. Chem. Phys. 2019, 21, 16329–16336. [Google Scholar] [CrossRef]
- Sharma, S.K.; Beyer, J.; Gloaguen, R.; Heitmann, J. Comparing the optical properties and thermal stability of green (TbPO4), yellow (DyPO4), and red (PrPO4) emitting single crystal samples. Phys. Chem. Chem. Phys. 2020, 22, 10247–10255. [Google Scholar] [CrossRef]
- Williams, M.L.; Jercinovic, M.J.; Hetherington, C.J. Microprobe Monazite Geochronology: Understanding Geologic Processes by Integrating Composition and Chronology. Annu. Rev. Earth Planet. Sci. 2007, 35, 137–175. [Google Scholar] [CrossRef]
- Andrehs, G.; Heinrich, W. Experimental determination of REE distributions between monazite and xenotime: Potential for temperature-calibrated geochronology. Chem. Geol. 1998, 149, 83–96. [Google Scholar] [CrossRef]
- Mogilevsky, P. On the miscibility gap in monazite–xenotime systems. Phys. Chem. Miner. 2007, 34, 201–214. [Google Scholar] [CrossRef]
- Yu, R.; De Jonghe, L.C. Proton-Transfer Mechanism in LaPO4. J. Phys. Chem. C 2007, 111, 11003–11007. [Google Scholar] [CrossRef]
- Lempicki, A.; Berman, E.; Wojtowicz, A.J.; Balcerzyk, M.; Boatner, L.A. Cerium-doped orthophosphates: New promising scintillators. IEEE Trans. Nucl. Sci. 1993, 40, 384–387. [Google Scholar] [CrossRef]
- Onoda, H.; Nariai, H.; Moriwaki, A.; Maki, H.; Motooka, I. Formation and catalytic characterization of various rare earth phosphates. J. Mater. Chem. 2002, 12, 1754–1760. [Google Scholar] [CrossRef]
- Ratnakaram, Y.; Naidu, D.T.; Vijayakumar, A.; Rao, J. Studies on optical absorption and luminescence properties of Dy3+ doped mixed alkali borate glasses. Opt. Mater. 2004, 27, 409–417. [Google Scholar] [CrossRef]
- Laporta, P.; Taccheo, S.; Longhi, S.; Svelto, O.; Svelto, C. Erbium-ytterbium microlasers: Optical properties and lasing characteristics. Opt. Mater. 1999, 11, 269–288. [Google Scholar] [CrossRef]
- Ewing, R.C. Metamict mineral alteration: An implication for radioactive waste disposal. Science 1976, 192, 1336–1337. [Google Scholar] [CrossRef] [PubMed]
- Neumeier, S.; Arinicheva, Y.; Ji, Y.; Heuser, J.M.; Kowalski, P.M.; Kegler, P.; Schlenz, H.; Bosbach, D.; Deissmann, G. New insights into phosphate based materials for the immobilisation of actinides. Radiochim. Acta 2017, 105. [Google Scholar] [CrossRef]
- Ewing, R.C.; Wang, L. Phosphates as Nuclear Waste Forms. Rev. Mineral. Geochem. 2002, 48, 673–699. [Google Scholar] [CrossRef]
- Stoll, W. Thorium and Thorium Compounds. In Ullmann’s Encyclopedia of Industrial Chemistry; American Cancer Society: Atlanta, GA, USA, 2000. [Google Scholar] [CrossRef]
- Lumpkin, G.; Geisler-Wierwille, T. 5.22—Minerals and Natural Analogues. In Comprehensive Nuclear Materials; Konings, R.J., Ed.; Elsevier: Oxford, UK, 2012; pp. 563–600. [Google Scholar] [CrossRef]
- Ji, Y.; Kowalski, P.M.; Kegler, P.; Huittinen, N.; Marks, N.A.; Vinograd, V.L.; Arinicheva, Y.; Neumeier, S.; Bosbach, D. Rare-Earth Orthophosphates From Atomistic Simulations. Front. Chem. 2019, 7, 197. [Google Scholar] [CrossRef]
- Yang, G.; Park, S.J. Deformation of Single Crystals, Polycrystalline Materials, and Thin Films: A Review. Materials 2019, 12, 2003. [Google Scholar] [CrossRef]
- Jarosewich, E.; Boatner, L.A. Rare-Earth Element Reference Samples for Electron Microprobe Analysis. Geostand. Newsl. 1991, 15, 397–399. [Google Scholar] [CrossRef]
- Feigelson, R.S. Synthesis and Single-Crystal Growth of Rare-Earth Orthophosphates. J. Am. Ceram. Soc. 1964, 47, 257–258. [Google Scholar] [CrossRef]
- Donovan, J.J.; Hanchar, J.M.; Picolli, P.M.; Schrier, M.D.; Boatner, L.A.; Jarosewich, E. Contamination in the Rare-Earth Element Orthophosphate Reference Samples. J. Res. Natl. Inst. Stand. Technol. 2002, 107, 693–701. [Google Scholar] [CrossRef] [PubMed]
- Jarosewich, E.; Nelen, J.; Norberg, J.A. Reference Samples for Electron Microprobe Analysis. Geostand. Newsl. 1980, 4, 43–47. [Google Scholar] [CrossRef]
- Mullica, D.; Milligan, W.; Grossie, D.A.; Beall, G.; Boatner, L. Ninefold coordination LaPO4: Pentagonal interpenetrating tetrahedral polyhedron. Inorg. Chim. Acta 1984, 95, 231–236. [Google Scholar] [CrossRef]
- Beall, G.; Boatner, L.; Mullica, D.; Milligan, W. The structure of cerium orthophosphate, a synthetic analogue of monazite. J. Inorg. Nucl. Chem. 1981, 43, 101–105. [Google Scholar] [CrossRef]
- Mullica, D.; Grossie, D.A.; Boatner, L. Structural refinements of praseodymium and neodymium orthophosphate. J. Solid State Chem. 1985, 58, 71–77. [Google Scholar] [CrossRef]
- Mullica, D.F.; Grossie, D.A.; Boatner, L.A. Coordination geometry and structural determinations of SmPO4, EuPO4 and GdPO4. Inorg. Chim. Acta 1985, 109, 105–110. [Google Scholar] [CrossRef]
- Milligan, W.; Mullica, D.; Beall, G.; Boatner, L. The structures of three lanthanide orthophosphates. Inorg. Chim. Acta 1983, 70, 133–136. [Google Scholar] [CrossRef]
- Milligan, W.O.; Mullica, D.F.; Beall, G.W.; Boatner, L.A. Structures of ErPO4, TmPO4, and YbPO4. Acta Crystallogr. Sect. C 1983, 39, 23–24. [Google Scholar] [CrossRef]
- Milligan, W.; Mullica, D.; Beall, G.; Boatner, L. Structural investigations of YPO4, ScPO4, and LuPO4. Inorg. Chim. Acta 1982, 60, 39–43. [Google Scholar] [CrossRef]
- Shannon, R.D. Revised effective ionic radii and systematic studies of interatomic distances in halides and chalcogenides. Acta Crystallogr. Sect. A 1976, 32, 751–767. [Google Scholar] [CrossRef]
- Shchapova, Y.V.; Vinogradova, N.S.; Votyakov, S.L.; V.Ryzhkov, M. Chemical bonding and radiation stability of monazite-structure orthophosphates: Ab initio and spectroscopy studies. Period. Mineral. ECMS 2015, 153–154. Available online: http://periodicodimineralogia.it/doi/2015_ECMS_2015/ECMS_2015_Rome_Proceedings.pdf (accessed on 9 July 2020).
- Carrasco, I.; Piccinelli, F.; Romet, I.; Nagirnyi, V.; Bettinelli, M. Competition between Energy Transfer and Energy Migration Processes in Neat and Eu3+-Doped TbPO4. J. Phys. Chem. C 2018, 122, 6858–6864. [Google Scholar] [CrossRef]
- Judd, B.R. Optical Absorption Intensities of Rare-Earth Ions. Phys. Rev. 1962, 127, 750–761. [Google Scholar] [CrossRef]
- Sato, Y.; Kumagai, T.; Okamoto, S.; Yamamoto, H.; Kunimoto, T. Energy Transfer between Gd3 and Other Rare-earth Ions in GdPO4under Vacuum UV Excitation. Jpn. J. Appl. Phys. 2004, 43, 3456–3460. [Google Scholar] [CrossRef]
- Nakazawa, E.; Shiga, F. Vacuum ultraviolet luminescence-excitation spectra of RPO4: Eu3+ (R = Y, La, Gd and Lu). J. Lumin. 1977, 15, 255–259. [Google Scholar] [CrossRef]
- Lyu, T.; Dorenbos, P. Charge carrier trapping processes in lanthanide doped LaPO4, GdPO4, YPO4, and LuPO4. J. Mater. Chem. C 2018, 6, 369–379. [Google Scholar] [CrossRef]
- Lucas, S.; Champion, E.; Bregiroux, D.; Bernache-Assollant, D.; Audubert, F. Rare earth phosphate powders RePO4 · nH2O (Re=La, Ce or Y)—Part I. Synthesis and characterization. J. Solid State Chem. 2004, 177, 1302–1311. [Google Scholar] [CrossRef]
- Mayolet, A. Étude des Processus D’absorption et de Transfert D’énergie au Sein de Matériaux Inorganiques Luminescents Dans le Domaine UV et VUV. Ph.D. Thesis, Thèse de Doctorat Dirigée par Krupa, Jean-Claude Physique, Paris, France, 1995. [Google Scholar]
- Chen, H.; Ni, Y.; Ma, X. Phase-controllable synthesis, shape evolution and optical performances of CePO4 nanocrystals via a simple oil-bath route. RSC Adv. 2014, 4, 36553–36559. [Google Scholar] [CrossRef]
- Palma-Ramírez, D.; Domínguez-Crespo, M.; Torres-Huerta, A.; Dorantes-Rosales, H.; Ramírez-Meneses, E.; Rodríguez, E. Microwave-assisted hydrothermal synthesis of CePO4 nanostructures: Correlation between the structural and optical properties. J. Alloys Compd. 2015, 643, S209–S218. [Google Scholar] [CrossRef]
- Lv, H.; Shen, X.; Ji, Z.; Chen, K.; Zhu, G. One-pot synthesis of PrPO4 nanorods—Reduced graphene oxide composites and their photocatalytic properties. New J. Chem. 2014, 38, 2305–2311. [Google Scholar] [CrossRef]
- Wang, Y.; Li, J.; Wang, J.; Han, S.; Guo, Y. Flux growth and characterizations of NdPO4 single crystals. J. Cryst. Growth 2010, 312, 2779–2782. [Google Scholar] [CrossRef]
- Cybinska, J.; Lorbeer, C.; Zych, E.; Mudring, A.V. Ionic liquid supported synthesis of nano-sized rare earth doped phosphates. J. Lumin. 2017, 189, 99–112. [Google Scholar] [CrossRef]
- Babu, B.C.; Wang, G.G.; Baker, A.P.; Wang, B.L. Synthesis, photoluminescence, energy transfer and thermal stability of SmPO4@SiO2:Eu3+ core-shell structured red phosphors for WLEDs. J. Alloys Compd. 2018, 766, 74–87. [Google Scholar] [CrossRef]
- Shinde, K.N.; Dhoble, S.J.; Swart, H.C.; Park, K. Some Novel Phosphate Phosphors; Springer: Berlin, Germany, 2012; pp. 191–247. [Google Scholar] [CrossRef]
- Runowski, M.; Grzyb, T.; Zep, A.; Krzyczkowska, P.; Gorecka, E.; Giersig, M.; Lis, S. Eu3+ and Tb3+ doped LaPO4 nanorods, modified with a luminescent organic compound, exhibiting tunable multicolour emission. RSC Adv. 2014, 4, 46305–46312. [Google Scholar] [CrossRef]
- Wang, D.; Wang, Y. Optical properties of (Y,Tb)PO4 under VUV excitation. Mater. Chem. Phys. 2009, 115, 699–702. [Google Scholar] [CrossRef]
- Finke, B.; Schwarz, L.; Gurtler, P.; Kraas, M. Optical properties of potassium rare earth orthophosphates (RE = La, Ce, Tb). Phys. Status Solidi A 1992, 130, K125–K130. [Google Scholar] [CrossRef]
- Jorgensen, C.K. Electron transfer spectra of lanthanide complexes. Mol. Phys. 1962, 5, 271–277. [Google Scholar] [CrossRef]
- Becker, P.J.; Kahle, H.G.; Kuse, D. Absorption Spectrum and Zeeman Effect of Ho3+ in YPO4. Phys. Status Solidi 1969, 36, 695–704. [Google Scholar] [CrossRef]
- Wen, Q.; Xiao, S.; Gao, X.; Xia, W.; Yang, X. Photochromic effect of HoPO4:Li+ powder. Chin. Opt. Lett. 2015, 13, 031601. [Google Scholar]
- Ofelt, G.S. Intensities of Crystal Spectra of Rare-Earth Ions. J. Chem. Phys. 1962, 37, 511–520. [Google Scholar] [CrossRef]
- Saltmarsh, N.; Kumar, G.; Kailasnath, M.; Shenoy, V.; Santhosh, C.; Sardar, D. Spectroscopic characterizations of Er doped LaPO4 submicron phosphors prepared by homogeneous precipitation method. Opt. Mater. 2016, 53, 24–29. [Google Scholar] [CrossRef]
- Yang, S.H.; Yang, C.K.; Yan, J.H.; Lin, C.M. Improvement of the Luminescence of Red LaPO4:Eu Nanophosphors for a Near-UV LED. J. Electron. Mater. 2014, 43, 3593–3600. [Google Scholar] [CrossRef]
- Patra, A.; Ghosh, P.; Chowdhury, P.S.; Alencar, M.A.R.C.; Lozano, B.W.; Rakov, N.; Maciel, G.S. Red to Blue Tunable Upconversion in Tm3+—Doped ZrO2 Nanocrystals. J. Phys. Chem. B 2005, 109, 10142–10146. [Google Scholar] [CrossRef] [PubMed]
- Nakazawa, E.; Shionoya, S. Cooperative Luminescence in YbPO4. Phys. Rev. Lett. 1970, 25, 1710–1712. [Google Scholar] [CrossRef]
The absorption spectra for all the samples can be provided upon request. |


| Sample | Dimensions (m) | a (Å) | b (Å) | c (Å) | V (Å) | Space Group | Structure |
|---|---|---|---|---|---|---|---|
| LaPO [26] | 3000 × 2000 | 6.825 (4) | 7.057 (2) | 6.482 (2) | 303.900 | Monazite | |
| CePO [27] | 2200 × 1750 | 6.777 (3) | 6.993 (3) | 6.445 (3) | 296.970 | Monazite | |
| PrPO [28] | 1000 × 500 | 6.74 1(3) | 6.961 (4) | 6.416 (1) | 292.60 | Monazite | |
| NdPO [28] | 2000 × 1500 | 6.722 (1) | 6.933 (1) | 6.390 (2) | 289.30 | Monazite | |
| SmPO [29] | 750 × 1000 | 6.669 (1) | 6.868 (2) | 6.351 (1) | 290.89 | Monazite | |
| EuPO [29] | 1500 × 500 | 6.639 (3) | 6.823 (3) | 6.318 (3) | 294.81 | Monazite | |
| GdPO [29] | 2000 × 1500 | 6.621 (2) | 6.823 (2) | 6.310 (2) | 276.40 | Monazite | |
| TbPO [30] | 850 × 300 | 6.940 (1) | 6.940 (1) | 6.068 (1) | 292.26 | Xenotime | |
| DyPO [30] | 1000 × 400 | 6.907 (2) | 6.907 (2) | 6.046 (2) | 288.43 | Xenotime | |
| HoPO [30] | 1500 × 500 | 6.882 (2) | 6.882 (2) | 6.025 (2) | 285.36 | Xenotime | |
| ErPO [31] | 1700 × 250 | 6.860 (1) | 6.860 (1) | 6.003 (1) | 282.50 | Xenotime | |
| TmPO [31] | 1200 × 800 | 6.839 (1) | 6.839 (1) | 5.986 (1) | 280.00 | Xenotime | |
| YbPO [31] | 1350 × 650 | 6.816 (2) | 6.816 (2) | 5.966 (2) | 277.20 | Xenotime | |
| LuPO [32] | 950 × 400 | 6.792 (2) | 6.792 (2) | 5.954 (2) | 274.67 | Xenotime |
© 2020 by the authors. Licensee MDPI, Basel, Switzerland. This article is an open access article distributed under the terms and conditions of the Creative Commons Attribution (CC BY) license (http://creativecommons.org/licenses/by/4.0/).
Share and Cite
Sharma, S.K.; Behm, T.; Köhler, T.; Beyer, J.; Gloaguen, R.; Heitmann, J. Library of UV-Visible Absorption Spectra of Rare Earth Orthophosphates, LnPO4 (Ln = La-Lu, except Pm). Crystals 2020, 10, 593. https://doi.org/10.3390/cryst10070593
Sharma SK, Behm T, Köhler T, Beyer J, Gloaguen R, Heitmann J. Library of UV-Visible Absorption Spectra of Rare Earth Orthophosphates, LnPO4 (Ln = La-Lu, except Pm). Crystals. 2020; 10(7):593. https://doi.org/10.3390/cryst10070593
Chicago/Turabian StyleSharma, Suchinder K., Thomas Behm, Thomas Köhler, Jan Beyer, Richard Gloaguen, and Johannes Heitmann. 2020. "Library of UV-Visible Absorption Spectra of Rare Earth Orthophosphates, LnPO4 (Ln = La-Lu, except Pm)" Crystals 10, no. 7: 593. https://doi.org/10.3390/cryst10070593
APA StyleSharma, S. K., Behm, T., Köhler, T., Beyer, J., Gloaguen, R., & Heitmann, J. (2020). Library of UV-Visible Absorption Spectra of Rare Earth Orthophosphates, LnPO4 (Ln = La-Lu, except Pm). Crystals, 10(7), 593. https://doi.org/10.3390/cryst10070593