Article

Solvent Effects on Catechol Crystal Habits and Aspect Ratios: A Combination of Experiments and Molecular Dynamics Simulation Study

1
School of Chemical Engineering and Technology, Tianjin University, Tianjin 300072, China
2
Collaborative Innovation Center of Chemical Science and Engineering (Tianjin), Tianjin 300072, China
3
State Key Laboratory of Chemical Engineering, Tianjin University, Tianjin 300072, China
*
Author to whom correspondence should be addressed.
Crystals 2020, 10(4), 316; https://doi.org/10.3390/cryst10040316
Submission received: 29 March 2020 / Revised: 16 April 2020 / Accepted: 16 April 2020 / Published: 18 April 2020
(This article belongs to the Special Issue Advances in Industrial Crystallization)

Abstract

:
This work could help to better understand the solvent effects on crystal habits and aspect ratio changes at the molecular level, which provide some guidance for solvent selection in industrial crystallization processes. With the catechol crystal habits acquired using both experimental and simulation methods in isopropanol, methyl acetate and ethyl acetate, solvent effects on crystal morphology were explored based on the modified attachment energy model. Firstly, morphologically dominant crystal faces were obtained with the predicted crystal habit in vacuum. Then, modified attachment energies were calculated by the molecular dynamics simulation to modify the crystal shapes in a real solvent environment, and the simulation results were in agreement with the experimental ones. Meanwhile, the surface properties such as roughness and the diffusion coefficient were introduced to analyze the solvent adsorption behaviors and the radial distribution function curves were generated to distinguish diverse types of interactions like hydrogen bonds and van der Waals forces. Results show that the catechol crystal habits were affected by the combination of the attachment energy, surface structures and molecular interaction types. Moreover, the changing aspect ratios of catechol crystals are closely related to the existence of hydrogen bonds which contribute to growth inhibition on specific faces.

1. Introduction

Crystal size and shape have essential effects on downstream processing such as filtration, washing and drying for solution crystallization [1,2,3]. Meanwhile, crystal properties such as flowability and bulk density [4,5] are closely associated with crystal morphology. Therefore, it has been very crucial to explore the possible crystal habits under different conditions to select the suitable crystals for industrial operations. Many factors contribute to affect crystal shapes, such as solvents [6], additives [7], temperature [8], supersaturation [9] and even stirring rate [10], which can be modified and controlled to obtain the morphology optimal for industrial applications. For solution crystallization, the effect of solvents is one of the most primary factors that affects final crystal habits. As indicated by many researches [11,12,13], the interactions between solvent molecules and crystal faces are quite essential to crystal growth. Hence, in order to obtain desired crystal shapes, it is necessary to investigate solvent effects on crystal habits and aspect ratio changes.
Although real and effective crystal morphology could be acquired by experimental methods, it is labor-intensive and time-consuming to conduct a large number of experiments just to find the optimal one that benefits production. In recent years, computer-aided methods such as molecular simulations and first principles (FP) simulations have been explored to explain and predict crystal habits [14,15,16,17], and the gradually developing simulation methods have provided a broader perspective for crystal morphology research at a molecular level.
Molecular dynamics (MD) is one of the molecular simulation methods that helps to investigate the directions of crystal growth with molecular information, reveal the interactions between solvent molecules and crystal surfaces and provide more microscopic details for experiments. The MD method has been successfully applied to simulate crystal morphology in many cases [18,19,20]. Wang et al. [21] utilized a surface docking model for a crystal growth simulation of cefaclor dihydrate and proposed a competitive relationship of surface adsorption by the solute and solvent molecules based on pure solvent and solution models. Zhang et al. [22] simulated the crystal morphology of ibuprofen obtained from four different solvents using the modified attachment energy (MAE) model and found that the crystal aspect ratios were sensitive to the relative polarity of the solvents. They regarded the method as a promising way for the computer-aided design of desirable pharmaceutical crystal habits with rapid solvent screening. Poornachary et al. [23] investigated the mechanism of additive inhibition on naproxen crystal growth by modeling the intermolecular interactions between the polymeric additive and the crystal surface and ascribed the phenomenon to solute diffusion control.
However, the exploration of solvent–crystal interactions from the thermodynamic perspective is just a partial picture, and discussions are not sufficient on the differences in crystal aspect ratios because of solvent system distinctions, which makes the crystal morphology selection in industrial application still based on experiences.
Catechol is a common fine chemical raw material, which is mainly used as an intermediate for polymerization inhibitor synthesis and pesticide production. In addition, it is also consumed as a precursor to fragrances, pharmaceuticals and dyes [24]. This organic chemical commodity has been in industrial production for over forty years, and the research emphasis is usually focused on its synthesis techniques [25,26]. Further experimental and simulation investigations on catechol crystal morphology are needed to get a deeper insight into the crystal growth and habits in solvents, which helps to select optimal crystal shapes and solvents to avoid agglomeration and improve product quality for industrial production.
In this paper, the catechol crystal morphology in isopropanol, methyl acetate and ethyl acetate were simulated using the MAE model, which helped to quantify the interactions between the crystal surfaces and solvent molecules. Experiments of cooling crystallization were conducted at the same time for model verification. This study aimed to describe the solvent effects on crystal habits from the perspective of crystal–solvent interactions and surface properties, which may favor a better understanding of crystal habit distinctions, especially the aspect ratio changes of crystal shapes in solvents.

2. Calculation Methodology

2.1. Theory

The Bravais–Friedel–Donnay–Harker (BFDH) model [27] is one of the models which are initially applied to predict crystal habits, but the model lacks precision because it simulates possible crystal facets merely according to geometric factors without considering the actual chemical environment, so it was soon developed into the attachment energy (AE) model by Hartman and Bennema [28,29,30], taking into account the energies of the system on the basis of the period bond chain (PBC) theory [31]. This kind of model is based on the attachment energy (Eatt), which is defined as the released energy when a growth slice attaches on to a growing crystal surface. The relative growth rate (Rhkl) of each crystal face (h k l) is assumed to be proportional to the absolute value of the attachment energy [28]:
Rhkl ∝ |Eatt|.
The attachment energy (Eatt) is calculated as
Eatt = ElattEslice,
where Elatt is the lattice energy of the crystal and Eslice is the energy of a growth slice with a thickness of dhkl.
However, the AE model was put forward to simulate ideal crystal morphology in the premise of a vacuum environment, leading to a precision loss when the model was applied to solution crystallization. As a matter of fact, solvent molecules adsorb on the crystal surfaces as solute molecules do [32], which means that the growth of the crystal faces may be impeded by the solvent molecule adsorption. In order to cover the effects of the solvent on crystal growth, a modified attachment energy (MAE) model was developed. The modified model introduced an energy correction term Es for the initial Eatt to take into consideration the effects of the solvent molecules on crystal faces, and the modified attachment energy E’att is calculated in the following formula:
E’att = EattEs,
where Es represents the binding energy between the solvent molecules and the crystal face (h k l), which it can be obtained using the follow equation:
E s = E int × A acc A box ,
where Abox is the total crystal surface area of the simulated supercell along the (h k l) direction, and Aacc represents the solvent-accessible area of the crystal face in the unit cell, which can be approximated by the Connolly surface algorithm [33]. Eint was defined as the interaction energy between a specific crystal face and the corresponding solvent layer, which can be calculated as follows:
Eint = Etot − (Esur + Esol).
In Equation (5), Etot means the total energy of the entire simulation box including all crystal and solvent molecules, and Esur and Esol represent the energy of the isolated crystal surface and solvent layer, respectively.
After correction, the relative growth rate R’hkl in the MAE model was still in proportion to the absolute value of the modified attachment energy |E’att|:
R’hkl ∝ |E’att|.

2.2. Simulation Details

The initial crystal structure of catechol (identifier CATCOL17) was obtained from CSD (Cambridge Structural Database), derived from experiments by Clegg and Scott, with the space group of P21/n (a = 9.8326 Å, b = 5.5910 Å, c = 10.467 Å, α = γ = 90°, β = 114.988°) [34]. As shown in Figure 1, there are four catechol molecules in the unit cell.
The entire geometry optimization and MD simulation process were implemented using the program Materials Studio 6.0 (Accelrys, San Diego, CA, USA) [35] with the COMPASS force field, which is a powerful ab initio force field with many accurate predictions of structures [36]. After the initial downloaded crystal was optimized using the COMPASS force field, the similar lattice parameters of the two crystals listed in Table 1, proved that it was a suitable choice to use the COMPASS field since the relative error of each parameter was less than 5%.
After geometry optimization, the crystal habit of catechol in vacuum was predicted with the growth morphology method in the morphology module, providing several potential growing crystal faces that possibly existed in the solution environment. Based on the acquired morphologically important faces (h k l), the molecular models of catechol crystal surfaces were built by cleaving the corresponding (h k l) faces from the crystal cell with a depth of 2–4 dhkl and then extending the surface to supercells containing m × n unit cells (specific data for each crystal face listed in Supplementary Materials Table S1). The solvent effects were modeled using the Amorphous Cell module by setting up a three-dimensional solvent box containing 200 randomly distributed solvent molecules and the size of the solvent box was consistent with the crystal supercell and the thickness determined by the solvent density.
Subsequently, a double-layer crystal–solvent interface model was constructed, and then a vacuum layer with a thickness of 50 Å was added onto the model box to avoid any additional effects of periodic boundaries. After the interface model was geometrically optimized with catechol molecules fixed in the crystal, the MD simulation was operated with NVT ensemble at 298 K, controlled by the Andersen thermostat. The total duration of the simulation was 200 ps with a time step of 1 fs, and the data were collected every 100 steps. In the non-bonding interaction calculation procedure, the standard Ewald method was used to calculate the electrostatic interactions with an accuracy of 0.0001 kcal mol−1 while the atom-based summation method was applied to calculate van der Waals interactions with a cut-off distance (dc) of 15.5 Å. The cleaving and extending operations were implemented to balance the accuracy and simulation time [37], assuring that the length and width of the crystal supercell were both no less than 2dc, while the thickness of the solvent layer and crystal layer were greater than dc [38].

3. Experiment and Characterization

3.1. Materials

Commercial catechol (99% purity) was supplied by Tianjin Damao Chemical Reagent Factory (Tianjin, China). Isopropanol, ethyl acetate and methyl acetate were provided by Tianjin Jiangtian Chemical Technology Co., Ltd. (Tianjin, China). All reagents were of analytical grade purity and used without further purification.

3.2. Cooling Crystallization Experiments

Firstly, saturated solutions in isopropanol, methyl acetate and ethyl acetate at 298 K were prepared based on the solubility data of catechol [39]. Then, the saturated solution was filtered into a double jacketed crystallizer preheated to 298 K. Afterwards, the solution was slowly cooled to 288 K at a cooling rate of 5 K per hour, using a thermostat (CF41, Julabo, Seelbach, Germany) with a ±0.02 K temperature stability. Afterwards, the crystals were obtained and dried for further solid characterization.

3.3. Crystal Characterization

Firstly, the crystal habits of the experimental catechol samples were observed by optical microscopy (BX51, Olympus, Tokyo, Japan), and ten crystals in each solvent were randomly selected to measure the aspect ratios. Then, the crystal forms of the dried products were detected by a powder X-ray diffractometer (D/MAX-2500, Rigaku, Tokyo, Japan) at ambient temperature with a scanning rate of 8 degrees per minute. The data were collected using Cu Kα radiation (λKα = 0.15406 nm) and the 2θ scan range was 2°–40°.

4. Results and Discussion

4.1. Polymorph Identification

In general, changes in crystal morphology are probable to occur when polymorphism exists. Numerous cases [40,41,42] indicated various crystal forms with diverse habits in different solvent environments. Therefore, it is necessary to examine the crystal polymorphism of the products obtained from different solutions. As illustrated in Figure 2, the catechol products crystallized from isopropanol, methyl acetate and ethyl acetate have similar characteristic peaks with the raw material, proving that all the samples were in the same crystal form as reported [43]. In addition, the simulated powder X-ray diffraction (PXRD) pattern of the catechol obtained from CSD was consistent with the patterns of the experimental crystals (Supplementary Materials Figure S1). The results suggest that no polymorphic phenomenon occurred in our study, and it is reasonable to simulate crystal habits using the structure obtained from CSD.

4.2. Prediction of Catechol Crystal Morphology in Vacuum

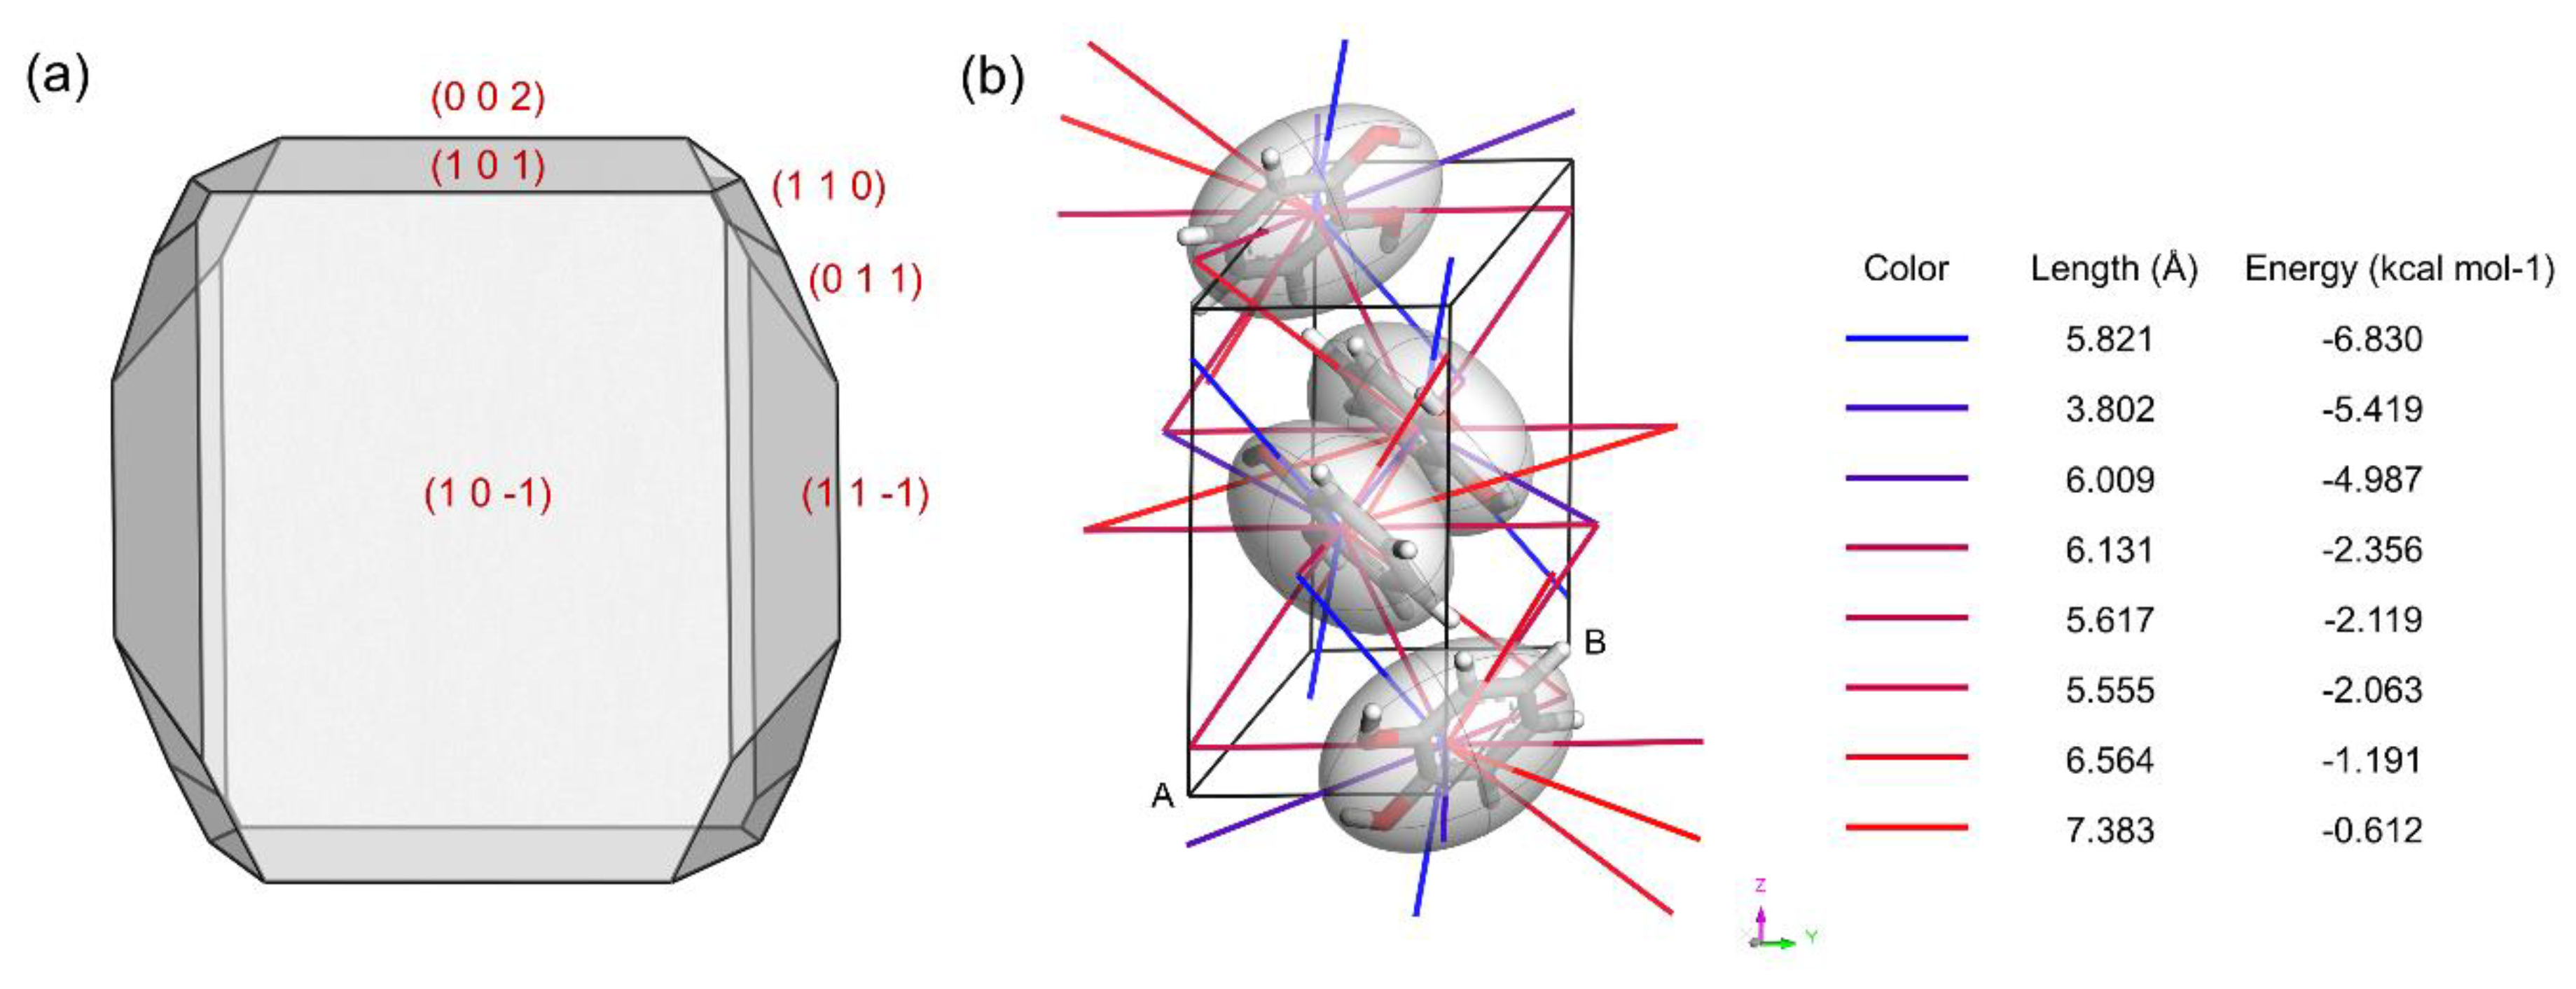
Figure 3a depicts the crystal morphology of catechol in vacuum predicted by the AE model. The prismatic crystal had six dominant faces, owing to not only crystallography geometry but also intermolecular interactions. Figure 3b visualizes the interactions between the catechol molecules calculated and generated by the Crystal Graph in the morphology module, with the blue and red lines representing strong and weak interactions, respectively. Previous studies indicated that crystals grow faster along the direction with strong molecular interactions [44]. Therefore, catechol crystals grow faster along the blue line direction and the surfaces with fast growth rate may disappear, leaving the slowly growing surface appear in the final morphology with six important faces, (1 0 −1), (1 0 1), (0 1 1), (1 1 0), (0 0 2) and (1 1 −1). In the AE model, the surface with higher absolute value of Eatt has stronger ability to adsorb catechol molecules, which means a relatively faster growing rate of the crystal face, and vice versa. As listed in Table 2, the most important face is (1 0 −1) occupying more than 48% of the total habit facet area, followed by (1 1 −1) and (1 0 1) with 20% and 19% in total areas, respectively. Therefore, (1 1 0), (0 0 2) and (0 1 1) faces grow faster with relatively larger |Eatt| among all the crystal faces, which are of lower morphological importance and are more likely to disappear.

4.3. Modified Results of Catechol Crystal Morphology in Solvent Systems

Consistent with the experiments, the MD simulation based on the MAE model was conducted in three kinds of solvent systems: isopropanol, methyl acetate and ethyl acetate. Table 3 lists the simulated results of the six significant crystal faces in the different solvents. The negative values of Eint, which indicate the interaction energies between the solvents and the catechol crystal faces, revealed that the solvent molecule adsorption was spontaneous because the process was exothermic. The diverse absolute values of Es for different crystal faces in the solvents implied that the solvents had different effects on each crystal face due to their distinct characteristics. However, ordered from largest to smallest, the |Es| values of the (1 0 1), (1 1 0), and (0 1 1) face were the top three in all three solvents, which means that the interactions between the solvents and crystal faces were relatively strong on the (1 1 0), (0 1 1) and (1 0 1) faces. After correction, the absolute values of the modified attachment energy |E’att| were sorted as follows: (0 0 2) > (1 1 0) > (0 1 1) > (1 1 −1) > (1 0 1) > (1 0 −1) in isopropanol, (0 0 2) > (0 1 1) > (1 0 1) > (1 1 0) > (1 1 −1) > (1 0 −1) in methyl acetate, and (0 0 2) > (1 0 1) > (0 1 1) > (1 1 0) > (1 1 −1) > (1 0 −1) in ethyl acetate. Although the orders were not identical, the relatively most fast-growing (0 0 2) face disappeared in all three solvent systems with the largest |E’att|. Meanwhile, the (1 0 −1) face remained to take up the largest percentage of the crystal facet areas compared to the crystal morphology in vacuum: 43.87% in isopropanol and more than 70% in the other two solvents. For the crystal in methyl acetate, the (1 1 0) face had more area proportion than the (1 0 1) face due to its slower growth rate with a smaller |E’att| value.
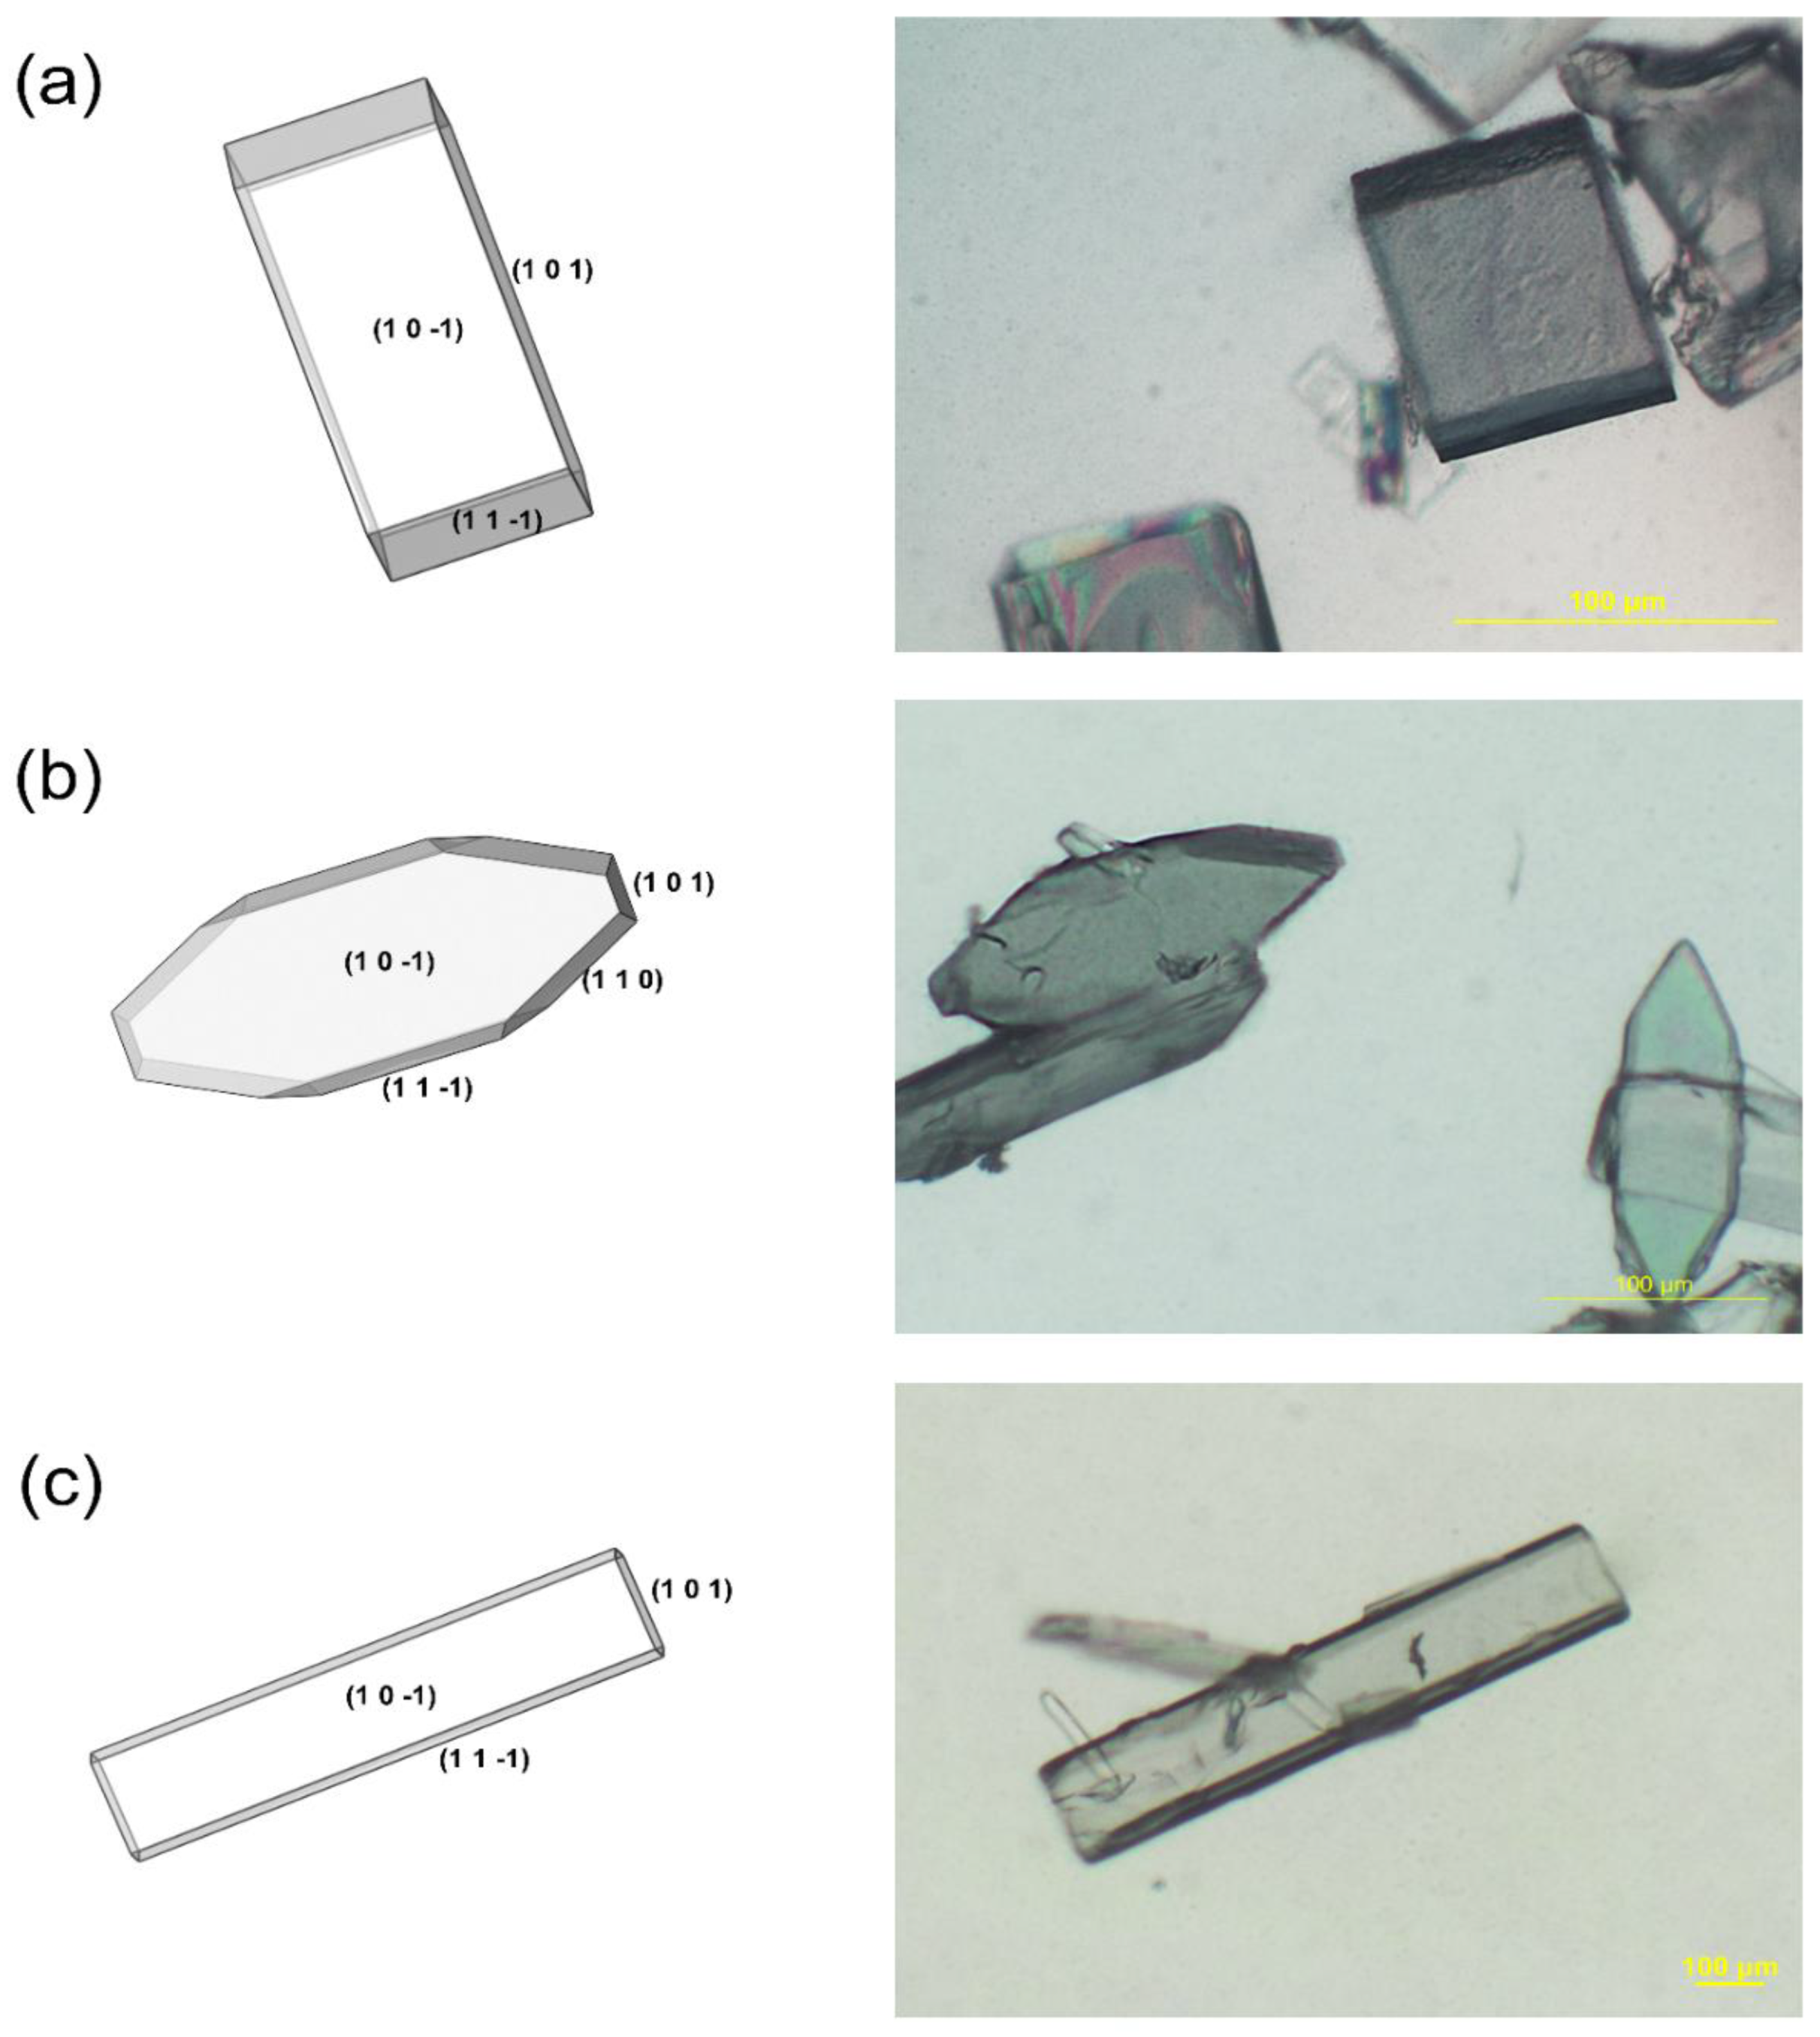
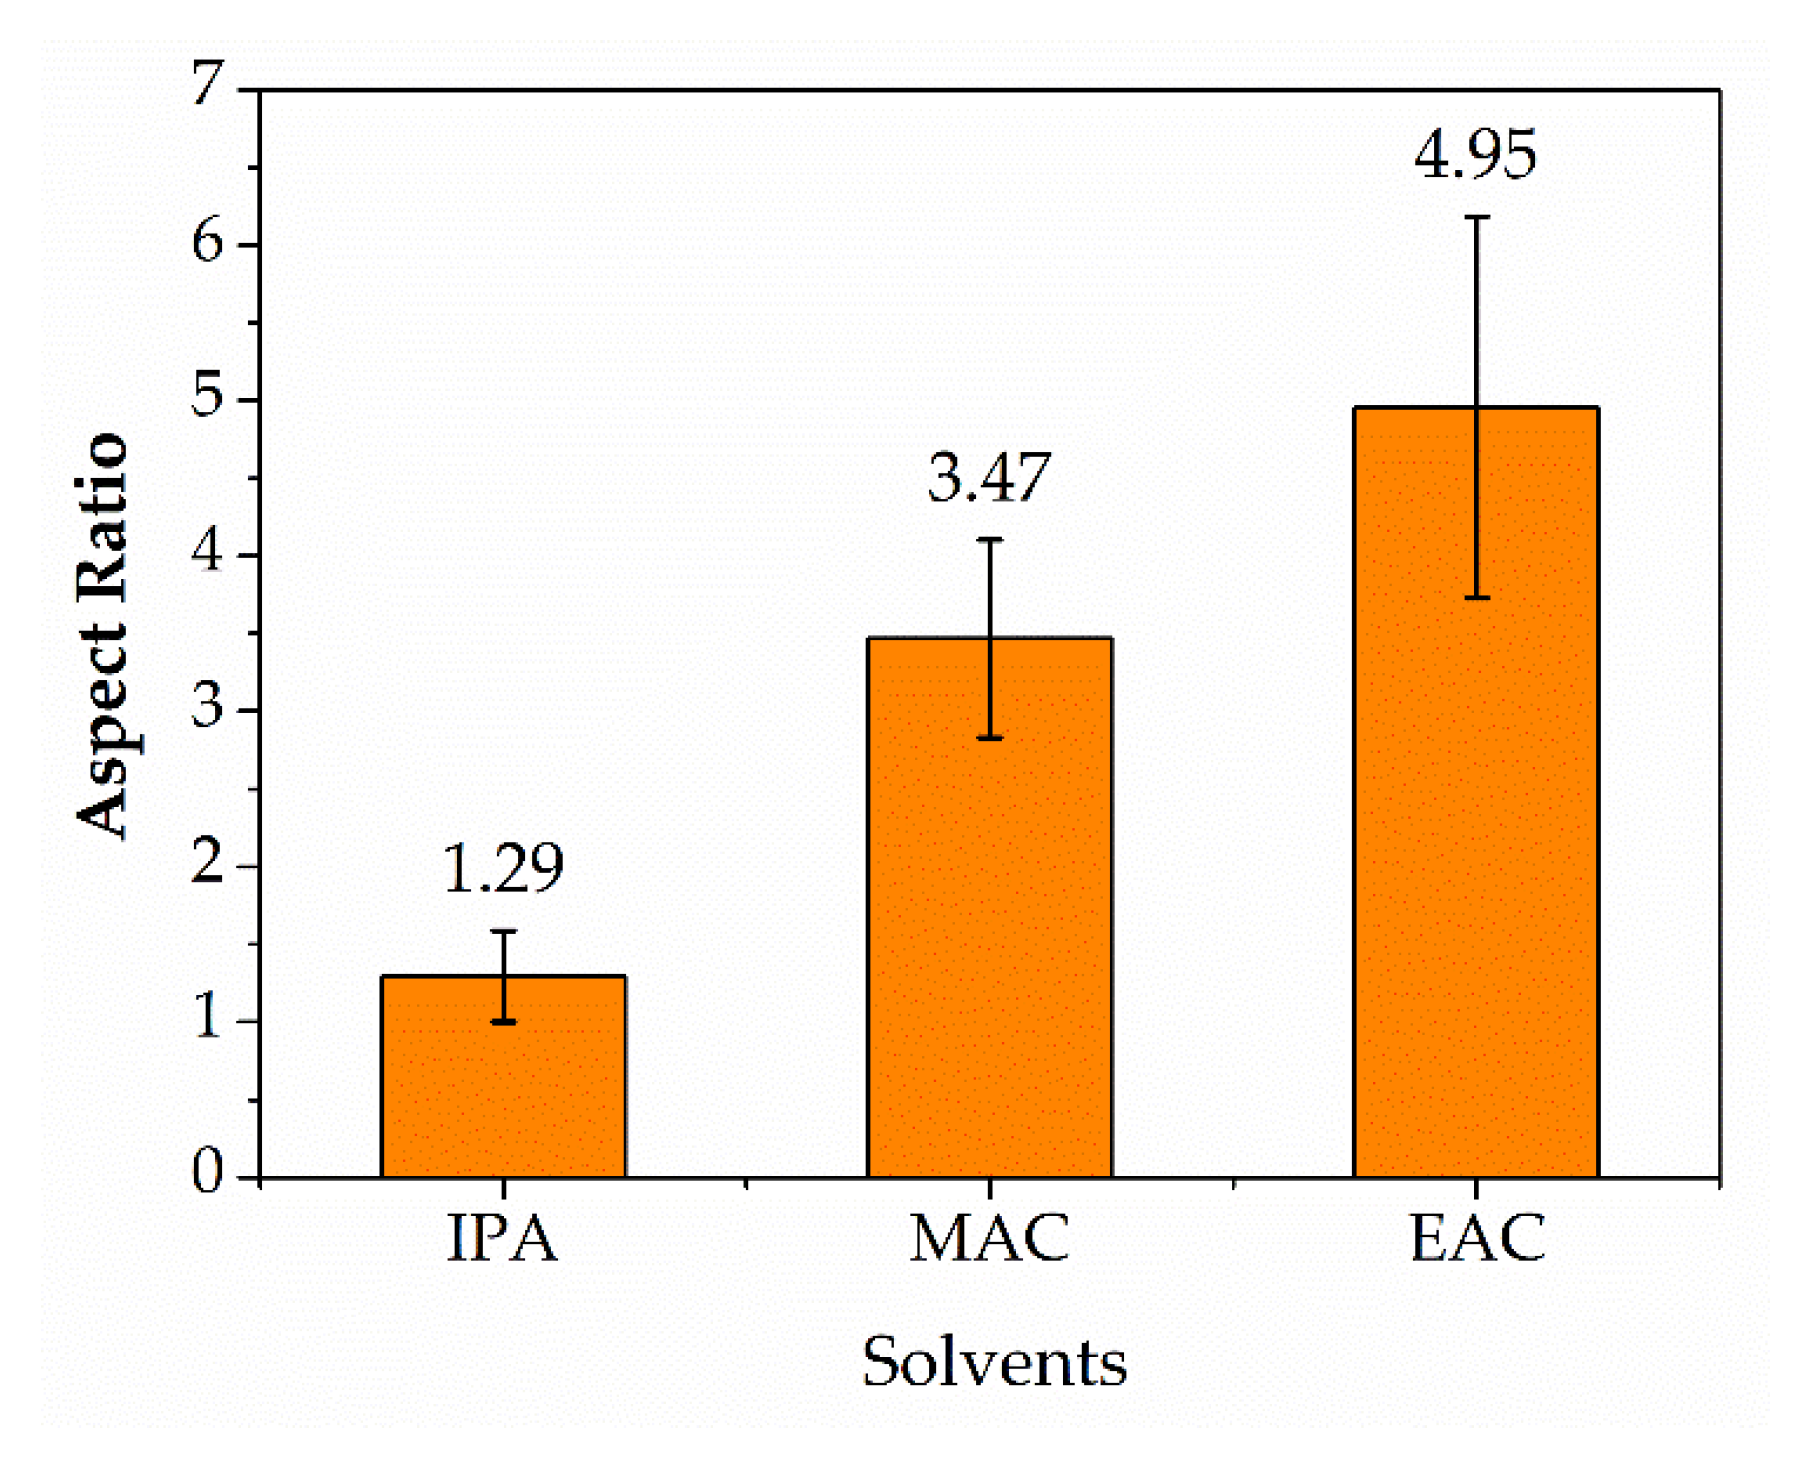
As two or three crystal faces disappeared because of their relatively fast growth rate, the crystal morphology of catechol obviously changed in the three solvent systems, which powerfully supported the non-negligible effects of the solvents on crystal habits. In the results shown in Figure 4, the simulated crystals basically conform with the experimental ones with prismatic, fusiform or hexagonal tubular shapes in isopropanol, methyl acetate and ethyl acetate, respectively. Here we introduced the aspect ratio of the crystal as a quantitive index to describe the differences between the crystals grown from distinct solvent systems. As can be seen in Figure 4, the aspect ratio of catechol crystal was mainly determined by the areas of the (1 0 −1) face and the (1 0 1) face, so here we defined the aspect ratio as the length along the (1 0 −1) face divided by the width along the (1 0 1) face in order to summarize the unified rules of morphology change. The calculated average aspect ratios of experimental crystals are shown in Figure 5, in which the catechol crystal in isopropanol and ethyl acetate has the smallest (1.29) and the largest aspect ratio (4.95), respectively. For the convenience of downstream processes, crystal products with small aspect ratios were preferred with high flowability and unbreakable shapes. Therefore, isopropanol may be the optimal solvent for catechol crystallization among the three solvents. The obvious differences in aspect ratios may be attributed to the relative growing rate of the crystal faces in specific solvent systems, which is fundamentally related to the effects of hydrogen bond or solvent diffusion velocity. This will be discussed in the following sections.

4.4. Solvent–Crystal Interactions on the Interface

As discussed above, the modified attachment energy indicated the interactions between the crystal layer and the solvent layer in the simulation box, which was of great significance to crystal morphology. Apart from the attachment energy from a thermodynamic point of view, further comprehension of the crystal–solvent interaction mechanism helped to optimize crystal morphology and select a suitable solvent in industrial crystallization. Therefore, considerations should be taken into account, not only for contact interface properties, but also for non-bonding interactions between crystals and solvent molecules. All these factors contributed to understanding the solvent effects entirely.

4.4.1. Molecular Alignment on Crystal Surfaces

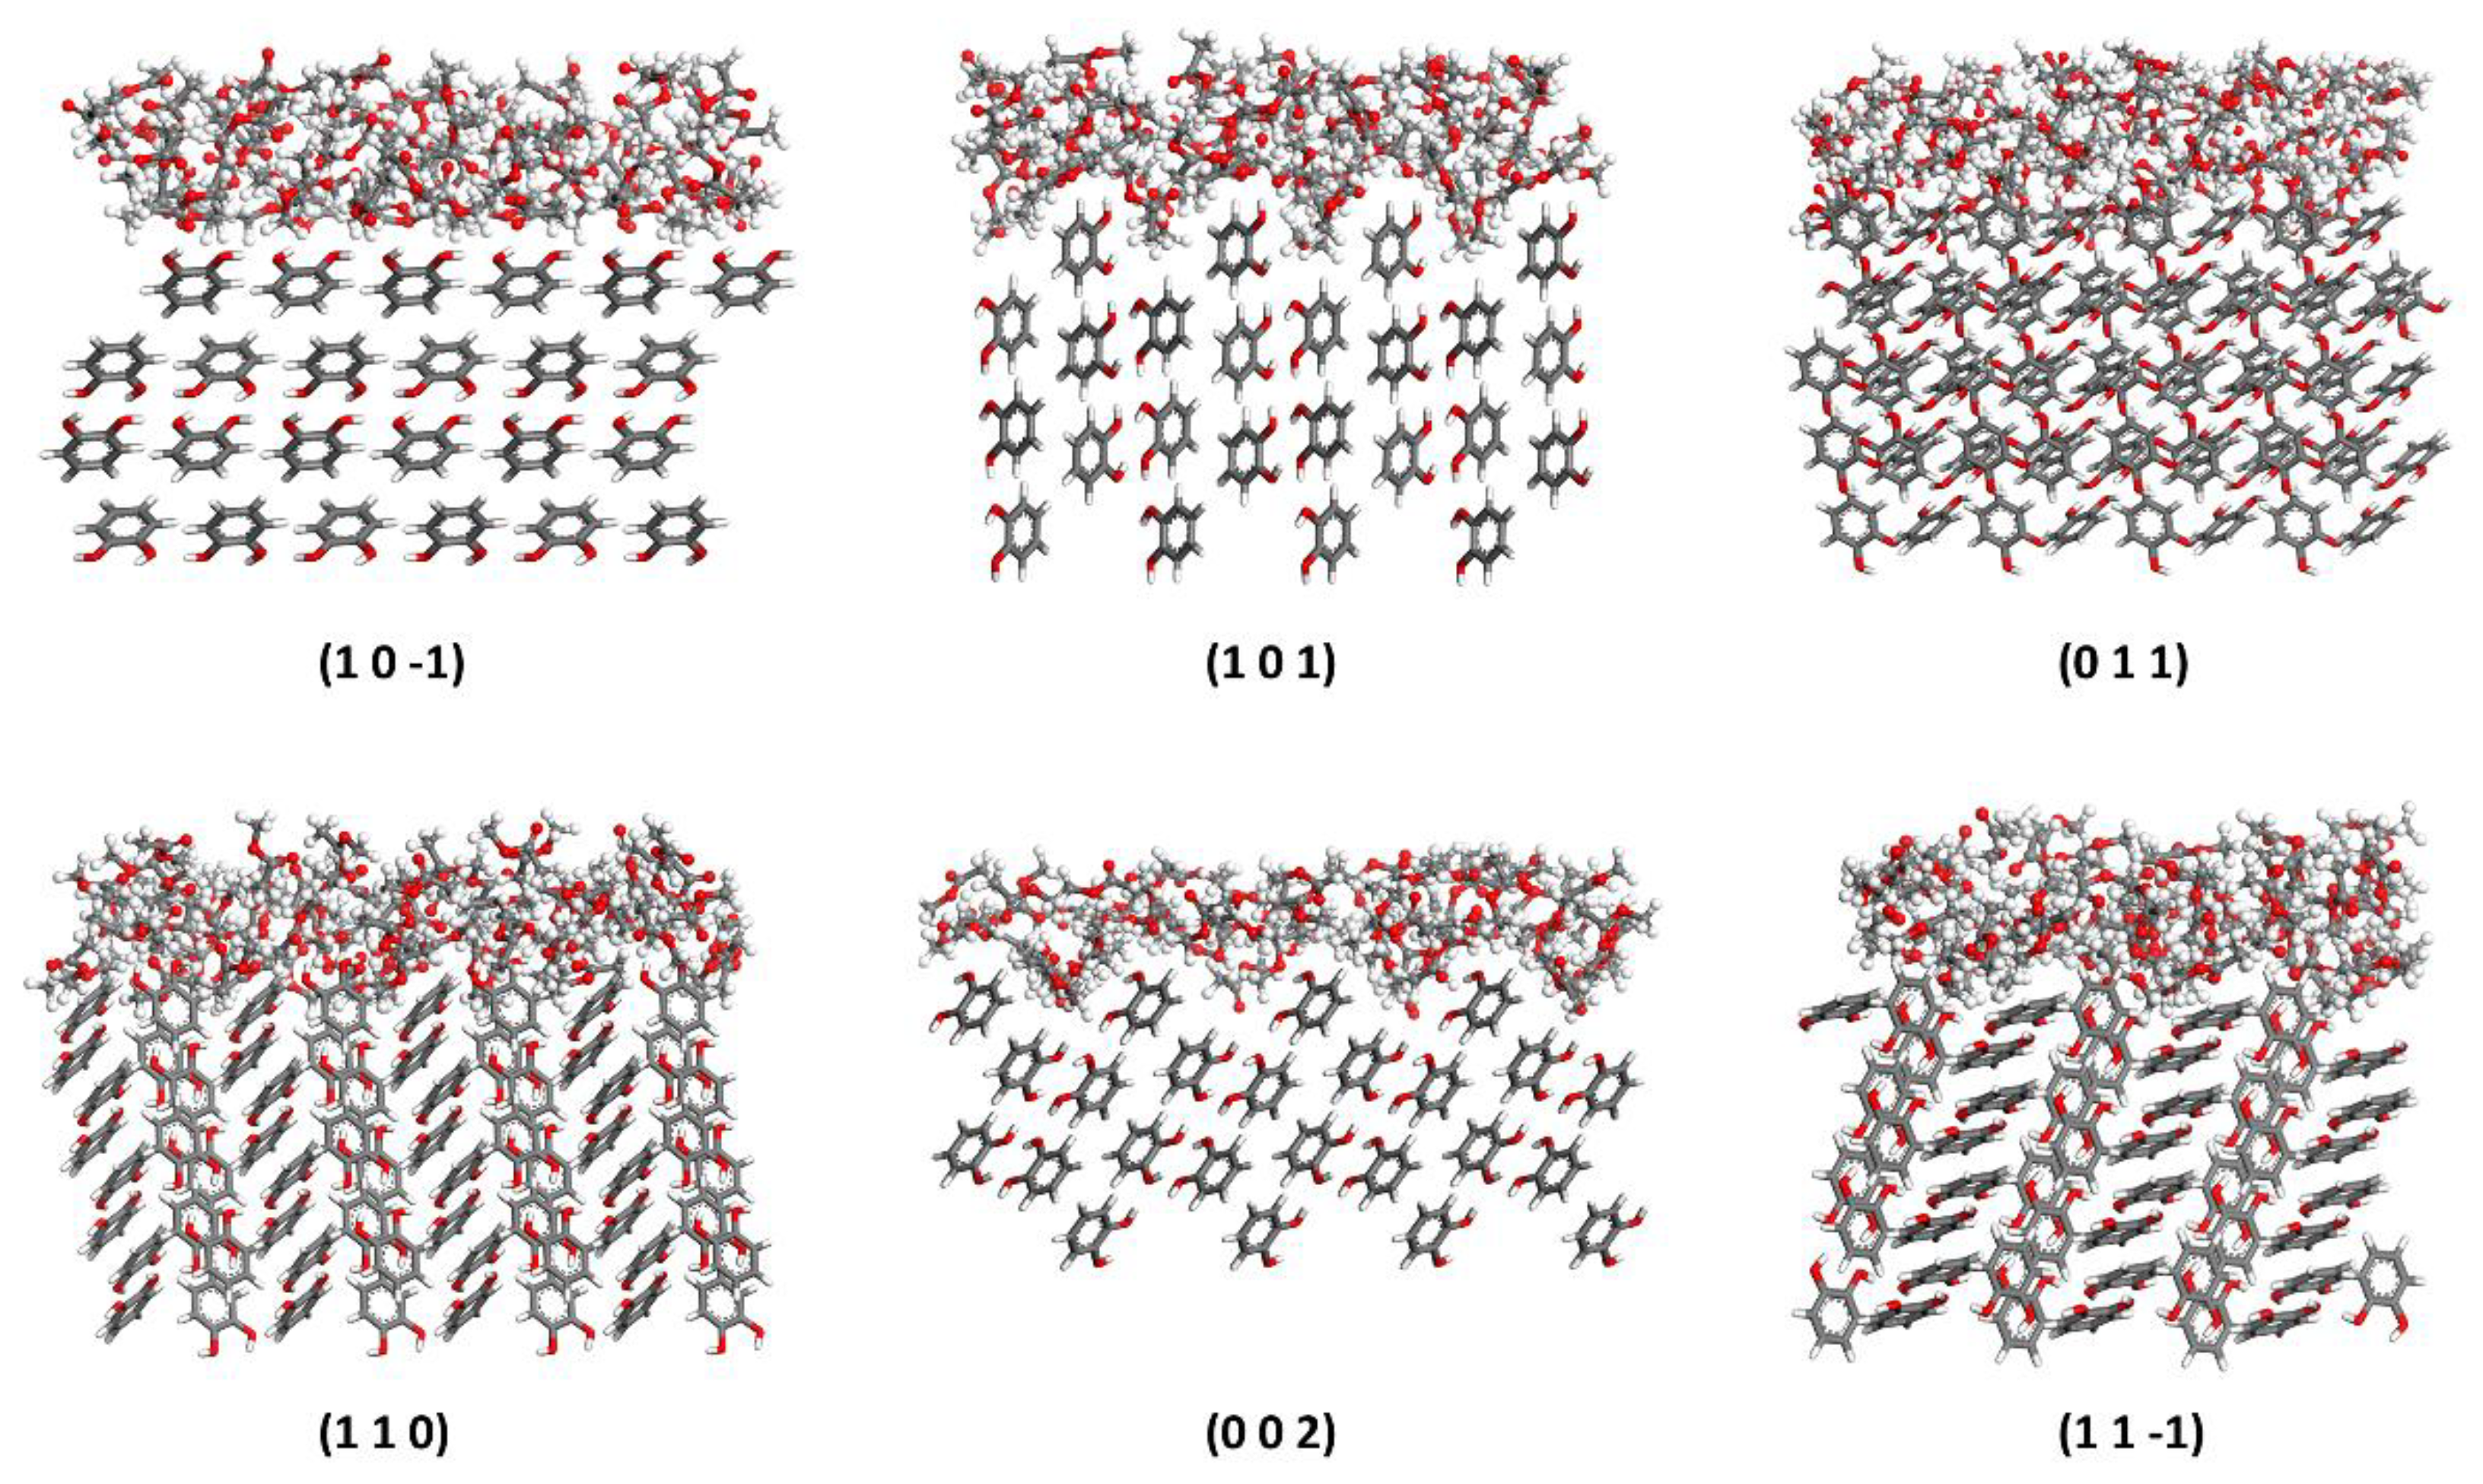
The anisotropy of the catechol crystal structure leads to a distinct molecular alignment on each crystal face, and then gives rise to a different solvent molecular distribution at the solvent–crystal interface [45]. Such differences caused by surface structure have crucial effects on the adsorption of solvents on crystal faces, finally bringing changes to crystal growth and morphology. Here, we took the MD-simulated equilibrium configurations of the interface model of catechol and methyl acetate molecules as an example to explore how surface properties affected crystal–solvent interactions. As can be seen in Figure 6, the alignment of methyl acetate molecules differed on the six crystal faces owing to the diverse crystal surface structure. The catechol molecules on the (1 0 −1) face were arranged relatively orderly and compactly to form a relatively flat surface. However, the catechol molecules on the (0 1 1) and (0 0 2) faces were angled to the crystal plane, leading to a bumpy surface which may surround more solvent and solute molecules. In addition, the molecular alignment makes polar hydroxyl groups exposed on crystal surfaces, which was more favorable to the adsorption of solvent molecules with polar groups. Different positions and angles of the exposed groups may have formed various non-bonding interactions with distinct strength and provided different adsorption areas for solvent molecules. Numerous methyl acetate molecules adsorbed on the grooves of (1 0 1), (0 1 1), (1 1 0) and (0 0 2) faces, while for (1 0 −1) and (1 1 −1) faces, relatively flat crystal surfaces were unhelpful for molecule adsorption, which may have resulted in a smaller amount of adsorbed solvent molecules on these faces compared to the others.

4.4.2. Roughness of Surfaces

To quantitatively describe the surface properties, a parameter S was introduced to evaluate the roughness of crystal surfaces:
S = A acc A box
where Aacc and Ahkl represent the solvent-accessible area and surface area for the (h k l) crystal surface in the unit cell, respectively. A larger S means a rougher surface with larger adsorption areas for the solute and solvent molecules to interact with crystal surfaces. With the accessible areas of solvents calculated by the Connolly surface model (showed in blue in Figure 7), Table 4 lists the calculated S values of the crystal faces. Although the shapes of the solvent-accessible areas varied on each crystal face, they all had periodic fluctuations which could form grooves of more contact area with solute and solvent molecules. As shown in Table 4, the order of the roughness values for the six crystal faces was as follows: (1 0 1) > (0 1 1) > (0 0 2) > (1 1 0) > (1 1 −1) > (1 0 −1). The (1 0 −1) face with the smallest S value (1.23) provided the minimum areas for molecule incorporation, which meant it was probably difficult for solute and solvent molecules to adsorb on this face compared with the other faces. This was consistent with the relatively slow growth rate of the (1 0 −1) face, which led to a larger face area. Similarly, the (1 1 0) face grew more slowly than the (1 0 1) face and had a larger area proportion in methyl acetate. It is worth noting that the (0 0 2) faces with a moderate S value disappeared in all kinds of crystals grown from solvent systems, while the (1 0 1) faces with the largest S value remain at last. As can be seen from Table 3, the |Es| values of the (1 0 1) faces were larger than those of the (0 0 2) faces in all three solvents, which meant that the solvent molecules were more likely to adsorb on the (1 0 1) face compared to the (0 0 2) face, leading to a stronger solvent inhibition on the growth of the (1 0 1) face. As for the (0 0 2) face, less adsorbed solvent molecules provided possibilities for the continuous adsorption of the solute molecules, which indicated a fast growth rate.

4.4.3. Diffusion Coefficient

As mentioned above, the independent S values analysis was not entirely consistent with the crystal morphology results. Therefore, another factor, the diffusion capacity of solvent molecules, was introduced to look into the solvent diffusion effects on crystal growth. Based on the well known Einstein relationship [46], the diffusion coefficient (D) of the solvent molecules was defined as the derivative of the mean square displacement (MSD) with respect to time [47]:
D = 1 6 lim t d d t i = 1 N | r i ( t ) r i ( 0 ) | 2 ,
where N stands for the number of solvent molecules and ri(t) represents the position of the molecule i at time t.
Stronger interactions existed between the solvents and crystal faces with larger D values due to an increasing number of solvent molecules diffusing to the interface [21]. As listed in Table 5, the D values were listed in the following sequence: (1 0 −1) > (0 0 2) > (1 0 1) > (1 1 −1) > (0 1 1) > (1 1 0) in isopropanol, (1 0 −1) > (0 0 2) > (1 1 −1) > (0 1 1) > (1 1 0) > (1 0 1) in methyl acetate, and (1 0 −1) > (1 0 1) > (0 0 2) > (1 1 −1) > (1 1 0) > (0 1 1) in ethyl acetate. Compared with those of isopropanol, the D values of methyl acetate and ethyl acetate were relatively large, indicating stronger interactions with the crystal surfaces which were consistent with the values of Eint in the corresponding solvent systems. Obviously, the diffusion coefficient on the (1 0 −1) face was the largest one among the six crystal faces for all the three kinds of solvent molecules. This indicated that more solvent molecules gathered on the (1 0 −1) face and strong interactions existed between the solvent molecules and the crystal face although the adsorption areas provided by this face were small with the minimum S value. Thus, for the factors affecting the growth of the (1 0 −1) face, the solvent–crystal interface interaction was more dominant than the surface roughness. As a result, the (1 0 −1) face manifested a relatively slow growth of the crystal face and the largest area in real morphology. Apart from the large D value on (0 0 2) faces, the D values on crystal faces were in reasonable agreement with the experimental crystal area results, as solute molecules were more likely to adsorb on the faces with smaller D values, on which solvent molecules take less growth active sites [48]. For example, the (1 1 0) and (0 1 1) faces disappeared in ethyl acetate with smaller D values (2.11 × 10⁻⁹ m2 s−1 and 1.94 × 10⁻⁹ m2 s−1, respectively), while the (1 1 0) and (0 1 1) face with small D values (0.67 × 10⁻⁹ m2 s−1 and 0.69 × 10⁻⁹ m2 s−1, respectively) did not exist in the final morphology in isopropanol. Despite the high D values on (0 0 2) faces, it was easier for solute molecules to adsorb on the crystal surface than it was for the solvent molecules to form a new layer of catechol crystal because their |E’att| values were larger than the corresponding |Es| values.

4.4.4. Solvent Effects on Crystal Aspect Ratios

Discussions on energies and surface structures on solvent–crystal interfaces have pointed out some reasons for changes in crystal morphology. Apart from these factors, interaction types, especially hydrogen bonds, are worth discussing in our case since catechol and the three kinds of solvent molecules possess hydrogen and oxygen atoms to form hydrogen bonds.
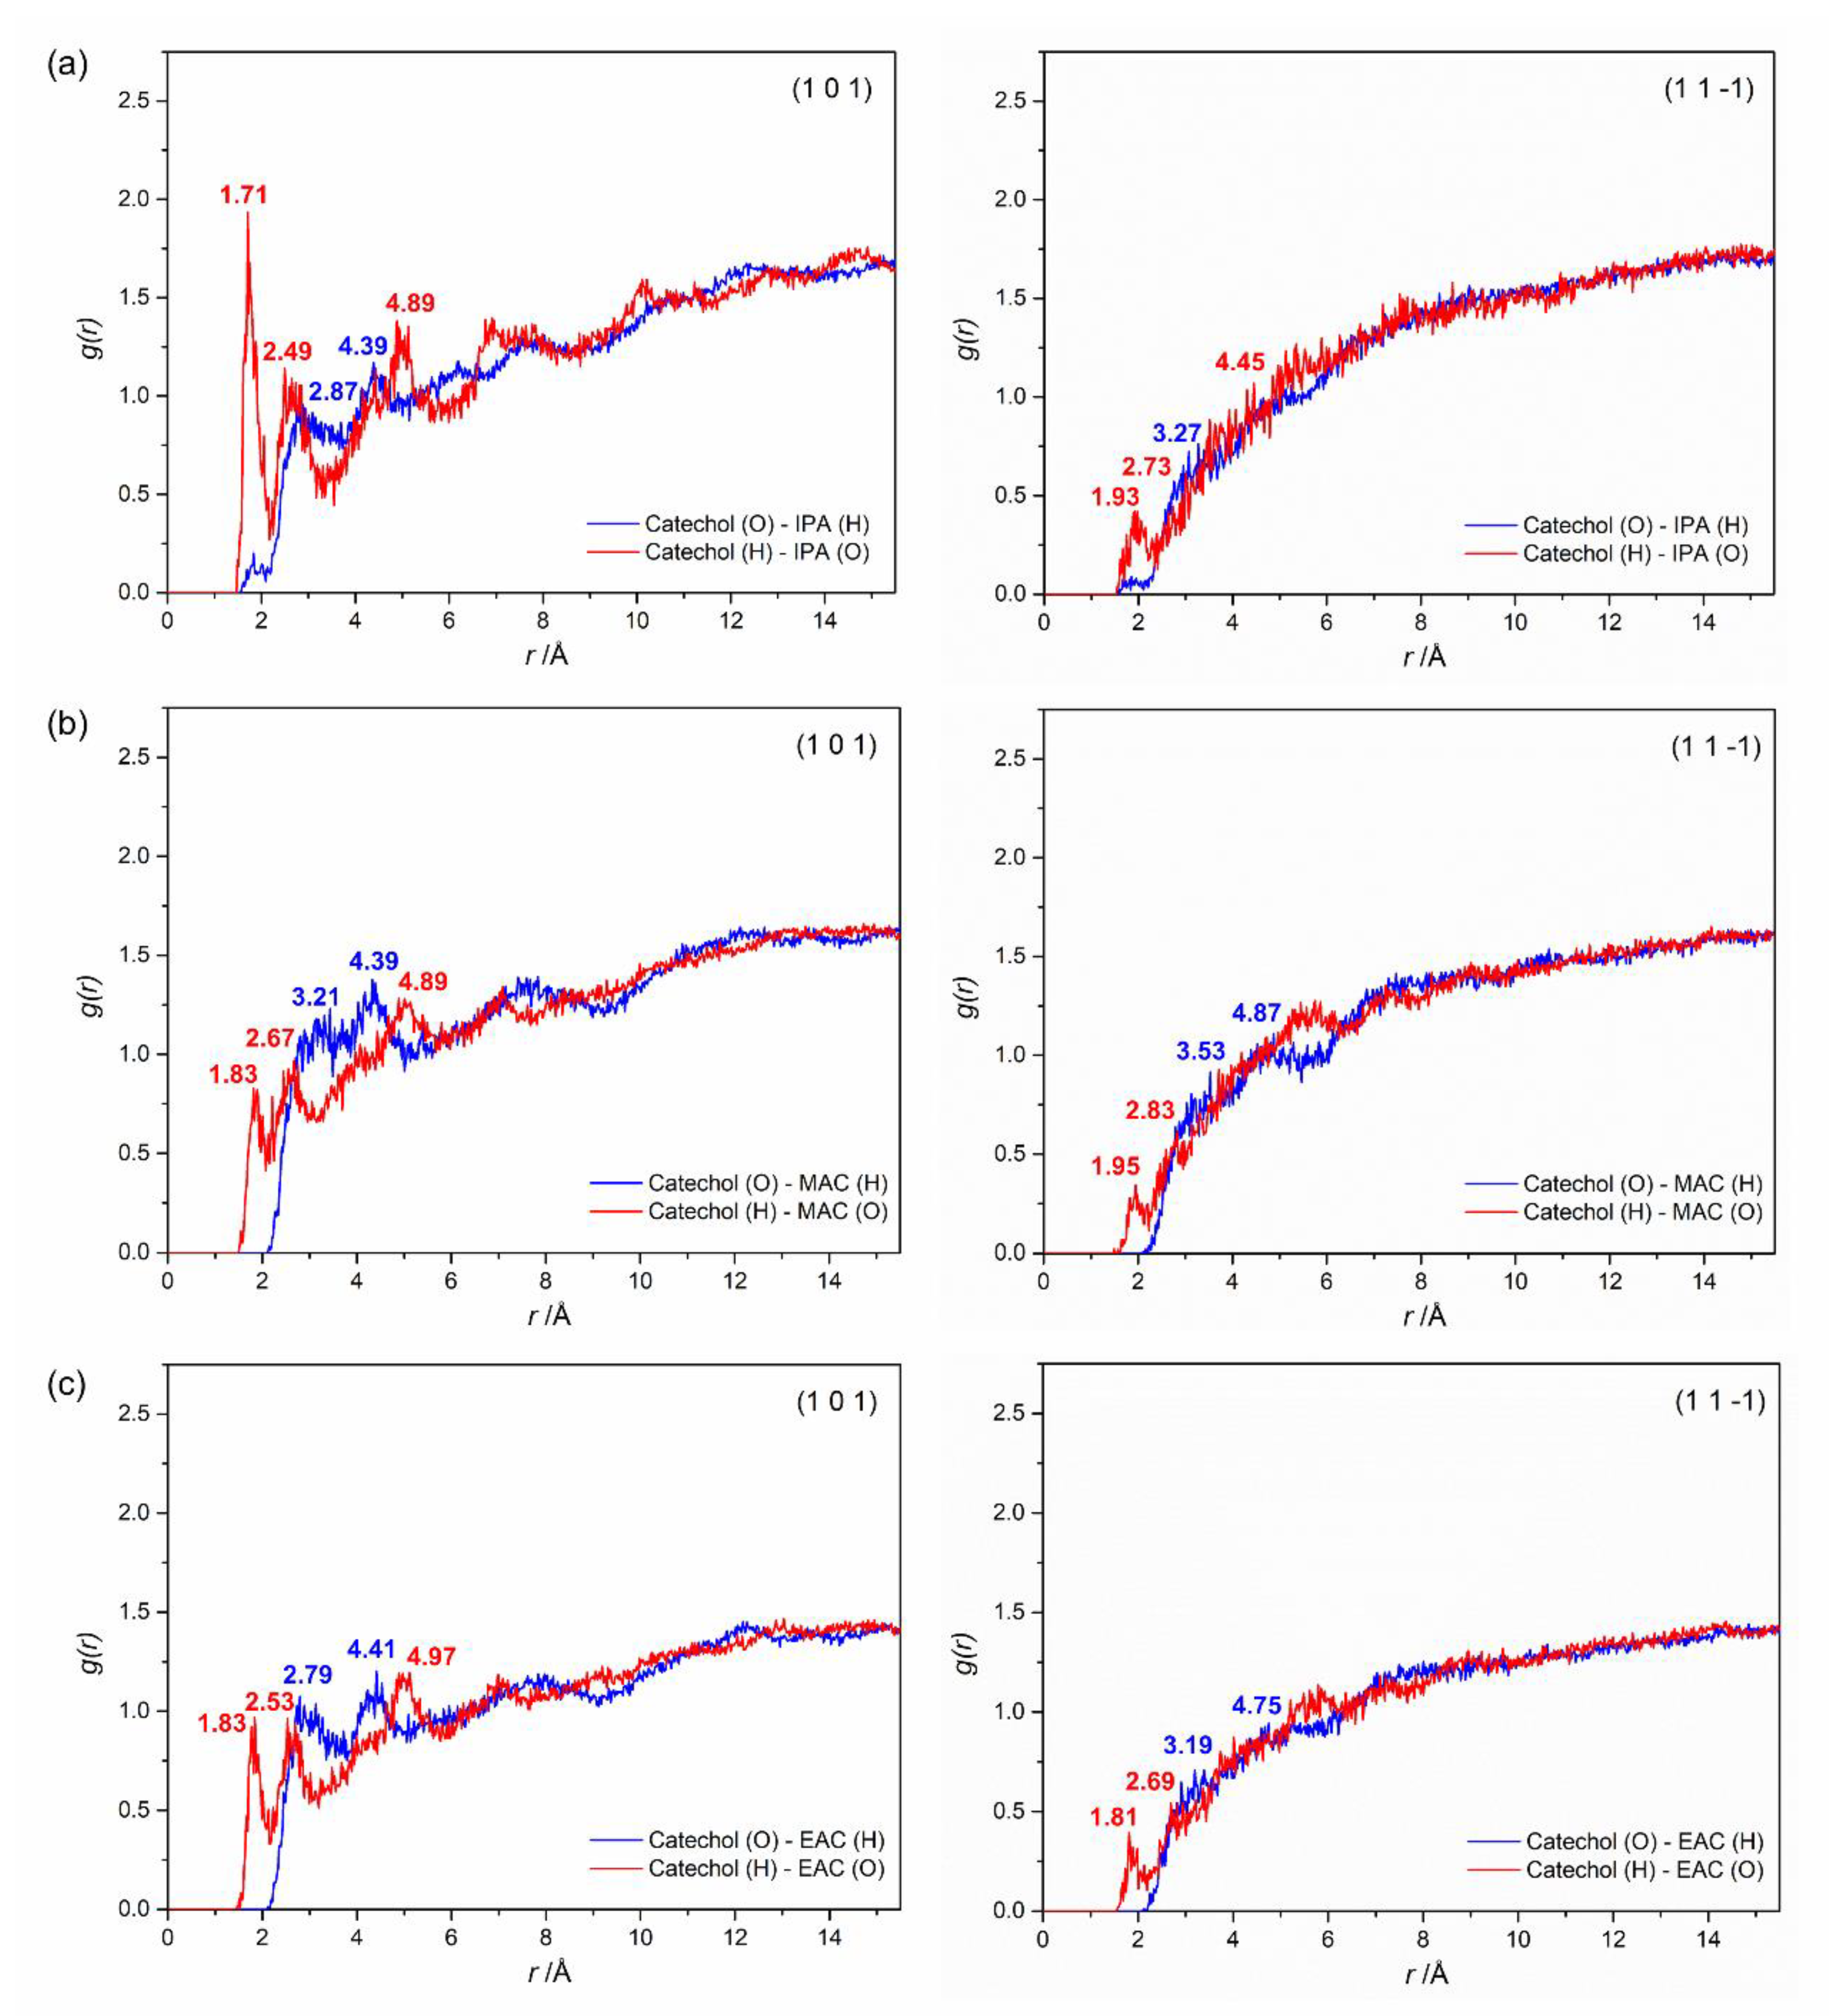
The existence of hydrogen bonds is a significant factor affecting the types and the strength of the interactions on solvent–crystal interfaces, which play a vital role in crystal morphology [49]. Therefore, the radial distribution function (RDF), g(r), was applied to explore the interactions on the solvent–crystal interfaces, which described how atom density varied as a function of the distance from the specified hydrogen or oxygen atom [50].
In general, hydrogen bonds and van der Waals interactions belong to short-range interactions whose effective intermolecular range is under 5.0 Å. The effective range of hydrogen bonds is usually defined to be within 3.1 Å, while the range for van der Waals interaction is between 3.1 Å to 5.0 Å [51]. Interactions that are effective above 5.0 Å are called long-range interactions and usually refer to electrostatic interactions [37]. As mentioned above, the aspect ratio was defined as the length along the (1 0 −1) face divided by the width along the (1 0 1) face. From Figure 4 we can conclude that the crystal length along the (1 0 −1) face was decided by the growth of the (1 0 1) face, while the crystal width along the (1 0 1) face is mainly related to the growth of the (1 1 −1) face. So here we took the examples of the RDF on the (1 0 1) face and the (1 1 −1) face in all three solvents in order to find the solvent effects on crystal aspect ratios, with the outermost layer of each face analyzed because of its proximity to solvent molecules. As shown in Figure 8, the positions of the first sharp peaks in red were all in the range of 1.70–2.00 Å, indicating that the oxygen atoms of the solvent molecules formed a strong hydrogen bond with the hydrogen atoms of the catechol molecules on the (1 0 1) face and the (1 1 −1) face. Therefore, the crystal face growth was inhibited by the solvent molecules adsorbed around the crystal surface. With different positions and strengths of the peaks, the inhibition resulted in diverse effects on the crystal face growth, which could be analyzed by the aspect ratios and face areas in final crystal habits. In particular, as shown in Figure 8a, with larger numbers of sharper peaks (r = 1.71, 2.49 and 2.87 Å), the (1 0 1) face grew at a slower rate due to the stronger solvent inhibition in isopropanol compared to those in methyl acetate and ethyl acetate, leading to a shorter crystal length compared with those in the other two solvents. In other words, compared to that in isopropanol, the crystal morphology turns longer as a hexagonal tabular shape in ethyl acetate with the relatively weaker hydrogen bonds on the (1 0 1) face. The results were consistent with the R’hkl values of (1 0 1) faces in Table 3 which indicated the relative growth rates (1.40 and 19.65 in isopropanol and ethyl acetate, respectively). In addition, the crystal in methyl acetate had a fusiform-like morphology with the existence of the (1 1 0) face (the RDF curve shown in Supplementary Materials Figure S2). It is remarkable that the RDF curves of the (1 1 0) face and the (1 0 1) face showed great similarity in methyl acetate, but the (1 1 0)face was larger than the (1 0 1) face in the final morphology. Thus, the catechol crystal habit in methyl acetate was mainly related to the surface structure and the attachment energy of the crystal faces.
The similar RDF curves of the (1 1 −1) faces in methyl acetate and ethyl acetate showed the same numbers of peaks, but the peaks (r = 1.81 Å) in ethyl acetate appeared earlier compared to those in methyl acetate, which indicates the stronger inhibition of the (1 1 −1) face in ethyl acetate. The results corresponded with the R’hkl values of the (1 1 −1) faces in Table 3 (3.42 and 3.75 in ethyl acetate and methyl acetate, respectively). The relatively slow growth of the (1 1 −1) face led to a shorter crystal width in the final morphology, increasing the aspect ratio of catechol crystal in ethyl acetate indirectly. Therefore, the crystals tended to be longer in ethyl acetate than those in methyl acetate, which supports the conclusion that the crystal aspect ratio was mainly dependent on the growth of the (1 0 1) and (1 1 −1) faces. Apart from the peaks within 3.1 Å, several peaks appeared in the range of 3.1–5.0 Å and above 5.0 Å in all the RDF curves, indicating the existence of strong van der Waals and electrostatic interactions between the selected atoms.
Above all, it can be concluded that the differences in the aspect ratio of the catechol crystals were attributed to distinct growth inhibition effects of the three solvents mainly on the (1 0 1) and (1 1 −1) faces. Strong hydrogen bonds exist between the hydrogen atoms of catechol and the oxygen atoms of solvents in the three solvents, which becomes a non-negligible factor in catechol morphology, especially the crystal aspect ratio.

5. Conclusions

In this study, we successfully simulated the crystal habits of catechol in isopropanol, methyl acetate and ethyl acetate using the MAE model which takes solvent effects into consideration. The analysis on the calculated attachment energy indicates that the interactions on solvent−crystal interfaces had essential effects on catechol crystal morphology in all three experimental systems. Factors such as surface structure and diversity of interaction types were explored to find their synergy for crystal shapes.
The (1 0 −1) face was the most morphologically dominant crystal face because its relatively flat surface provided less adsorption sites for both solvent and solute molecules, leading to a relatively slow face growth. The molecular alignment, roughness and diffusion coefficient analysis on dominant crystal faces indicates that the (0 0 2) and (0 1 1) faces disappeared in final crystal morphology due to the competitive adsorption of molecules favorable for solutes to continuously adsorb on the surface. The RDF curves reveal that several types of interactions contributed to real crystal morphology in solvent systems, of which the hydrogen bond was a crucial factor to analyze the change in the aspect ratios of crystal. The shape distinctions of catechol crystals were mainly attributed to the attachment energy as well as the diverse strength of hydrogen bonds between solvent molecules and catechol molecules on (1 0 1) and (1 1 −1) faces. Moreover, the simulated crystal morphology of catechol was consistent with the crystallized ones obtained from all three solvents, proving the practicability of the MAE model to select optimal crystal morphology in industrial crystallization using simulation methods.

Supplementary Materials

The following are available online at https://www.mdpi.com/2073-4352/10/4/316/s1, Table S1: The cleaved depth and size of catechol crystal faces to form a simulation supercell. Figure S1: The simulated XRD pattern of catechol crystal. Figure S2: The RDF analysis between catechol and methyl acetate on the (1 1 0) face.

Author Contributions

Conceptualization, L.Z. (Ling Zhou) and D.Z.; methodology, D.Z., S.Z. and C.W.; software, S.Z., D.Z. and P.C.; validation, S.Z. and Q.Y.; formal analysis, D.Z., P.C. and C.W.; investigation, D.Z., P.C. and J.D.; data curation, D.Z., S.Z. and L.Z. (Ling Zhou); writing—original draft preparation, D.Z. and S.Z.; writing—review and editing, D.Z., S.Z., J.D., C.W., Y.H. and Q.Y.; visualization, D.Z. and P.C.; supervision, B.H. and L.Z. (Lina Zhou); project administration, Q.Y. and H.H.; funding acquisition, Q.Y. All authors have read and agreed to the published version of the manuscript.

Funding

The authors are grateful for the financial support of the National Natural Science Foundation of China (No. 21706183).

Conflicts of Interest

The authors declare no conflict of interest.

References

  1. Beckmann, W. Crystallization: Basic Concepts and Industrial Applications; Wiley-VCH: Weinheim, Germany, 2013. [Google Scholar]
  2. MacLeod, C.S.; Muller, F.L. On the Fracture of Pharmaceutical Needle-Shaped Crystals during Pressure Filtration: Case Studies and Mechanistic Understanding. Org. Process Res. Dev. 2012, 16, 425–434. [Google Scholar] [CrossRef]
  3. Kim, S.; Lotz, B.; Lindrud, M.; Girard, K.; Moore, T.; Nagarajan, K.; Alvarez, M.; Lee, T.; Nikfar, F.; Davidovich, M.; et al. Control of the particle properties of a drug substance by crystallization engineering and the effect on drug product formulation. Org. Process Res. Dev. 2005, 9, 894–901. [Google Scholar] [CrossRef]
  4. Rasenack, N.; Müller, B.W. Ibuprofen crystals with optimized properties. Int. J. Pharm. 2002, 245, 9–24. [Google Scholar] [CrossRef]
  5. Širola, I.; Lukšić, J.; Šimunić, B.; Kujundžić, N. Effect of crystal size and shape on bulk density of pharmaceutical powders. J. Cryst. Growth 1997, 181, 403–409. [Google Scholar] [CrossRef]
  6. Stoica, C.; Verwer, P.; Meekes, H.; van Hoof, P.J.C.M.; Kaspersen, F.M.; Vlieg, E. Understanding the effect of a solvent on the crystal habit. Cryst. Growth Des. 2004, 4, 765–768. [Google Scholar] [CrossRef]
  7. Cashell, C.; Corcoran, D.; Hodnett, B.K. Effect of amino acid additives on the crystallization of L-glutamic acid. Cryst. Growth Des. 2005, 5, 593–597. [Google Scholar] [CrossRef]
  8. Yang, D.; Hrymak, A.N. Crystal Morphology of Hydrogenated Castor Oil in the Crystallization of Oil-in-Water Emulsions: Part I. Effect of Temperature. Ind. Eng. Chem. Res. 2011, 50, 11585–11593. [Google Scholar] [CrossRef]
  9. Boerrigter, S.X.M.; Cuppen, H.M.; Ristic, R.I.; Sherwood, J.N.; Bennema, P.; Meekes, H. Explanation for the supersaturation-dependent morphology of monoclinic paracetamol. Cryst. Growth Des. 2002, 2, 357–361. [Google Scholar] [CrossRef]
  10. Di Renzo, F. Zeolites as tailor-made catalysts: Control of the crystal size. Catal. Today 1998, 41, 37–40. [Google Scholar] [CrossRef]
  11. Blagden, N.; Davey, R.J.; Lieberman, H.F.; Williams, L.; Payne, R.; Roberts, R.; Rowe, R.; Docherty, R. Crystal chemistry and solvent effects in polymorphic systems—Sulfathiazole. J. Chem. Soc. Faraday T 1998, 94, 1035–1044. [Google Scholar] [CrossRef]
  12. Urbelis, J.H.; Swift, J.A. Solvent Effects on the Growth Morphology and Phase Purity of CL-20. Cryst. Growth Des. 2014, 14, 1642–1649. [Google Scholar] [CrossRef]
  13. Liu, J.; Chang, Z.; He, Y.; Yang, M.; Dang, J. Solvent effects on the crystallization of avermectin B1a. J. Cryst. Growth 2007, 307, 131–136. [Google Scholar] [CrossRef]
  14. Khoshkhoo, S.; Anwar, J. Study of the effect of solvent on the morphology of crystals using molecular simulation: Application to α-resorcinol and N-n-octyl-D-gluconamide. J. Chem. Soc. Faraday Trans. 1996, 92, 1023–1025. [Google Scholar] [CrossRef]
  15. de Graaf, J.; Filion, L.; Marechal, M.; van Roij, R.; Dijkstra, M. Crystal-structure prediction via the floppy-box Monte Carlo algorithm: Method and application to hard (non)convex particles. J. Chem. Phys. 2012, 137, 214101. [Google Scholar] [CrossRef]
  16. Zhang, W.-B.; Chen, C.; Zhang, S.-Y. Equilibrium Crystal Shape of Ni from First Principles. J. Phys. Chem. C 2013, 117, 21274–21280. [Google Scholar] [CrossRef]
  17. Dzade, N.Y.; Roldan, A.; de Leeuw, N.H. Surface and shape modification of mackinawite (FeS) nanocrystals by cysteine adsorption: A first-principles DFT-D2 study. Phys. Chem. Chem. Phys. 2016, 18, 32007–32020. [Google Scholar] [CrossRef] [Green Version]
  18. Lynch, A.; Verma, V.; Zeglinski, J.; Bannigan, P.; Rasmuson, A. Face indexing and shape analysis of salicylamide crystals grown in different solvents. CrystEngComm 2019, 21, 2648–2659. [Google Scholar] [CrossRef]
  19. Shi, W.; Chu, Y.; Xia, M.; Lei, W.; Wang, F. Crystal morphology prediction of 1,3,3-trinitroazetidine in ethanol solvent by molecular dynamics simulation. J. Mol. Graph. Model. 2016, 64, 94–100. [Google Scholar] [CrossRef]
  20. Song, L.; Chen, L.; Wang, J.; Chen, F.; Lan, G. Prediction of crystal morphology of 3,4-Dinitro-1H-pyrazole (DNP) in different solvents. J. Mol. Graph. Model. 2017, 75, 62–70. [Google Scholar] [CrossRef]
  21. Wang, C.; Zhang, X.; Du, W.; Huang, Y.-H.; Guo, M.-X.; Li, Y.; Zhang, Z.-X.; Hou, B.-H.; Yin, Q.-X. Effects of solvent and supersaturation on crystal morphology of cefaclor dihydrate: A combined experimental and computer simulation study. CrystEngComm 2016, 18, 9085–9094. [Google Scholar] [CrossRef]
  22. Zhang, M.; Liang, Z.; Wu, F.; Chen, J.-F.; Xue, C.; Zhao, H. Crystal engineering of ibuprofen compounds: From molecule to crystal structure to morphology prediction by computational simulation and experimental study. J. Cryst. Growth 2017, 467, 47–53. [Google Scholar] [CrossRef]
  23. Poornachary, S.K.; Chia, V.D.; Yani, Y.; Han, G.; Chow, P.S.; Tan, R.B.H. Anisotropic Crystal Growth Inhibition by Polymeric Additives: Impact on Modulation of Naproxen Crystal Shape and Size. Cryst. Growth Des. 2017, 17, 4844–4854. [Google Scholar] [CrossRef]
  24. Fiege, H.; Voges, H.W.; Hamamoto, T.; Umemura, S.; Iwata, T.; Miki, H.; Fujita, Y.; Buysch, H.J.; Garbe, D.; Paulus, W. Phenol Derivatives. In Ullmann’s Encyclopedia of Industrial Chemistry; Wiley-VCH: Weinheim, Germany, 2000; pp. 552–555. [Google Scholar]
  25. Krab-Hüsken, L. Production of Catechols: Microbiology and Technology; Wageningen University: Wageningen, The Netherlands, 2002. [Google Scholar]
  26. Mabrouk, A.; Erdocia, X.; Alriols, M.G.; Labidi, J. Economic analysis of a biorefinery process for catechol production from lignin. J. Clean. Prod. 2018, 198, 133–142. [Google Scholar] [CrossRef]
  27. Docherty, R.; Clydesdale, G.; Roberts, K.J.; Bennema, P. Application of Bravais-Friedel-Donnay-Harker, attachment energy and Ising models to predicting and understanding the morphology of molecular crystals. J. Phys. D: Appl. Phys. 1991, 24, 89–99. [Google Scholar] [CrossRef]
  28. Hartman, P.; Bennema, P. The attachment energy as a habit controlling factor: I. Theoretical considerations. J. Cryst. Growth 1980, 49, 145–156. [Google Scholar] [CrossRef]
  29. Hartman, P. The attachment energy as a habit controlling factor II. Application to anthracene, tin tetraiodide and orthorhombic sulphur. J. Cryst. Growth 1980, 49, 157–165. [Google Scholar] [CrossRef]
  30. Hartman, P. The attachment energy as a habit controlling factor: III. Application to corundum. J. Cryst. Growth 1980, 49, 166–170. [Google Scholar] [CrossRef]
  31. Hartman, P.; Perdok, W.G. On the relations between structure and morphology of crystals. I. Acta Crystallogr. 1955, 8, 49–52. [Google Scholar] [CrossRef]
  32. Weissbuch, I.; Addadi, L.; Lahav, M.; Leiserowitz, L. Molecular Recognition at Crystal Interfaces. Science 1991, 253, 637–645. [Google Scholar] [CrossRef]
  33. Connolly, M. Analytical molecular surface calculation. J. Appl. Crystallogr. 1983, 16, 548–558. [Google Scholar] [CrossRef]
  34. Clegg, W.; Scott, A.J. CCDC 1575175: Experimental Crystal Structure Determination. CSD Commun. 2017. [Google Scholar] [CrossRef]
  35. Materials Studio, 6.0; Acceryls Inc.: San Diego, CA, USA, 2012.
  36. Sun, H. COMPASS:  An ab Initio Force-Field Optimized for Condensed-Phase ApplicationsOverview with Details on Alkane and Benzene Compounds. J. Phys. Chem. B 1998, 102, 7338–7364. [Google Scholar] [CrossRef]
  37. Lan, G.; Jin, S.; Li, J.; Wang, J.; Li, J.; Chen, S.; Li, L. The study of external growth environments on the crystal morphology of ε-HNIW by molecular dynamics simulation. J. Mater. Sci. 2018, 53, 12921–12936. [Google Scholar] [CrossRef]
  38. Li, J.; Jin, S.; Lan, G.; Xu, Z.; Wu, N.; Chen, S.; Li, L. The effect of solution conditions on the crystal morphology of β-HMX by molecular dynamics simulations. J. Cryst. Growth 2019, 507, 38–45. [Google Scholar] [CrossRef]
  39. Xia, X.; Jiang, D. Determination and correlation of solubilities of catechol. CIESC J. 2007, 58, 1082–1085. [Google Scholar] [CrossRef]
  40. Parmar, M.M.; Khan, O.; Seton, L.; Ford, J.L. Polymorph selection with morphology control using solvents. Cryst. Growth Des. 2007, 7, 1635–1642. [Google Scholar] [CrossRef]
  41. Kitamura, M.; Ishizu, T. Growth kinetics and morphological change of polymorphs of L-glutamic acid. J. Cryst. Growth 2000, 209, 138–145. [Google Scholar] [CrossRef]
  42. Ter Horst, J.H.; Kramer, H.J.M.; van Rosmalen, G.M.; Jansens, P.J. Molecular modelling of the crystallization of polymorphs. Part I: The morphology of HMX polymorphs. J. Cryst. Growth 2002, 237, 2215–2220. [Google Scholar] [CrossRef]
  43. Wunderlich, H.; Mootz, D. Die Kristallstruktur von Brenzcatechin: Eine Neubestimmung. Acta Crystallogr. B 1971, 27, 1684–1686. [Google Scholar] [CrossRef] [Green Version]
  44. Zhao, Q.; Liu, N.; Wang, B.; Wang, W. A study of solvent selectivity on the crystal morphology of FOX-7 via a modified attachment energy model. RSC Adv. 2016, 6, 59784–59793. [Google Scholar] [CrossRef]
  45. Liang, Z.; Chen, J.-F.; Ma, Y.; Wang, W.; Han, X.; Xue, C.; Zhao, H. Qualitative rationalization of the crystal growth morphology of benzoic acid controlled using solvents. CrystEngComm 2014, 16, 5997–6002. [Google Scholar] [CrossRef]
  46. Einstein, A. Über einen die Erzeugung und Verwandlung des Lichtes betreffenden heuristischen Gesichtspunkt [AdP 17, 132 (1905)]. Annalen der Physik 2005, 14, 164–181. [Google Scholar] [CrossRef]
  47. Frenkel, D.; Smit, B. Understanding Molecular Simulation: From Algorithms to Applications; Academic Press: Cornwall, UK, 2001; Volume 1, pp. 84–105. [Google Scholar]
  48. Shi, W.; Xia, M.; Lei, W.; Wang, F. Solvent effect on the crystal morphology of 2,6-diamino-3,5-dinitropyridine-1-oxide: A molecular dynamics simulation study. J. Mol. Graph. Model. 2014, 50, 71–77. [Google Scholar] [CrossRef] [PubMed]
  49. Gupta, K.M.; Yani, Y.; Poornachary, S.K.; Chow, P.S. Atomistic Simulation To Understand Anisotropic Growth Behavior of Naproxen Crystal in the Presence of Polymeric Additives. Cryst. Growth Des. 2019, 19, 3768–3776. [Google Scholar] [CrossRef]
  50. Li, J.; Jin, S.; Lan, G.; Ma, X.; Ruan, J.; Zhang, B.; Chen, S.; Li, L. Morphology control of 3-nitro-1,2,4-triazole-5-one (NTO) by molecular dynamics simulation. CrystEngComm 2018, 20, 6252–6260. [Google Scholar] [CrossRef]
  51. Sun, T.; Liu, Q.; Xiao, J.; Zhao, F.; Xiao, H. Molecular Dynamics Simulation of Interface Interactions and Mechanical Properties of CL-20/HMX Cocrystal and Its Based PBXs. Acta Chim. Sinica 2014, 72, 1036. [Google Scholar] [CrossRef] [Green Version]
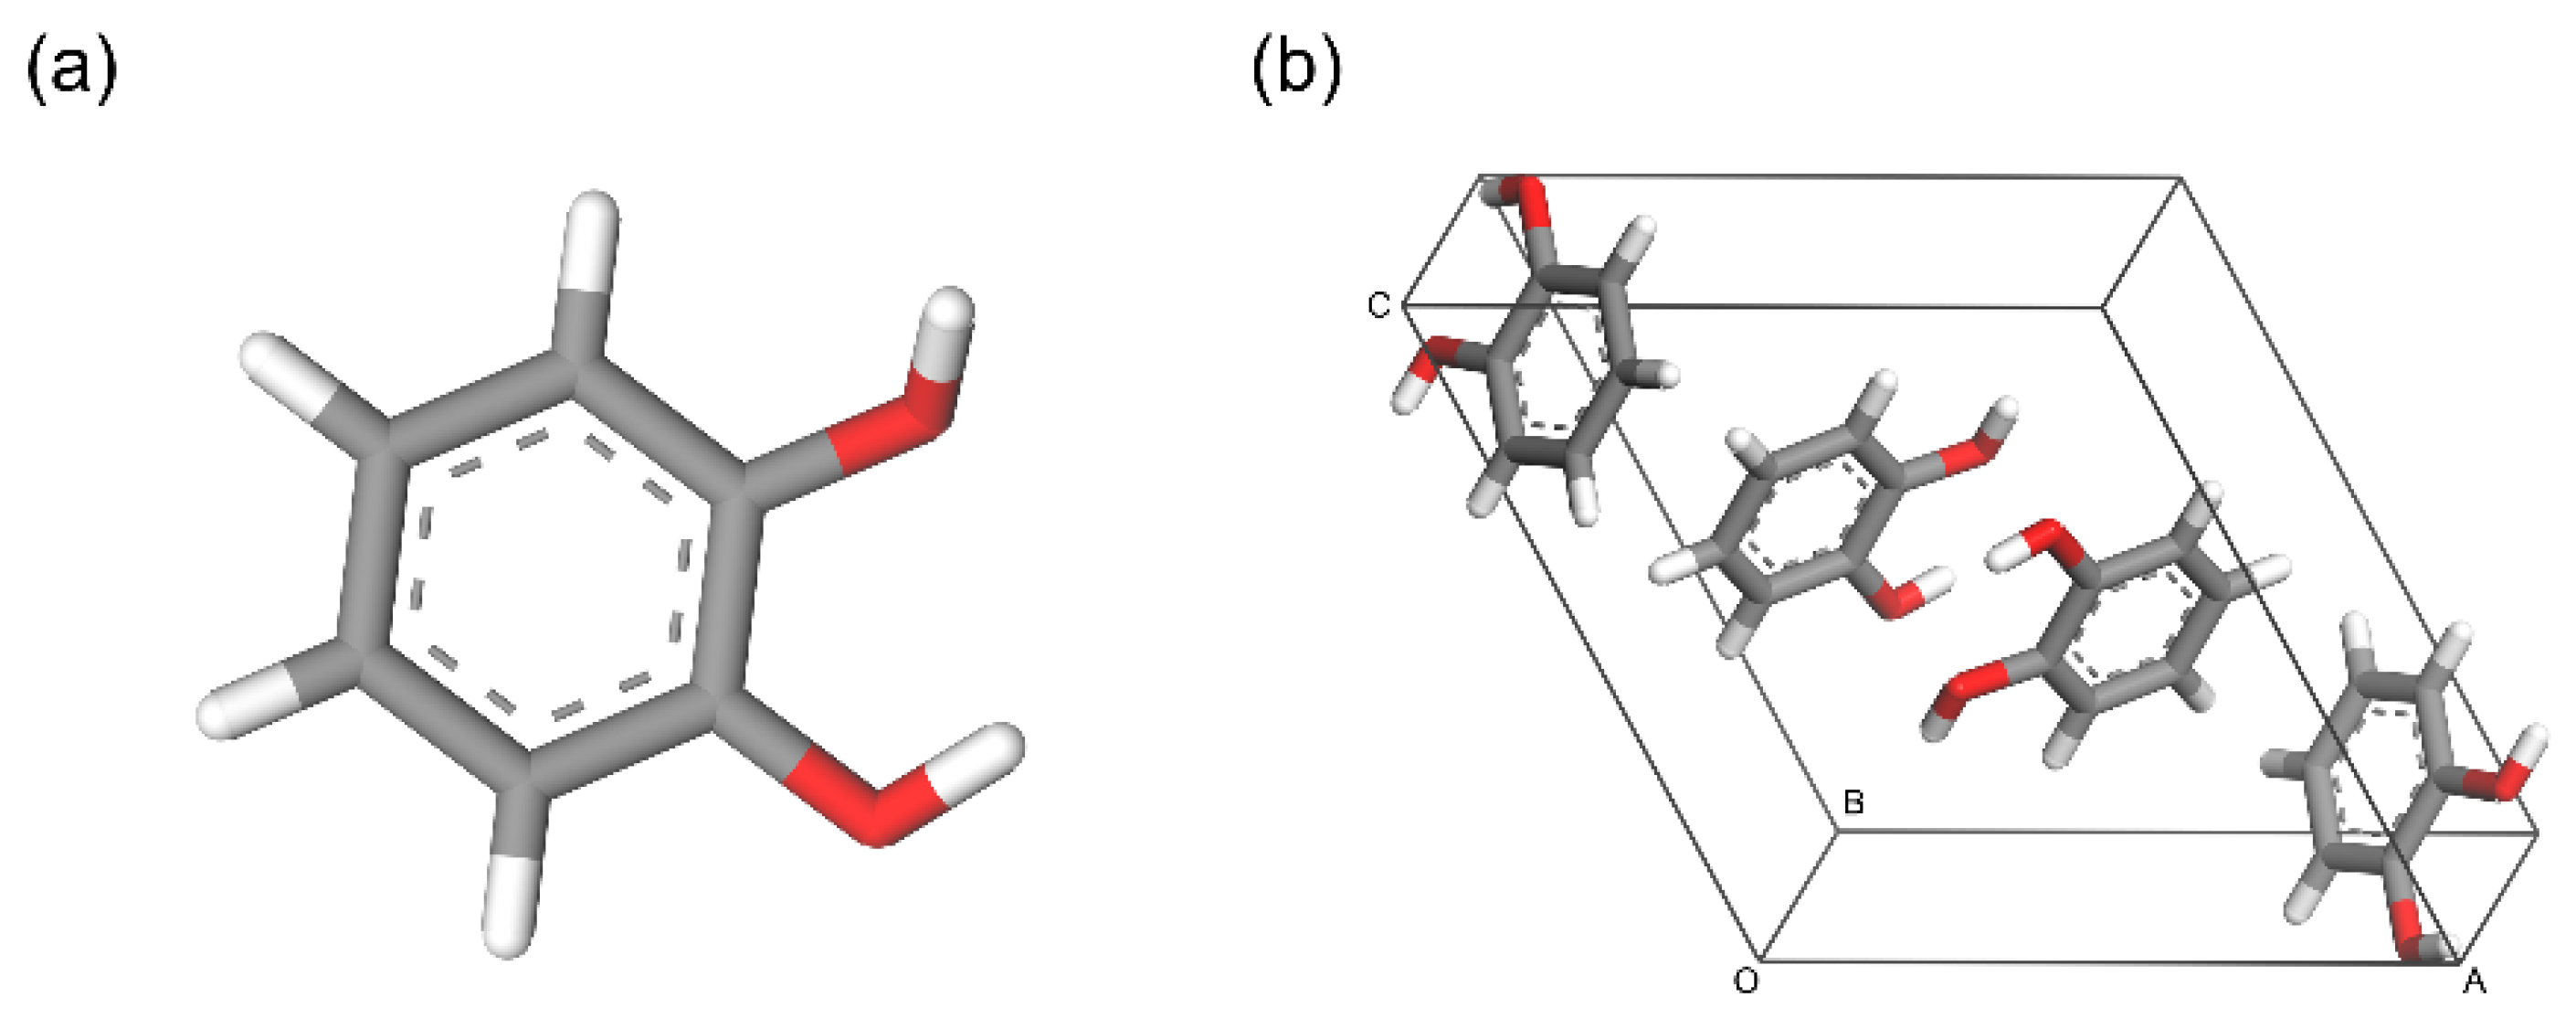
Figure 1. The molecular structure (a) and the unit cell (b) of catechol.
Crystals 10 00316 g001
Figure 2. Powder X-ray diffraction (PXRD) patterns of the catechol crystals: (a) the raw material and the products crystallized from (b) ethyl acetate, (c) methyl acetate, and (d) isopropanol.
Crystals 10 00316 g002
Figure 3. The predicted catechol crystal morphology in the vacuum (a) and the intermolecular interactions in the catechol unit cell calculated by the Crystal Graph (b).
Crystals 10 00316 g003
Figure 4. The modified morphology with the modified attachment energy (MAE) model (on the left) and the corresponding experimental crystal habits (on the right) of catechol in (a) isopropanol (IPA), (b) methyl acetate (MAC), and (c) ethyl acetate (EAC).
Crystals 10 00316 g004
Figure 5. The aspect ratios of the catechol crystals obtained from solvents.
Crystals 10 00316 g005
Figure 6. Methyl acetate molecular alignment on the six main possible crystal faces of catechol via a molecular dynamics (MD) simulation.
Crystals 10 00316 g006
Figure 7. Solvent-accessible areas (the blue grid) of the six important faces of the catechol crystal represented by the Connolly surface.
Crystals 10 00316 g007
Figure 8. The radial distribution function (RDF) analysis between catechol and (a) isopropanol, (b) methyl acetate, (c) ethyl acetate molecules on the (1 0 1) face (left) and the (1 1 −1) face (right).
Crystals 10 00316 g008
Table 1. The comparison of the initial and the optimized lattice parameters of catechol.
Lattice Parametera (Å)b (Å)c (Å)α (°)β (°)γ (°)
Initial10.9415.50910.06990.000119.00090.000
COMPASS optimized10.9695.5559.58890.000121.40390.000
Relative error/%0.260.834.7802.020
Table 2. The parameters of the catechol crystal faces in the vacuum predicted via the attachment energy (AE) model.
Faces (h k l)Multiplicitydhkl (Å)Eatt (kcal mol−1)Area (%)
(1 0 −1)28.19−18.0948.55
(1 0 1)25.47−43.4519.10
(0 1 1)44.78−46.1510.97
(1 1 0)44.71−50.501.25
(0 0 2)24.68−47.410.10
(1 1 −1)44.60−37.6420.03
Table 3. Simulated results of the dominant crystal faces in isopropanol, methyl acetate and ethyl acetate 1.
SolventFacesEtotEsurEsolEintEsE’attR’hklArea/%
Isopropanol(1 0 −1)−11,206.93−3093.73−7916.14−197.05−13.48−4.611.0043.87
(1 0 1)−10,774.85−2646.98−7913.94−213.93−37.01−6.441.4035.57
(0 1 1)−12,056.38−3950.79−7947.46−158.13−26.70−19.454.21-
(1 1 0)−12,186.14−4017.98−7954.85−213.31−30.16−20.354.41-
(0 0 2)−10,824.04−2703.56−7877.07−243.41−17.44−29.976.50-
(1 1 −1)−11,326.17−3180.69−7990.31−155.17−25.20−12.442.7020.56
Methyl acetate(1 0 −1)−6423.31−3093.60−3046.64−283.06−19.361.271.0070.81
(1 0 1)−6027.75−2646.91−3052.75−328.10−56.7613.3110.492.50
(0 1 1)−7330.46−3950.59−2990.34−389.53−65.7719.6315.47-
(1 1 0)−7395.82−4017.81−2971.41−406.60−57.486.985.5014.97
(0 0 2)−6059.46−2703.51−3024.78−331.17−23.72−23.6818.67-
(1 1 −1)−6504.15−3180.63−3062.49−261.03−42.394.753.7511.72
Ethyl acetate(1 0 −1)−8963.16−3093.20−5609.78−260.18−17.80−0.301.0071.14
(1 0 1)−8479.98−2646.54−5548.65−284.79−49.275.8219.653.98
(0 1 1)−9801.90−3950.16−5555.32−296.41−50.053.9013.17-
(1 1 0)−9927.83−4017.27−5527.68−382.88−54.133.6312.24-
(0 0 2)−8487.97−2703.17−5532.21−252.59−18.10−29.3198.96-
(1 1 −1)−9038.79−3180.23−5633.03−225.53−36.62−1.013.4224.88
1 All energies are in kcal mol−1.
Table 4. The roughness values (S) of the dominant crystal faces of the catechol crystal.
FacesAhkl2)Aacc2)S
(1 0 −1)60.9375.021.23
(1 0 1)91.11189.132.08
(0 1 1)104.40211.542.03
(1 1 0)105.99179.811.70
(0 0 2)53.2591.561.72
(1 1 −1)108.51158.591.46
Table 5. The diffusion coefficient (D)1 of the solvent molecules on the different catechol crystal faces.
FacesIsopropanolMethyl AcetateEthyl Acetate
(1 0 −1)1.093.002.53
(1 0 1)0.752.252.28
(0 1 1)0.692.571.94
(1 1 0)0.672.522.11
(0 0 2)0.912.882.21
(1 1 −1)0.742.822.18
1 All D values are in 10−9 m2 s−1.