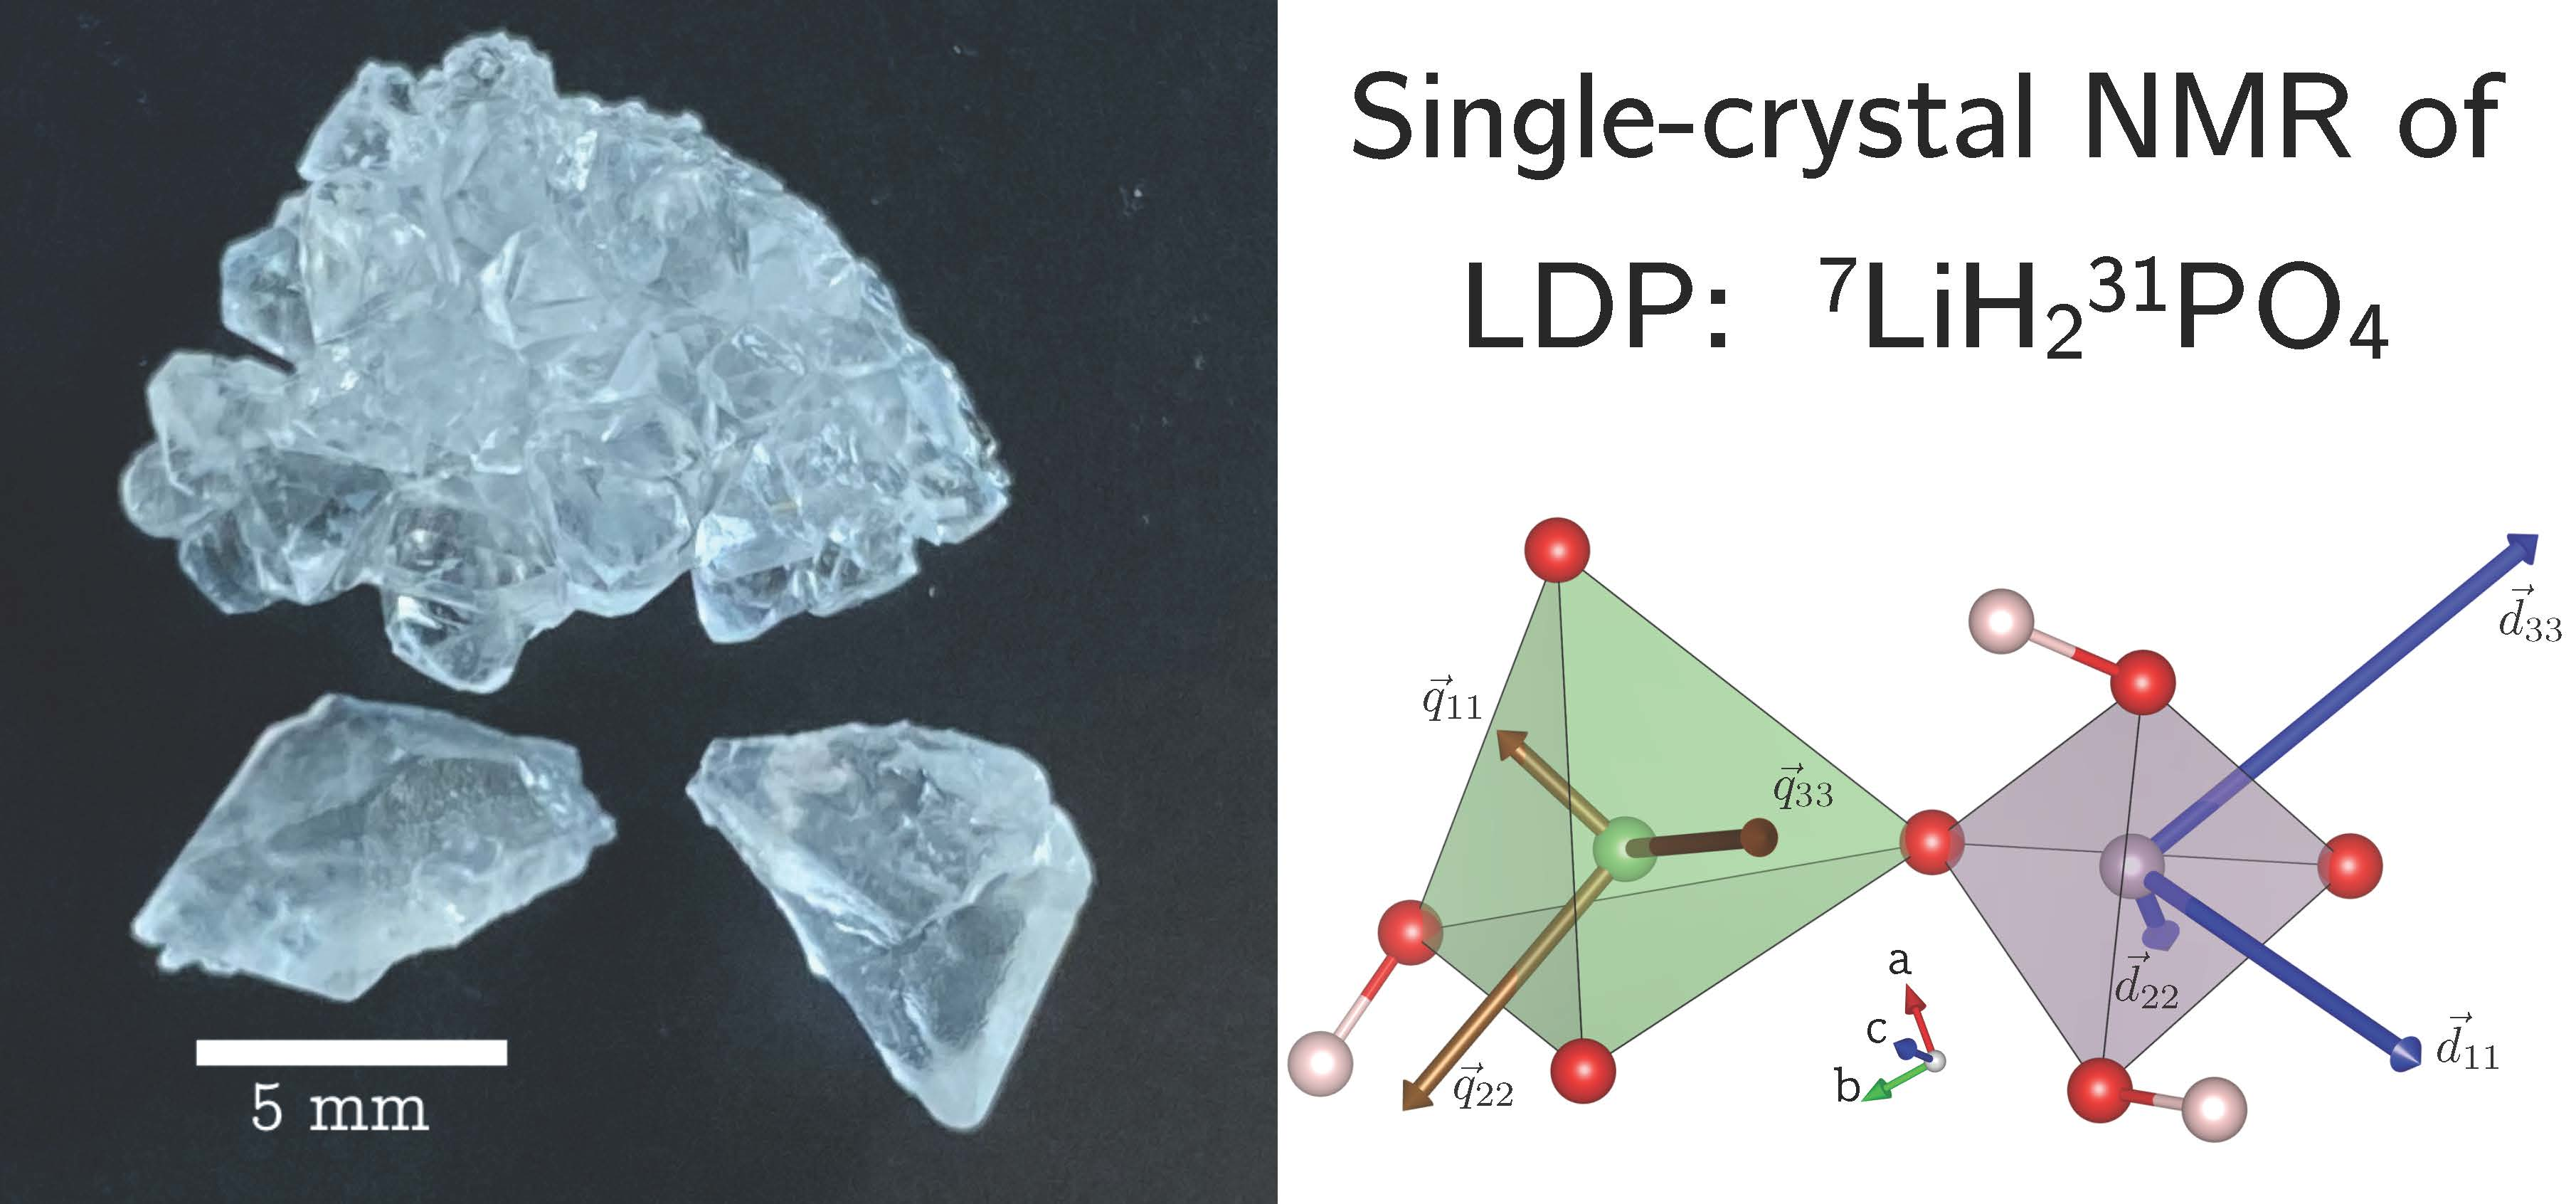
Article

Single-Crystal 31P and 7Li NMR of the Ionic Conductor LiH2PO4

1
Department of Chemistry, University of Munich (LMU), Butenandtstr. 5-13, 81377 Munich, Germany
2
Department of Physics, University of Munich (LMU), Geschwister-Scholl-Platz 1, 80539 Munich, Germany
*
Author to whom correspondence should be addressed.
Crystals 2020, 10(4), 302; https://doi.org/10.3390/cryst10040302
Submission received: 30 March 2020 / Revised: 9 April 2020 / Accepted: 10 April 2020 / Published: 15 April 2020

Abstract

:
The electronic surroundings of phosphorus and lithium atoms in the ionic conductor lithium dihydrogen phosphate (LDP) have been studied by single-crystal nuclear magnetic resonance (NMR) spectroscopy at room temperature. From orientation-dependent NMR spectra of a large homegrown LDP single crystal, the full 31P chemical shift (CS) and 7Li quadrupole coupling (QC) tensor was determined, using a global fit over three rotation patterns. The resulting CS tensor is characterized by its three eigenvalues: δ 11 P A S = ( 67.0 ± 0.6 ) ppm, δ 22 P A S = ( 13.9 ± 1.5 ) ppm, and δ 33 P A S = ( 78.7 ± 0.9 ) ppm. All eigenvalues have also been verified by magic-angle spinning NMR on a polycrystalline sample, using Herzfeld–Berger analysis of the rotational side band pattern. The resulting 7Li QC tensor is characterized by its quadrupolar coupling constant χ = Q 33 P A S = ( 71 ± 1 ) kHz and the two eigenvalues Q 11 P A S = ( 22.3 ± 0.9 ) kHz, and Q 22 P A S = ( 48.4 ± 0.8 ) kHz. The initially unknown orientation of the mounted crystal, expressed by the orientation of the rotation axis in the orthorhombic crystal frame, was included in the global data fit as well, thus obtaining it from NMR data only.

Graphical Abstract

1. Introduction

Lithium dihydrogen phosphate (LDP), LiH 2 PO 4 , exhibits a conductivity of the order of 10 4 Ω 1 cm 1 , which is exceptionally high for a solid at room temperature. This conductivity is predominantly attributed to fast proton movements in the crystal lattice of LDP [1]. This, and the fact that LDP is widely available, makes it a promising material for fuel cell or rechargeable battery applications and hence precise structural and electronic characterization of this material is of great interest. As a well-established analytical technique, Nuclear Magnetic Resonance (NMR) spectroscopy is capable of providing information on structure and dynamics of solids [2,3]. Recently, the mechanism of the protonic conductivity of LDP has been investigated by 1 H NMR spectroscopy of powder samples under magic-angle spinning (MAS) [4,5]. However, not much attention has been paid to the electronic surroundings of the phosphorus and lithium atoms, which despite their light mass have been found to be quite immobile in the crystal structure at room temperature [6]. Since relatively large single crystals of LDP with several mm in diameter can be grown from aqueous solution [7], a good method to analyze the local surroundings of these nuclei is NMR of single crystals.
In the current work, the determination of the full chemical shift tensor δ of 31 P ( I = 1 / 2 ) and quadrupole coupling tensor Q of 7 Li ( I = 3 / 2 ) in LDP by means of single-crystal NMR spectroscopy is presented. LiH 2 PO 4 crystallizes in the orthorhombic space group P n a 2 1 (No. 33), depicted in Figure 1b, with four formula units per unit cell [6]. The PO 4 tetrahedra build a three-dimensional framework connected by two different types of hydrogen bonds. The LiO 4 coordination tetrahedra are linked by their vertices forming [100] isolated chains and share each edge with the PO 4 units. All atoms in the unit cell are located at Wyckoff position 4 a with the general site symmetry 1 C 1 [7]. As a result, no symmetry constraints affect the algebraic form of the NMR interaction tensors, as will be explained in the following.

2. Results

2.1. 31P NMR of LDP

In the solid state, the NMR response of a spin I = 1 / 2 nucleus such as 31P is governed by the chemical shift (CS), and by dipolar (direct) couplings between spins [3]. In the LiH 2 PO 4 lattice, the dipolar couplings between the nuclear spins result in homogeneous line broadening only (as discussed in more detail below), and will not be quantitatively evaluated here. The resonance frequency ν ( 31 P ) of 31 P in LDP may thus be described by the following general notation:
ν ( 31 P ) = ν 0 + ν C S
Here, ν 0 is the Larmor frequency which scales with the magnetic field strength, and ν C S the contribution of the chemical shift which is gauged by the chemical shift tensor δ . Generally, for NMR spectroscopy of single crystals, it is useful to define three distinct coordinate systems, i.e., the laboratory frame, where the z axis is defined by the orientation of the external magnetic field, the crystal lattice ( C R Y ) frame and the principal axis system ( P A S 
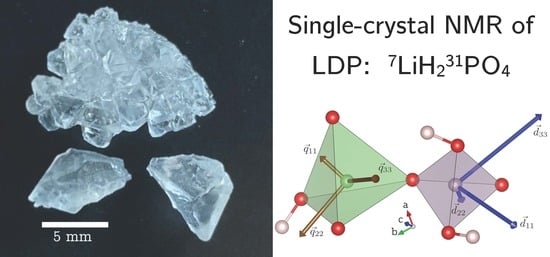
). In the orthorhombic unit cell of LDP, the four phosphorus (and lithium) atoms at Wyckoff position 4 a are related by a two-fold rotation axis parallel to the crystallographic c axis and two glides parallel to the a c , and b c plane. Since NMR is invariant to translational elements and inversions, one can trace four 31 P atoms in the single-crystal spectra (see Figure 1c), which are related by 180° rotations about the three crystallographic a b c axes, starting from the atom closest to the unit cell origin:
P ( 2 ) ( x ¯ , y ¯ , z + 1 2 ) 180 ° ( c ) P ( 1 ) ( x , y , z ) 180 ° ( b ) P ( 3 ) ( x + 1 2 , y ¯ + 1 2 , z ) 180 ° ( a ) P ( 4 ) ( x ¯ + 1 2 , y + 1 2 , z + 1 2 )
Their respective CS tensors in the orthorhombic C R Y frame are therefore described by six independent tensor components which differ only by sign for each 31 P position:
δ P ( 1 ) C R Y = P R S R T U S U V δ P ( 2 ) C R Y = P R S R T U S U V δ P ( 3 ) C R Y = P R S R T U S U V δ P ( 4 ) C R Y = P R S R T U S U V
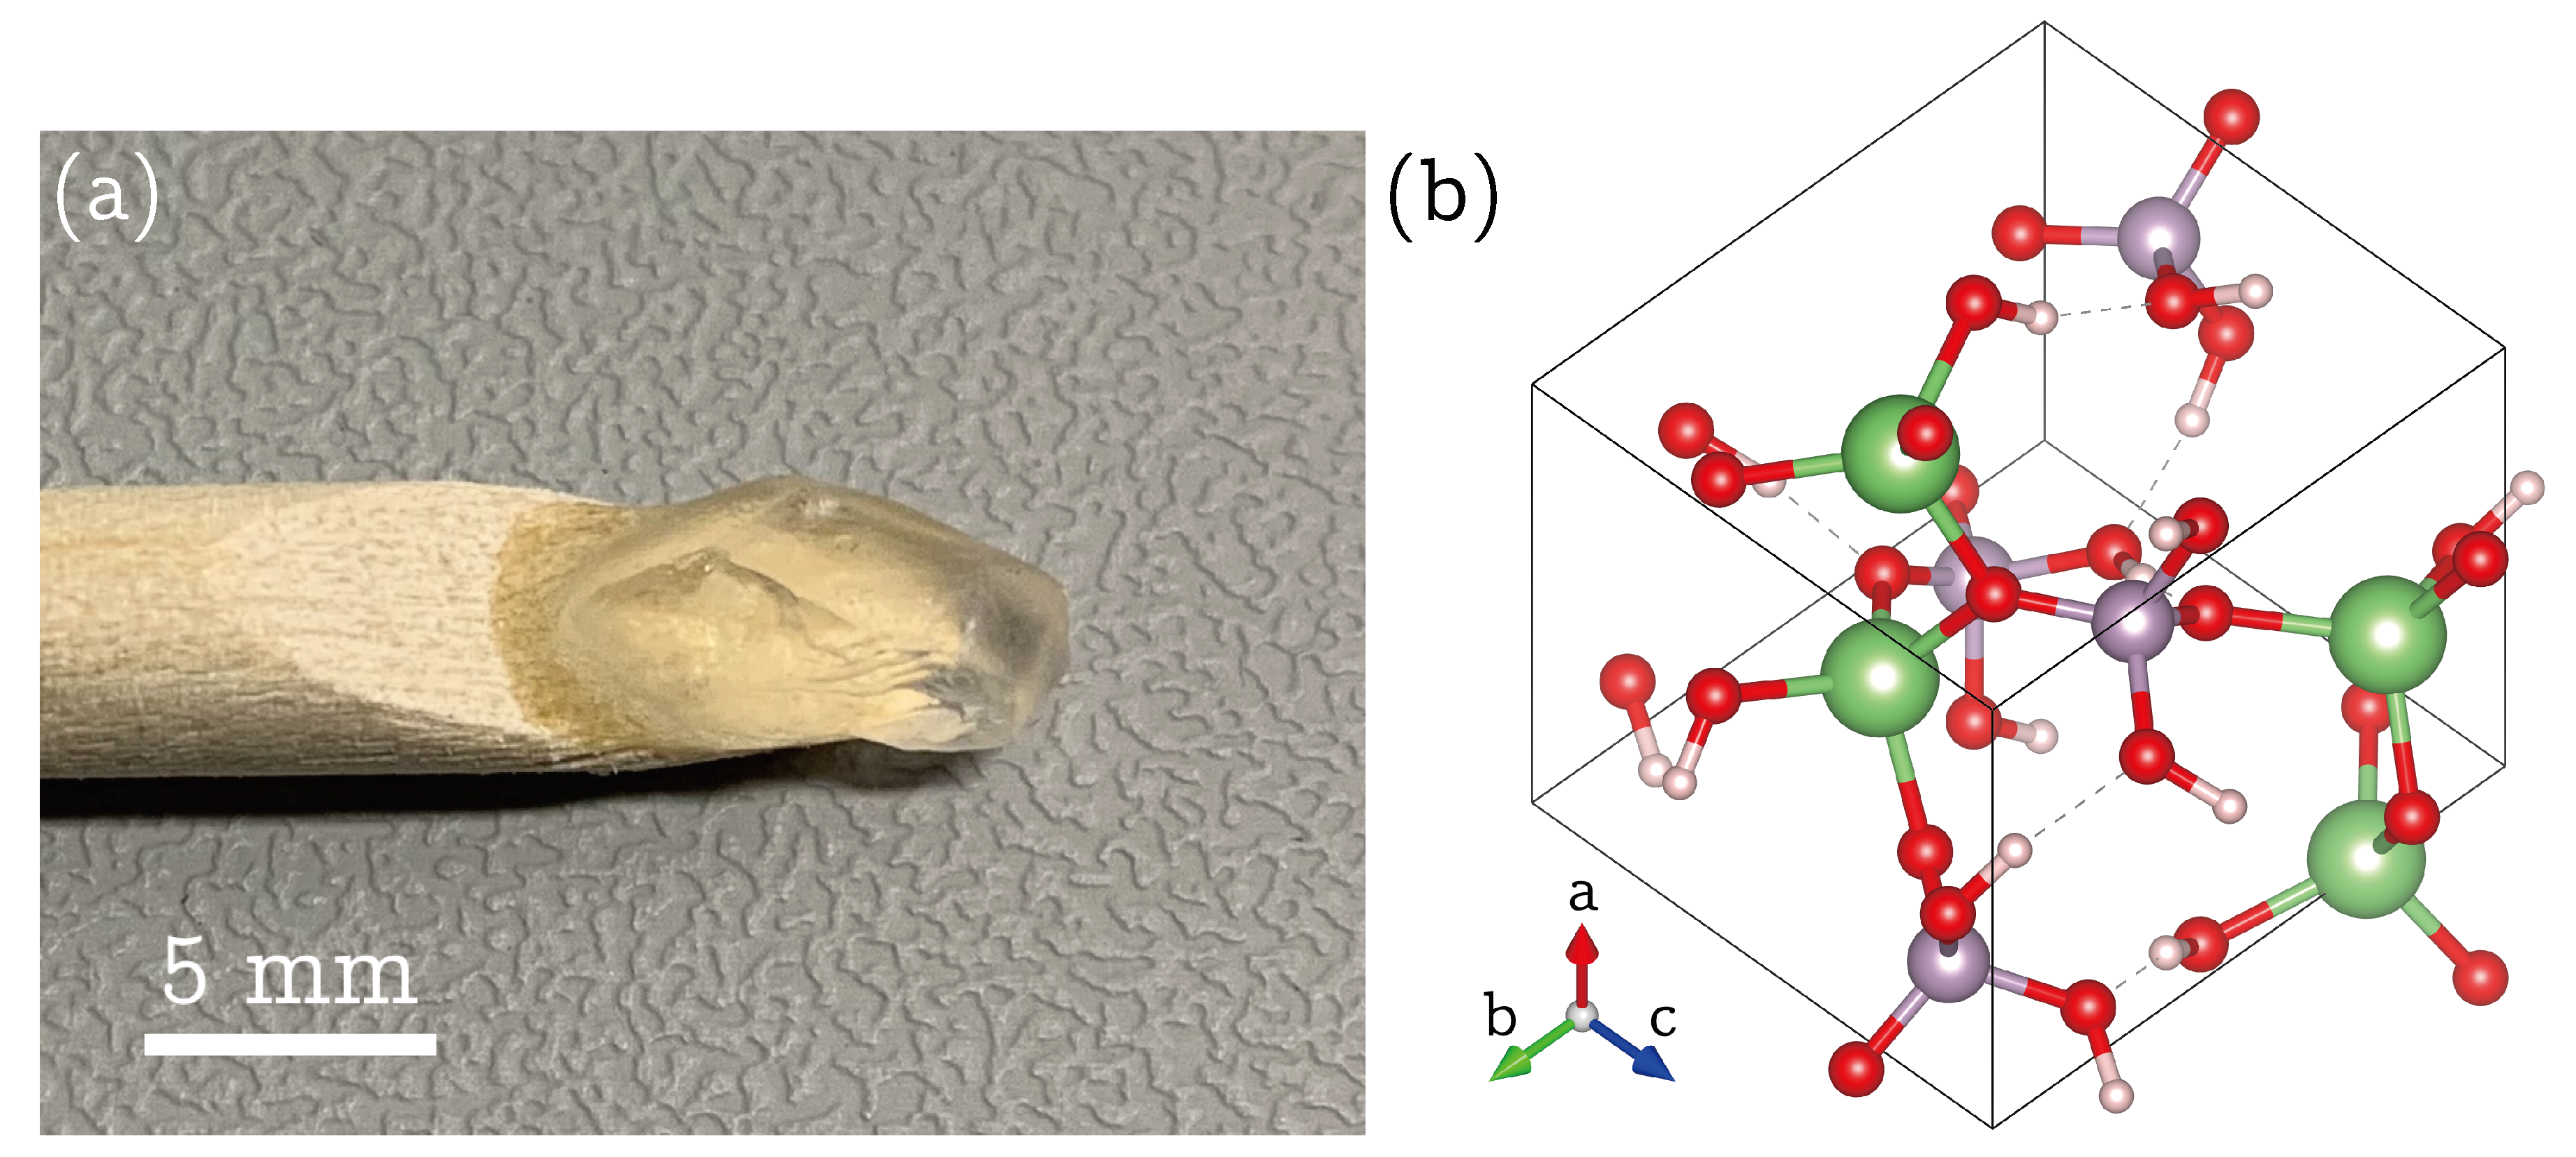
To quantitatively determine these chemical shift tensors, a single crystal of LDP with approximate dimensions of 9 × 5 × 4 mm 3 grown from solution (see Experimental) was fixed on a wooden rotation axis as depicted in Figure 1a. In the goniometer setup, this rotation axis is oriented perpendicular to the external magnetic field. The line positions observed in the 31 P NMR spectrum depend on the relative orientation of the magnetic field vector b 0 to the δ C R Y tensor in the crystal frame, and, in ppm, are given by [9,10]:
ν ( 31 P ) ν 0 ν 0 = ν C S ν 0 [ p p m ] = b 0 T ( φ ) · δ CRY · b 0 ( φ ) = A n + B n cos 2 φ + C n sin 2 φ
31 
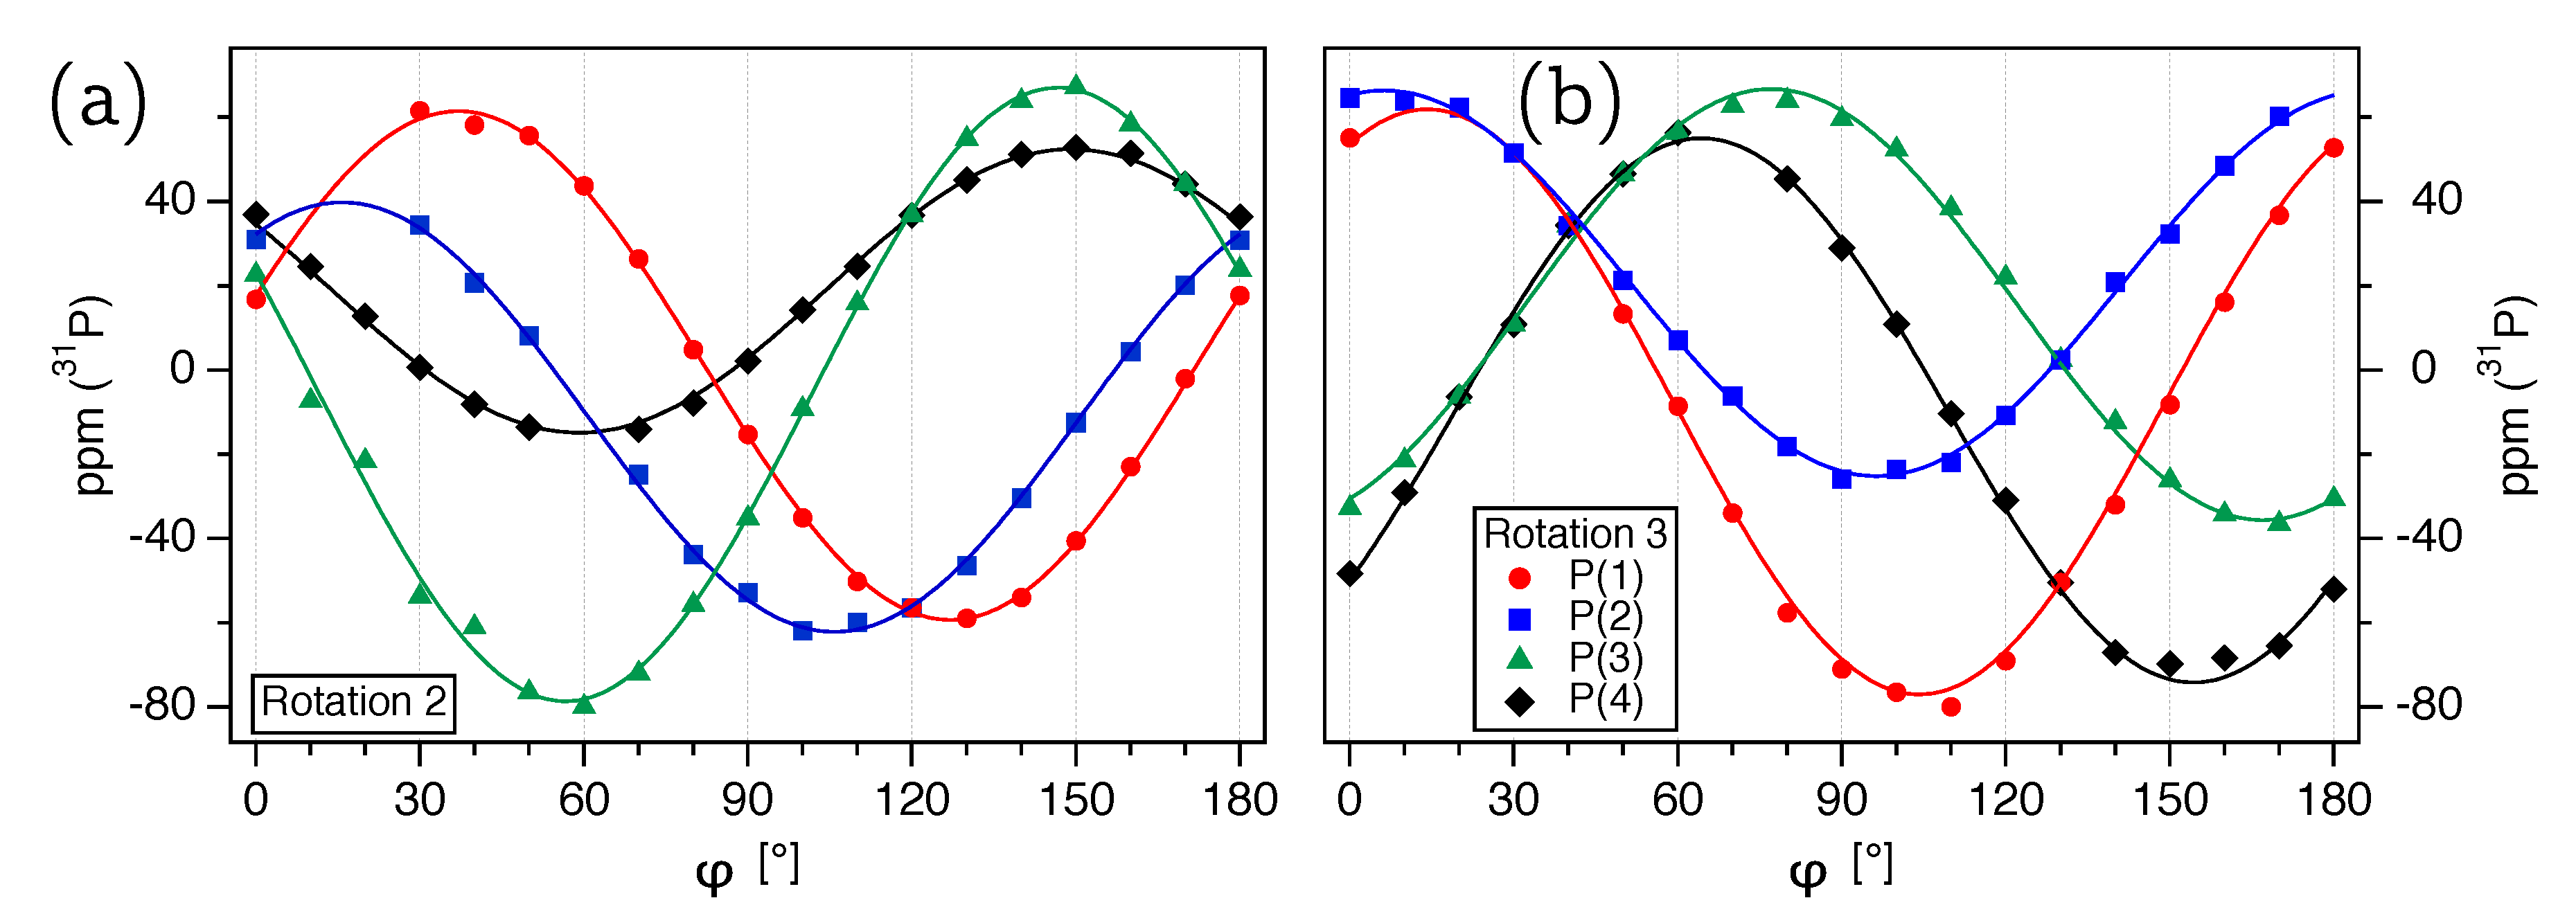
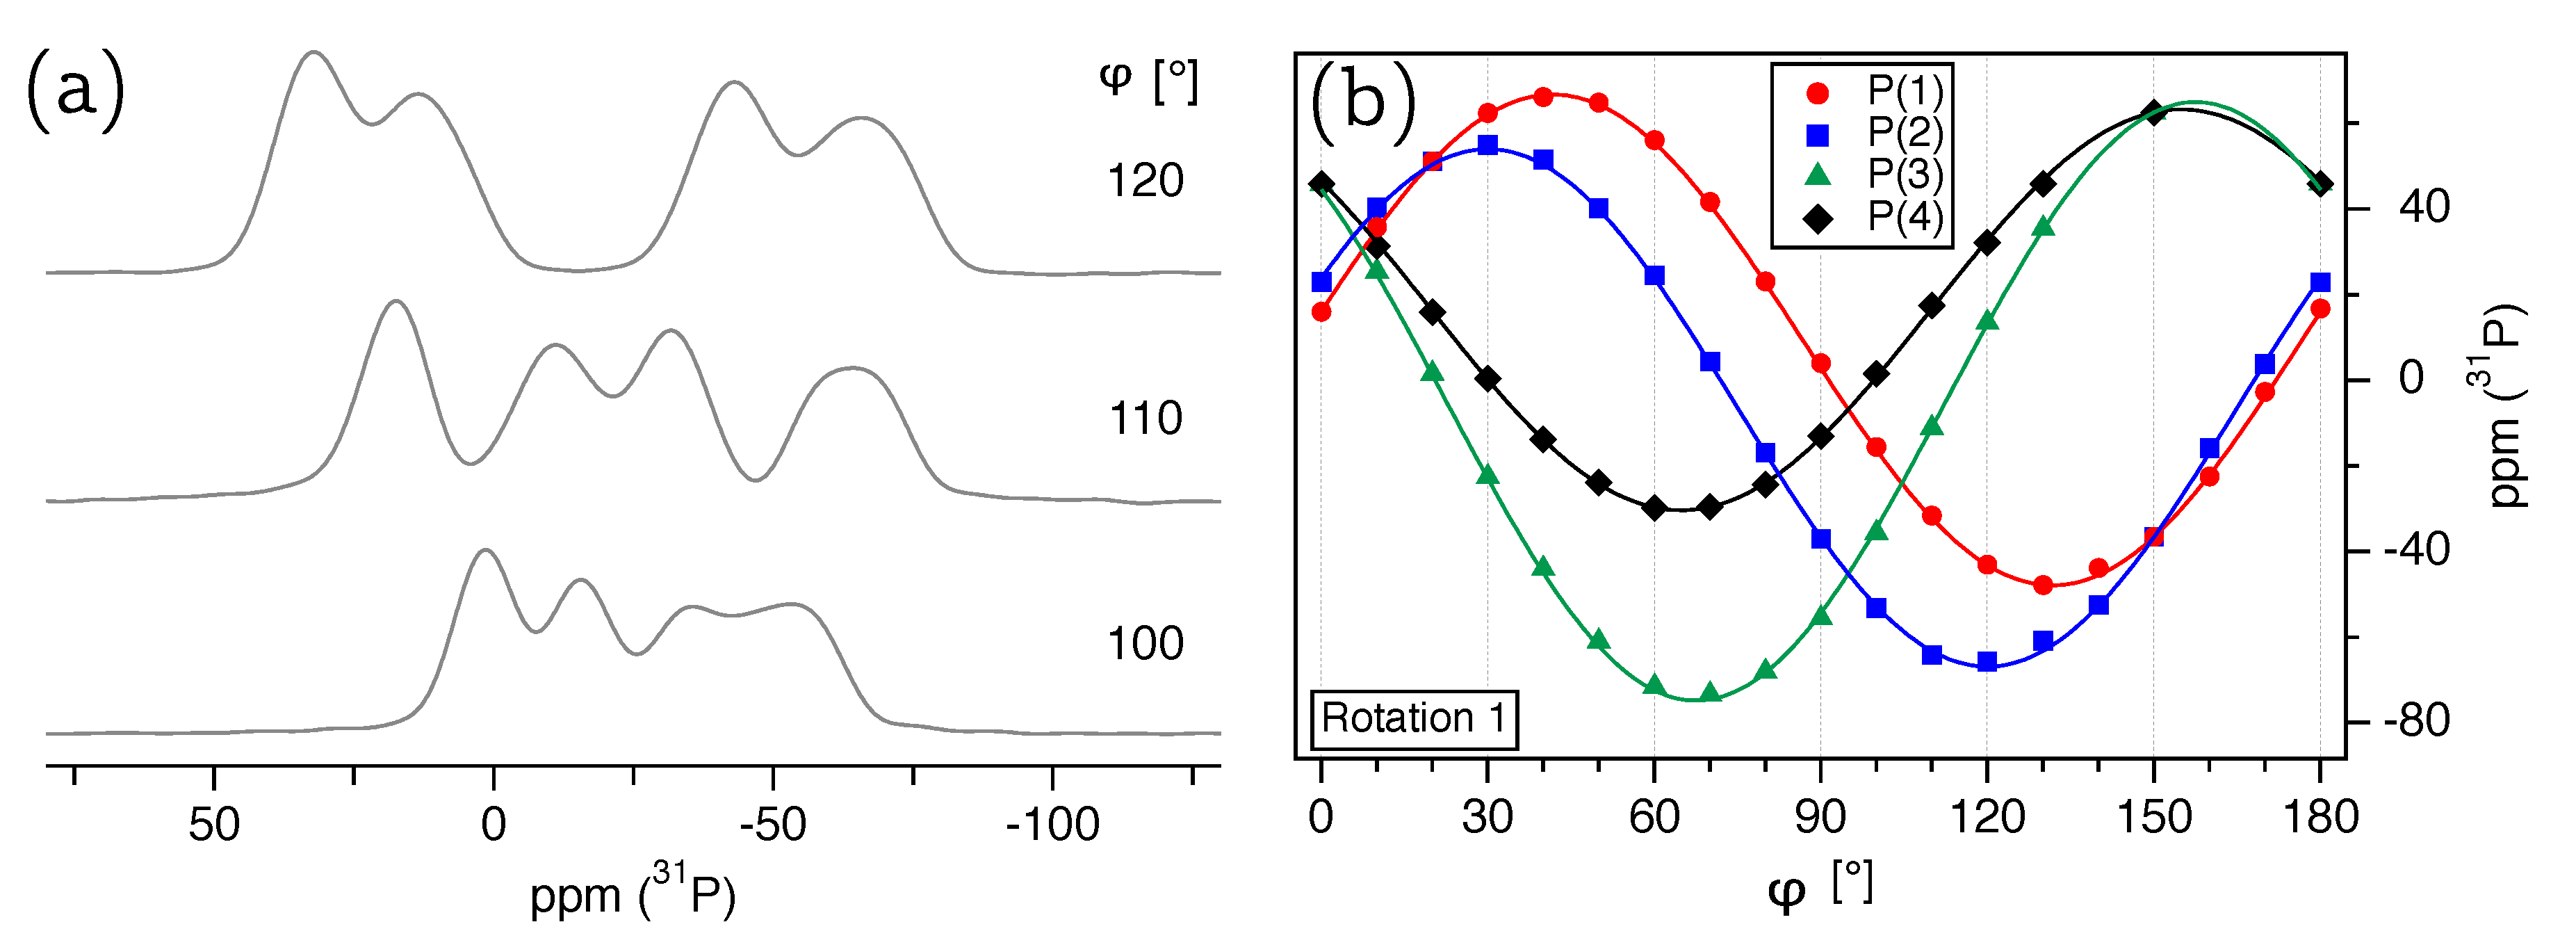
P-NMR spectra of the LDP crystal were recorded in steps of 10°, some of which are shown in Figure 2a. Plotting the resonance position for each phosphorus atom over a 180° interval, as depicted in Figure 2b, results in a so-called ‘rotation pattern’. The contribution of each magnetically inequivalent 31 P(n) atom, with n = 1 4 , in these rotation pattern follows the type of harmonic function shown in Equation (4), which is defined by the three factors A n , B n , and C n . These factors are linear combinations of the CS tensor components and depend on the relative orientation of b 0 to the C R Y frame. The step-wise movement of b 0 by angle φ in the orthorhombic crystal frame may be written as:
b 0 ( φ ) = v sin ( φ φ Δ ) + u cos ( φ φ Δ )
Here, u and v are auxiliary unit vectors in the plane perpendicular to the (initially unknown) rotation axis g = ( sin θ g cos ϕ g , sin θ g sin ϕ g , cos θ g ) . To unequivocally set u , v , and the offset angle φ Δ , a reference vector perpendicular to v is needed. For our data, we chose the crystallographic c axis as a reference vector, with the calculation details shown in reference [11]. For one physical rotation axis g , the four harmonics in the 31 P rotation pattern are linked by one constraint to one another [12]. Hence, 4 × 3 3 = 9 linear independent parameters may be extracted from fitting the data of one rotation pattern. The chemical shift tensor we want to obtain possesses six independent components according to Equation (3). Adding the two angles θ g and ϕ g defining the orientation of the rotation axis in the C R Y frame, and the offset angle φ Δ , a total of nine fit parameters need to be extracted from the NMR data. Thus, in principle, one rotation pattern (such as the one shown in Figure 2b) encapsulates sufficient information to determine the 31 P CS tensor in LDP, together with the orientation of the rotation axis and the offset angle.
However, as may be seen in the single-crystal spectra depicted in Figure 2a, their resolution is comparatively poor. All resonance lines are extremely broad, with a full width at half-maximum f w h m 20 ppm 4 kHz, leading to extensive overlap in many spectra. We attribute this line broadening to the strong homo- and heteronuclear dipolar interactions between phosphorus and lithium atoms in the structure. For NH 4 H 2 PO 4 , a 31 P– 31 P dipolar coupling constant of 270 Hz was shown to lead to an observed maximum line broadening in the 31 P single-crystal spectra of f w h m 1.6 kHz [13]. The dipolar coupling constants in LDP, calculated from the atomic distances, are 200 Hz (average of the four closest 31 P), and 630 Hz (average of the four closest 7 Li), which means that the ratio of the largest coupling constants and the f w h m ’s in NH 4 H 2 PO 4 and LiH 2 PO 4 are very similar. Thus, with high certainty, dipolar broadening can be identified as the only factor for the observed line broadening. While additional broadening mechanisms such as orientational disorder or lattice defects cannot be ruled out completely, their extent must be small, in accordance with the findings of a neutron diffraction study [6].
The variation of the 31 P chemical shift in LDP we are attempting to extract from resonance lines with f w h m 20 ppm is of the order of 140 ppm. Consequently, precise localization of the four resonance positions in each spectrum of the rotation pattern is challenging and error-prone. To increase the accuracy for the determined tensors (especially of the quadrupole coupling tensor of 7 Li, as will be discussed below), we acquired three full rotation patterns over three non-orthogonal (and non-parallel) rotation axes g 1 (Figure 2b), g 2 (Figure 3a), and g 3 (Figure 3b). The three rotation patterns were then subjected to a multi-parameter fit according to Equation (4), with the motion of the field vector b 0 ( φ ) described by Equation (5), and the chemical shift tensors given in Equation (3). To enhance the accuracy of the determined crystal orientation (expressed by the rotation axis orientation and offset angle) for each rotation pattern, we simultaneously fitted the quadrupole coupling tensor of 7 Li according to Equation (10) and detailed in Section 2.2, as the orientation of the LDP single crystal for the measurements of both nuclides is identical. The fit converged on a global solution with the following rotation axes and 31 P chemical shift tensor components (the error values reflect the fit residuals):
g 1 : θ g = ( 17.1 ± 0.4 ) ° ϕ g = ( 53.9 ± 0.9 ) ° φ Δ = ( 60.0 ± 0.9 ) ° g 2 : θ g = ( 30.0 ± 0.4 ) ° ϕ g = ( 31.2 ± 0.5 ) ° φ Δ = ( 28.9 ± 0.5 ) ° g 3 : θ g = ( 158.8 ± 0.4 ) ° ϕ g = ( 105.7 ± 0.8 ) ° φ Δ = ( 114.9 ± 0.8 ) ° P = ( 34.5 ± 0.3 ) ppm R = ( 52.1 ± 0.3 ) ppm S = ( 8.3 ± 0.4 ) ppm T = ( 27.3 ± 0.3 ) ppm U = ( 41.0 ± 0.6 ) ppm V = ( 5.0 ± 1.9 ) ppm
Transformation of the CS tensor from the C R Y frame to the P A S frame changes δ to diagonal form, with the eigenvalues δ 11 , δ 22 , and δ 33 placed on the main diagonal. The weighted trace of δ determines the isotropic chemical shift δ i s o = 1 / 3 ( δ 11 + δ 22 + δ 33 ) , with the asymmetry parameter of the CS tensor defined by η C S = ( δ 22 δ 11 ) / Δ δ . Here, we generally order the tensor components according to the convention | δ 33 δ i s o | | δ 11 δ i s o | | δ 22 δ i s o | , and make use of the reduced anisotropy Δ δ = δ 33 δ i s o [14]. The eigenvalues and eigenvectors of the 31 P CS tensor for LDP are listed in Table 1 (left). The CS tensor is clearly biaxial, with the asymmetry parameter η C S = 0.67 reflecting the low site symmetry of Wyckoff site 4 a [
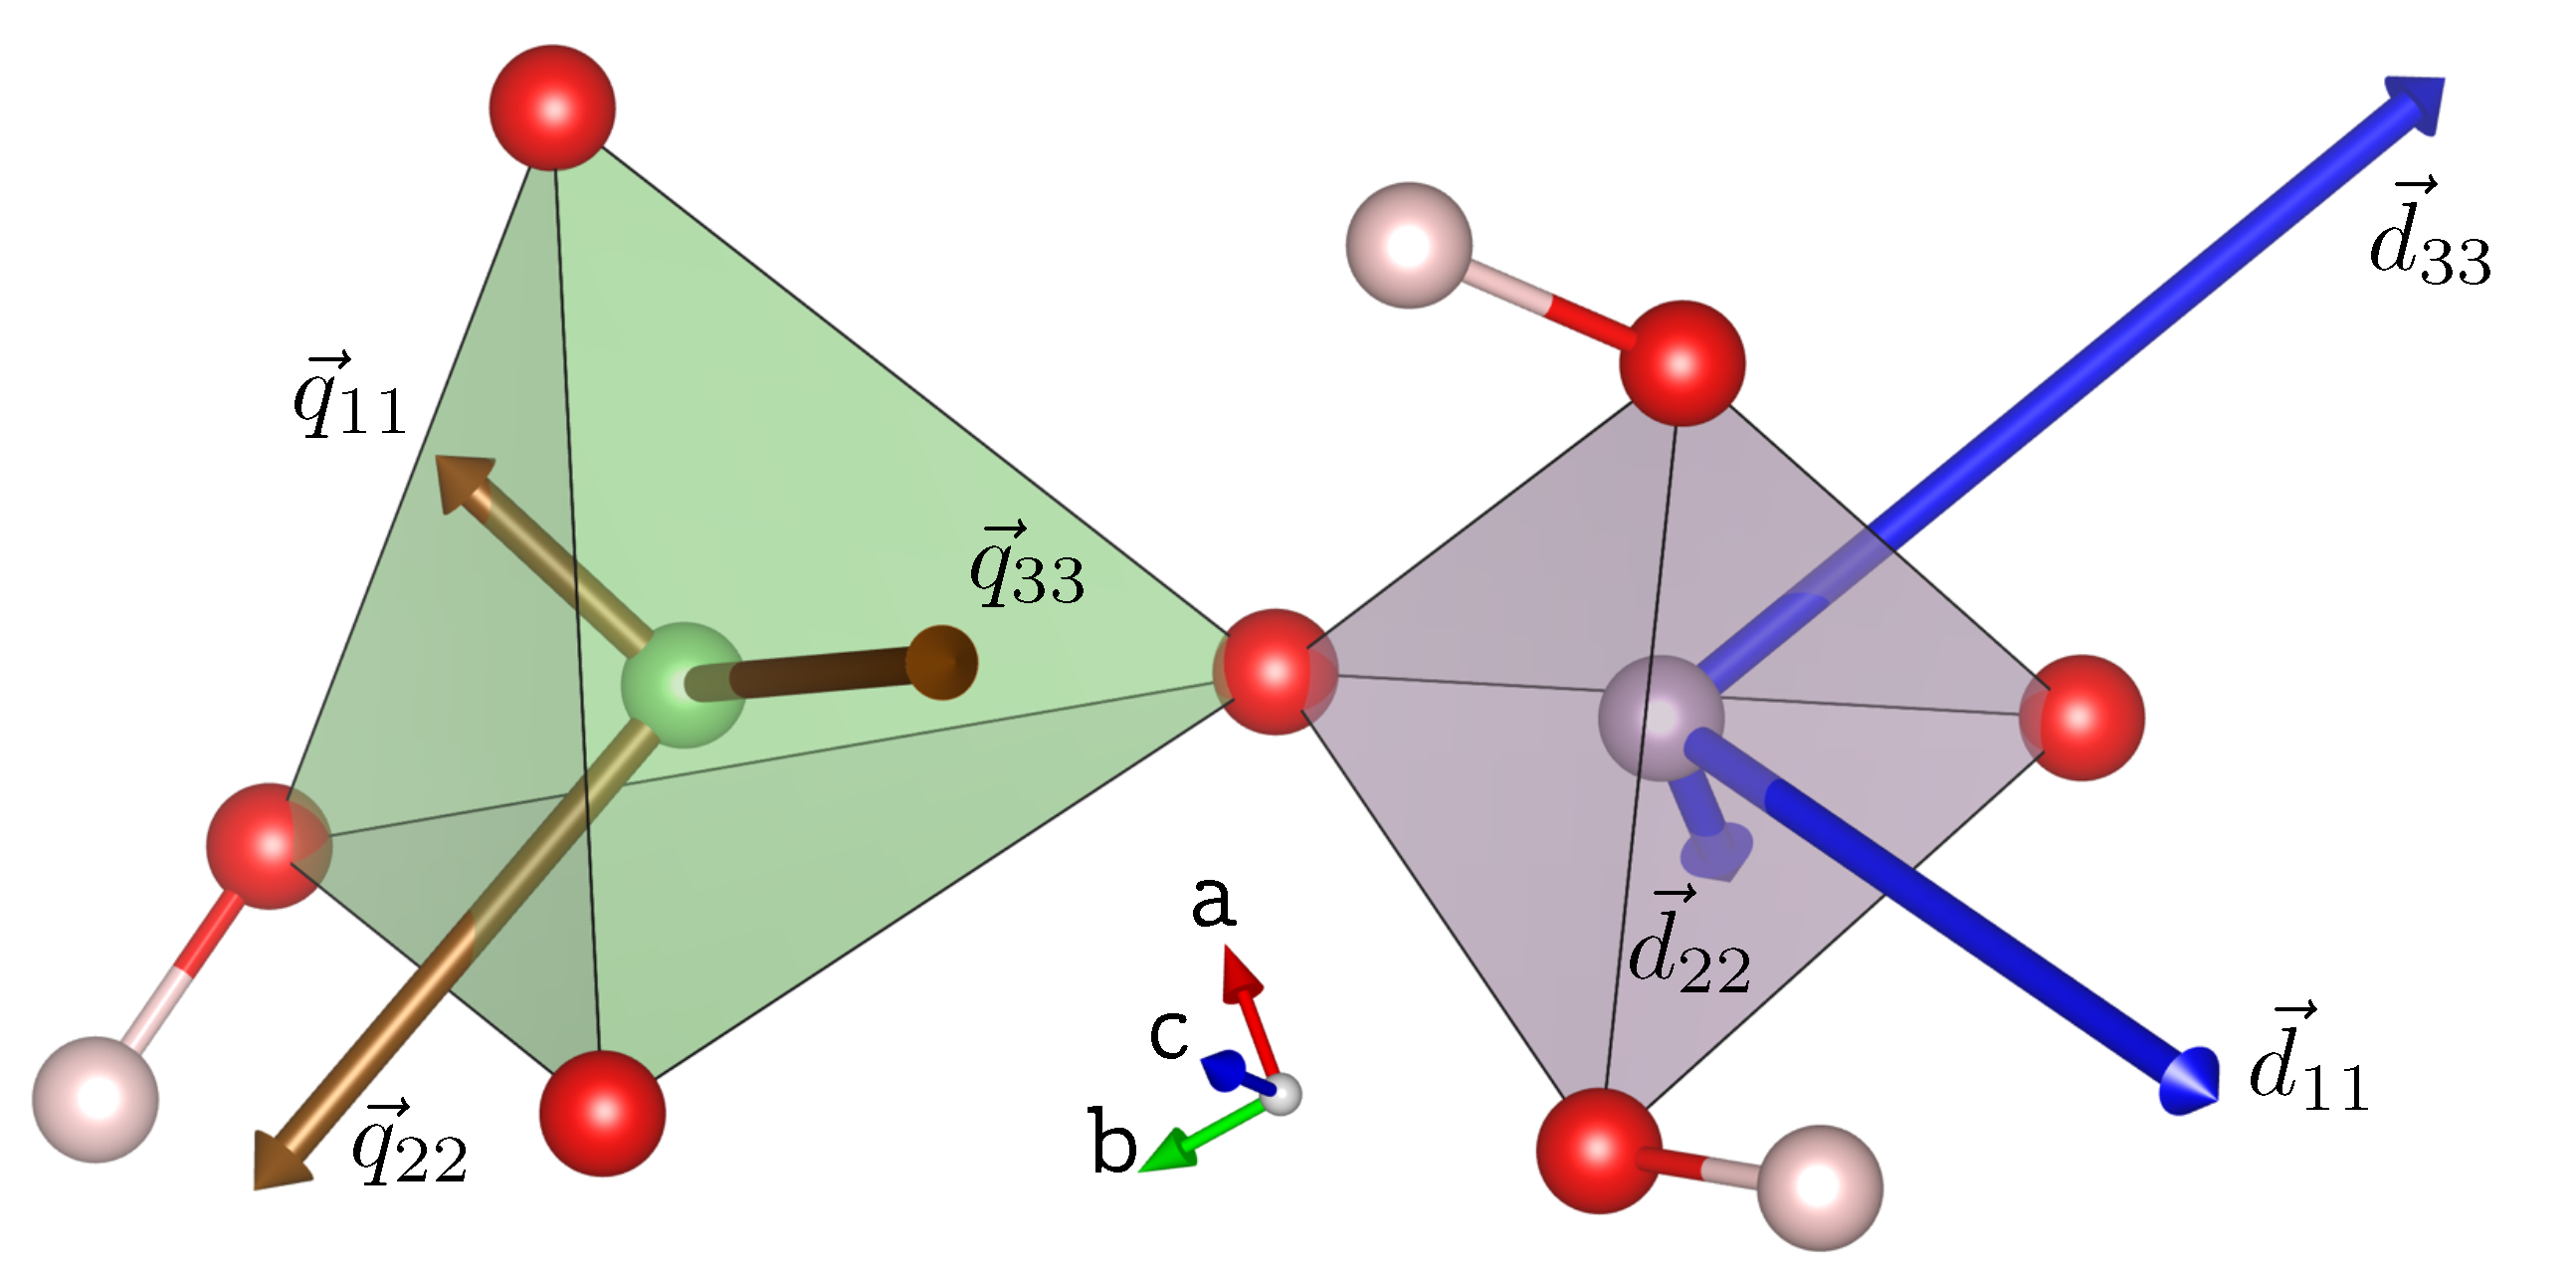
7]. The orientation of the CS tensor eigenvectors in the orthorhombic unit cell of LDP for P(1), scaled according to the associated eigenvalues, are depicted in Figure 7. The eigenvector orientations are free to orient according to the electronic environment generated predominantly by the surrounding oxygen atoms.
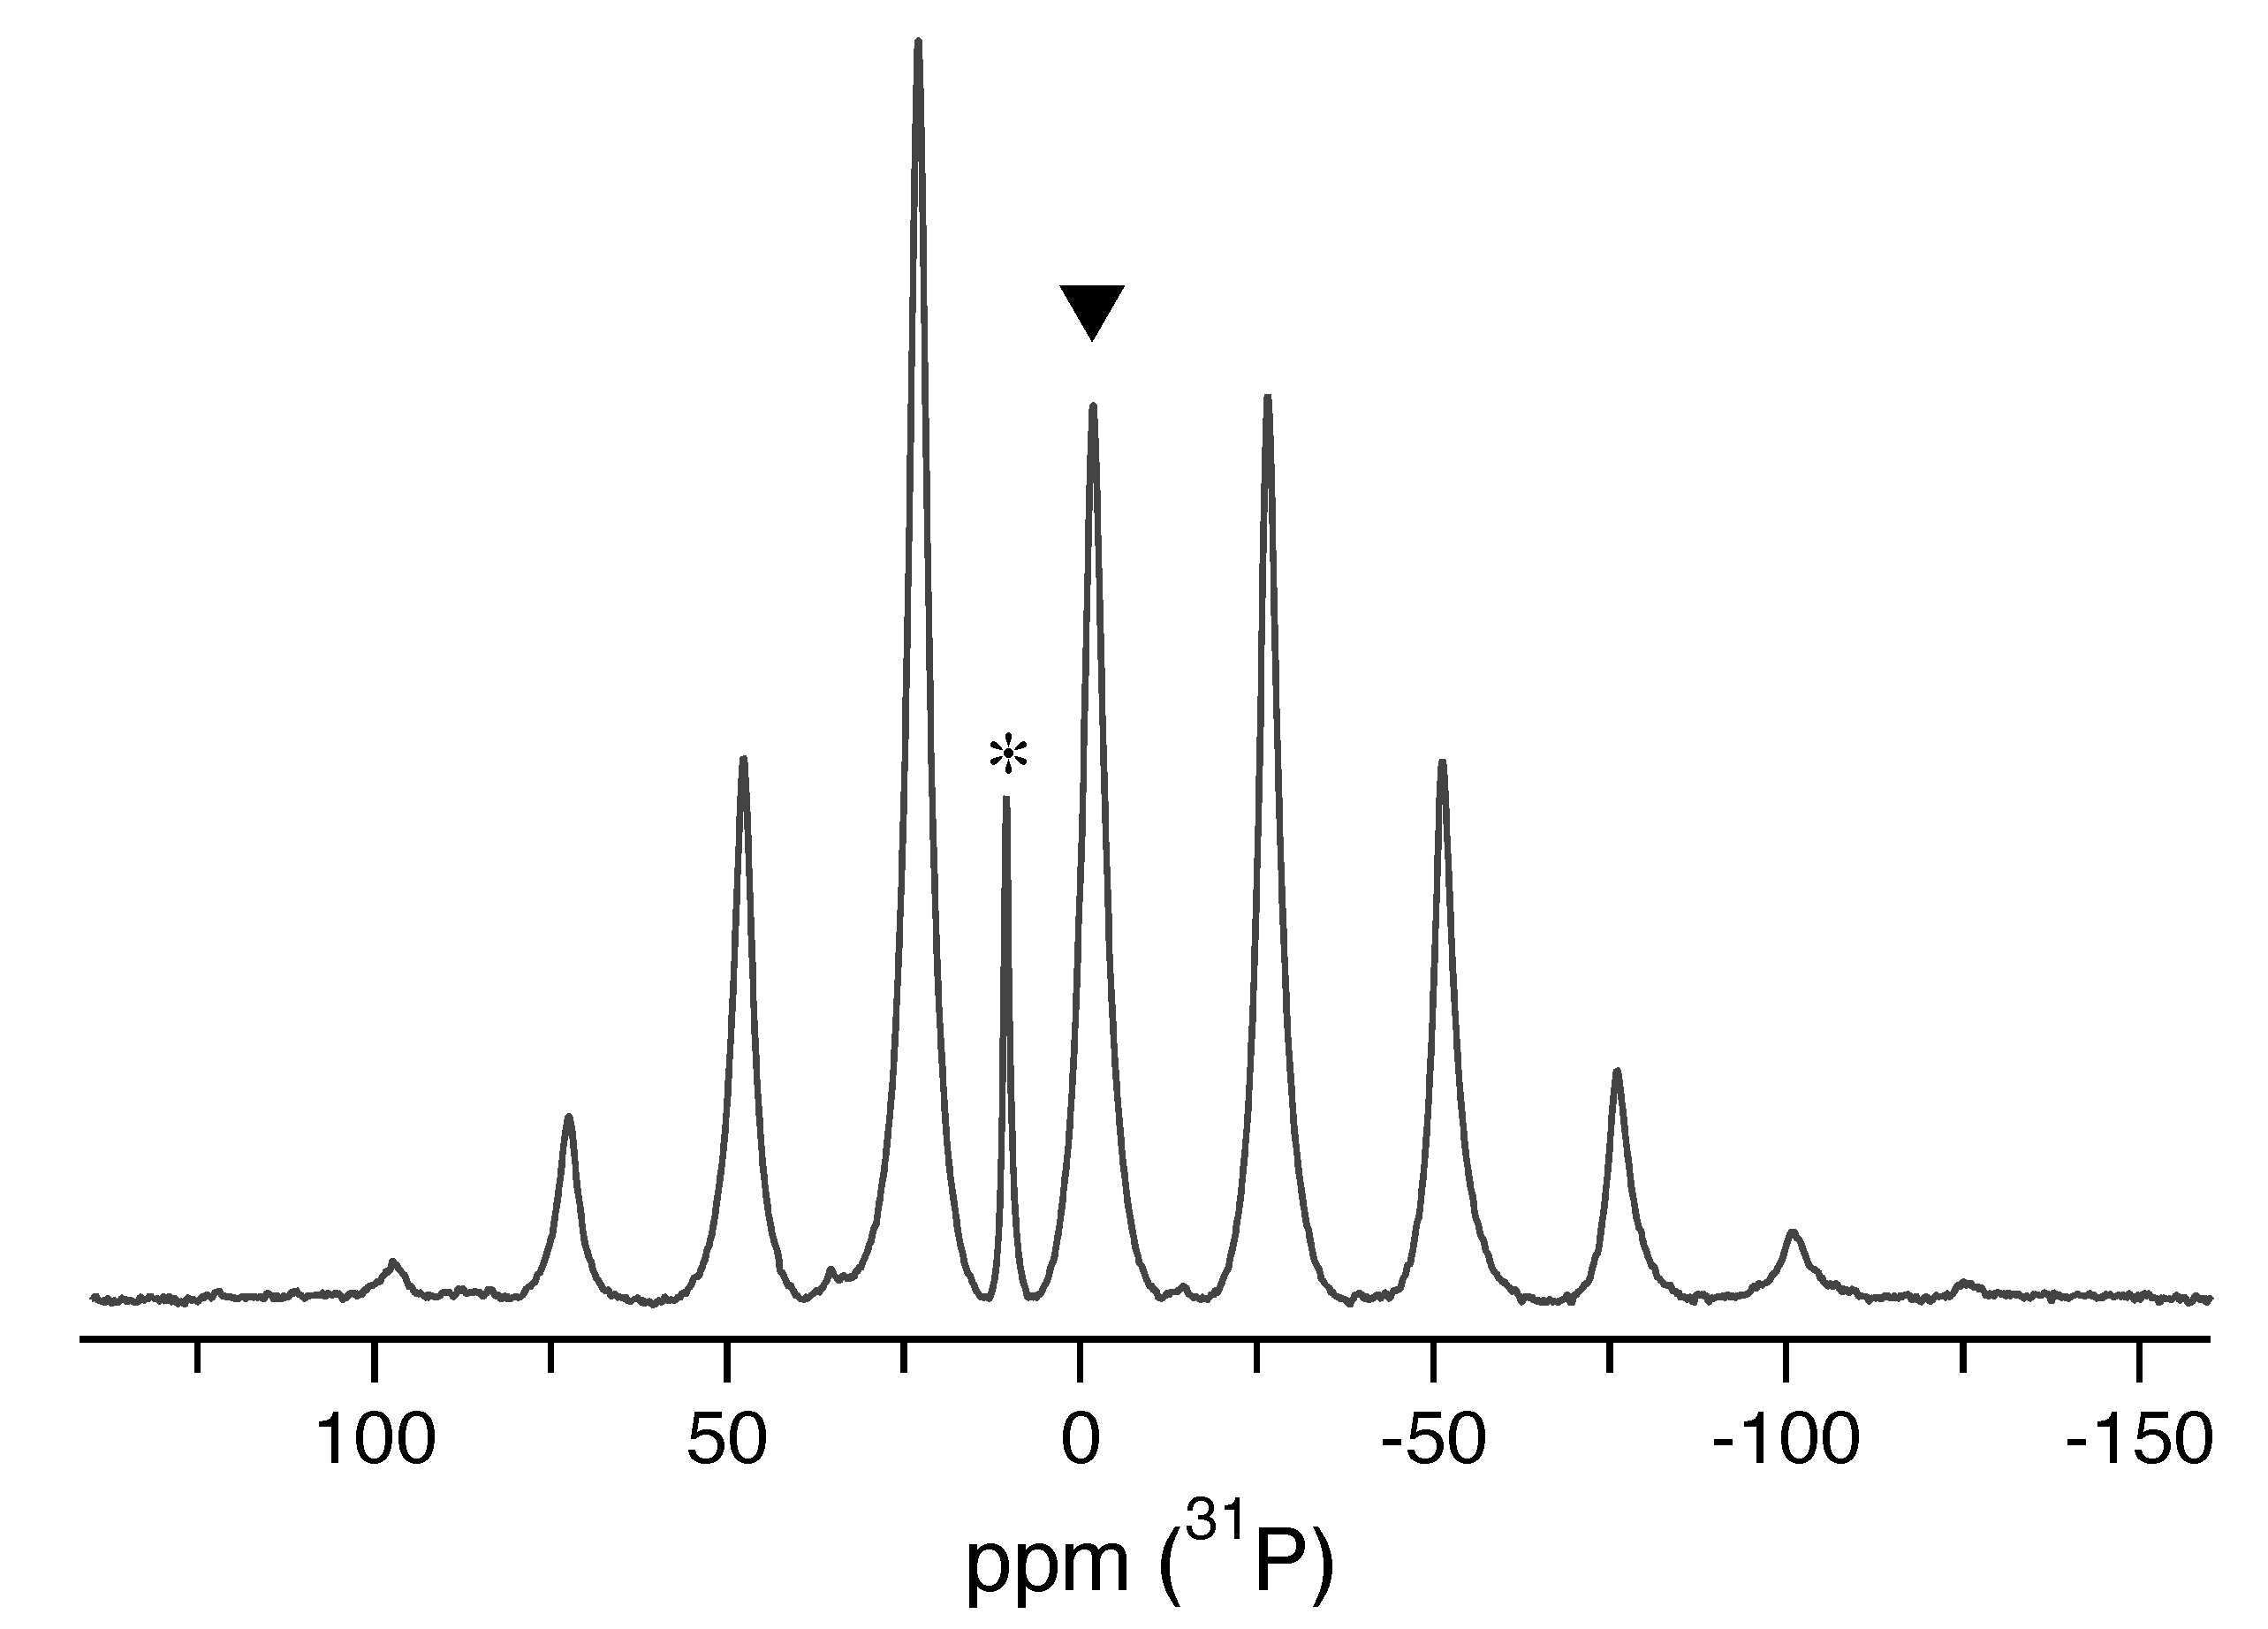
As a useful comparison to our single-crystal data, a 31 P-NMR spectrum of a sample of LDP crushed into a powder was acquired at 5 kHz MAS spinning speed, shown in Figure 4. The isotropic chemical shift δ i s o M A S = 1.7 ppm extracted from this spectrum is in reasonable agreement with the value δ i s o = ( 0.7 ± 1 ) ppm derived from single-crystal NMR and identical with the previously reported value from a powder sample under MAS [5]. To also extract the three eigenvalues of the CS tensor, a Herzfeld–Berger analysis [15] of the MAS spectrum was performed using the hba 1.7.5 program [16]. The results are given in Table 1 (right), showing that the magnitude of the MAS-derived eigenvalues are in good agreement with the single-crystal values. The error values of the Herzfeld–Berger quantities ρ , and μ are estimated from the contour plots generated by the hba 1.7.5 program. Due to the steep slope of the contour lines in this plot, the error values of ρ = 0.15 12 + 15 are estimated to be larger than those of μ = 6.2 ± 0 . 5 and are unsymmetric, resulting in different upper and lower error margins for the CS eigenvalues. The narrow signal at 10.5 ppm in Figure 4 is attributed to the 31 P chemical shift in aqueous LiH 2 PO 4 solution, which is formed over time by the hygroscopic LDP powder with residual moisture in the MAS rotor.
In order to extend the potential of NMR spectroscopy as an analytical tool for inorganic solids, constant efforts are being made trying to relate NMR parameters to structural features of the studied compounds. One example is the correlation of the isotropic chemical shift of 207 Pb in lead-bearing minerals to the distance of oxygen atoms in the lead coordination sphere [11]. However, for 31 P in phosphates, where the first coordination sphere is always formed by covalently bound oxygen atoms, it is notoriously difficult to establish such relations [17]. One structural parameter that is promising in this context is the dimensionless distortion index ( D D I ) of the O–P–O bond angles in the PO 4 tetrahedra, i.e., their deviation from the ideal tetrahedral angle, 109.47°. According to Baur [18], the D D I is defined by:
D D I = n = 1 6 | OPO 109.47 ° | 6 · 109.47 °
A distortion of PO 4 tetrahedra leads to a non-zero value of the D D I , and is expected to have an effect on the anisotropy of the chemical shift, which in the convention used here [14], is quantified by the parameter Δ δ = δ 33 δ i s o . For LDP, we find D D I = 0.0323 from the X-ray structure [6], showing a comparatively strong distortion [18]. The 31 P CS anisotropy of Δ δ = 79.4 ppm (see Table 1) is also large, which conforms to expectation. For comparison, the phosphate groups in the mineral pyromorphite, Pb 5 (PO 4 ) 3 Cl, exhibit a smaller distortion with D D I = 0.0146 , and accordingly also a smaller CS anisotropy of Δ δ = 20.2 ppm [19]. However, this apparent correlation between the distortion of the tetrahedral geometry and the anisotropy of the 31 P chemical tensor has only limited validity [17].

2.2. 7Li NMR of LDP

For 7 Li with spin I = 3 / 2 , the quadrupolar coupling between the non-symmetric charge distribution of the nucleus and its electronic surroundings also needs to be considered [20]. The number of energy levels for a spin I in an external magnetic field is 2 I + 1 , resulting in 2 I NMR transitions, which are classified according to their magnetic quantum number m. With a particular transition | m | m + 1 designated by the parameter k = m + 1 2 [21,22], the resonance frequency ν m , m + 1 of this transition may then be described by adding the contribution of the quadrupolar interaction to Equation (1):
ν m , m + 1 ( k ) = ν 0 + ν C S + ν m , m + 1 ( 1 ) ( k ) + ν m , m + 1 ( 2 ) ( k 2 )
Here, ν m , m + 1 ( 1 ) ( k ) and ν m , m + 1 ( 2 ) ( k ) are the effects of the quadrupolar interaction described by perturbation theory to first and second order, respectively. For the three transitions of 7 Li with I = 3 / 2 , the values for k are k = 0 for the central transition, and k = ± 1 
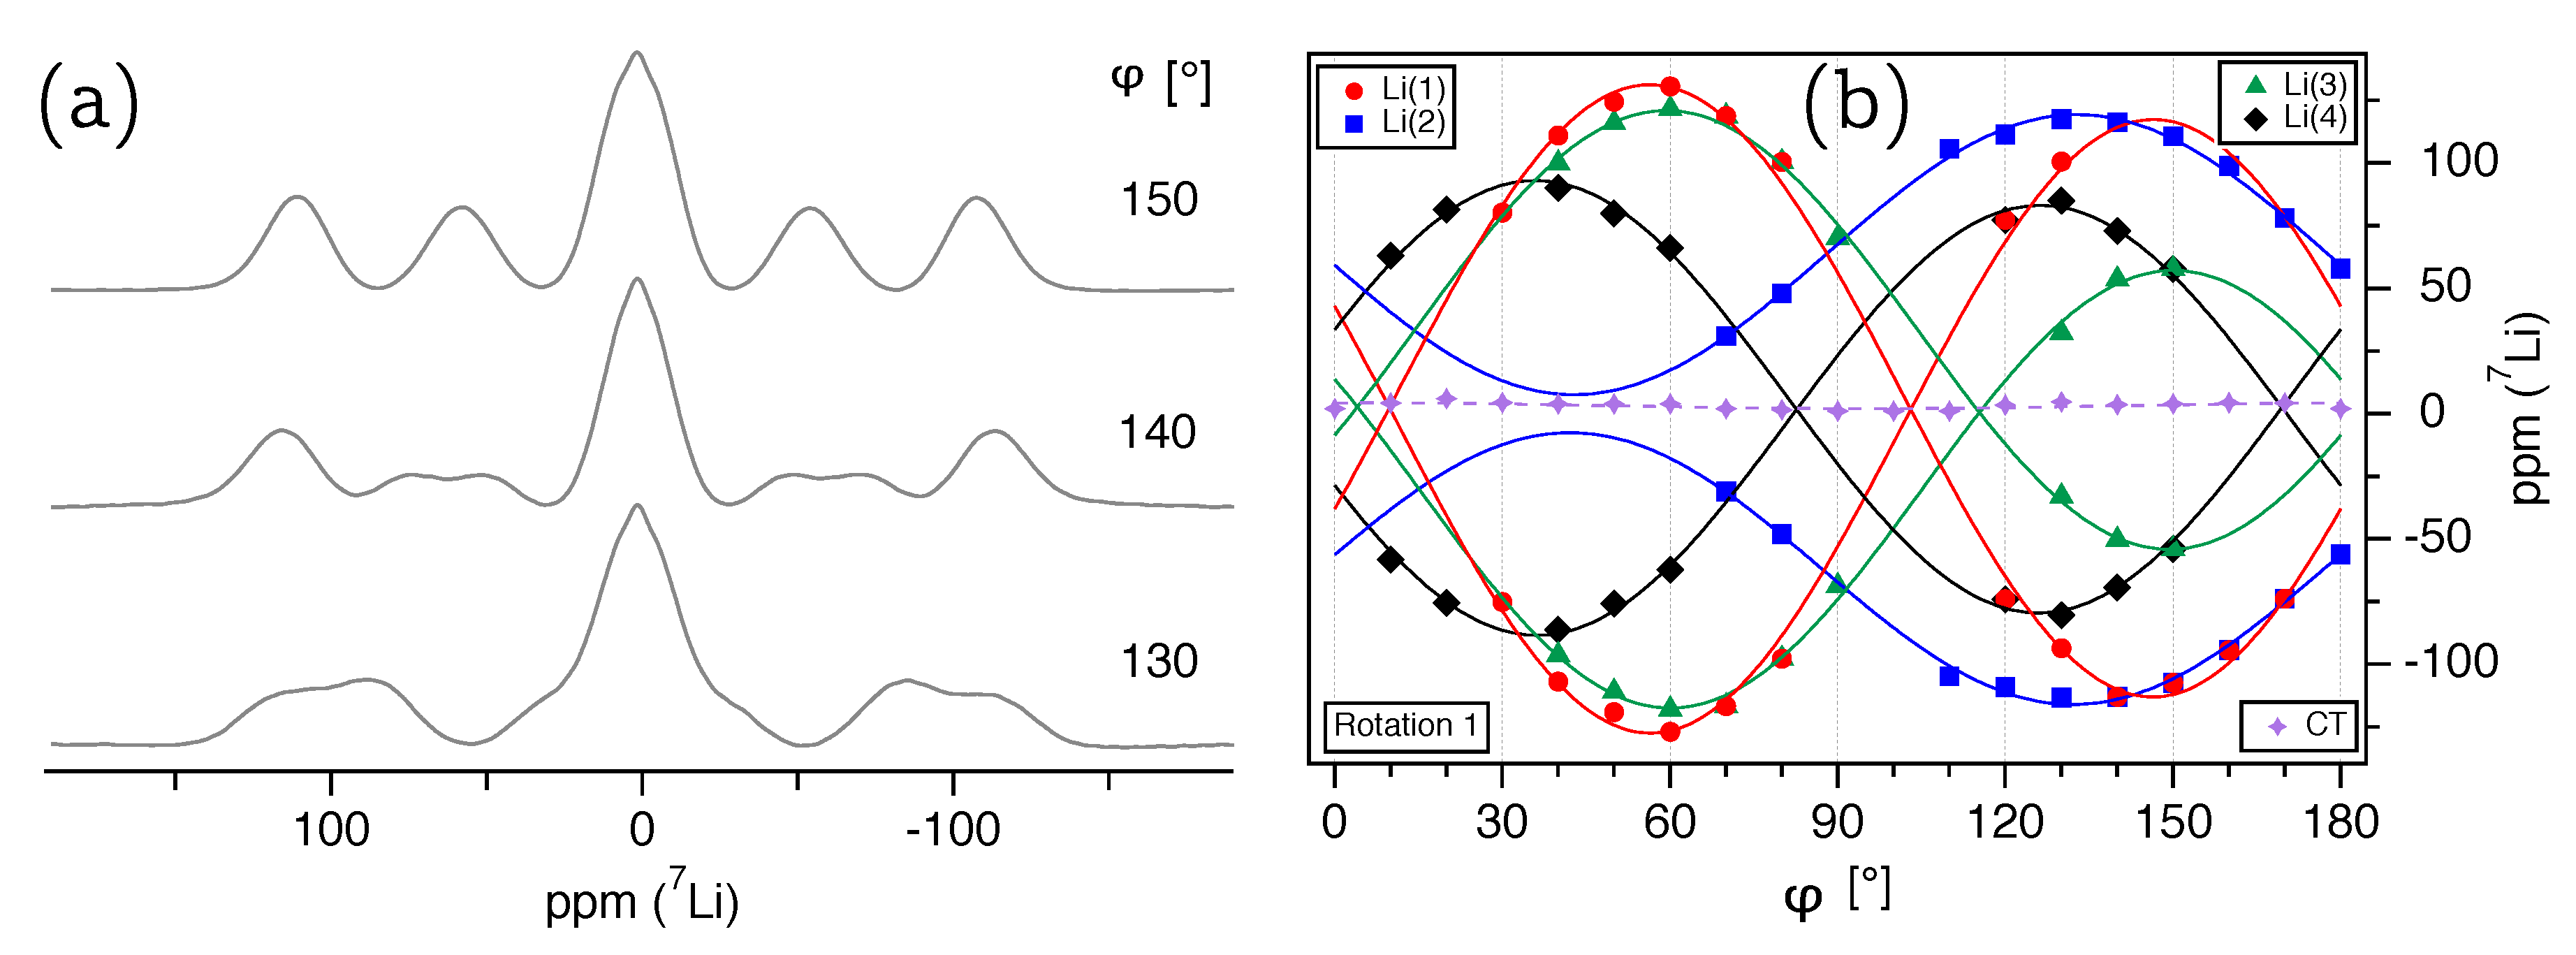
for the two satellite transitions (ST’s). Representative 7 Li single-crystal NMR spectra of LDP are shown in Figure 5a, with the satellite pairs for k = ± 1 symmetrically positioned around the non-resolved central transitions of the four independent lithium atoms in the crystal structure. All 7 Li resonance lines are fairly broad with f w h m 5.5 kHz, and hence overlap in almost every spectrum. As discussed in detail above for 31 P, strong homo- and heteronuclear dipolar coupling is assumed to be the dominating effect of line broadening. With similar 7 Li line widths encountered in other inorganic compounds [23], no additional broadening mechanism needs to be invoked. The magnitude and orientation dependency of the quadrupolar interaction may be expressed using a quadrupole coupling tensor Q . Similar to the electrical field gradient (EFG) tensor V , to which it is related by Q = ( e Q / ) V , this second-rank tensor is symmetric and traceless, i.e., Q i j = Q j i and Q 11 + Q 22 + Q 33 = 0 . The quadrupolar coupling constant χ is equal to the largest Q tensor eigenvalue, i.e., Q 33 = χ , and the asymmetry is defined as η Q = ( Q 11 Q 22 ) / Q 33 , with | Q 33 | | Q 22 | | Q 11 | . Taking into account the same symmetry arguments as for the CS tensor δ of 31 P at Wyckoff position 4 a given in Equations (2) and (3), the Q C R Y tensors for 7 Li in the orthorhombic crystal frame of LDP are given by:
Q L i ( 1 ) C R Y = E F G F H I G I E H Q L i ( 2 ) C R Y = E F G F H I G I E H Q L i ( 2 ) C R Y = E F G F H I G I E H Q L i ( 2 ) C R Y = E F G F H I G I E H
These tensors are conveniently determined from the separations (‘splittings’) of the satellite transitions (ST’s) with k = ± 1 for 7 Li, since these are not affected by either the second-order quadrupolar interaction or the chemical shift. Thus, the difference Δ ν ( k ) of the resonance frequencies depends on the relative orientation of the Q C R Y tensor to the external magnetic field vector b 0 ( φ ) :
Δ ν m , m + 1 ( Δ k ) = ν m , m + 1 ( + k ) ν m , m + 1 ( k ) = b 0 T ( φ ) · Q C R Y · b 0 ( φ )
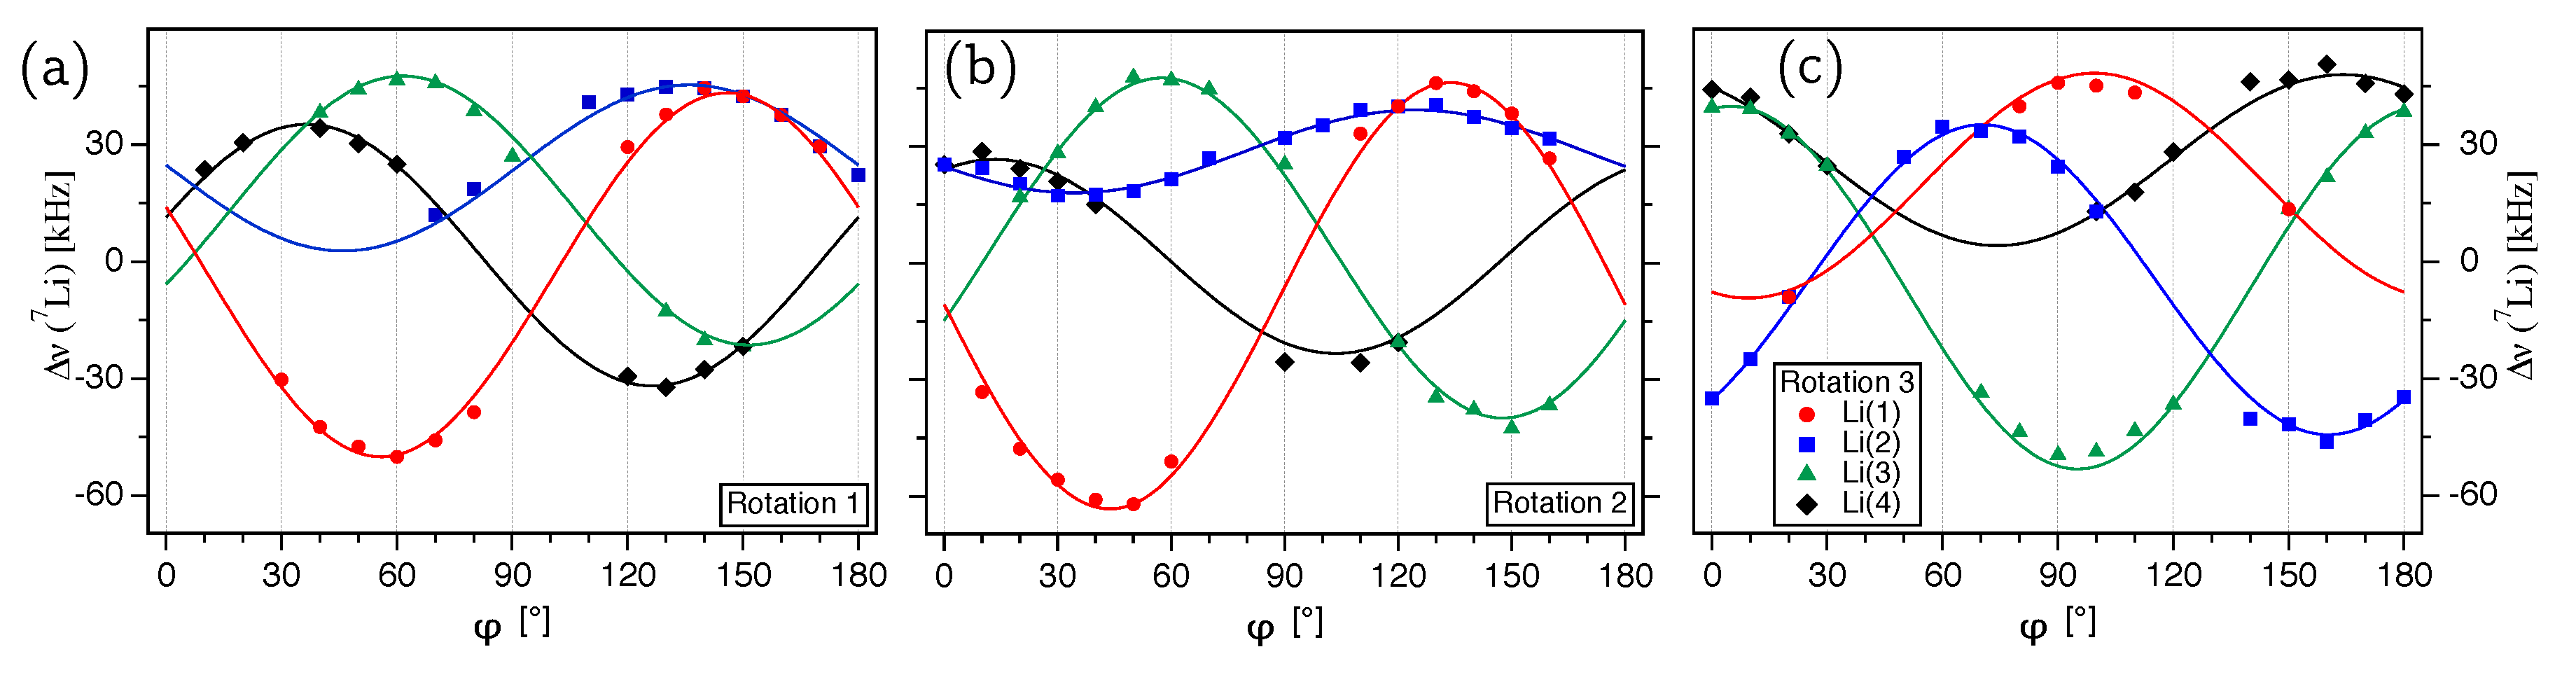
The experimentally determined satellite splittings for Δ k = 2 are plotted over the rotation angle φ for the three rotation axes g 1 (Figure 6a), g 2 (Figure 6b), and g 3 (Figure 6c) and show a number of comparatively ill-defined data points. However, it has to be kept in mind that for determining the 7 Li ST splittings in LDP, we need to trace the eight satellite resonances with a f w h m 5.5 kHz in a limited spectral range of maximum 61 kHz. Here, the spectral range is defined as the difference between the position of the two outermost satellite transitions. In fact, the average spectral range (calculated over 49 7 Li spectra and three rotation patterns) is only 41 kHz and the always overlapping central transitions reduce the localizable range for the ST’s further by their f w h m 7 kHz.
The quadrupole coupling tensors in Equation (9) were determined by a multi-parameter fit of the experimental splittings according to Equation (10) with the motion of the field vector b 0 ( φ ) described by Equation (5), with the fit being coupled to the CS tensor fit of 31 P to improve accuracy. The rotation axes extracted thereby are given in Equation (6) and the components of the quadrupole coupling tensor for 7 Li are (the error values reflect the fit residuals): E = ( 12.3 ± 0.4 ) kHz, F = ( 33.2 ± 0.3 ) kHz, G = ( 23.6 ± 0.5 ) kHz, H = ( 8.8 ± 0.4 ) kHz, and I = ( 43.8 ± 0.7 ) kHz. The eigenvalues and the corresponding eigenvectors in the P A S frame of the 7 Li Q tensor are listed in Table 2. The quadrupolar coupling constant derived is χ = 71 kHz and the asymmetry parameter η = 0.37 confirms a biaxial symmetric tensor, as might be expected for Wyckoff position 4 a with the low site symmetry, 1 C 1 . The orientation of the eigenvectors, scaled according to the length of the associated eigenvalue are depicted in Figure 7.
Having determined the size of the quadrupolar coupling, we can now estimate the extent to which the resonance frequency given in Equation (8) is affected by the second-order quadrupolar interaction, i.e., the relative magnitude of ν m , m + 1 ( 2 ) . The angle-independent part of the second-order quadrupolar induced shift ν a i ( 2 ) provides a quantitative measure for the second-order effect. For the CT ( k = 0 ) of a spin I = 3 / 2 nuclide at a Larmor frequency of ν 0 ( 7 Li ) = 194.416 MHz, this calculates to [24]:
ν a i ( 2 ) = 1 40 χ 2 ν 0 1 + η 2 3 = 0.7 Hz 4 × 10 3 ppm
Obviously, the effects of the quadrupolar interaction to second order for 7 Li in LDP are negligibly small, especially taking into account the very broad resonance lines. Accordingly, it should now be possible to determine its chemical shift tensor by tracing the variation of the center of the satellite transitions without correcting for second order effects [21]. However, the chemical shift anisotropy of lithium atoms is generally very small (in the range of 5 ppm [2]), making detection of anisotropic effects from resonance lines with a f w h m 28 ppm practically impossible. The isotropic chemical shift was, nevertheless, determined from a sample of LDP crushed into a powder and measured at 10 kHz MAS spinning speed. The isotropic shift δ i s o = 0.2 ppm extracted thereby is in good agreement with the previously reported value δ i s o 0 ppm derived from a polycrystalline powder sample under MAS [5].

3. Conclusions

We have determined the full 31 P chemical shift tensor and 7 Li quadrupole coupling tensor of the ionic conductor lithium dihydrogen phosphate (LDP), LiH 2 PO 4 , at room temperature by single-crystal NMR spectroscopy. To this end, a single crystal of LDP was grown from an aqueous solution and orientation-dependent NMR spectra were acquired about three different and initially unknown rotation axes. This allowed tensor determination to good precision, despite the broad resonance lines of the 31 P and 7 Li spectra caused by strong homo- and heteronuclear dipolar couplings. The overdetermination of the equation system, caused by the symmetry relation between the four crystallographic equivalent but magnetically inequivalent phosphorus and lithium atoms in the unit cell, made it possible to make the orientation of all three crystal rotation axes free parameters of the data fit. A simultaneous fit for the ST(3/2) splittings of 7 Li and the rotation pattern of 31 P gave the quadrupolar coupling constant χ ( 7 Li ) = ( 71 ± 1 ) kHz with an asymmetry η Q = 0.37 ± 0.02 . The 31 P CS tensor determined thereby is characterized by its three eigenvalues: δ 11 P A S = ( 67.0 ± 0.6 ) ppm, δ 22 P A S = ( 13.9 ± 1.5 ) ppm, and δ 33 P A S = ( 78.7 ± 0.9 ) ppm. To complement the single-crystal NMR results, magic-angle spinning spectra were acquired of both 31 P, and 7 Li, and the eigenvalues of the 31 P CS tensor were corroborated by a Herzfeld–Berger analysis [15] of the rotational side band pattern at 5 kHz spinning speed. The eigenvectors of the 7 Li Q tensor and 31 P CS tensor in the orthorhombic crystal structure of LDP were determined at room temperature and are depicted in Figure 7.
The present work again evidences the usefulness of NMR spectroscopy as a complementary analytical tool for investigation of solid electrolytes, another example being recent NMR studies on fluorooxoborates [25,26,27]. The 7 Li and 31 P NMR interaction tensors determined in the current study provide a good starting point for temperature dependent single-crystal NMR of LDP, which possibly could reveal new insights about the diffusion mechanism of the lithium atoms in the crystal structure.

4. Materials and Methods

4.1. LiH2PO4 (LDP)

The single crystal of LiH 2 PO 4 shown in Figure 1a was grown according to literature [7] by slow evaporation technique at 38 °C from a saturated aqueous solution of LDP powder (Sigma Aldrich, St. Louis, MO, USA, 99%). Since LDP is extremely hygroscopic (having a solubility in liquid water of 160 g/100 g H 2 O at 0 °C [28]), the single crystals had to be rinsed by ethanol (C 2 H 5 OH) upon recovering from the saturated solution. The resulting large single crystals are practically unaffected by ambient humidity, because of the much smaller surface-to-volume ratio compared to polycrystalline samples.

4.2. Solid-State NMR Spectroscopy

NMR spectra were acquired on a Bruker Avance-III 500 spectrometer at LMU Munich, at a Larmor frequency of ν 0 ( 31 P ) = 202.505 MHz, and ν 0 ( 7 Li ) = 194.416 MHz. The angular dependent single-crystal spectra were acquired at room temperature with a 6 mm solenoid coil and a clip-on goniometer build by NMR Service GmbH (Erfurt, Germany) using one scan and a recycle delay of 3200 s. For the magic-angle spinning (MAS) spectra, a polycrystalline sample was prepared by crushing single crystals of LDP in an argon-filled glovebox (Unilab, MBraun, Garching, Germany, H 2 O < 1 ppm) with an agate mortar, and measured using a 4 mm rotor by accumulating eight scans with a recycle delay of 9000 s. The 31 P spectra were recorded under 1 H decoupling using sweep-frequency two-pulse phase modulation (SW f -TPPM) [29] with a linear sweep profile [30]. Since the 7 Li– 1 H distances in the crystal structure of LDP are significantly longer than the 31 P– 1 H distances, the 7 Li spectra did not improve under 1 H decoupling, and hence were recorded with single-pulse acquisition. All spectra were referenced indirectly to 1 H in 100% TMS at 0.1240 ppm. The simultaneous fit of the 31 P rotation pattern and the 7 Li splittings was performed with the program IGOR PRO 7 from WaveMetrics Inc. (Lake Oswego, OR, USA).

Author Contributions

Conceptualization, O.E.O.Z. and T.B.; methodology, O.E.O.Z. and T.B.; formal analysis, O.E.O.Z. and V.K.; investigation, O.E.O.Z., V.K. and T.B.; resources, T.B.; writing—original draft preparation, O.E.O.Z. and T.B.; writing—review and editing, O.E.O.Z., V.K. and T.B.; visualization, O.E.O.Z. and V.K.; supervision, T.B. All authors have read and agreed to the published version of the manuscript.

Funding

This research received no external funding.

Acknowledgments

The authors wish to express gratitude to Wolfgang Schnick (University of Munich, LMU) for continuing financial support.

Conflicts of Interest

The authors declare no conflict of interest.

References

  1. Šušić, M.V.; Minić, D.M. Electric and electrochemical properties of solid LiH2PO4. Solid State Ionics 1981, 2, 309–314. [Google Scholar] [CrossRef]
  2. MacKenzie, K.J.D.; Smith, M.E. Multinuclear Solid-State NMR of Inorganic Materials. In Pergamon Materials Series; Cahn, R.W., Ed.; Elsevier Science: Oxford, UK, 2002. [Google Scholar]
  3. Laws, D.D.; Bitter, H.-M.L.; Jerschow, A. Solid-State NMR Spectroscopic Methods in Chemistry. Angew. Chem. Int. Ed. 2002, 41, 3096–3129. [Google Scholar] [CrossRef]
  4. Kweon, J.J.; Lee, K.W.; Lee, K.-S.; Lee, C.E. Rotating-frame nuclear magnetic resonance study of the superprotonic conduction in LiH2PO4. Solid State Commun. 2013, 171, 5–7. [Google Scholar] [CrossRef]
  5. Kweon, J.J.; Fu, R.; Steven, E.; Lee, C.E.; Dalal, N.S. High Field MAS NMR and Conductivity Study of the Superionic Conductor LiH2PO4: Critical Role of Physisorbed Water in Its Protonic Conductivity. J. Phys. Chem. C 2014, 118, 13387–13393. [Google Scholar] [CrossRef]
  6. Oh, I.H.; Lee, K.-S.; Meven, M.; Heger, G.; Lee, C.E. Crystal Structure of LiH2PO4 Studied by Single-Crystal Neutron Diffraction. J. Phys. Soc. Jpn. 2010, 79, 074606. [Google Scholar] [CrossRef]
  7. Lee, K.-S.; Oh, I.-H.; Kweon, J.J.; Lee, C.E.; Ahn, S.-H. Crystal growth and morphology of LiH2PO4. Mater. Chem. Phys. 2012, 136, 802–808. [Google Scholar] [CrossRef]
  8. Momma, K.; Izumi, F. VESTA 3 for three-dimensional visualization of crystal, volumetric and morphology data. J. Appl. Cryst. 2011, 44, 1272–1276. [Google Scholar] [CrossRef]
  9. Volkoff, G.M.; Petch, H.E.; Smellie, D.W.L. Nuclear electric quadrupole interactions in single crystals. Can. J. Phys. 1952, 30, 270–289. [Google Scholar] [CrossRef]
  10. Weil, J.A.; Anderson, J.H. Determination of the g Tensor in Paramagnetic Resonance. J. Chem. Phys. 1958, 28, 864–866. [Google Scholar] [CrossRef]
  11. Zeman, O.E.O.; Steinadler, J.; Hochleitner, R.; Bräuniger, T. Determination of the Full 207Pb Chemical Shift Tensor of Anglesite, PbSO4, and Correlation of the Isotropic Shift to Lead-Oxygen Distance in Natural Minerals. Crystals 2019, 9, 43. [Google Scholar] [CrossRef] [Green Version]
  12. Tesche, B.; Zimmermann, H.; Poupko, R.; Haeberlen, U. The single-rotation method of determining quadrupole coupling tensors in monoclinic crystals. Error analysis and application to bullvalene. J. Magn. Reson. A 1993, 104, 68–77. [Google Scholar] [CrossRef]
  13. Eichele, K.; Wasylishen, R.E. 31P NMR study of powder and single-crystal samples of ammonium dihydrogen phosphate: Effect of homonuclear dipolar coupling. J. Phys. Chem. 1994, 98, 3108–3113. [Google Scholar] [CrossRef]
  14. Haeberlen, U. High Resolution NMR in Solids: Selective Averaging. In Advances in Magnetic Resonance; Waugh, J., Ed.; Academic Press: New York, NY, USA, 1976; ISBN 0-12-025561-8. [Google Scholar]
  15. Herzfeld, J.; Berger, A.E. Sideband intensities in NMR spectra of samples spinning at the magic angle. J. Chem. Phys. 1980, 73, 6021–6030. [Google Scholar] [CrossRef]
  16. Eichele, K. HBA 1.7.5. Universität Tübingen. 2015. Available online: http://anorganik.uni-tuebingen.de/klaus/soft/ (accessed on 9 April 2020).
  17. Dawson, D.M.; Moran, R.F.; Sneddon, S.; Ashbrook, S.E. Is the 31P chemical shift anisotropy of aluminophosphates a useful parameter for NMR crystallography? Magn. Reson. Chem. 2019, 57, 176–190. [Google Scholar] [CrossRef] [PubMed] [Green Version]
  18. Baur, W.H. The Geometry of Polyhedral Distortions. Predictive Relationships for the Phosphate Group. Acta Cryst. 1974, B30, 1195–1215. [Google Scholar] [CrossRef]
  19. Zeman, O.E.O.; Moudrakovski, I.L.; Hoch, C.; Hochleitner, R.; Schmahl, W.W.; Karaghiosoff, K.; Bräuniger, T. Determination of the 31P and 207Pb chemical shift tensors in pyromorphite, Pb5(PO4)3Cl, by single-crystal NMR measurements and DFT calculations. Z. Anorg. Allg. Chem. 2017, 643, 1635–1641. [Google Scholar] [CrossRef] [Green Version]
  20. Cohen, M.H.; Reif, F. Quadrupole Effects in Nuclear Magnetic Resonance Studies of Solids. Solid State Phys. 1957, 5, 321–438. [Google Scholar]
  21. Zeman, O.E.O.; Hoch, C.; Hochleitner, R.; Bräuniger, T. NMR interaction tensors of 51V and 207Pb in vanadinite, Pb5(VO4)3Cl, determined from DFT calculations and single-crystal NMR measurements, using only one general rotation axis. Solid State Nucl. Magn. Reson. 2018, 89, 11–20. [Google Scholar] [CrossRef]
  22. Zeman, O.E.O.; Moudrakovski, I.L.; Hartmann, C.; Indris, S.; Bräuniger, T. Local electronic structure in AlN studied by single-crystal 27Al and 14N NMR and DFT calculations. Molecules 2020, 25, 469. [Google Scholar] [CrossRef] [Green Version]
  23. Indris, S.; Heitjans, P.; Uecker, R.; Bredow, T. Local electronic structure in a LiAlO2 single crystal studied with 7Li NMR spectroscopy and comparison with quantum chemical calculations. Phys. Rev. B 2006, 74, 245120. [Google Scholar] [CrossRef] [Green Version]
  24. Samoson, A. Satellite Transition High-Resolution NMR of Quadrupolar Nuclei In Powders. Chem. Phys. Lett. 1985, 119, 29–32. [Google Scholar] [CrossRef]
  25. Bräuniger, T.; Pilz, T.; Chandran, C.V.; Jansen, M. Full differentiation and assignment of boron species in the electrolytes Li2B6O9F2 and Li2B3O4F3 by solid-state 11B NMR spectroscopy. J. Solid State Chem. 2012, 194, 245–249. [Google Scholar] [CrossRef]
  26. Czernek, J.; Brus, J. The plane-wave DFT investigations into the structure and the 11B solid-state NMR parameters of lithium fluorooxoborates. Chem. Phys. Lett. 2016, 666, 22–27. [Google Scholar] [CrossRef]
  27. Jantz, S.G.; Pielnhofer, F.; van Wüllen, L.; Weihrich, R.; Schäfer, M.J.; Höppe, H.A. The first alkaline-earth fluorooxoborate Ba[B4O6F2] – characterisation and doping with Eu2+. Chem. Eur. J. 2018, 24, 443–450. [Google Scholar] [CrossRef] [PubMed]
  28. Soboleva, L.V.; Smolsky, I.L. Vyrashchivanie monokristallov digidrofosfata litsiya LiH2PO4 na osnovanii analiza fazovoj diagrammy Li2O-P2O5-H2O. Kristallografiya 1997, 42, 762–764. [Google Scholar]
  29. Thakur, R.S.; Kurur, N.D.; Madhu, P.K. Swept-frequency two-pulse phase modulation for heteronuclear dipolar decoupling in solid-state NMR. Chem. Phys. Lett. 2006, 426, 459–463. [Google Scholar] [CrossRef]
  30. Chandran, C.V.; Madhu, P.K.; Kurur, N.D.; Bräuniger, T. Swept-frequency two-pulse phase modulation (SWf-TPPM) sequences with linear sweep profile for heteronuclear decoupling in solid-state NMR. Magn. Reson. Chem. 2008, 46, 943–947. [Google Scholar] [CrossRef]
Figure 1. (a) LiH 2 PO 4 (LDP) single crystal, synthesised according to literature [7] and fixed on a wooden rotation axis using dual-component adhesive. (b) Orthorhombic structure of LDP (space group P n a 2 1 , No. 33), according to Reference [6], with the chosen view down the crystallographic [111] direction. All atoms in the unit cell are located at Wyckoff position 4 a , with the lithium atoms (green) and the phosphorus atoms (purple) both tetrahedrally coordinated by oxygen (red). The hydrogen atoms (ivory) stabilize the crystal structure by forming hydrogen bonds (dotted lines) between the PO 4 and LiO 4 tetrahedra. (Drawing generated with the VESTAmathsizesmall program [8]).
Crystals 10 00302 g001
Figure 2. (a) 31 P NMR spectra of the LDP single crystal, with the indicated rotation angles φ referring to the full rotation pattern on the right. (b) Full rotation pattern over 180° for the four magnetically inequivalent 31 P at Wyckoff position 4 a , acquired by rotating the LDP crystal counter-clockwise by 10° around the goniometer axis g 1 . The lines represent the fit of the experimental points to the CS tensor elements and axis orientation (see text for details).
Crystals 10 00302 g002
Figure 3. Full rotation pattern for the four magnetically inequivalent 31 P in LDP at Wyckoff position 4 a , acquired by rotating the crystal counter-clockwise in steps of 10° around the goniometer axes g 2 (a), and g 3 (b). The lines represent the fit of the experimental points to the CS tensor elements and axes orientation (see text for details).
Crystals 10 00302 g003
Figure 4. 31 P-NMR spectrum of polycrystalline LDP, acquired at a MAS rate of 5 kHz. The black triangle indicates the isotropic resonance at 1.7 ppm. The signal at 10.5 ppm (*) is attributed to the 31 P chemical shift in aqueous LiH 2 PO 4 solution.
Crystals 10 00302 g004
Figure 5. (a) 7 Li NMR spectra of the LDP single crystal, with the indicated rotation angles φ referring to the full rotation pattern on the right. (b) Full rotation pattern over 180° for the four magnetically inequivalent 7 Li at Wyckoff position 4 a , acquired by rotating the LDP crystal counter-clockwise by 10° around the goniometer axis g 1 . The lines represent the fit of the experimental points to the quadrupole coupling tensor elements and axis orientation (see text for details).
Crystals 10 00302 g005
Figure 6. (a) Plot of the satellite splittings over 180° for the four magnetically inequivalent 7 Li at Wyckoff position 4 a , acquired by rotating the LDP crystal counter-clockwise by 10° around the three goniometer axes g 1 (a), g 2 (b), and g 3 (c). The lines represent the fit of the experimental points to the quadrupole coupling tensor elements and axes orientation (see text for details).
Crystals 10 00302 g006
Figure 7. LiO 4 and PO 4 polyhedra with related hydrogen atoms in the LDP crystal structure (colour scheme identical to that in Figure 1b). The bold arrows show the principal axes of the 7 Li Q tensor (brown) and 31 P CS tensor (blue), scaled according to the magnitude of the associated eigenvalues, such that an absolute value of 10 kHz (for 7 Li) and 10 ppm (for 31 P) corresponds to a length of 0.4 Å. (Drawing generated with the VESTAmathsizesmall program [8]).
Crystals 10 00302 g007
Table 1. Chemical shift (CS) tensor of 31 P in LDP, LiH 2 PO 4 , at room temperature. Left: From single-crystal NMR rotation patterns, acquired for three different rotation axes. Eigenvector orientations are listed in spherical coordinates ( θ , φ ) in the orthorhombic a b c crystal (CRY) frame and refer to the atom closest to the origin, i.e., P(1). Error values are derived from the fit residuals. Right: Determined from a Herzfeld–Berger analysis [15] of the rotational side-band pattern at ν r = + 5  kHz magic-angle spinning (MAS), using the hba 1.7.5 program [16]. The error values of the tensor components are derived from those of ρ and μ .
Single-Crystal NMRMAS NMR
δ 11 P A S ( 67.0 ± 0.6 ) ppm ( 71 6 + 7 ) ppm
δ 22 P A S ( 13.9 ± 1.5 ) ppm ( 6 6 + 8 ) ppm
δ 33 P A S ( 78.7 ± 0.9 ) ppm ( 82 7 + 6 ) ppm
d 11 77.6°, 213.8°
d 22 31.6°, 325.0°
d 33 61.3°, 116.8°
Δ δ ( 79.4 ± 1.9 ) ppm ( 81 ± 7 ) ppm
η C S 0.67 ± 0.03 0.8 ± 0.2
δ i s o ( 0.7 ± 1 ) ppm ( 1.7 ± 0.1 ) ppm
Table 2. Quadrupole coupling tensor Q Li (left), and isotropic chemical shift δ i s o of 7 Li in LDP, LiH 2 PO 4 , from single-crystal NMR rotation patterns and magic-angle spinning (MAS) NMR. Eigenvector orientations are listed in spherical coordinates ( θ , φ ) in the orthorhombic a b c crystal frame C R Y . The errors of the experimental values reflect those delivered by the fitting routine.
Single-Crystal NMRMAS NMR
Q 11 P A S ( 22.3 ± 0.9 ) kHz
Q 22 P A S ( 48.4 ± 0.8 ) kHz
Q 33 P A S = χ ( 71 ± 1 ) kHz
q 11 50.8°, 16.8°
q 22 71.1°, 123.1°
q 33 45.2°, 233.0° 
η Q 0.37 ± 0.02
δ i s o ( 0.2 ± 0.1 ) ppm

