Abstract
Nanocomposite films of rGO/MFeO3 (M = Bi, La) nanofibers were grown by matrix-assisted pulsed laser evaporation of frozen target dispersions containing GO platelets and MFeO3 nanofibers. Electron microscopy investigations confirmed the successful fabrication of MFeO3 nanofibers by electrospinning Part of nanofibers were broken into shorter units, and spherical nanoparticles were formed during laser processing. Numerical simulations were performed in order to estimate the maximum temperature values reached by the nanofibers during laser irradiation. X-ray diffraction analyses revealed the formation of perovskite MFeO3 phase, whereas secondary phases of BiFeO3 could not be completely avoided, due to the high volatility of bismuth. XPS measurements disclosed the presence of metallic bismuth and Fe2+ for BiFeO3, whereas La2(CO3)3 and Fe2+ were observed in case of LaFeO3 nanofibers. High photocatalytic efficiencies for the degradation of methyl orange were achieved for nanocomposite films, both under UV and visible light irradiation conditions. Degradation values of up to 70% after 400 min irradiation were obtained for rGO/LaFeO3 nanocomposite thin layers, with weights below 10 µg, rGO platelets acting as reservoirs for photoelectrons generated at the surface of MFeO3.
1. Introduction
Water purification from organic materials and other hazardous chemicals is of significant importance, given the high industrial demands of our society. One of the major pollutants found in wastewater is organic dyes, resulting from textile production and other industrial processes [1]. Different wastewater treatment methods are available, ranging from physical and chemical to biological procedures [2,3]. Photocatalytic decomposition of organic pollutants by using sunlight is an environmentally friendly approach developed for wastewater purification. Semiconductor transition metal oxides, most frequently TiO2 or ZnO, are used in photocatalytic processes, due to their non-toxicity, photochemical stability, and low cost [4,5]. Even so, their absorption is limited to the UV range (~5% of total sunlight radiation) due to their large band gap (~3.2 eV). Their high electron–hole recombination rate is also inconvenient, as it must be overcome in order to reach high photocatalytic efficiencies [6]. The increase of the effective surface area of the photocatalytic materials must also be addressed to achieve enhanced photocatalytic activities [7].
The unique optoelectronic properties and narrower band gaps of perovskite oxides, such as bismuth and lanthanum ferrites, BiFeO3 (BFO) and LaFeO3 (LFO), as compared to other transition metal oxides, make them more attractive as visible light photocatalysts [8,9,10]. The increase in surface area of perovskite oxides can be addressed through their smart design into novel nanosized architectures. For instance, the inherent advantages of net-shaping methodologies like electrospinning in the fabrication of oxide nanofibers with high porosity, large surface areas and interconnectivity have led to significant improvements in the device performance for applications such as Li-ion batteries, gas sensors, water splitting, etc. [11,12,13,14,15,16]. In addition, highly reduced graphene oxide (rGO) is a two-dimensional material of great interest in many application fields due to its large surface area, high electron mobility and conductivity [17]. The addition of rGO or graphene platelets to perovskite oxide nanoparticles has led to significant improvements in their photocatalytic degradation efficiencies, with rGO acting as an electron transfer channel, preventing electron–hole recombination [18,19,20,21]. Current synthesis methods for the preparation of nanocomposite compounds containing rGO and metal oxides are usually multistep procedures that involve toxic substances or long-lasting high-temperature annealing processes [22,23,24]. Laser-based techniques could provide a promising alternative to conventional methods, since laser radiation induces very fast and intense heating processes, promoting simultaneously photochemical processes [25,26].
In this article, we report the synthesis and growth of porous MFeO3 (MFO, M = Bi, La) nanofibers/rGO nanocomposite films by a simple laser-based strategy called matrix assisted pulsed laser evaporation (MAPLE). This method consists of the pulsed laser irradiation of frozen solution/dispersion targets, leading to the rapid vaporization of the solvent (matrix) and further deposition of the contained nano-entities (solute) onto a facing substrate [27,28]. The versatility, speed and non-toxicity of the proposed method provides a new approach for the fabrication of nanocomposite films containing rGO and inorganic nano-entities. MAPLE has been used in previous works to deposit rGO films/inorganic nanoparticles hybrid layers [28,29,30,31,32]. In this work, we explored a similar approach, but using nanofibers produced by electrospinning instead of commercial particles. The non-equilibrium mechanisms derived from the use of a localized pulsed laser source facilitate the integration of 1D electrospun nanofibers and 2D rGO, achieving an improved contact with the substrate at room temperature, without requiring any additional post-treatment processing steps. The MFO nanofibers used for the preparation of the target dispersions were synthesized by electrospinning. Numerical simulations were performed for the calculation of the temperature evolution of MFO nanofiber/GO nanocomposite samples during laser irradiation, using COMSOL 5.3 Multiphysics software. The results indicate that partial melting of nanofibers takes place, followed by subsequent recrystallization and nanoparticles’ formation. The photodegradation studies showed that the combined use of MFO nanofibers and rGO results in a qualitative improvement on the photocatalytic degradation efficiency of methyl orange (MO) as compared to single-component rGO or MFO layers, under both ultraviolet (UV) and visible light irradiation conditions.
2. Materials and Methods
2.1. Preparation of MFO Nanofibers by Electrospinning
MFO precursor solutions were prepared by dissolution of Bi(NO3)3·5H2O, La(NO3)3·6H2O and Fe(NO3)3·9H2O salts (Merck KGaA, Darmstadt, Germany) in acetic acid. The amounts were adjusted to obtain a final solution concentration of 0.2 M. The viscosity of the solution was increased by addition of polyvinylpyrrolidone (PVP, Mw = 1,300,000 g·mol−1, Merck KGaA, Darmstadt, Germany) in a proportion of 0.075 g·ml−1. Electrospinning was performed on a metallic collector by loading the precursor solutions into a plastic syringe and feeding them to a stainless-steel needle, with a micro-infusion pump (Landgraf Laborsysteme HLL GmbH, Langenhagen, Germany), at a rate of 10 µL min−1. A high voltage of 15–20 kV was applied with a power supply in order to establish an electric field (1.5–2.0 kV·cm−1) between the needle and the collector, kept 10 cm apart. The samples were then calcined at 600 °C for 5 h, at a heating rate of 1 °C min−1 [33,34].
2.2. Preparation of MAPLE Targets
Dispersions of 3 wt.% MFO nanofibers and 5 wt.% GO platelets (monolayers, NanoInnova Technologies, Madrid, Spain), as well as 3 wt.% MFO and 1 or 5 wt.% GO platelets in distilled water, were prepared for the growth of the reference single-component, as well as nanocomposite layers. The dispersions were then stirred and sonicated for 30 min, to ensure their homogeneity, and subsequently immersed in liquid N2.
2.3. Deposition of MFO Nanofiber/GO Nanocomposite Films by MAPLE Technique
A frequency-quadrupled Quantel Brilliant B Nd:YAG laser source (λ = 266 nm, τFWHM~5 ns, υ = 10 Hz, Quantel Lumibird, Lannion, France) was used for the irradiation of the frozen targets. The experiments were carried out under controlled ambient conditions, in a stainless-steel reaction chamber. Prior to irradiations, the chamber was evacuated down to a residual pressure of 0.1 Pa and then filled with N2 at 20 Pa. The angle between the incident laser beam and the targets’ surface was 45°. The laser beam scanned the target over a surface area of approximately 1 × 1 cm2. The laser fluence on the target surface was set at 400 mJ·cm−2. Then, 5000 laser pulses were applied for the deposition of each layer. F-doped SnO2 (FTO)/glass (Merck KGaA, Darmstadt, Germany) and Cu (Advent, Eynsham, UK) were used as substrate materials. Previously, the substrates were subsequently cleaned in a Hellmanex soap/water solution, deionized water, acetone and ethanol, and then dried in a hot air flow. The substrates were placed parallel to the target surface, at a separation distance of 4 cm, and were maintained at room temperature during the growth of the layers. Figure 1 illustrates the experimental approach employed during the preparation of the nanocomposite GO/MFO nanofiber films.
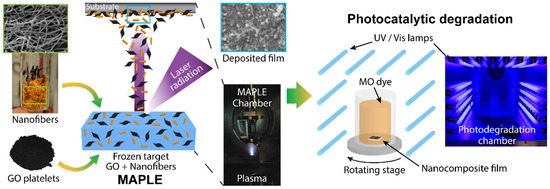
Figure 1.
Schematic representation of the experimental MAPLE approach used for the fabrication of GO/MFO nanofiber films, as well as the photodegradation setup.
2.4. Morphological, Structural and Compositional Analyses
The morphological characterization of the films was performed by field emission scanning electron microscopy (FE-SEM) and high-resolution transmission electron microscopy (HRTEM), with the aid of a QUANTA FEI 200 FEG-ESEM (Thermo Fisher Scientific Inc., Waltham, MA, USA) and a JEOL JEM-2200FS 200 kV FEG TEM (Jeol Ltd., Tokio, Japan) with in-column filter and UHR pole piece electron microscopes. X-ray diffraction (XRD) patterns were recorded on a STOE STADI MP diffractometer (Mo source, λ = 0.7107 Å).
The thermal rise induced in the nanofiber/GO nanocomposite samples by laser irradiation during MAPLE deposition was simulated by solving the transient heat equation, using the finite element method, with COMSOL 5.3 Multiphysics software (COMSOL Inc., Stockholm, Sweden) [35,36,37,38,39,40,41,42].
The chemical composition of the samples was investigated by X-ray photoelectron spectroscopy (XPS). The measurements were performed at a residual pressure of ~10−9 mbar, using an ESCA M-Probe monochromatic Al Kα excitation source (λ = 8.33 Å) (Surface Science Instruments, Thermo Fisher Scientific Inc., Waltham, MA, USA). The acquisition of survey scans was performed with a detector pass energy of 158.9 eV, whilst a pass energy of 22.9 eV was used to record the high-resolution spectra. The C1s signal of adventitious carbon (284.8 eV) was used as reference for the correction of the binding energies for all spectra. Data analysis and peak deconvolution were performed with the CasaXPS software 2.3.15 (Casa Software Ltd., Teignmouth, UK).
2.5. Investigation of Photocatalytic Degradation Efficiency of MFO Nanofiber/GO Nanocomposite Films under UV or Visible Light Irradiation
The photocatalytic efficiency of the layers deposited by MAPLE technique was evaluated through the degradation of MO (C14H14N3NaO3S) organic dye molecules. The experiments were performed under UV or visible light irradiation, using an LZC-ICH2 photoreactor from Luzchem Research Inc., Ottawa, ON, Canada. 16 × 8 W UV lamps with an emission wavelength centered at 360 nm (300–400 nm emission range, LZC-UVA, Hitachi lamp) or 16 × 8 W visible lamps centered at 580 nm (420–700 nm emission range, LZC-Vis, OSRAM lamp, Sylvania, Wilmington, NC, USA) were used as light sources. 2 mL MO solutions with 1.25 × 10⁻⁵ M (4 ppm) initial MO dye concentration (C0) were irradiated in quartz vials. The changes of the peak absorbance of the MO solution at 464 nm wavelength was measured with the aid of a Shimadzu UV-2600 spectrophotometer (Shimadzu Scientific Instruments, Columbia, MD, USA). The MO dye concentration was calculated by using the Lambert–Beer law, from the measured peak absorbance value. The photocatalytic degradation efficiencies, η, of the samples were calculated with the formula η [%] = (C0 − C) × 100/C0, where C is the MO concentration in the aqueous solution under UV or visible light irradiation, measured at regular time intervals.
3. Results and Discussion
3.1. Morphological, Structural and Compositional Characterization
The as-spun MFeOx (M = Bi, La) nanofibers possess a smooth surface morphology with rather uniform widths, with diameters of approximately 200–450 nm, while their lengths are in the tens of micrometers range (Figure 2a). The nanofibers’ surface becomes porous, granular and rougher after calcination, with grains of around 50 to 100 nm in size. There is also a shrinkage in dimensions during annealing of MFO nanofibers, mainly due to PVP removal, diameters being around 100–250 nm (Figure 2b) [43]. The presence of thicker regions is due to the merging/attachment of nanofibers during calcination and crystallization [44].
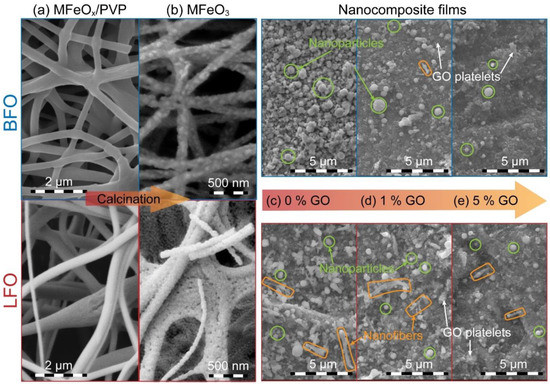
Figure 2.
SEM micrographs of (a) the as-spun MFeOx/PVP, (b) the calcined MFO nanofibers and the nanocomposite films containing 3% ferrite nanofibers and GO concentrations of (c) 0%, (d) 1% and (e) 5%.
Ferrite nanofibers were then deposited together with GO nanoplatelets by MAPLE, through the irradiation of flash-frozen targets (see Section 2.3). The film containing only BFO presents a surface morphology consisting of spherical particles with sizes between approximately 100 nm and 1 µm, and fiber-like structures are not present (Figure 2c). The LFO film is also formed by round particles with sizes similar to BFO sample. In addition, short wire-like structures with widths of ~100–300 nm, and lengths of approximately between 500 nm and 2 µm, are also present. The formation of spherical nanoparticle aggregates has been previously attributed to partial melting of the material upon absorption of the laser radiation [45]. Thus, the fluence used in the current experiments (~400 mJ·cm−2) will likely melt part of the nanofibers, provided that the band gap of ferrite perovskites typically ranges from 2.0 to 3.0 eV and the laser photon energy is ~4.7 eV, resulting in surface morphologies also observed for other oxide materials submitted to laser irradiation [25,46].
The incorporation of the GO platelets into the film’s structure can be clearly detected upon their addition to the starting dispersions (Figure 2c–e). The increasing amount of GO platelets in the nanocomposite films results in a reduction of the number of particles and fibers present at the surface, and this can be correlated with their lower relative concentration in the target dispersions and by the intrinsic physical properties of the GO platelets (lower absorption coefficient at the wavelength of the incident laser radiation) [47]. Additional areas could be identified with the presence of elongated structures which resemble broken nanofibers (Supplementary Figures S1 and S2). HRTEM images confirm the presence of GO platelets, round particles and nanofibers (Supplementary Figure S3).
Numerical simulations were performed in order to estimate the temperature evolutions during the MAPLE deposition, both for MFO and GO platelets, and to explain the presence of nanoparticles on the surface of the MFO, as well as MFO/GO hybrid composite films. To this aim, the transient heat equation was solved, employing the optical and thermophysical magnitudes reported in References [35,36,37,38,39,40,41,42]. The laser pulse duration was assumed to have a Gaussian shape (τFWHM~5 ns), and distilled water solvent was supposed to have a negligible absorption at the wavelength of the laser radiation. Figure 3 shows that temperatures reached due to GO platelets’ heating through the absorption of laser radiation are larger when compared to the water ice boiling point and increase with the GO flake thickness. Moreover, the heating has a duration of tens to a few hundred ns. Upon interaction with the MFO nanofibers, the absorbed laser radiation induces a temperature rise, notably larger than the one achieved by GO platelets, overpassing the MFO melting point after the first 2 ns of the laser pulse (Tm (LFO/BFO) ~1250 K). Such rapid heating will also derive in the rising of the surrounding water ice temperature by heat transfer, leading to explosive boiling and vapor-driven ejection of MFO nanofibers and GO platelets toward the substrate surface. Numerical simulations also explain the presence of molten/spherical nanoparticles, since the vaporization temperature of LaFeO3 nanofibers situated at the surface of the MAPLE target, reported at ~2120 K [48], is surpassed during laser irradiation. On the other hand, BiFeO3 decomposes due to the volatility of Bi [49,50,51], and iron oxides evaporate at temperatures around 2000 K [52]. Furthermore, the fluence distribution throughout the target is inhomogeneous, since absorption of laser radiation occurs along the whole optical penetration depth. This shielding effect of the superficial material leads to temperatures below the MFO melting point in deeper zones, but above the water boiling point, enabling transportation of entire or partially molten nano-entities. The addition of GO also contributes to diminish the developed temperature in the irradiated targets, due to absorption of the laser radiation [42], which in turn derives in a lower vaporization rate compared to pure nanofiber samples.
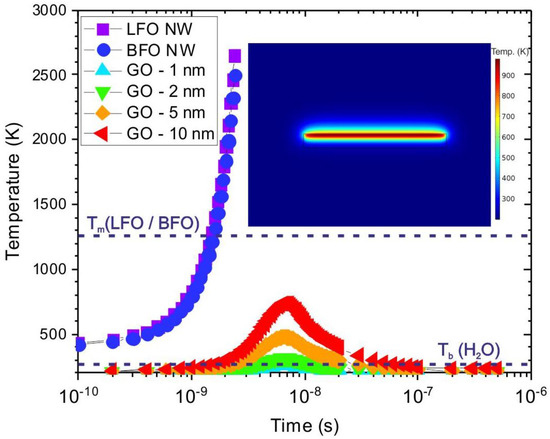
Figure 3.
Simulated temperature evolution of LFO and BFO nanowires (100 nm in diameter; 1 um in length), and GO flakes (1 um lateral size, and 1, 2, 5 and 10 nm in thickness). Inset: temperature distribution in LFO NW and surrounding matrix obtained at t = 1 ns.
The crystalline phase of the MFO nanofibers, as well as nanocomposite films, was investigated by XRD (Figure 4). The formation of a polycrystalline BFO phase is inferred by indexing the diffraction pattern (Figure 4a). The space group corresponds to the Rc with lattice parameters a~5.59 Å and c~13.87 Å (ICSD 15299). The most intense peaks of feasible impurity phases, such as Bi2Fe4O9 (ICSD 186440) and Bi25FeO40 (ICSD 41937), have been indexed in the diffraction pattern, to show that their presence is insignificant, although it cannot be completely discarded, particularly due to the rather strict temperature conditions for the fabrication of pure phase BFO, as well as the volatility of bismuth [49,50,51]. The LFO nanofibers pattern (Figure 4b) can be fitted to the pseudo-cubic perovskite Pm-3m structure with a lattice parameter aLFO = 3.926 Å (ICSD 29234). Some peaks that may be related to a Fe2O3 phase (ICSD 173655) were identified. The Debye–Scherrer formula was used to estimate an average crystallite size of 43 ± 16 nm (BFO) and 58 ± 15 nm (LFO) by fitting of the (110) peak. These values are smaller compared to the results reported by SEM, as expected, since XRD measures the small units that form larger grains [53]. The MFO nanofibers/rGO nanocomposite films deposited on FTO/glass present some differences between each other. On the one hand, it can be confirmed that both MFO phases remain after MAPLE deposition. The melting and recrystallization of oxides without phase segregation by laser irradiation is a phenomenon that has already been reported [25,54]. On the other hand, there is a substantial decrease in the BFO peak intensities of nanocomposite films, as compared to the corresponding single-component layer, which could be attributed to partial melting and decomposition of the nanofibers during laser-induced heating, as evidenced by our numerical simulations. Indeed, prolonged exposure to calcinations of BFO was reported to lead to bismuth evaporation and to the formation of secondary phases [55]. Nevertheless, the high signal-to-noise ratio does not allow the detection of other crystalline phases. The broad amorphous shoulder at angles below 17° belongs to the glass substrate and probably some amorphized rGO.
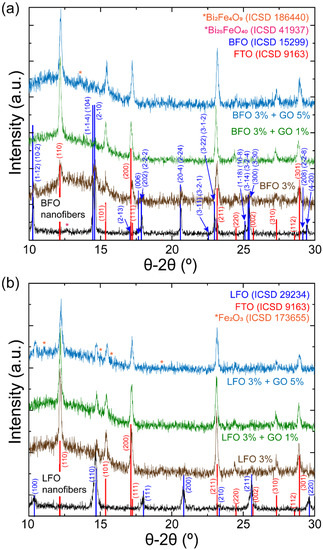
Figure 4.
XRD patterns of (a) BFO nanofibers, BFO single-component layers and BFO nanofibers/rGO nanocomposite films; and (b) LFO nanofibers LFO single-component layers and LFO nanofibers/rGO nanocomposite films.
XPS investigations were performed in order to determine the surface composition and metal oxidation states of the samples. The XPS spectra in Supplementary Figure S4 and Reference [13] show the elemental composition of MFO nanofibers. From the survey spectra (Supplementary Figure S4a), the elemental ratios for BFO nanofibers are estimated to be 17.0 (Bi), 6.8 (Fe), 41.2 (O) and 34.8 at.% (C), whereas the composition for LFO nanofibers is 7.0 (La), 6.6 (Fe), 56.4(O) and 29.7 at.% (C). The presence of carbon was mainly attributed to adventitious carbon species [56], although some carbon residues stemming from the decomposition of organic material during the nanofiber synthesis process might also be present (Supplementary Figure S4b) [13,34]. The presence of lanthanum carbonate La2(CO3)3 on the LFO sample surface was also detected, due to its high reactivity with ambient CO2 [13,57]. The La-Fe-O elemental ratio in LFO fibers is estimated to be close to the expected 1:1:3, whereas the nonstoichiometric ratio of Bi-Fe-O for BFO has been attributed to several origins. The XPS detection limit of light elements, such as iron and oxygen, is known to increase in presence of heavy elements, like bismuth [58]. Furthermore, it has been reported that the accuracy in the quantification of some transition metals is influenced by the orbitals selected for quantification; in the case of iron, it can even vary by a factor four [59]. The Bi 4f region was deconvoluted by fitting two sets of doublets (Supplementary Figure S4c). The peaks with higher binding energies, 159.1 and 164.4 eV, respectively, were correlated with Bi-O bonds in BiFeO3. The low-intensity lines located at 157.4 and 162.7 eV were attributed to the presence of metallic bismuth (21.08 at.%) [60,61,62,63], which are often observed after calcination due to the high volatility of bismuth [49,50,51]. Elucidation of oxygen vacancies concentration has been investigated through deconvolution of the O 1s spectrum [64,65,66]. Three peaks were identified at binding energies of 529.95 eV (81.20%), 531.5 eV (9.44%) and 532.1 eV (9.35%) (Figure S4d), which were respectively assigned to oxygen lattice bonds in BiFeO3 [67], oxygen deficient regions and absorbed hydroxides, as well as organic species that may remain after calcination of the BFO nanofibers [67,68]. By taking into account the ratio between the former two peaks [66], we estimate a concentration of oxygen vacancies of ~12 %. In the Fe 2p high-resolution spectrum (Supplementary Figure S4e), the Fe 2p3/2 signal could be fitted with a multiplet of five peaks situated at 709.7, 710.7, 711.5, 712.6 and 713.6 eV, binding according to typical values of Fe3+ in Fe2O3 or BiFeO3 [69]. The absence of the typical Fe2+ satellite peak at 715.4 eV indicates that no significant amount Fe2+ species is present. For LFO nanofibers [13], the La 3d spectrum has two contributions, corresponding to lanthanum carbonate and LFO. In the Fe 2p spectrum, we could identify the presence of Fe2+ with an amount of 29.25 at.% (main peaks at 708.3, 709.6, 710.8 and 712.0 eV). The Fe3+ (709.6, 710.6, 711.4, 712.5 and 713.5 eV) was mostly attributed to LFO, although it could probably be associated to Fe2O3, since the binding energies are in the same range. No clear satellite peaks for Fe3+ or Fe2+ were identified.
In all samples of the BFO nanocomposite film series, the M:Fe:O stoichiometry ratios are slightly different from the nanofiber counterparts (Figure 5a). The excess oxygen observed in the LFO survey is most probably related to the formation of lanthanum carbonate (Figure 5b). The metallic bismuth peak is also found in the high-resolution Bi 4f spectra with a maximum percentage of ~30% (Figure 6a and Supplementary Figure S5a,b). Since it is well-known that oxidized bismuth species can be thermally reduced in the presence of carbon, we assume that the presence of rGO, as well as the laser-driven heating demonstrated by the temperature simulations, may be promoting the formation of Bi0 during the laser deposition process [70]. On the other hand, the La 3d spectra for rGO/LFO films also show the presence of larger amounts of La2(CO3)3, i.e., between 10% and 15% more, as compared to LFO nanofibers (Figure 6b and Supplementary Figure S5c,d). Besides the possible reaction with atmospheric humidity and CO2 during storage [71], the laser-driven reaction of LFO with the carbon present in the rGO platelets could explain this increase.
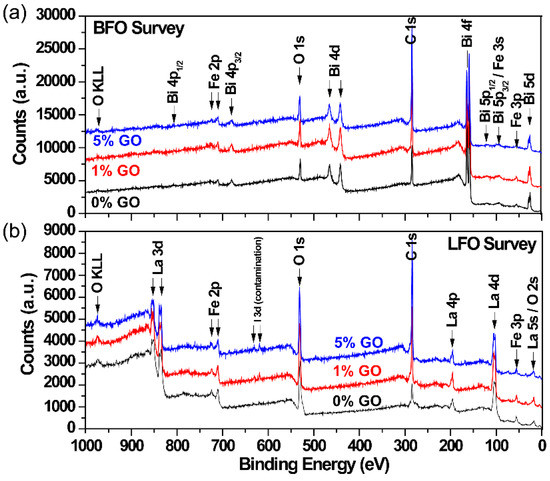
Figure 5.
Survey XPS spectra of: (a) the GO/BFO and (b) GO/LFO nanofiber films with GO concentrations of 0, 1 and 5%.
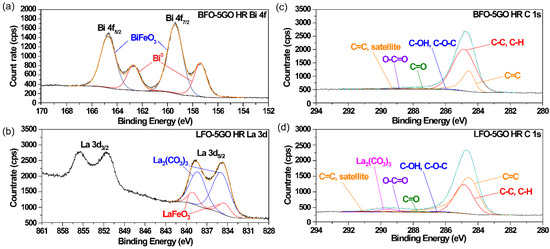
Figure 6.
High-resolution (a) Bi 4f spectrum of GO/BFO and (b) La 3d spectrum of GO/LFO nanofiber films, and high-resolution C 1s spectra of (c) GO/BFO and (d) GO/LFO nanofiber films. The GO concentration of these samples was 5%.
Another interesting feature is the change in the peak structure of the Fe 2p region by increasing the rGO content (Supplementary Figure S6). As we mentioned before, the Fe 2p3/2 line of all films presents the characteristic structure of Fe3+ related to BFO and LFO. In the BFO series, the appearance of Fe2+ peaks can be identified, indicating the reduction of Fe3+ to Fe2+ due to the presence of rGO. The LFO films present an equivalent satellite structure to that of BFO films. Three peaks could be identified in the high-resolution O1s spectra (Figure S7) that can be associated to lattice oxygen (529.9 eV), oxygen vacancies and hydroxides (531.5 eV) and organic oxygen (532.1 eV) from carbon–oxygen groups (C–O–C, C–OH, C=O and O–C=O).
The high-resolution C1s peak of the GO precursor, reported elsewhere [32,72,73], shows a large content of oxygen functional groups. At binding energies of 284.5 and 284.8 eV, we can respectively find the peaks associated to sp2 graphitic carbon bonds (C=C), adventitious carbon and sp3 bonded carbon (C–C, C–H). As mentioned before, it is possible that these peaks have some contribution coming from residual carbon due to PVP decomposition during nanofiber calcination, despite that the resulting nanofibers are completely crystalline [13,34]. The peaks corresponding to single-bonded carbon–oxygen groups, such as epoxy (C–O–C) and hydroxyl (C–OH), can be found at approximately 286.3 eV, whereas the peaks at binding energies of 287.8 and 288.8 eV are typically assigned to carbonyl (C=O) and carboxyl (O–C=O) groups [74,75]. The C1s spectra of the GO/BFO composite (Figure 6c and Supplementary Figure S8b), as well as GO/LFO composite layers (Figure 6d and Supplementary Figure S8d) confirm the significant reduction of the number of oxygen-containing functional C–OH, C–O–C, C=O and COOH groups of GO platelets during laser processing. In addition, the low-intensity peaks centered at 291 eV can be assigned to the π–π* shake-up satellite of the sp2 graphitic C peak at 284.5 eV, indicating the restoration of π conjugated domains, and is characteristic for aromatic structures [76].
3.2. Photocatalytic Degradation of Methyl Orange
The photocatalytic degradation efficiency of the MFO (M = Bi, La) nanofiber/rGO nanocomposite films was investigated both under UV and visible light irradiation (Supplementary Figures S9–S13). Photodegradation experiments were carried out in quartz reactors containing the MO solutions. Control experiments in the absence of photocatalysts were performed under UV and visible light irradiation, which evidenced the high photostability of MO molecules (Supplementary Figure S9). The photodegradation efficiency of single-component GO, BFO and LFO films was found to be very low, reaching only around 5% after 450 min of UV light exposure (Figure 7a,b). The inclusion of rGO in the composition of the layers led to the gradual increase of the degradation efficiency, both in case of BFO and LFO. The photodegradation efficiency of the BFO/rGO and LFO/rGO composites with 1 and 5 wt.% rGO was found to be approximately 43% and 70%, respectively, after 450 min of UV light irradiation (Figure 7). Our results are in good agreement with previous results reported in the literature concerning photocatalytic degradation efficiency of MFO/rGO composite layers. The inclusion of rGO improved the photocatalytic activity, demonstrating considerably better degradation of methylene blue [77] or Rhodamine B [20] dye molecules and higher hydrogen production by water-splitting, as compared to pure BiFeO3 [77].
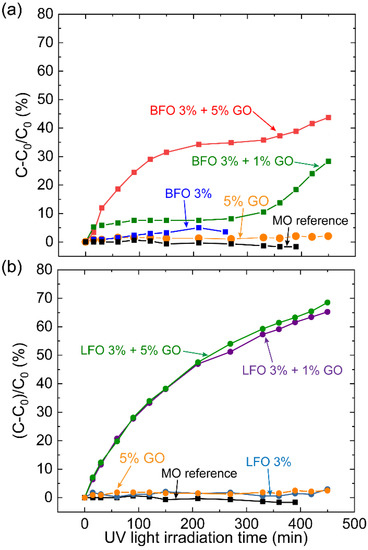
Figure 7.
Self-degradation and photocatalytic degradation efficiency of MO under UV light irradiation, in the presence of (a) GO, BFO and BFO/rGO nanocomposite, as well as (b) LFO and LFO/rGO nanocomposite films under UV light irradiation.
The photocatalytic properties of the LFO/rGO composite photocatalyst containing 5 wt.% rGO, with the highest degradation efficiency under UV light irradiation, were also tested during visible light irradiation (Figure 8). Similar to the previous experiments, around 70% of the initial dye molecules were decomposed after 450 min of light exposure. However, the degradation efficiency of the layer decreased until around 27% during the second consecutive degradation cycle.
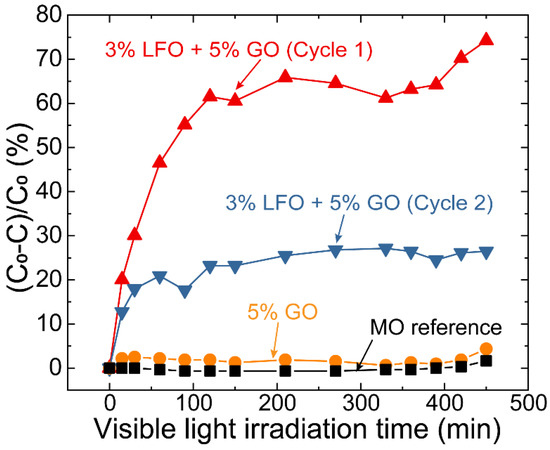
Figure 8.
Photocatalytic degradation rate under visible light irradiation of MO for GO 5% and LFO 3% + GO 5%, after one and two degradation cycles.
The apparent photodegradation rate constant, kapp, of the BFO/rGO and LFO/rGO composite photocatalyst was calculated according to first-order kinetics, −dC/dt = kappC, both for UV and visible light irradiation. After the integration of the equation between the limits C0 at t = 0 and C at irradiation time, t, the apparent rate constant is given by kapp = ln (C0/C)/t. Moreover, kapp was calculated for each sample, from the linear part of the ln (C0/C) plots versus t [78], before the saturation limit, tsat, was reached for different time intervals. The results are presented in Table 1. As can be observed, the kapp values are similar under UV light irradiation, being slightly lower in the case of the samples with a low rGO concentration. Moreover, saturation has been reached earlier in case of BFO/rGO, as compared to the LFO/rGO layers, and at lower rGO concentration. The saturation behavior can be attributed to adsorption of dye molecules by the BFO nanomaterial during the photocatalytic test. The relative concentration of BFO is higher in the case of the BFO/rGO composite containing 1 wt.% rGO, accompanied with a low degradation rate, led to a faster saturation. Similarly, adsorption and photodegradation processes simultaneously take place during visible light irradiation of MO dye solutions in the presence of LFO/rGO composite layers. The process was slowed down after 120 min of light exposure, due to the effective degradation of MO molecules, as compared to UV light irradiation. During the second degradation cycle, part of the dye molecules adsorbed during the previous degradation run remained on the surface after the washing step, causing a faster saturation (Figure 8).

Table 1.
kapp and tsat of the BFO/rGO and LFO/rGO composite layers under UV or visible light irradiation.
The UV light, with maximum emission wavelength of 360 and 300–400 nm emission range corresponds to a photon energy of 3.4 eV for the maximum emission wavelength and 3.1–4.1 eV total photon energy range. These photon energy values are larger than the band gaps of BFO and LFO (Eg = 2.0–2.7 eV), ejecting electrons (e−) to the conduction bands (CB) of BFO and LFO, leading to the formation of holes (h+) in their valence bands (VB) (Equation (1)) [18,29]:
MFeO3 + hv → MFeO3 (e− + h+), M = Bi, La
This process can also take place under visible light irradiation. The maximum emission wavelength of the visible lamps used for the photocatalytic tests is 580 nm, corresponding to a photon energy of 2.1 eV, while their total emission range is 420–700 nm, (1.8–2.9) eV total photon energy. Thus, part of the emitted radiation can be absorbed by the BFO and LFO nanofibers, i.e., photon energies equal or higher than their band gap. The positively charged h+ oxidize the water molecules in contact with the nanofibers’ surface, generating hydroxyl radicals, which later oxidize the MO dye, forming inorganic products [79,80], CO2 and H2O (Equations (2) and (3)):
H2O + MFeO3 (h+) → *OH + H+
*OH + pollutant → H2O + CO2 + inorganic products (SO42−, NO3−, NH4+)
The photogenerated e− and h+ can be trapped in the MFeO3 lattice and rapidly recombine [81,82]. However, the addition of rGO and its high electrical conductivity supplied by the π–π conjugated structure and the low amount of oxygen-containing functional groups further enhance the electrical conductivity and promote the separation of e− and h+, improving the degradation capabilities as compared to MFO or rGO alone [83,84]. In addition, the photogenerated e− reacts with the adsorbed O2, forming a superoxide radical anion (O2*−), also contributing to pollutant degradation (Equations (4) and (5)) [29,85]:
O2 + rGO (e−) → O2*−
O2*− + pollutant → H2O + CO2 + salts
Moreover, rGO also contributes to the generation of e− and h+ under UV and visible light irradiation (Equation (6)) [29]:
rGO + hv → rGO (e− + h+)
The degradation process is schematically presented in Figure 9.
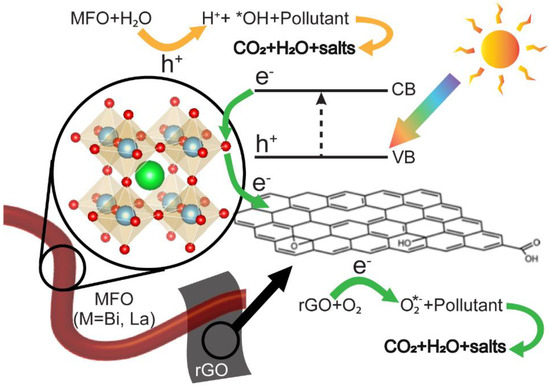
Figure 9.
Schematic representation of the dye degradation mechanism by the MFO/rGO composite films due to UV and visible light absorption, followed by the ejection of electrons from the valence bands (VB) to the conduction bands (CB) of MFO nanofibers.
4. Conclusions
Nanocomposite films consisting of MFO (M = Bi, La) nanofibers and rGO platelets were synthesized by using the MAPLE technique. The layers were used as photocatalysts for organic dye degradation. Formation of shorter nanofiber units was caused by breakage of nanofibers. Temperature simulations confirmed that nanoparticles’ formation takes place due to the partial melting of nanofibers during laser processing and subsequent recrystallization. The MFO/rGO nanocomposite films presented enhanced photocatalytic activities toward degradation of methyl orange dye molecules, under UV or visible light irradiation, with LFO/rGO showing values around two times higher than BFO/rGO layers. The injection of photogenerated charge carriers from the MFeO3 into the π–π conjugated structure of rGO is the main mechanism responsible for the improved photocatalytic degradation efficiency as compared to pure MFO or GO layers. In addition, the formation of intra-gap states due to the presence of oxygen vacancies allows for the extension of the absorption range to the visible range of the solar spectrum.
Supplementary Materials
The following are available online at https://www.mdpi.com/2073-4352/10/4/271/s1. Figure S1: Additional SEM micrographs of BFO/GO nanocomposites. Figure S2: Additional SEM micrographs of LFO/GO nanocomposites. Figure S3: HRTEM of LFO/GO nanocomposites. Figure S4: XPS spectra of BFO nanofibers. Figure S5: High-resolution XPS spectra of Bi 4f and La 3d lines. Figure S6: High-resolution XPS spectra of Fe 2p lines. Figure S7: High-resolution XPS spectra of O 1s lines. Figure S8: High-resolution XPS spectra of C 1s lines. Figure S9: Absorption spectra of methyl orange references. Figure S10: Absorption spectra of methyl orange with a GO sample. Figure S11: Absorption spectra of methyl orange under UV light for BFO/GO nanocomposites. Figure S12: Absorption spectra of methyl orange under UV light for LFO/GO nanocomposites. Figure S13: Absorption spectra of methyl orange under visible light for LFO/GO nanocomposites.
Author Contributions
Conceptualization, A.Q., E.G., Á.P.d.P. and S.M.; methodology, A.Q., R.I., Á.P.d.P., and R.F.; validation, A.Q., E.G., Á.P.d.P., and S.M.; formal analysis, A.Q., E.G., Á.P.d.P., and R.F.; investigation, A.Q., E.G., R.I., Á.P.d.P., and R.F.; resources, A.Q., E.G., Á.P.d.P., and S.M.; data curation, A.Q., E.G., and Á.P.d.P.; writing—original draft, A.Q., E.G., Á.P.d.P., R.F., and S.M.; writing—review & editing, A.Q., E.G., Á.P.d.P., R.F., and S.M.; visualization, A.Q., E.G., and Á.P.d.P.; supervision, E.G., Á.P.d.P., and S.M.; project administration, A.Q., E.G., Á.P.d.P., and S.M.; funding acquisition, A.Q., E.G., Á.P.d.P., and S.M. All authors have read and agreed to the published version of the manuscript.
Funding
This research was funded by the ALEXANDER VON HUMBOLDT FOUNDATION AND THE GERMAN FEDERAL MINISTRY FOR EDUCATION AND RESEARCH (grant number AVH 1184642), UNIVERSITY OF COLOGNE, the SPANISH MINISTRY of ECONOMY, INDUSTRY AND COMPETITIVENESS (grant number ENE2017-89210-C2-1-R), AGAUR OF GENERALITAT DE CATALUNYA (grant number 2017 SGR 1086) and SEVERO OCHOA PROGRAMME FOR CENTRES OF EXCELLENCE IN R&D (grant number SEV-2015-0496).
Acknowledgments
The authors kindly acknowledge the financial support of the University of Cologne, the Spanish Ministry of Economy, Industry and Competitiveness under the project ENE2017-89210-C2-1-R, and support from AGAUR of Generalitat de Catalunya, through the project 2017 SGR 1086. ICMAB acknowledges financial support from the Spanish Ministry of Economy and Competitiveness, through the “Severo Ochoa” Programme for Centres of Excellence in R&D (SEV-2015-0496). A. Queraltó appreciates the support of the Alexander von Humboldt foundation (AVH 1184642) and the German Federal Ministry for Education and Research, supporting his postdoctoral research.
Conflicts of Interest
The authors declare no conflict of interest.
References
- Ildefonso, Z.T.; José de Jesús, P.B.; Celeste Yunueth, T.L.; Luis, L.R.; Maria Luisa, M.L.; Yunny, M.V. A phenomenon of degradation of methyl orange observed during the reaction of NH4TiOF3 nanotubes with the aqueous medium to produce TiO2 anatase nanoparticles. RSC Adv. 2016, 6, 76167–76173. [Google Scholar] [CrossRef]
- Ghaedi, M.; Rahimi, M.R.; Ghaedi, A.M.; Tyagi, I.; Agarwal, S.; Gupta, V.K. Application of least squares support vector regression and linear multiple regression for modeling removal of methyl orange onto tin oxide nanoparticles loaded on activated carbon and activated carbon prepared from Pistacia atlantica wood. J. Colloid. Interface Sci. 2016, 461, 425–434. [Google Scholar] [CrossRef]
- Robati, D.; Mirza, B.; Rajabi, M.; Moradi, O.; Tyagi, I.; Agarwal, S.; Gupta, V.K. Removal of hazardous dyes-BR 12 and methyl orange using graphene oxide as an adsorbent from aqueous phase. Chem. Eng. J. 2016, 284, 687–697. [Google Scholar] [CrossRef]
- Chen, X.; Mao, S.S. Titanium dioxide nanomaterials: Synthesis, properties, modifications, and applications. Chem. Rev. 2007, 107, 2891–2959. [Google Scholar] [CrossRef] [PubMed]
- Jassby, D.; Farner Budarz, J.; Wiesner, M. Impact of aggregate size and structure on the photocatalytic properties of TiO2 and ZnO nanoparticles. Env. Sci. Technol. 2012, 46, 6934–6941. [Google Scholar] [CrossRef]
- Kamat, P.V. TiO2 Nanostructures: Recent physical chemistry advances. J. Phys. Chem. C 2012, 116, 11849–11851. [Google Scholar] [CrossRef]
- Pesci, F.M.; Wang, G.; Klug, D.R.; Li, Y.; Cowan, A.J. Efficient suppression of electron–hole recombination in oxygen-deficient hydrogen-treated TiO2 nanowires for photoelectrochemical water splitting. J. Phys. Chem. C 2013, 117, 25837–25844. [Google Scholar] [CrossRef] [PubMed]
- Li, F.-T.; Liu, Y.; Liu, R.-H.; Sun, Z.-M.; Zhao, D.-S.; Kou, C.-G. Preparation of Ca-doped LaFeO3 nanopowders in a reverse microemulsion and their visible light photocatalytic activity. Mater. Lett. 2010, 64, 223–225. [Google Scholar] [CrossRef]
- Niu, X.; Li, H.; Liu, G. Preparation, characterization and photocatalytic properties of REFeO3 (RE = Sm, Eu, Gd). J. Mol. Catal. A Chem. 2005, 232, 89–93. [Google Scholar] [CrossRef]
- Catalan, G.; Scott, J.F. Physics and applications of bismuth ferrite. Adv. Mater. 2009, 21, 2463–2485. [Google Scholar] [CrossRef]
- Ludwig, T.; Bohr, C.; Queraltó, A.; Frohnhoven, R.; Fischer, T.; Mathur, S. Inorganic nanofibers by electrospinning techniques and their application in energy conversion and storage systems. In Semiconductors and Semimetals: Nanowires for Energy Applications; Sudha, M., Chennupati, J., Eds.; Elsevier: Amsterdam, The Netherlands, 2018; Volume 98, pp. 1–70. [Google Scholar]
- Von Hagen, R.; Lorrmann, H.; Möller, K.-C.; Mathur, S. Electrospun LiFe1−yMnyPO4/C nanofiber composites as self-supporting cathodes in Li-Ion batteries. Adv. Energy Mater. 2012, 2, 553–559. [Google Scholar] [CrossRef]
- Queraltó, A.; Graf, D.; Frohnhoven, R.; Fischer, T.; Vanrompay, H.; Bals, S.; Bartasyte, A.; Mathur, S. LaFeO3 nanofibers for high detection of sulfur-containing gases. ACS Sustain. Chem. Eng. 2019. [Google Scholar] [CrossRef]
- Ding, B.; Wang, M.; Wang, X.; Yu, J.; Sun, G. Electrospun nanomaterials for ultrasensitive sensors. Mater. Today 2010, 13, 16–27. [Google Scholar] [CrossRef]
- Fei, L.; Hu, Y.; Li, X.; Song, R.; Sun, L.; Huang, H.; Gu, H.; Chan, H.L.; Wang, Y. Electrospun bismuth ferrite nanofibers for potential applications in ferroelectric photovoltaic devices. ACS Appl. Mater. Interfaces 2015, 7, 3665–3670. [Google Scholar] [CrossRef] [PubMed]
- Agarwal, S.; Greiner, A.; Wendorff, J.H. Functional materials by electrospinning of polymers. Prog. Polym. Sci. 2013, 38, 963–991. [Google Scholar] [CrossRef]
- Yang, Y.; Lu, F.; Zhou, Z.; Song, W.; Chen, Q.; Ji, X. Electrochemically cathodic exfoliation of graphene sheets in room temperature ionic liquids N-butyl, methylpyrrolidinium bis(trifluoromethylsulfonyl)imide and their electrochemical properties. Electrochim. Acta 2013, 113, 9–16. [Google Scholar] [CrossRef]
- Acharya, S.; Martha, S.; Sahoo, P.C.; Parida, K. Glimpses of the modification of perovskite with graphene-analogous materials in photocatalytic applications. Inorg. Chem. Front. 2015, 2, 807–823. [Google Scholar] [CrossRef]
- Ren, X.; Yang, H.; Gen, S.; Zhou, J.; Yang, T.; Zhang, X.; Cheng, Z.; Sun, S. Controlled growth of LaFeO3 nanoparticles on reduced graphene oxide for highly efficient photocatalysis. Nanoscale 2016, 8, 752–756. [Google Scholar] [CrossRef]
- Basith, M.A.; Ahsan, R.; Zarin, I.; Jalil, M.A. Enhanced photocatalytic dye degradation and hydrogen production ability of Bi25FeO40-rGO nanocomposite and mechanism insight. Sci. Rep. 2018, 8, 11090. [Google Scholar] [CrossRef]
- Hu, J.; Ma, J.; Wang, L.; Huang, H. Preparation of La1−xSrxMnO3/graphene thin films and their photocatalytic activity. Mat. Sci. Eng. B 2014, 180, 46–53. [Google Scholar] [CrossRef]
- Khan, M.; Tahir, M.N.; Adil, S.F.; Khan, H.U.; Siddiqui, M.R.H.; Al-Warthan, A.A.; Tremel, W. Graphene based metal and metal oxide nanocomposites: Synthesis, properties and their applications. J. Mater. Chem. A 2015, 3, 18753–18808. [Google Scholar] [CrossRef]
- Smith, A.T.; LaChance, A.M.; Zeng, S.; Liu, B.; Sun, L. Synthesis, properties, and applications of graphene oxide/reduced graphene oxide and their nanocomposites. Nano Mater. Sci. 2019, 1, 31–47. [Google Scholar] [CrossRef]
- Xu, J.; Yan, B.; Maleki Kheimeh Sari, H.; Hao, Y.; Xiong, D.; Dou, S.; Liu, W.; Kou, H.; Li, D.; Li, X. Mesoporous ZnCo2O4/rGO nanocomposites enhancing sodium storage. Nanotechnology 2019, 30, 234005. [Google Scholar] [CrossRef]
- Palneedi, H.; Park, J.H.; Maurya, D.; Peddigari, M.; Hwang, G.T.; Annapureddy, V.; Kim, J.W.; Choi, J.J.; Hahn, B.D.; Priya, S.; et al. Laser irradiation of metal oxide films and nanostructures: Applications and advances. Adv. Mater. 2018, 30, e1705148. [Google Scholar] [CrossRef] [PubMed]
- Nakajima, T.; Shinoda, K.; Tsuchiya, T. UV-assisted nucleation and growth of oxide films from chemical solutions. Chem. Soc. Rev. 2014, 43, 2027–2041. [Google Scholar] [CrossRef]
- Piqué, A. The matrix-assisted pulsed laser evaporation (MAPLE) process: Origins and future directions. Appl. Phys. A 2011, 105, 517–528. [Google Scholar] [CrossRef]
- Caricato, A.P.; Luches, A. Applications of the matrix-assisted pulsed laser evaporation method for the deposition of organic, biological and nanoparticle thin films: A review. Appl. Phys. A 2011, 105, 565–582. [Google Scholar] [CrossRef]
- Datcu, A.; Duta, L.; Perez del Pino, A.; Logofatu, C.; Luculescu, C.; Duta, A.; Perniu, D.; Gyorgy, E. One-step preparation of nitrogen doped titanium oxide/Au/reduced graphene oxide composite thin films for photocatalytic applications. RSC Adv. 2015, 5, 49771–49779. [Google Scholar] [CrossRef]
- Queraltó, A.; del Pino, A.P.; Logofatu, C.; Datcu, A.; Amade, R.; Bertran-Serra, E.; György, E. Reduced graphene oxide/iron oxide nanohybrid flexible electrodes grown by laser-based technique for energy storage applications. Ceram. Int. 2018, 44, 20409–20416. [Google Scholar] [CrossRef]
- György, E.; Logofatu, C.; Pérez del Pino, Á.; Datcu, A.; Pascu, O.; Ivan, R. Enhanced UV- and visible-light driven photocatalytic performances and recycling properties of graphene oxide/ZnO hybrid layers. Ceram. Int. 2018, 44, 1826–1835. [Google Scholar] [CrossRef]
- Pérez del Pino, Á.; Martínez Villarroya, A.; Chuquitarqui, A.; Logofatu, C.; Tonti, D.; György, E. Reactive laser synthesis of nitrogen-doped hybrid graphene-based electrodes for energy storage. J. Mater. Chem. A 2018, 6, 16074–16086. [Google Scholar] [CrossRef]
- Fan, H.T.; Xu, X.J.; Ma, X.K.; Zhang, T. Preparation of LaFeO3 nanofibers by electrospinning for gas sensors with fast response and recovery. Nanotechnology 2011, 22, 115502. [Google Scholar] [CrossRef] [PubMed]
- Queraltó, A.; Frohnhoven, R.; Mathur, S.; Gómez, A. Intrinsic piezoelectric characterization of BiFeO3 nanofibers and its implications for energy harvesting. Appl. Surf. Sci. 2019, 509, 144760. [Google Scholar] [CrossRef]
- Scafetta, M.D.; Cordi, A.M.; Rondinelli, J.M.; May, S.J. Band structure and optical transitions in LaFeO3: Theory and experiment. J. Phys. Condens. Matter 2014, 26, 505502. [Google Scholar] [CrossRef] [PubMed]
- Chakrabartty, J.; Nechache, R.; Harnagea, C.; Li, S.; Rosei, F. Enhanced photovoltaic properties in bilayer BiFeO3/Bi-Mn-O thin films. Nanotechnology 2016, 27, 215402. [Google Scholar] [CrossRef] [PubMed]
- Tugova, E.A.; Popova, V.F.; Zvereva, I.A.; Gusarov, V.V. Phase diagram of the LaFeO3-LaSrFeO4 system. Glass Phys. Chem. 2006, 32, 674–676. [Google Scholar] [CrossRef]
- Kallaev, S.N.; Bakmaev, A.G.; Reznichenko, L.A. Thermal diffusion and heat conductivity of BiFeO3 and Bi0.95La0.05FeO3 multiferroics at high temperatures. JETP Lett. 2013, 97, 470–472. [Google Scholar] [CrossRef]
- Železný, V.; Chvostová, D.; Pajasová, L.; Vrejoiu, I.; Alexe, M. Optical properties of epitaxial BiFeO3 thin films. Appl. Phys. A 2010, 100, 1217–1220. [Google Scholar] [CrossRef]
- Sürücü, G.; Erkisi, A. The investigation of electronic and thermo-elastic properties of lanthanum orthoferrite (LaFeO3) perovskite. Balk. Phys. Lett. 2017, 25, 1–19. [Google Scholar]
- Elements, A. Lanthanum Iron Oxide. Available online: https://www.americanelements.com/lanthanum-iron-oxide-12022-43-4 (accessed on 7 December 2019).
- Pérez del Pino, A.; György, E.; Logofatu, C.; Duta, A. Study of the deposition of graphene oxide by matrix-assisted pulsed laser evaporation. J. Phys. D Appl. Phys. 2013, 46, 505309. [Google Scholar] [CrossRef]
- Ren, Y.; Wang, S.; Liu, R.; Dai, J.; Liu, X.; Yu, J. A novel route towards well-dispersed short nanofibers and nanoparticles via electrospinning. RSC Adv. 2016, 6, 30139–30147. [Google Scholar] [CrossRef]
- Yang, X.; Liu, Y.; Li, J.; Zhang, Y. Effects of calcination temperature on morphology and structure of CeO2 nanofibers and their photocatalytic activity. Mater. Lett. 2019, 241, 76–79. [Google Scholar] [CrossRef]
- O’Malley, S.M.; Tomko, J.; Pino, A.P.D.; Logofatu, C.; György, E. Resonant infrared and ultraviolet matrix-assisted pulsed laser evaporation of titanium oxide/graphene oxide composites: A comparative study. J. Phys. Chem. C 2014, 118, 27911–27919. [Google Scholar] [CrossRef]
- Paeng, D.; Lee, D.; Yeo, J.; Yoo, J.-H.; Allen, F.I.; Kim, E.; So, H.; Park, H.K.; Minor, A.M.; Grigoropoulos, C.P. Laser-induced reductive sintering of nickel oxide nanoparticles under ambient conditions. J. Phys. Chem. C 2015, 119, 6363–6372. [Google Scholar] [CrossRef]
- Liu, T.; Kim, D.; Han, H.; Yusoff, A.R.; Jang, J. Fine-tuning optical and electronic properties of graphene oxide for highly efficient perovskite solar cells. Nanoscale 2015, 7, 10708–10718. [Google Scholar] [CrossRef]
- Goto, Y.; Kitamura, T.; Takada, T.; Kachi, S. Phase diagram of the system La2O3-Fe2O3. J. Jpn. Soc. Powder Powder Met. 1960, 7, 227–231. [Google Scholar] [CrossRef][Green Version]
- Calisir, I.; Hall, D.A. Chemical heterogeneity and approaches to its control in BiFeO3–BaTiO3 lead-free ferroelectrics. J. Mater. Chem. C 2018, 6, 134–146. [Google Scholar] [CrossRef]
- Rojac, T.; Bencan, A.; Malic, B.; Tutuncu, G.; Jones, J.L.; Daniels, J.E.; Damjanovic, D.; Green, D.J. BiFeO3 ceramics: Processing, electrical, and electromechanical properties. J. Am. Ceram. Soc. 2014, 97, 1993–2011. [Google Scholar] [CrossRef]
- Selbach, S.M.; Einarsrud, M.-A.; Grande, T. On the thermodynamic stability of BiFeO3. Chem. Mater. 2009, 21, 169–173. [Google Scholar] [CrossRef]
- Brewer, L. Thermodynamic properties of the oxides and their vaporization processes. Chem. Rev. 1953, 52, 1–75. [Google Scholar] [CrossRef]
- Patterson, A.L. The scherrer formula for X-ray particle size determination. Phys. Rev. 1939, 56, 978–982. [Google Scholar] [CrossRef]
- Kotsedi, L.; Furlan, V.; Bharadwaj, V.; Kaviyarasu, K.; Sotillo, B.; Mtshali, C.B.; Matinise, N.; Demir, A.G.; Previtali, B.; Ramponi, R.; et al. Chromium oxide formation on nanosecond and femtosecond laser irradiated thin chromium films. Opt. Mater. 2019, 95, 109206. [Google Scholar] [CrossRef]
- Manonmani, M.; Jaikumar, V.; Gokul Raj, S.; Ramesh Kumar, G. Crystallization, non-isothermal kinetics and structural analysis of nanocrystalline multiferroic bismuth ferrite (BiFeO3) synthesized by combustion method. J. Therm. Anal. Calorim. 2019, 138, 185–193. [Google Scholar] [CrossRef]
- Miller, D.J.; Biesinger, M.C.; McIntyre, N.S. Interactions of CO2 and CO at fractional atmosphere pressures with iron and iron oxide surfaces: One possible mechanism for surface contamination? Surf. Interface Anal. 2002, 33, 299–305. [Google Scholar] [CrossRef]
- Milt, V.G.; Spretz, R.; Ulla, M.A.; Lombardo, E.A.; Fierro, J.L.G. The nature of active sites for the oxidation of methane on La-based perovskites. Catal. Lett. 1996, 42, 57–63. [Google Scholar] [CrossRef]
- Shard, A.G. Detection limits in XPS for more than 6000 binary systems using Al and Mg Kα X-rays. Surf. Interface Anal. 2014, 46, 175–185. [Google Scholar] [CrossRef]
- McIntyre, N.S.; Davidson, R.D.; Mycroft, J.R. Quantitative XPS Measurements of some oxides, sulphides and complex minerals. Surf. Interface Anal. 1996, 24, 591–596. [Google Scholar] [CrossRef]
- Morgan, W.E.; Stec, W.J.; Van Wazer, J.R. Inner-orbital binding-energy shifts of antimony and bismuth compounds. Inorg. Chem. 1973, 12, 953–955. [Google Scholar] [CrossRef]
- Oprea, B.; Radu, T.; Simon, S. XPS investigation of atomic environment changes on surface of B2O3-Bi2O3 glasses. J. Non-Cryst. Solids 2013, 379, 35–39. [Google Scholar] [CrossRef]
- Uchida, K.; Ayame, A. Dynamic XPS measurements on bismuth molybdate surfaces. Surf. Sci. 1996, 357–358, 170–175. [Google Scholar] [CrossRef]
- Dharmadhikari, V.S.; Sainkar, S.R.; Badrinarayan, S.; Goswami, A. Characterisation of thin films of bismuth oxide by X-ray photoelectron spectroscopy. J. Electron Spectrosc. Relat. Phenom. 1982, 25, 181–189. [Google Scholar] [CrossRef]
- Pawlak, D.A.; Woźniak, K.; Frukacz, Z.; Barr, T.L.; Fiorentino, D.; Hardcastle, S. ESCA studies of Yttrium orthoaluminum perovskites. J. Phys. Chem. B 1999, 103, 3332–3336. [Google Scholar] [CrossRef]
- Zhao, H.; Wang, J.; Zhang, L.; Rong, Y.; Chen, J.; Ibrahim, K.; Xing, X. Effects of oxygen vacancy on the electronic structure and multiferroics in sol-gel derived Pb0.8Co0.2TiO3 thin films. Dalton Trans. 2013, 42, 10358–10364. [Google Scholar] [CrossRef] [PubMed]
- Tamilselvan, A.; Balakumar, S.; Sakar, M.; Nayek, C.; Murugavel, P.; Saravana Kumar, K. Role of oxygen vacancy and Fe-O-Fe bond angle in compositional, magnetic, and dielectric relaxation on Eu-substituted BiFeO3 nanoparticles. Dalton Trans. 2014, 43, 5731–5738. [Google Scholar] [CrossRef] [PubMed]
- Wang, X.; Hu, G.; Cheng, L.; Yang, C.; Wu, W. Comparative study on aging effect in BiFeO3 thin films substituted at A- and B-sites. Appl. Phys. Lett. 2011, 99, 262901. [Google Scholar] [CrossRef]
- Takatani, S.; Miki, H.; Kushida-Abdelghafar, K.; Torii, K. Pt/PbZrxTi1−xO3 interfacial reaction and Schottky barrier formation studied by X-ray photoelectron spectroscopy: Effect of H2 and O2 annealing. J. Appl. Phys. 1999, 85, 7784–7791. [Google Scholar] [CrossRef]
- Grosvenor, A.P.; Kobe, B.A.; Biesinger, M.C.; McIntyre, N.S. Investigation of multiplet splitting of Fe 2p XPS spectra and bonding in iron compounds. Surf. Interface Anal. 2004, 36, 1564–1574. [Google Scholar] [CrossRef]
- Zhang, L.; Ghimire, P.; Phuriragpitikhon, J.; Jiang, B.; Goncalves, A.A.S.; Jaroniec, M. Facile formation of metallic bismuth/bismuth oxide heterojunction on porous carbon with enhanced photocatalytic activity. J. Colloid Interface Sci. 2018, 513, 82–91. [Google Scholar] [CrossRef]
- Salavati-Niasari, M.; Hosseinzadeh, G.; Davar, F. Synthesis of lanthanum hydroxide and lanthanum oxide nanoparticles by sonochemical method. J. Alloys Compd. 2011, 509, 4098–4103. [Google Scholar] [CrossRef]
- del Pino, A.P.; González-Campo, A.; Giraldo, S.; Peral, J.; György, E.; Logofatu, C.; deMello, A.J.; Puigmartí-Luis, J. Synthesis of graphene-based photocatalysts for water splitting by laser-induced doping with ionic liquids. Carbon 2018, 130, 48–58. [Google Scholar] [CrossRef]
- Queraltó, A.; Pérez del Pino, Á.; Logofatu, C.; Datcu, A.; Amade, R.; Alshaikh, I.; Bertran, E.; Urzica, I.; György, E. MAPLE synthesis of reduced graphene oxide/silver nanocomposite electrodes: Influence of target composition and gas ambience. J. Alloys Compd. 2017, 726, 1003–1013. [Google Scholar] [CrossRef]
- Zhang, B.; Li, L.; Wang, Z.; Xie, S.; Zhang, Y.; Shen, Y.; Yu, M.; Deng, B.; Huang, Q.; Fan, C.; et al. Radiation induced reduction: An effective and clean route to synthesize functionalized graphene. J. Mater. Chem. 2012, 22, 7775–7781. [Google Scholar] [CrossRef]
- Pei, S.; Zhao, J.; Du, J.; Ren, W.; Cheng, H.-M. Direct reduction of graphene oxide films into highly conductive and flexible graphene films by hydrohalic acids. Carbon 2010, 48, 4466–4474. [Google Scholar] [CrossRef]
- Bagri, A.; Mattevi, C.; Acik, M.; Chabal, Y.J.; Chhowalla, M.; Shenoy, V.B. Structural evolution during the reduction of chemically derived graphene oxide. Nat. Chem. 2010, 2, 581–587. [Google Scholar] [CrossRef] [PubMed]
- Si, Y.; Xia, Y.; Shang, S.; Xiong, X.; Zeng, X.; Zhou, J.; Li, Y. Enhanced visible light driven photocatalytic behavior of BiFeO3/reduced graphene oxide composites. Nanomaterials 2018, 8, 526. [Google Scholar] [CrossRef]
- Kumar, K.V.; Porkodi, K.; Rocha, F. Langmuir–hinshelwood kinetics—A theoretical study. Catal. Commun. 2008, 9, 82–84. [Google Scholar] [CrossRef]
- Baiocchi, C.; Brussino, M.C.; Pramauro, E.; Bianco Prevot, A.; Palmisano, L.; Marci, G. Characterization of methyl orange and its photocatalytic degradation products by HPLC/UV-VIS diode array and atmospheric pressure ionization quadrupole ion trap mass spectrometry. Int. J. Mass Spectrom. 2002, 214, 247–256. [Google Scholar] [CrossRef]
- Cui, Y.; Luan, J. Synthesis, crystal structure, photodegradation kinetics and photocatalytic activity of novel photocatalyst ZnBiYO4. J. Env. Sci. 2015, 29, 51–61. [Google Scholar] [CrossRef]
- Haruna, A.; Abdulkadir, I.; Idris, S.O. Photocatalytic activity and doping effects of BiFeO3 nanoparticles in model organic dyes. Heliyon 2020, 6, e03237. [Google Scholar] [CrossRef]
- Ponraj, C.; Vinitha, G.; Daniel, J. A review on the visible light active BiFeO3 nanostructures as suitable photocatalyst in the degradation of different textile dyes. Environ. Nanotechnol. Monit. Manag. 2017, 7, 110–120. [Google Scholar] [CrossRef]
- Zhou, Y.; Zhang, X.; Zhang, Q.; Dong, F.; Wang, F.; Xiong, Z. Role of graphene on the band structure and interfacial interaction of Bi2WO6/graphene composites with enhanced photocatalytic oxidation of NO. J. Mater. Chem. A 2014, 2, 16623–16631. [Google Scholar] [CrossRef]
- Zhang, Y.; Pan, C. TiO2/graphene composite from thermal reaction of graphene oxide and its photocatalytic activity in visible light. J. Mater. Sci. 2011, 46, 2622–2626. [Google Scholar] [CrossRef]
- Dai, J.F.; Xian, T.; Di, L.J.; Yang, H. Preparation of BiFeO3-graphene nanocomposites and their enhanced photocatalytic activities. J. Nanomater. 2013, 2013, 642897. [Google Scholar] [CrossRef]
© 2020 by the authors. Licensee MDPI, Basel, Switzerland. This article is an open access article distributed under the terms and conditions of the Creative Commons Attribution (CC BY) license (http://creativecommons.org/licenses/by/4.0/).