Article

Band Structure and Physical Properties of α-STF2I3: Dirac Electrons in Disordered Conduction Sheets

1
Graduate School of Science and Engineering, Ehime University, Matsuyama 790-8577, Japan
2
Research Unit for Development of Organic Superconductors, Ehime University, Matsuyama 790-8577, Japan
3
Geodynamics Research Center (GRC), Ehime University, Matsuyama 790-8577, Japan
*
Author to whom correspondence should be addressed.
Crystals 2020, 10(4), 270; https://doi.org/10.3390/cryst10040270
Submission received: 31 January 2020 / Revised: 23 March 2020 / Accepted: 1 April 2020 / Published: 2 April 2020
(This article belongs to the Section Inorganic Crystalline Materials)

Abstract

:
The compound being investigated is an organic charge-transfer complex of the unsymmetrical donor STF with I3 [STF = bis(ethylenedithio)diselenadithiafulvalene], which is isostructural with α-ET2I3 and α-BETS2I3 [ET = bis(ethylenedithio)tetrathiafulvalene, BETS = bis(ethylenedithio)tetraselenafulvalene]. According to recent studies, the calculated band structure should represent a zero-gap semiconductor at 1 bar that is similar to α-ET2I3 under high pressure (>15 kbar). Such materials have attracted extensive interest because the electrons at the Fermi level can be massless Dirac fermions (MDFs), with relativistic behaviors like those seen in graphene. In fact, α-STF2I3 exhibited nearly temperature-independent resistivity, ρ, (~100–300 K), a phenomenon that is widely observed in zero-gap semiconductors. The non-Arrhenius-type increase in ρ (<~100 K) was consistent with the characteristics of interacting MDFs. The paramagnetic susceptibility, χ, (2–300 K)—as well as the reflectivity, R and optical conductivity, σ, (25–300 K; 400–25,000 cm−1)—were also almost temperature independent. Furthermore, σ was practically independent of wavenumber at ~6000–15,000 cm−1. There was no structural transition based on X-ray studies (90–300 K). Considering all the electrical, magnetic, optical and structural properties of α-STF2I3 at 1 bar, it was concluded that the salt possesses a band structure characterized with Dirac cones, which was consistent with the calculation.

1. Introduction

Recently, topological materials have attracted increased research interest in the field of solid-state chemistry and physics [1,2,3]. Various descriptors are used to refer to these materials, such as topological insulators, Dirac fermions (Dirac electrons), Weyl semimetals, Berry phases, time reversal symmetry, non-Abelian anyons and Majorana particles. These materials are considered to contain or connect fundamental problems in nature concerning the states of matter, nuclear physics and mathematics. The traditional topological materials are diverse, such as graphene [4], quasicrystals [5] and the surfaces of particular materials [1], all of which should be of high-quality with well-defined structures and chemical formulae. Among them, bulk samples, crystalline materials in particular, are valuable and advantageous because they facilitate various types of physical measurements, which enable a detailed study of their properties and structures. An advantage is that the materials are readily prepared for most experimental purposes by standard methods of chemical synthesis as single crystals of sufficient dimensions, qualities and quantities that are stable enough to be handled under normal atmospheric conditions. Examples include α-ET2I3 (ET = bis(ethylenedithio)tetrathiafulvalene, also abbreviated as BEDT-TTF (Scheme 1); “α-” denotes one of the polymorphs reported on ET2I3.) [6,7,8,9,10,11,12,13,14,15,16], which is an organic charge-transfer complex with two-dimensional conduction sheets consisting of a self-aggregated donor molecule (D) sublattice (Figure 1a). The α-ET2I3 is now known as a zero-gap semiconductor with Dirac cones under high pressure (>15 kbar) [17,18,19,20,21,22,23,24,25,26,27,28,29,30,31,32]. However, many of the experiments are very challenging or impossible to perform under such high pressures. Therefore, the observation and characterization of Dirac electrons require a sample with Dirac Cones at ambient pressure. In this sense, α-STF2I3 (STF = bis(ethylenedithio)diselenadithiafulvelene, also abbreviated as BEDT-STF [33,34,35,36,37,38]) is the sample of choice, which is an isostructural complex with α-ET2I3 and has been recently suggested to be a zero-gap semiconductor at 1 bar by a band calculation (Figure 2) [37]. The STF, together with BETS (BETS = bis(ethylenedithio)tetraselenafulvelene) [38,39,40,41,42,43], is an electron donor, which is obtained by the partial replacement of sulfur atoms with selenium atoms in ET (Scheme 1). The substitution of chalcogen atoms generally results in two major effects in the physical properties of the STF complexes. First, in addition to the single crystals of STF itself, all of the STF complexes currently known contain disorder at all of the STF sites (Figure 1b). The unit cell parameters of α-STF2I3 are almost identical to those of α-ET2I3. Hence, the α-STF2I3 contains disorder at every STF site due to the asymmetric molecular structure about the central C=C bond, which could influence its electrical and magnetic properties. Second, the intermolecular interactions in the STF sublattice are enhanced based on the closer interatomic overlaps involving Se atoms, which are often termed chemical pressure effects. This effect makes the salt correspond to an approximately higher-pressure state of the isostructural ET salts. Accordingly, α-STF2I3 exhibits qualitatively different physical properties from those of α-ET2I3 under ambient pressure. For example, α-ET2I3 exhibits a metal-insulator (M-I) transition at TM-I originating from charge ordering in the ET sublattice at a pressure (P) less than ~12–15 kbar (TM-I = 135 K at 1 bar). However, α-STF2I3 exhibits a gradual increase in resistivity (ρ) at a temperature (T) lower than Tmin(ρ) ≈ 130 K, without phase transitions [34,35,36,37]. Interestingly, in all the known solids containing STF molecules, the differences in electron densities between S and Se atoms are almost completely averaged out by disorder. As a result, the STF complexes typically behave as though they consist of ET-type symmetrical donor molecules containing imaginary atoms between S and Se. In fact, in α-STF2I3, even diffuse streaks or scatterings have never been observed in the X-ray oscillation photographs. In this way, α-STF2I3 may uniquely provide an overview of or insight into the Dirac electrons in disordered lattices by various physical property measurements under ambient pressure. However, some basic physical properties of α-STF2I3 remain unknown because of limited sample availability and limited research on the salt as a candidate of the zero-gap semiconductors. In order to provide a basis for discussion on this salt, it is important to present various aspects of basic physical properties. In this article, we report electrical, structural, magnetic and optical properties of α-STF2I3.

2. Materials and Methods

2.1. Sample Preparation

Neutral STF molecules were synthesized by following the reported procedure [34,36]. Single crystals of α-STF2I3 were prepared by a galvanostatic (1.4 μA) electrocrystallization of STF (6 mg, 1.25 × 10⁻² mmol) and (n-C4H9)4N·I3 (50.5 mg, 8.10 × 10⁻² mmol) in distilled C6H5Cl (10 mL) at 43 °C under an N2 atmosphere for 2–3 weeks in the dark [34,36]. Prior to the physical measurements, all the single crystals were examined using X-ray oscillation photographs (R-AXIS RAPID-R, Rigaku, Tokyo, Japan) for identifying the lattice parameters and the conduction sheets (the crystallographic ab-planes) in addition to investigating the crystal quality.

2.2. Electrical Resistivity Measurements

Electrical resistivity was measured by a standard four-probe method using gold wires attached with carbon paste to the ab-planes of the single crystals. The morphology varied from crystal to crystal (from thick needles to irregular-shaped plates) and there was no particular relationship between the direction of the a- or b-axes and that of the most developed dimension in the ab-plane (L-axis). The L-axis made an angle of ~0 to ~90° with the a-axis, depending on the crystal. The four gold wires were always aligned along the L-axis. Owing to the highly isotropic nature in the conduction sheets and the error in the estimation of the crystal dimensions, the observed absolute values of resistivity and the temperature dependence agreed with each other semiquantitatively between different measurements. For the estimation of the anisotropy in the conduction plane (the ab-plane), the resistivity was measured along the a- and b-axes independently. The resistivity at 2–300 K was measured using a Physical Property Measurement System PPMS-9 with an EverCool II (Quantum Design Japan, Inc., Tokyo, Japan). Below 10 K, the resistance was too high to measure. Thus, only the data at 10–300 K were shown in the results below. The magnetic field (1 T) was applied below 18 K in zero-field-cooling (ZFC) processes, but no hysteresis or significant magnetoresistance was observed.

2.3. Magnetic Susceptibility Measurements

The magnetic susceptibility was measured using the polycrystalline samples and the DC mode of a SQUID susceptometer (MPMS-XL7minB×R3 with an EverCool, Quantum Design Japan, Inc., Tokyo, Japan). The sample was contained in a gelatin capsule with ventilation holes, which was set in the middle of a polystyrene straw (Quantum Design Japan, Inc.). The magnetic field of 1 T was applied, which was in the linear range between the applied magnetic field and the observed magnetization of the samples. Both FC and ZFC processes were measured at 2–300 K. The diamagnetic contributions from the STF and I3 species were estimated by the same measurements on the neutral STF and (n-C4H9)4NI3 at 300 K. The obtained diamagnetic susceptibilities, χdia, are −1.55 × 10⁻⁴ and −3.61 × 10⁻⁵ emu mol−1G−1 for STF and I3, respectively. The scatterings between observed magnetization for each measurement/compound were less than 10−6 emu (≤50 ppm of the observed signals).

2.4. X-ray Structural Studies

The X-ray single-crystal structural analyses and the measurements of temperature dependence of the lattice constants of α-STF2I3 were performed using a VariMax RAPID/α diffractometer (Cu-Kα radiation; λ = 1.54187 Å) (Rigaku, Tokyo, Japan) and a VariMax SaturnCCD724α diffractometer (Mo-Kα radiation; λ = 0.71075 Å) (Rigaku, Tokyo, Japan), each with a continuous N2-gas-flow type temperature controller. X-ray structural analyses and magnetic susceptibility measurements were repeated several times using the samples prepared from independently synthesized neutral STF and (n-C4H9)4NI3. Sample-dependence was hardly observed in the measurements below.

2.5. Optical Studies

The reflectance spectra were measured on the ab-plane of the single crystal (450–25,000 cm−1, 25–300 K). The optical conductivity spectra were obtained through the Kramers–Kronig transformation of the reflectance spectra. Details are described in our previous paper [35]. In this paper, only the reflectance and conductivity spectra of α-BETS2I3 were presented and those of α-STF2I3 were not, because they were nearly identical to those of α-BETS2I3 and were not required in the discussion then. However, as the actual spectra are indispensable in the discussion of this paper, they are present here with permission of the authors then.

2.6. Calculation of the Density of States

The density of states at the Fermi level of α-STF2I3 was estimated using the crystal structures of α-ET2I3 and α-BETS2I3 by assuming the identical atomic parameters with α-STF2I3, where extended Hückel tight-binding calculation was performed using Caesar vers.1 and 2 (PrimeColor Software, Inc., Raleigh, NC, USA) [44].

3. Results

3.1. Electrical Behavior

The observed electrical behavior (Figure 3a–c) quantitatively reproduced the previously reported temperature dependence of electrical resistivity [34,35,36,37]. The resistivity (25–40 mΩcm at 300 K) is higher than the bulk resistivity corresponding to the quantum sheet resistance (4.5 mΩcm in this case) by nearly an order of magnitude. This is consistent with the interpretation that the observed low temperature resistivity behavior is suggestive of a strong correlation between Dirac electrons (see below), as electron correlation deviates the resistivity from the quantum sheet resistance [22,23,24,28]. The resistivity slightly decreased but was almost temperature independent at 300–Tmin(ρ) ~130 K and gradually increased at lower temperature (~1000 Ωcm at 10 K). At ~100–300 K the temperature dependence was continuous and monotonic (Figure A1a,b). In addition, since the temperature dependence of lattice constants at 90–300 K—a/Å, b/Å, c/Å, α/°, β/°, γ/° and V3 (Figure 4a,b)—and that of magnetic susceptibility at 2–300 K (see below) exhibited no sudden change or hysteresis, there should be no first-order phase transitions in α-STF2I3. The anisotropy of the conductivity in the ab-plane (the ratio between the conductivities along the respective crystallographic axes) σb/σa is almost constant (3.3–3.9) at ~80–300 K. This is in agreement with our previous estimation by calculation (σb/σa ≈ 5) [37]. However, below ~80 K, the conductivities along both crystallographic axes decrease rapidly and cannot be reliably detected. As such, the σb/σa ratio is unreliable for use in quantitative assessment. The increase in resistivity at low temperature is neither of Arrhenius type (Figure 3c) nor logarithmic form (Figure 3a). For α-ET2I3, the temperature dependence of resistivity below Tmin(ρ) (~10 K) at 18 kbar resembles the power-law or logarithmic form [22,24,28] with some sample-dependence [6,24,28,32]. Some of the samples exhibited closely related behavior to that of α-STF2I3. The insulating behavior toward the ground state originates from strong electron correlation between the Dirac fermions in α-ET2I3 [22,23,24,28]. Since such correlation originates from the band structure (Dirac cones), which is independent of disorder, the low-temperature resistivity upturn in α-STF2I3 can also originate from strong correlation.

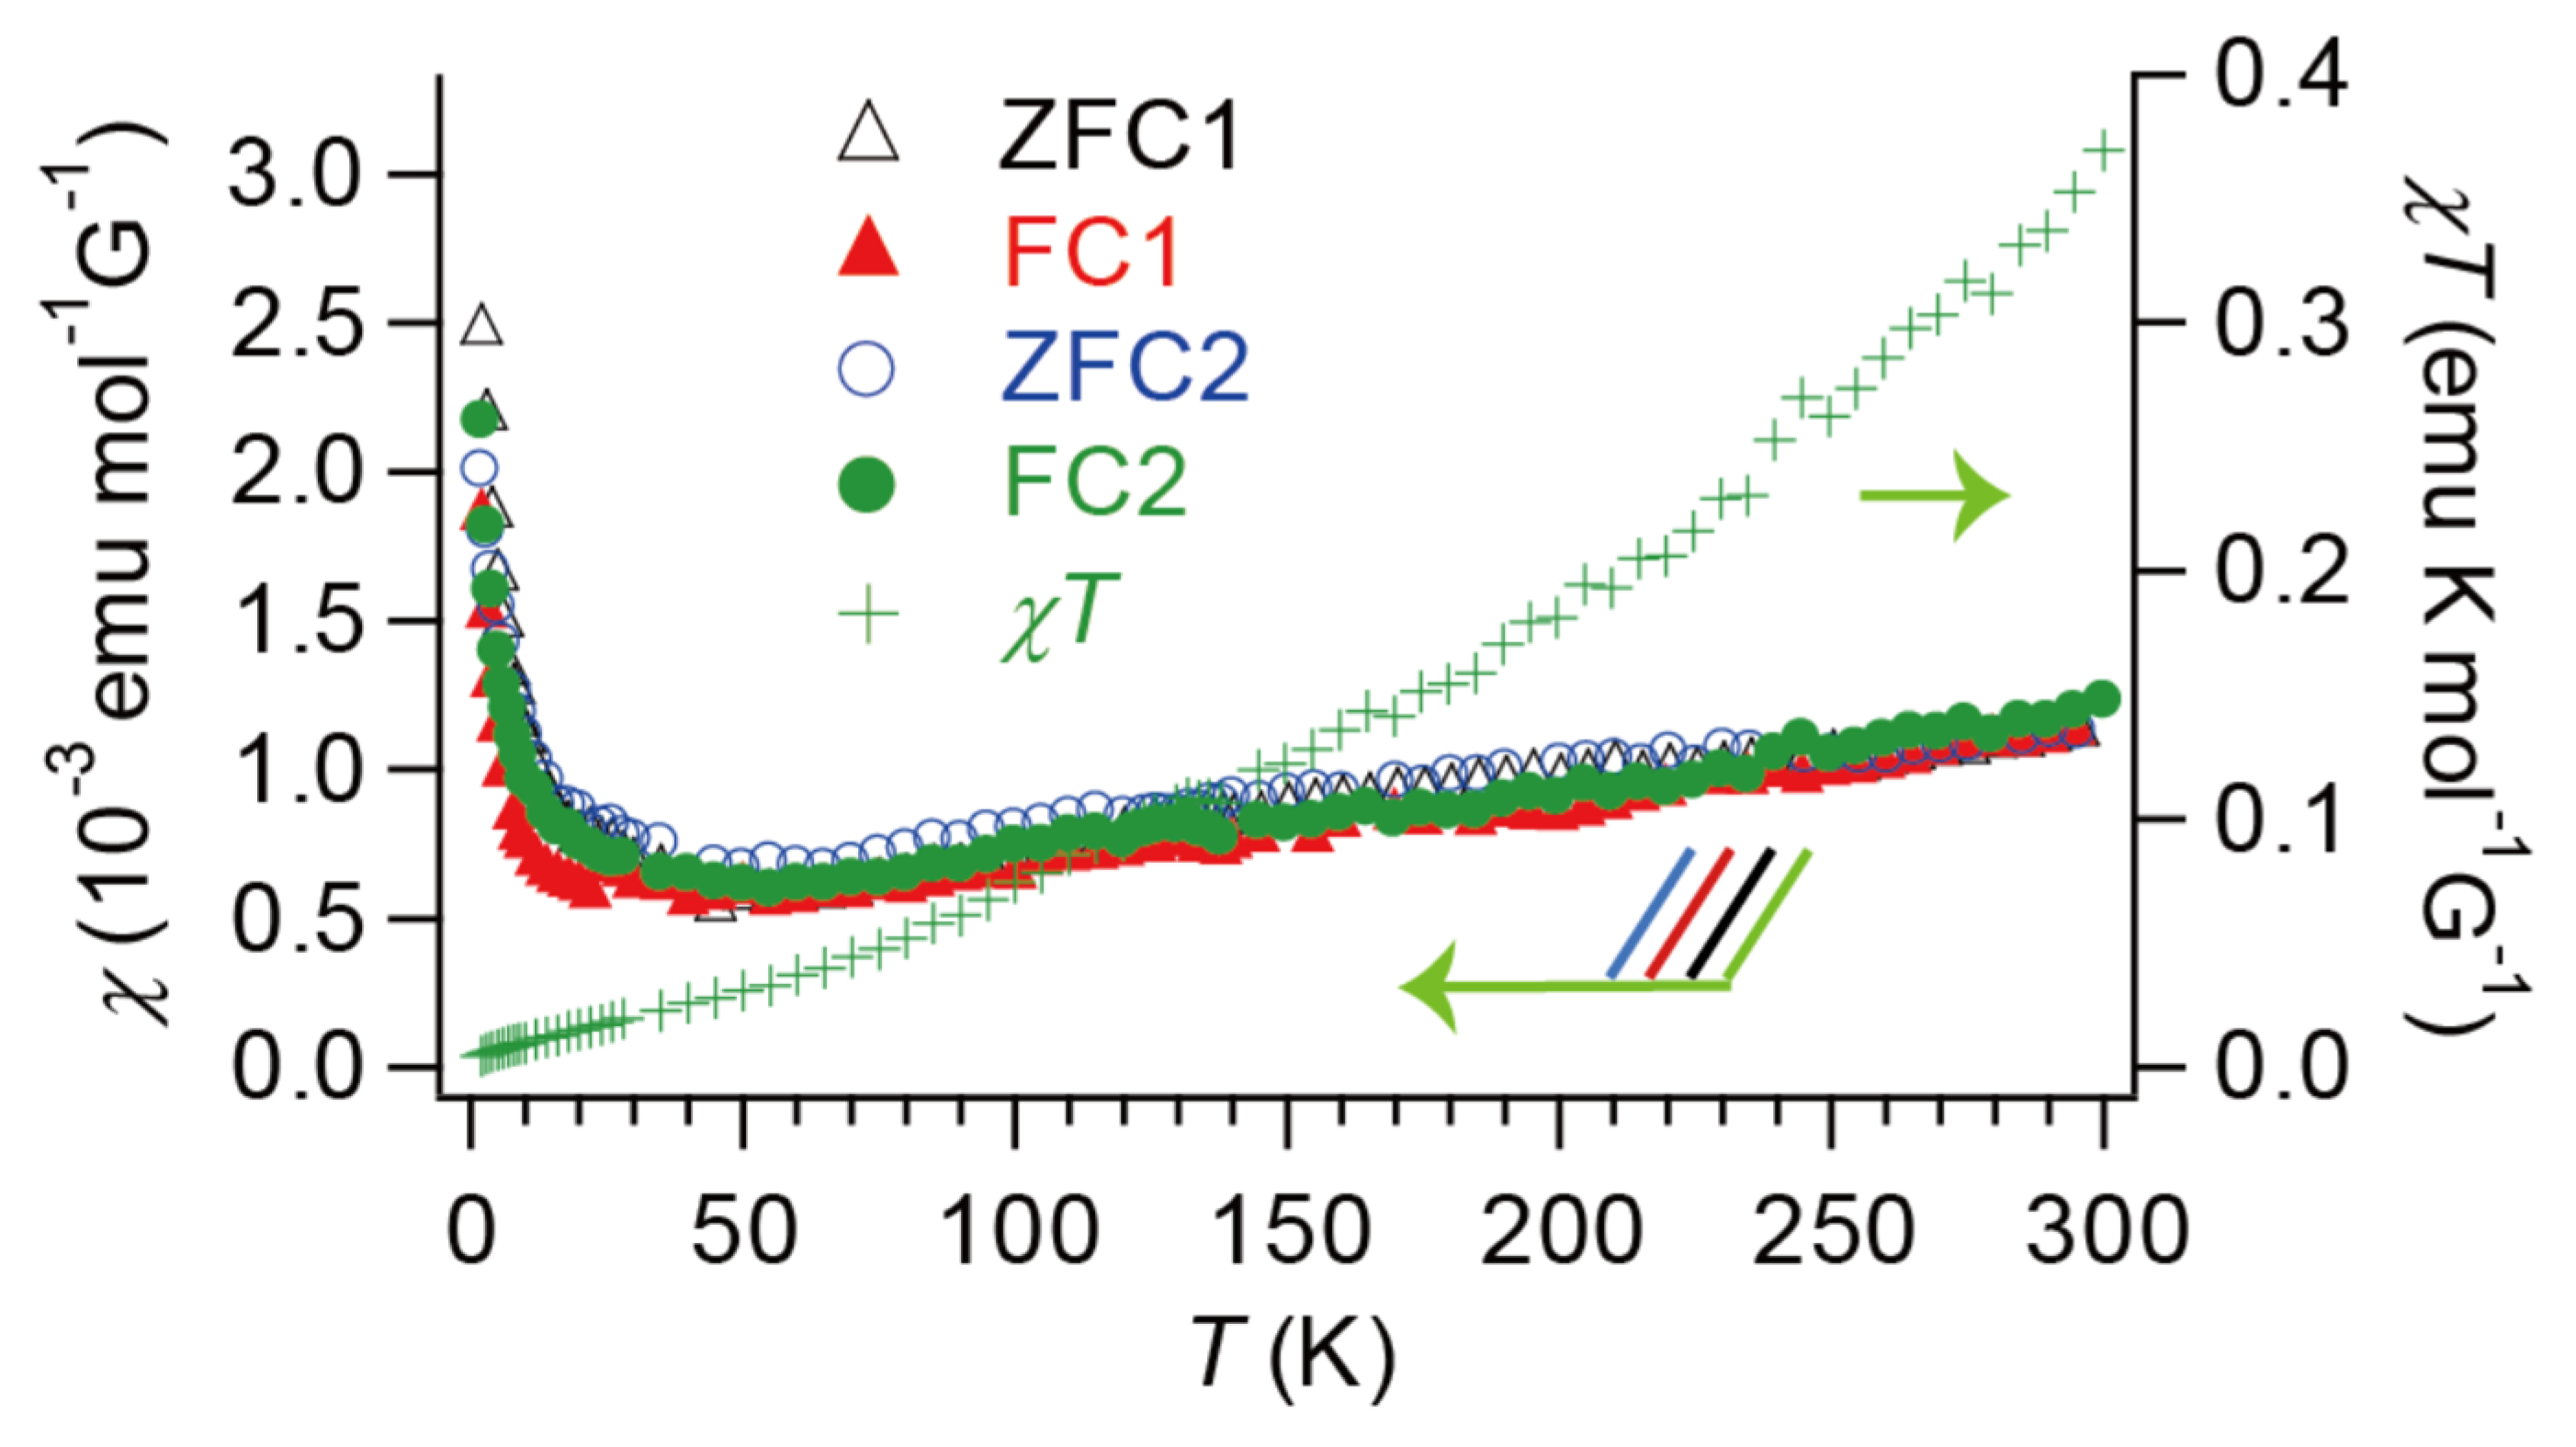
3.2. Magnetic Behavior

The temperature dependence of molar magnetic susceptibility of α-STF2I3, χ, at 2–300 K is shown in Figure 5a,b. Both FC and ZFC processes produced identical results, which is also the case between independent samples/measurements (Figure A2). The good linearity between χT and T at 2–300 K indicates that χ is almost temperature independent, like the Pauli paramagnetism of metallic substances. At a closer examination, χ slightly decreased from 300 K to T0(χ) ~120–130 K, and then more steeply decreased down to Tmin(χ) ~40–50 K, where it gradually began to increase down to 2 K. The increase in χ at T ≤ 40 K is proportional to T−0.2. If the increase originates from the lattice defects in the sample such as impurities and the disorder between Se and S at the STF sites, T−1-dependence, i.e., the Curie law is expected. On the other hand, there are a number of papers on disordered systems such as Si:P [45] and FeSi1−xAlx [46] reporting their Tα-dependences (0 < α < 1) of magnetic susceptibilities near the ground states. In order to clarify whether the increase in χ with the Tα-dependence (0 < α < 1) at T ≤ 40 K originates from disorder, the same measurement on α-BETS2I3 is necessary, which we are currently investigating.
Now, we tentatively apply the relationship in the Fermi liquids between the Pauli paramagnetism, χPauli and the density of states at the Fermi level N(EF),
χ Pauli = μ B 2 N ( E F )
where, μB is the Bohr magneton. Our tight-binding calculation, where we assumed that α-ET2I3 and α-BETS2I3 should have the same atomic parameters with those of α-STF2I3, suggested that N(EF) = 8.06–8.64 (eV−1). Thus, χPauli = (4.67–5.00) × 10−4 emu mol−1G−1, which is significantly smaller than the observed values at TTmin(χ) (~40 K) by a factor of ~3. By considering the low-temperature increase in the resistivity, the magnetic susceptibility can be consistently interpreted that the massless Dirac fermions (MDFs) in α-STF2I3 should have significant interaction with each other [22,23,24,28].

3.3. Optical Behavior

The reflectance and conductivity spectra of α-STF2I3 are shown in Figure 6a,b and Figure 7a,b, respectively [35]. General features of the reflectance spectra are closely related to those of usual two-dimensional molecular metals with Drude dispersions [47]. However, the spectral features can be explained by the coexistence of massive and massless fermions [19]. Such coexistence is theoretically predicted [7] and is actually observed in α-ET2I3 under high pressure [27]. The following analysis corroborates the coexistence of the two kinds of fermions in α-STF2I3. The plasma frequencies of the Drude dispersions along the a- and b-axes, ωp,a and ωp,b, were determined from the optical conductivity spectra at 300 K as 0.59 and 0.99 eV, respectively [35]. This gives anisotropy in conductivity as σ b σ a = ( ω p , b ω p , b ) 2 2.8 , which agrees with the directly measured values of 3.3–3.9 shown in Figure 3d. Based on ωp,a and ωp,b, the effective mass along the a- and b-axes, (m*opt)a and (m*opt)b, are estimated as 4.60 m and 1.64 m, respectively, where m designates the electron rest mass. The larger effective mass generally means stronger correlation in the electronic system and leads to enhanced magnetic susceptibility. Since the Dirac electrons do not give a Drude dispersion [5], it originates from the semimetallic (massive) carriers. Accordingly, the effective masses are those of massive carriers and they are too small to account for the observed magnetic susceptibility. Therefore, the strong correlation originates from the interacting MDFs instead of the semimetallic carriers.
The overall features of the spectra and the temperature dependence clearly indicate that α-STF2I3 remains a metal-like highly conducting material without band gaps, exhibiting no phase transitions at 25–300 K. This apparently contradicts with the insulating resistivity behavior at T < ~130 K, which is, again, consistent with each other by assuming the coexistence of massless and massive carriers in α-STF2I3. The electrical properties at low temperatures are dominated by the massless carriers (interacting MDFs) [22,23,24,28], whereas the Drude dispersion originates from the (semimetallic) massive carriers as stated above. The most striking feature shared by reflectance and conductivity spectra is their negligible temperature dependence in a wide temperature range (25–300 K), which is shared by many Dirac electron systems [7,27,48] and is similar to those of α-BETS2I3 [35]. Although the reflectance spectra (Figure 6a,b) appear to be common for two-dimensional molecular metals, the optical conductivity spectra (Figure 7a–c) exhibit constant conductivity versus a wide range of wavenumbers (see below). Again, either of the constant values (~18 and ~30 Scm−1 for E // a- and E // b-axes, respectively) is extremely different from the corresponding value of the quantum sheet conductance [(4.5 mΩcm)−1 ≈ 220 Scm−1 in this case]. The reflectance and conductivity spectra are almost quantitatively identical with each other between α-STF2I3 and α-BETS2I3 at respective temperatures. The latter (α-BETS2I3) is also considered to be a zero-gap semiconductor based on NMR measurements [38], theoretical studies [39], X-ray structural analyses with band calculation [40] and magnetotransport properties [41]. Similar temperature-independent features of the reflectivity and optical conductivity are observed in Cd3As2, which belongs to the three-dimensional Dirac electron systems [49].
Generally, the interband optical response of d-dimensional Dirac electrons is supposed to be universal [49,50,51]: the optical conductivity σ(ω) should follow a power-law frequency (ω) dependence,
σ ( ω ) ω d 2 z ,
where, σ(ω) is the real part of the optical conductivity and z is the exponent in the band dispersion relation,
E ( k ) | k | z
In the case of α-STF2I3, d ≈ 2. Accordingly, Equation (2) indicates that σ(ω) should be independent of ω, irrespective of z. In fact, the obtained values of σ(ω) along both polarization directions are approximately ω-independent at ω ≈ 6000–15,000 cm−1; σ(ω)/Scm−1 ≈ 18 and 30 (independent of temperature) along the a- and b-axes, respectively (Figure 7b,c). The ω-independent range is possibly masked in part by the intense peak centered at 22,000–23,000 cm−1 assigned to the local excitation of the I3 anions, which hides the spectral features originating from the Dirac electrons.

4. Discussion

The optical results conclusively support that α-STF2I3 contains both massless and massive electron systems. All the rationalization on the resistivity and magnetic susceptibility data are established based on the conclusions of the optical results. Furthermore, considering the temperature dependencies of electrical, magnetic and structural properties, it is concluded that the band structure with Dirac cones remains in the ground state. In fact, including the T−α-temperature dependence (0 < α < 1) of the resistivity below Tmin, the observed electrical property is consistent with the typical behavior of interacting MDFs. The T−α-temperature dependence (0 < α < 1) at low temperatures is also demonstrated by the magnetic behavior. These findings will aid in various successive experimental results at lower temperatures with smaller energy scales, as well as advancement in related theories. For the Dirac electron systems, the STF salt reveals similarities with the ET salt in the following points. (i) Anisotropic Dirac cone dispersion with accidental degeneracy at low symmetry, i.e., general k-points in the a*b*-plane. (ii) Almost identical lattice parameters with each other. (iii) The Fermi energy is located exactly on the Dirac point due to the 3/4-filled band. (iv) Electron correlation plays an important role in the physical properties.
In conclusion, all the experimental results consistently indicate the existence of the Dirac electrons in α-STF2I3, being consistent with the recent band calculation [37].
Finally, the Dirac electron systems of the α-STF2I3 are qualitatively different from those of α-ET2I3 in the following points. (i) The ET salt possesses substantially tilted the Dirac cones, whereas the STF salt possesses the almost vertical Dirac cones. The difference in the orientation of the Dirac cones will manifest influence on the magnetotransport properties and the orbital diamagnetism [31]. (ii) The ET salt is a clean system based on the well-defined crystal structure, whereas the STF salt is not based on such a system since it contains heavy disorder in the conduction sheets. The disorder of the STF salt could not be lowered to the ground state; thus, it would be interesting to investigate how the Dirac electron system in the salt would respond when cooled to 0 K. Since every perfect crystalline solid should have zero entropy—and since the STF salt could not be a perfect crystalline solid—it would be intriguing to see how the system reconciles itself with the third law of thermodynamics when T → 0. (iii) The phase transition is observed in the ET salt under low pressure. Accordingly, the band structure and the strength of electron correlation vary near the phase boundary [19,24,25]. In α-STF2I3, the aforementioned parameters are practically constant, without a phase transition. Therefore α-STF2I3 is anticipated to provide different aspects of the Dirac electron systems from those of α-ET2I3 or other related materials.

Author Contributions

Design of the study, supervision and project administration, T.N.; methodology, software and resources, T.N.; sample preparation, R.D. and T.N.; electrical resistivity measurements and analysis, R.D. and T.N.; magnetic susceptibility measurements and analysis, R.D. and T.N.; interpretation of optical spectra, T.N.; writing—original draft preparation, T.N.; writing—review and editing, T.N. and R.D.; funding acquisition, T.N. All authors have read and agreed to the published version of the manuscript.

Funding

This work was partially supported by the Grant-in-Aid for Challenging Exploratory Research (18K19061) of JSPS, Ehime University GP, the Tokyo Chemical Industry Foundation, the Tokyo Ohka Foundation for the Promotion of Science and Technology, the Kato Foundation for Promotion of Science and an Ehime University Grant for Interdisciplinary Research.

Acknowledgments

The authors thank H. Kamada and R. Konishi (Ehime University) for the elemental and mass-spectral analyses of the samples in this work, respectively. The assistance of S. Mori and R. Konishi (Ehime University) during X-ray structural analyses is acknowledged. The authors thank K. Konishi (Ehime University) for access to the PPMS (Quantum Design PPMS-9) and the SQUID (Quantum Design MPMS-XL7minB×R3) systems. R.D. is grateful to T. Yamamoto (Ehime University), who let him use his own sample package for PPMS in the resistivity measurements in addition to the incubator during the electrocrystallization. T.N. thanks N. Tajima for the measurement of the anisotropy of the conductivity.

Conflicts of Interest

The authors declare no conflict of interest. The funders had no role in the design of the study; in the collection, analyses or interpretation of data; in the writing of the manuscript or in the decision to publish the results.

Appendix A

Figure A1. Temperature dependence of electrical resistivity of α-STF2I3. The samples in Figure A1a,b are different from those in Figure 3a,b: (a) Enlarged view (~80–300 K). Red; heating-process data, blue; cooling-process data. (Inset) A different plot of the same data for comparison with Figure 3b. Since there are deviations in the data during the measurement, Tmin(ρ) is determined based on the first derivative of resistivity by temperature; (b) First derivative of resistivity by temperature; enlarged view (~80–300 K).
Crystals 10 00270 g0a1
Figure A2. Reproducibility, sample- and/or measurement-dependences of temperature-dependent molar magnetic susceptibility of α-STF2I3. ZFC1/FC1 and ZFC2/FC2 denote independent sets of obtained results using the polycrystalline α-STF2I3 of different batches containing independently synthesized neutral STF and (n-C4H9)4NI3 (ZFC = Zero-field cooling process, FC = Field cooling process). The χT curve in Figure A2 is based on ZFC2/FC2 data, while that in Figure 5 is based on ZFC1/FC1 data.
Crystals 10 00270 g0a2

References

  1. Huang, C.; Li, Y.; Wang, N.; Xue, Y.; Zuo, Z.; Liu, H.; Li, Y. Progress in research into 2D graphdiyne-based materials. Chem. Rev. 2018, 118, 7744–7803. [Google Scholar] [CrossRef] [PubMed]
  2. Molle, A.; Grazianetti, C.; Tao, L.; Taneja, D.; Alam, M.H.; Akinwande, D. Silicene, silicene derivatives, and their device applications. Chem. Soc. Rev. 2018, 47, 6370–6387. [Google Scholar] [CrossRef]
  3. Zheng, H.; Hasan, M.Z. Quasiparticle interference on type-i and type-ii weyl semimetal surfaces: A review. Adv. Phys. X 2018, 3, 1466661. [Google Scholar] [CrossRef]
  4. Castro Neto, A.H.; Guinea, F.; Peres, N.M.R.; Novoselov, K.S.; Geim, A.K. The electronic properties of graphene. Rev. Mod. Phys. 2009, 81, 109–162. [Google Scholar] [CrossRef] [Green Version]
  5. Timusk, T.; Carbotte, J.P.; Homes, C.C.; Bosov, D.N.; Sharapov, S.G. Three-dimensional Dirac fermions in quasicrystals seen via optical conductivity. Phys. Rev. B 2013, 87, 235121. [Google Scholar] [CrossRef] [Green Version]
  6. Uji, S.; Kodama, K.; Sugii, K.; Takahide, Y.; Terashima, T.; Kurita, N.; Tsuchiya, S.; Kohno, M.; Kimata, M.; Yamamoto, K.; et al. Kosterlitz-Thouless-type transition in a charge ordered state of the layered organic conductor α-(BEDT-TTF)2I3. Phys. Rev. Lett. 2013, 110, 196602. [Google Scholar] [CrossRef]
  7. Alemany, P.; Pouget, J.-P.; Canadell, E. Essential role of anions in the charge ordering transition of α-(BEDT-TTF)2I3. Phys. Rev. B 2012, 85, 195118. [Google Scholar] [CrossRef]
  8. Takano, Y.; Hiraki, K.; Takada, Y.; Yamamoto, H.M.; Takahashi, T. Local spin susceptibility characteristic of zero-gap state of α-(BEDT-TTF)2I3 under pressure. J. Phys. Soc. Jpn. 2010, 79, 104704. [Google Scholar] [CrossRef]
  9. Katayama, S.; Kobayashi, A.; Suzumura, Y. Pressure-induced zero-gap semiconducting state in organic conductor α-(BEDT-TTF)2I3 salt. J. Phys. Soc. Jpn. 2006, 75, 054705. [Google Scholar] [CrossRef] [Green Version]
  10. Katayama, S.; Kobayashi, A.; Suzumura, Y. Electric conductivity of the zero-gap semiconducting state in α-(BEDT-TTF)2I3 salt. J. Phys. Soc. Jpn. 2006, 75, 023708. [Google Scholar] [CrossRef] [Green Version]
  11. Kino, H.; Miyazaki, T. First-principles study of electronic structure in α-(BEDT-TTF)2I3 at ambient pressure and with uniaxial strain. J. Phys. Soc. Jpn. 2006, 75, 034704. [Google Scholar] [CrossRef] [Green Version]
  12. Tajima, N.; Sugawara, S.; Tamura, M.; Nishio, Y.; Kajita, K. Electronic phases in an organic conductor α-(BEDT-TTF)2I3: Ultra narrow gap semiconductor, superconductor, metal, and charge-ordered insulator. J. Phys. Soc. Jpn. 2006, 75, 051010. [Google Scholar] [CrossRef] [Green Version]
  13. Kobayashi, A.; Katayama, S.; Noguchi, K.; Suzumura, Y. Superconductivity in charge ordered organic conductor -α-(ET)2I3 salt-. J. Phys. Soc. Jpn. 2004, 73, 3135–3148. [Google Scholar] [CrossRef]
  14. Tajima, N.; Tamura, M.; Nishio, Y.; Kajita, K.; Iye, Y. Transport property of an organic conductor α-(BEDT-TTF) 2I 3 under high pressure—Discovery of a novel type of conductor -. J. Phys. Soc. Jpn. 2000, 69, 543–551. [Google Scholar] [CrossRef]
  15. Kajita, K.; Ojiro, T.; Fujii, H.; Nishio, Y.; Kobayashi, H.; Kobayashi, A.; Kato, R. Magnetotransport Phenomena of α-Type (BEDT-TTF) 2I 3 under high pressures. J. Phys. Soc. Jpn. 1992, 61, 23–26. [Google Scholar] [CrossRef]
  16. Bender, K.; Hennig, I.; Schweitzer, D.; Dietz, K.; Endres, H.; Keller, H.J. Synthesis, structure and physical properties of a two-dimensional organic metal, di[bis(ethylenedithiolo)tetrathiofulvalene]triiodide, (BEDT-TTF)2+I3-. Mol. Cryst. Liq. Cryst. 1984, 108, 359–371. [Google Scholar] [CrossRef] [Green Version]
  17. Mandal, I.; Saha, K. Thermopower in an anisotropic two-dimensional Weyl semimetal. Phys. Rev. B 2020, 101, 045101. [Google Scholar] [CrossRef] [Green Version]
  18. Tani, T.; Tajima, N.; Kobayashi, A. Field-angle dependence of interlayer magnetoresistance in organic Dirac electron system α-(BEDT-TTF)2I3. Crystals 2019, 9, 212. [Google Scholar] [CrossRef] [Green Version]
  19. Li, W.; Uykur, E.; Kuntscher, C.A.; Dressel, M. Optical signatures of energy gap in correlated Dirac fermions. npj Quantum Mater. 2019, 4, 19. [Google Scholar]
  20. Suzumura, Y. Effect of long-range coulomb interaction on NMR shift in massless Dirac electrons of organic conductor. J. Phys. Soc. Jpn. 2018, 87, 024705. [Google Scholar] [CrossRef]
  21. Tajima, N. Effects of carrier doping on the transport in the Dirac electron system α-(BEDT-TTF)2I3 under high pressure. Crystals 2018, 8, 126. [Google Scholar] [CrossRef] [Green Version]
  22. Hirata, M.; Ishikawa, K.; Matsuno, G.; Kobayashi, A.; Miyagawa, K.; Tamura, M.; Berthier, C.; Kanoda, K. Anomalous spin correlations and excitonic instability of interacting 2D Weyl fermions. Science 2017, 358, 1403–1406. [Google Scholar] [CrossRef] [Green Version]
  23. Hirata, M.; Ishikawa, K.; Miyagawa, K.; Tamura, M.; Berthier, C.; Basko, D.; Kobayashi, A.; Matsuno, G.; Kanoda, K. Observation of an anisotropic Dirac cone reshaping and ferrimagnetic spin polarization in an organic conductor. Nat. Commun. 2016, 7, 1–14. [Google Scholar] [CrossRef] [PubMed] [Green Version]
  24. Liu, D.; Ishikawa, K.; Takehara, R.; Miyagawa, K.; Tamura, M.; Kanoda, K. Insulating nature of strongly correlated massless dirac fermions in an organic crystal. Phys. Rev. Lett. 2016, 116, 226401. [Google Scholar] [CrossRef] [PubMed] [Green Version]
  25. Beyer, R.; Dengl, A.; Peterseim, T.; Wackerow, S.; Ivek, T.; Pronin, A.V.; Schweitzer, D.; Dressel, M. Pressure-dependent optical investigations of α−(BEDT-TTF)2I3: Tuning charge order and narrow gap towards a Dirac semimetal. Phys. Rev. B 2016, 93, 195116. [Google Scholar] [CrossRef] [Green Version]
  26. Kajita, K.; Nishio, Y.; Tajima, N.; Suzumura, Y.; Kobayashi, A. Molecular dirac fermion systems—Theoretical and experimental approaches. J. Phys. Soc. Jpn. 2014, 83, 072002. [Google Scholar] [CrossRef]
  27. Monteverde, M.; Goerbig, M.O.; Auban-Senzier, P.; Navarin, F.; Henck, H.; Pasquier, C.R.; Mézière, C.; Batail, P. Coexistence of Dirac and massive carriers in α-(BEDT-TTF)2I3 under hydrostatic pressure. Phys. Rev. B 2013, 87, 245110. [Google Scholar] [CrossRef] [Green Version]
  28. Tajima, N.; Kato, R.; Sugawara, S.; Nishio, Y.; Kajita, K. Interband effects of magnetic field on Hall conductivity in the multilayered massless Dirac fermion system α-(BEDT-TTF)2I3. Phys. Rev. B 2012, 85, 033401. [Google Scholar] [CrossRef] [Green Version]
  29. Suzumura, Y.; Kobayashi, A. Theory of Dirac electrons in organic conductors. Crystals 2012, 2, 266–283. [Google Scholar] [CrossRef] [Green Version]
  30. Montambaux, G.; Piéchon, F.; Fuchs, J.-N.; Goerbig, M.O. Merging of Dirac points in a two-dimensional crystal. Phys. Rev. B 2009, 80, 153412. [Google Scholar] [CrossRef]
  31. Kobayashi, A.; Suzumura, Y.; Fukuyama, H. Hall effect and orbital diamagnetism in zerogap state of molecular conductor α-(BEDT-TTF)2I3. J. Phys. Soc. Jpn. 2008, 77, 064718. [Google Scholar] [CrossRef]
  32. Tajima, N.; Sugawara, S.; Tamura, M.; Kato, R.; Nishio, Y.; Kajita, K. Transport properties of massless Dirac Fermions in an organic conductor α-(BEDT-TTF)2I3 under pressure. EPL 2007, 80, 47002. [Google Scholar] [CrossRef]
  33. Naito, T.; Miyamoto, A.; Kobayashi, H.; Kato, R.; Kobayashi, A. Superconducting transition temperature of the organic alloy system: α-[(BEDT-TTF)1−x(BEDT-STF)x]2Cu[N(CN)2]Br. Chem. Lett. 1992, 21, 119–122. [Google Scholar] [CrossRef]
  34. Naito, T. Study on Synthesis and Characterization of New Synthetic Metals and Superconductors Based on Planar α-Conjugated Molecules. Ph.D. Thesis, Graduate School of Science, The University of Tokyo, Tokyo, Japan, 1995. [Google Scholar]
  35. Inokuchi, M.; Tajima, H.; Kobayashi, A.; Ohta, T.; Kuroda, H.; Kato, R.; Naito, T.; Kobayashi, H. Electrical and optical properties of α-(BETS)2I3 and α-(BEDT-STF)2I3. Bull. Chem. Soc. Jpn. 1995, 68, 547–553. [Google Scholar] [CrossRef]
  36. Naito, T.; Kobayashi, H.; Kobayashi, A. The Electrical Behavior of Charge-Transfer Salts Based on an Unsymmetrical Donor Bis(ethylenedithio)diselenadithiafulvalene (STF): Disorder Effect on the Transport Properties. Bull. Chem. Soc. Jpn. 1997, 70, 107–114. [Google Scholar] [CrossRef]
  37. Naito, T.; Doi, R.; Suzumura, Y. Exotic dirac cones on the band structure of α-STF2I3 at ambient temperature and pressure. J. Phys. Soc. Jpn. 2020, 89, 023701. [Google Scholar]
  38. Hiraki, K.; Harada, S.; Arai, K.; Takano, Y.; Takahashi, T.; Tajima, N.; Kato, R.; Naito, T. Local spin susceptibility of α-D2I3 (D = bis(ethylenedithio)tetraselenafulvalene (BETS) and bis(ethylenedithio)dithiadiselenafulvalene (BEDT-STF)) studied by 77Se NMR. J. Phys. Soc. Jpn. 2011, 80, 014715. [Google Scholar] [CrossRef]
  39. Morinari, T.; Suzumura, Y. On the possible zero-gap state in organic conductor α-(BEDT-TSF)2I3 under pressure. J. Phys. Soc. Jpn. 2014, 83, 094701. [Google Scholar] [CrossRef]
  40. Kondo, K.; Kagoshima, S.; Tajima, N.; Kato, R. Crystal and electronic structures of the quasi-two-dimensional organic conductor α-(BEDT-TTF)2I3 and its selenium analogue α-(BEDT-TSeF)2I3 under hydrostatic pressure at room temperature. J. Phys. Soc. Jpn. 2009, 78, 114714. [Google Scholar] [CrossRef] [Green Version]
  41. Kajita, K.; Tajima, N.; Ebina-Tajima, A.; Nishio, Y. Organic semiconductors with extremely narrow energy gap. Synth. Met. 2003, 133–134, 95–97. [Google Scholar] [CrossRef]
  42. Montgomery, L.K.; Burgin, T.; Huffman, J.C.; Carlson, K.D.; Dudek, J.D.; Yaconi, G.A.; Megna, L.A.; Mobley, P.R.; Kwok, W.K.; Williams, J.M.; et al. The synthesis and characterization of radical cation salts of bis(ethylenedithio)tetraselenafulvalene. Synth. Met. 1993, 56, 2090–2095. [Google Scholar] [CrossRef]
  43. Kato, R.; Kobayashi, H.; Kobayashi, A. Synthesis and properties of bis(ethylenedithio)tetraselenafulvalene (BEDT-TSeF) compounds. Synth. Met. 1991, 42, 2093–2096. [Google Scholar] [CrossRef]
  44. Ren, J.; Liang, W.; Whangbo, M.-H. Crystal and Electronic Structure Analysis Using CAESAR; PrimeColor Software, Inc.: Raleigh, NC, USA, 1998. [Google Scholar]
  45. Sarachik, M.P.; Roy, A.; Turner, M.; Levy, M.; He, D.; Isaacs, L.L.; Bhatt, R.N. Scaling behavior of the magnetization of insulating Si:P. Phys. Rev. B 1986, 34, 387–390. [Google Scholar] [CrossRef] [PubMed]
  46. DiTusa, J.F.; Friemelt, K.; Bucher, E.; Aeppli, G.; Ramirez, A.P. Heavy fermion metal-Kondo insulator transition in FeSi1-xAlx. Phys. Rev. B 1998, 58, 10288–10301. [Google Scholar] [CrossRef]
  47. Dressel, M.; Drichko, N. Optical properties of two-dimensional organic conductors: Signatures of charge ordering and correlation effects. Chem. Rev. 2004, 104, 5689–5715. [Google Scholar] [CrossRef] [PubMed]
  48. Neubauer, D.; Yaresko, A.; Li, W.; Löhle, A.; Hübner, R.; Schilling, M.B.; Shekhar, C.; Felser, C.; Dressel, M.; Pronin, A.V. Optical conductivity of the Wyle semimetal NbP. Phys. Rev. B 2018, 98, 195203. [Google Scholar] [CrossRef] [Green Version]
  49. Neubauer, D.; Carbotte, J.P.; Nateprov, A.A.; Löhle, A.; Dressel, M.; Pronin, A.V. Interband optical conductivity of the [1]-oriented Dirac semimetal Cd3As2. Phys. Rev. B 2016, 93, 121202. [Google Scholar] [CrossRef] [Green Version]
  50. Hosur, P.; Parameswaran, S.A.; Vishwanash, A. Charge transport in Weyl semimetals. Phys. Rev. Lett. 2012, 108, 046602. [Google Scholar] [CrossRef] [Green Version]
  51. Bácsi, Á.; Virosztek, A. Low-frequency optical conductivity in graphene and in other scale-invariant two-band systems. Phys. Rev. B 2013, 87, 125425. [Google Scholar] [CrossRef] [Green Version]
Scheme 1. Chemical structures of donor molecule D in α-D2I3: (a) bis(ethylenedithio)tetrathiafulvalene (ET or BEDT-TTF); (b) bis(ethylenedithio)diselenadithiafulvalene (STF or BEDT-STF); (c) bis(ethylenedithio)tetraselenafulvalene (BETS or BEDT-TSeF).
Crystals 10 00270 sch001
Figure 1. Crystal and molecular structures of α-D2I3 (D = ET, STF and BETS): (a) Crystal structures shared by α-ET2I3, α-STF2I3 and α-BETS2I3. The actual figure shown above is that of α-STF2I3. The structures of the other two complexes may be visualized by the symmetric substitution of the inner chalcogen atoms by S or Se; (b) Disordered S and Se atoms in the inner chalcogen atoms in the STF molecules (S:Se = 50%:50% at all the STF sites). Yellow, white-and-red, brown, blank and violet spheres denote S, Se, C, H and I atoms, respectively.
Crystals 10 00270 g001
Figure 2. Calculated band structure around the Dirac points of α-STF2I3 [37]: (a) Energy dispersion (eV) of the two bands closest to the Fermi energy, E1(k) and E2(k), as functions of k = (kx, ky), where (x, y) corresponds to (b, a). The energy at the Dirac points is equal to the chemical potential, which is defined to be the origin of energy; (b) Enlarged view at one of the Dirac points, which are located at kD = (kx/π, (ky/π) − 1) = ±(0.61, −0.18) and are indicated as broken arrows with naughts (0 eV). δk = kkD.
Crystals 10 00270 g002
Figure 3. (a) Temperature dependence of electrical resistivity of α-STF2I3 (10–300 K). Red; heating-process data, blue; cooling-process data; (b) An enlarged view of the higher temperature range; (c) Arrhenius plot of electrical resistivity of the same data (cooling process) in Figure 3a. For reference, the black line shows the best fitting line to the widest linear range (50–80 K), showing an apparent activation energy of ~0.034 eV. (d) Electrical conductivities along the a- (σa) and the b-axes (σb), and the anisotropy in the ab-plane σb/σa.
Crystals 10 00270 g003
Figure 4. Temperature dependencies of lattice constants of α-STF2I3 (90–300 K): (a) Cell parameters (a/Å, b/Å, c/Å, α/°, β/° and γ/°) normalized by the respective values at 300 K; (b) Cell volumes (V3).
Crystals 10 00270 g004
Figure 5. Temperature dependence of molar magnetic susceptibility of α-STF2I3 (χ) at 2–300 K: (a) χ vs. T (blue filled circles) and χT vs. T (blue crosses); (b) logχ vs. logT (blue filled circles) and the best fitting line (red) at 2–40 K, respectively.
Crystals 10 00270 g005
Figure 6. Temperature-dependent reflectance spectra of α-STF2I3. The spectra measured with setting the polarization, i.e., the alignment of electric field (E-vector) in the incident light along the crystallographic: (a) a-axis; (b) b-axis. Note that each spectrum at 150, 100 and 25 K is offset by 20%, 40% and 60%, respectively in Figure 6a,b.
Crystals 10 00270 g006
Figure 7. Temperature-dependent optical conductivity spectra σ(ω) of α-STF2I3. By Kramers–Kronig transformation, the spectra were obtained from the reflectance spectra with polarization of: (a) and (c) E // a-axis; (b) E // b-axis. Blue and red horizontal lines are best-fit lines showing the constant conductivities in the range (~18 and ~30 Scm−1 for E // a- and E // b-axes, respectively). Either of them is quite different from the corresponding value of the quantum sheet conductance [(4.5 mΩcm)−1 ≈ 220 Scm−1 in this case]. Figure 7c is an enlarged view of Figure 7a. Note that each spectrum at 150 K, 100 K and 25 K is offset by 200, 400 and 600 Scm−1 in Figure 7a, by 400, 800 and 1200 Scm−1 in Figure 7b, and by 100, 200 and 300 Scm−1 in Figure 7c, respectively.
Crystals 10 00270 g007aCrystals 10 00270 g007b

