Article

Numerical Study of Three-Dimensional Melt Flows during the TSSG Process of SiC Crystal for the Influence of Input Parameters of RF-Coils and an External Rotating Magnetic Field

1
Department of Materials Engineering Science, Osaka University, Toyonaka, Osaka 560-8531, Japan
2
Department of Materials Science, Nagoya University, Chikusa-ku, Nagoya 464-8603, Japan
3
Crystal Growth Laboratory, University of Victoria, Victoria, BC V8W 3P6, Canada
*
Author to whom correspondence should be addressed.
Crystals 2020, 10(2), 111; https://doi.org/10.3390/cryst10020111
Submission received: 7 January 2020 / Revised: 30 January 2020 / Accepted: 6 February 2020 / Published: 12 February 2020
(This article belongs to the Special Issue Crystal Growth from Liquid Phase)

Abstract

:
Three-dimensional numerical simulations were conducted for the Top-Seeded Solution Growth (TSSG) process of silicon carbide (SiC) crystals. We investigated the influence of coils frequency and peak current, and an applied rotating magnetic field (RMF) on the melt flow developing in this system. Numerical simulation results show that the Marangoni flow in the melt becomes stronger at higher coils frequencies due to the decreasing coils-induced electromagnetic field strength. Results also show that the use of external RMF may improve supersaturation uniformity along the seed if it is properly adjusted with respect to the coils-induced electromagnetic field strength. Furthermore, it is predicted that the application of RMF and seed rotation in the same direction may enhance supersaturation below the seed.

1. Introduction

In our previous work [1], we performed a three-dimensional numerical simulation study for the Top-Seeded Solution Growth (TSSG) process of silicon carbide (SiC) crystals to examine the influence of melt flow on the growth process. Our simulation results have shown that the melt flow is mainly driven by the induced electromagnetic field and free surface tension gradient. The associated Marangoni convection component of the melt flow was dominant. This strong convection makes supersaturation in the melt nonuniform and enhances growth rate variations. Thus, in turn, it affects the crystal quality adversely.
In order to minimize this adverse effect of Marangoni convection, Wang et al. [2] numerically considered the application of a strong static magnetic field and examined its effect under the same growth conditions in the same system. It was also predicted that an applied static magnetic field effectively suppresses the adverse effect of Marangoni convection and minimizes growth rate fluctuations [3]. However, in spite of this advantage, the application of a static strong magnetic field will slow down growth and may cause an inhomogeneous solute distribution in the melt. For the sake of simplicity, in the above-mentioned studies, numerical simulations were performed under fixed input parameters (at 25 kHz induction coils frequency and at 6.285 A/m 2 the peak current). The numerical simulation study of Yamamoto et al. [4] also confirmed that the melt flow is significantly affected by coils frequency, where the effect of surface tension gradient and carbon transport were not included in the simulation.
The application of rotating magnetic fields (RMF) on the other hand has been widely utilized in crystal growth for the purpose of mainly controlling melt transport structures (melt flow and solute transport) and growth interface shape and stability [5,6,7,8,9]. For instance, in Czochralski (Cz) growth of silicon, Hoshikawa et al. [10] experimentally, and Zhou [11], numerically, have determined that low oxygen concentration can be achieved when the applied RMF, and the crystal and crucible rotations are all in the same direction. However, regarding the TSSG system of SiC, up to now, only Mercier et al. [12] discussed the influence of RMF on carbon transport. To the best our knowledge, there are no reports on the effect of Marangoni convection in this system.
In order to obtain a more general optimization scheme for the TSSG system of SiC, in the present study, we performed numerical simulations for the influence of coils frequency and current levels, and applied RMF on fluid flow and carbon transport in the melt of this system.

2. Numerical Model

2.1. Governing Equations

A schematic view of the TSSG system simulated is shown in Figure 1. Dimensions in the figure are in mm. The rod, hot wall, support base, and crucible are made of graphite, the gas environment is Helium, and physical and material properties of the system are in Table 1. An integrate process model [13] is developed to carry out a global numerical simulation for the calculations of the electromagnetic field, heat generation, temperature field, and melt flow. In the present study, an external rotating magnetic field is applied to the system, and the following assumptions were made: (a) RMF only affects the melt flow, and (b) the effect of crucible electrical conductivity is negligible. The only difference between our previous and present numerical studies is the inclusion of fluid flow in the melt. Details of the calculations of the electromagnetic field, heat generation, and temperature field in the TSSG furnace can be found in [1,13].
The governing equations for the melt flow are the continuity, momentum balance, energy balance, and mass transport equations that take the following forms in the present model, respectively,
· u = 0 ,
u t + u · u = 1 ρ p + ν 2 u + F E ρ + F R ρ g β ( T T 0 ) ,
T t + u · T = α 2 T + Q ρ C p ,
c t + u · c = D 2 c ,
where u = ( u x , u y , u z ) is the melt flow velocity in the Cartesian system (x, y, z), p pressure, μ the melt viscosity, F E and F R are respectively the Lorentz force densities induced by the induction coil and the applied RMF, while g represents the gravitational acceleration, β thermal expansion coefficient, T temperature, T 0 the reference temperature, α the melt thermal diffusivity, Q is the heat generation, c the carbon concentration in the silicon melt, and D is the diffusion coefficient of the carbon in the melt. The associated boundary condition for the flow velocity along the crucible walls and seed is no-slip, u = 0 , and that along the free surface is
μ u x z = σ T T x , μ u y z = σ T T y , u z = 0 .
The crucible and seed temperatures are calculated by the model of radiation and heat transfer in the furnace, which can be found in [13]. An equilibrium concentration was assumed along the crucible walls and seed, which is defined by
c eq = ρ Si M Si x eq 1 x eq , x eq = 10 2.714 10.623 / T ,
where ρ Si is the liquid silicon density, M Si is the molar weight of silicon and x eq is the carbon molar fraction.

2.2. Rotating Magnetic Field

The ϕ 1 - ϕ 2 RMF model [17] was introduced to calculate the RMF body force. In this model, the external RMF in the Cartesian coordinates is described as
B R = B 0 sin ( ω t ) e x + B 0 cos ( ω t ) e y ,
where B 0 is the magnetic field amplitude, ω is the rotating frequency, and e x , e y represent the unit vectors in x, y directions. The skin depth is much larger than the characteristic length R (crucible radius), δ = 2 / σ e μ 0 ω R , when the frequency is f = ω / 2 π = 50 Hz, where σ e and μ 0 are the electrical conductivity and magnetic permeability, respectively. Thus, the RMF completely penetrates into the melt without any change. The electric current density induced by RMF is given by
J R = σ e E + u × B R .
The magnetic field B R , and an electric field, E, can be expressed as follows in terms of a vector potential A and a electrical potential ϕ
B R = × A ,
E = ϕ + A t ,
A = B 0 y sin ( ω t ) B 0 x cos ( ω t ) e z ,
ϕ = ϕ 1 sin ( ω t ) + ϕ 2 cos ( ω t ) ,
where e z is the unit vector in the z-direction, and ϕ was decomposed into ϕ 1 and ϕ 2 . Assuming that the melt flow is much slower than the RMF rotation, the components of the Lorentz force F R = J R × B R are expressed as averaged over one time period
F x = σ 2 B 0 ϕ 2 z + ( ω y u x ) B 0 ,
F y = σ 2 B 0 ϕ 1 z + ( ω x u y ) B 0 ,
F z = σ 2 B 0 ϕ 1 y ϕ 2 x 2 u z B 0 .
By the irrotationality condition, · J R = 0 , the governing equations for ϕ 1 and ϕ 2 become
2 ϕ 1 = u z y + u y z ,
2 ϕ 2 = u z x + u x z .
The boundary conditions for the electrical potentials, ϕ 1 and ϕ 2 are derived from J R · n = 0 :
ϕ 1 n = [ ( B 0 ω x ) e z ] · n ,
ϕ 2 n = [ ( B 0 ω y ) e z ] · n .
The non-dimensional number for the electromagnetic field, the thermocapillary number, the magnetic Taylor number for RMF, and the seed rotation Reynolds number are, respectively, defined as
E M = | F E , max | R 3 ρ ν 2 , R e σ = σ T Δ T R ρ ν 2 , T a m = B 0 2 R 4 ω σ e 2 ρ ν 2 , R e Ω = Ω R R seed ν .
Here, Ω is the rotation rate and R seed is the seed radius. The governing equations are discretized by the finite volume method, and solved using an open-source software, OpenFOAM. Furthermore, mesh dependency was verified in our previous work [1].

3. Results and Discussion

In this section, the simulated cases are listed in Table 2.

3.1. Effect of Input Parameters on the Melt Flow

Figure 2 shows the thermal field in the whole furnace for Cases 1, 2, and 3 in the vertical plane ( y = 0 ). The computed results indicated that the coils frequency and current only changes the range of temperature values without affecting the distribution. The lower temperature value can be obtained by using low frequency RF-coils. Figure 3 presents the computed Lorentz force density distribution of the electromagnetic field corresponding to these three cases. The strong Lorentz force penetrates completely into the melt in Case 1 where low frequency and strong coils current values are used. The Lorentz force density significantly decreases in Case 3, at the high frequency and low current values. This prediction is in agreement with that given in [13]. The calculated non-dimensional numbers EM in Cases 1, 2 and 3 are 1.86 × 10 9 , 8.85 × 10 8 and 4.49 × 10 8 , respectively.
The snapshots of flow velocity vectors at the top horizontal plane are shown in Figure 4. The melt flow in Case 1 is faster than those in Cases 2 and 3. However, the free surface in Case 2 and Case 3 clearly appears as a folded wave due to Marangoni instability, and it may generate spoke-like patterns as discussed by Wang et al. [1]. Figure 5 shows the time-averaged flow velocity vectors and temperature distribution in the melt in the vertical plane ( y = 0 ). In all three cases, we observe flow patterns that consist of vortices induced by the electromagnetic field and Marangoni convection along the free surface with varying intensity. Examination of the computed temperature difference in Figure 5 gives a thermocapillary number | R e σ | 4.8 × 10 5 in all three cases. However, the strengths of the Marangoni flow below the seed crystal in the melt are different. For instance, in Case 1, the Marangoni convection below the seed is weak and not so notable as seen in Figure 5a. This is because of the dominance of the strong electromagnetic field-induced ( EM = 1.86 × 10 9 ) flow in this case. However, Marangoni convection becomes very apparent below the seed in Cases 2 and 3 as seen in Figure 5c,e as the contribution of electromagnetic flow gets weaker in this region. We also note that, in Case 1, the Marangoni convection along the free surface towards the crucible wall becomes more pronounced, as seen in Figure 5a, and gives rise to the generation of vortices at the upper part of the melt near the crucible wall.
On the other hand, the examination of the computed temperature field shows that, in Case 1, a lower heating temperature is predicted along the crucible wall. This is because of low heat generation at the smaller coil frequency. In this case, in order to obtain relatively higher temperatures, a higher electric current density is needed. However, due to the larger EM in Case 1, heat transfer in the melt is enhanced by the upward flow, and a flat and thin temperature boundary layer was predicted along the seed. Meanwhile, as seen from Figure 5d,f, in Cases 2 and 3 at the high frequency and low electric current values, the EM strength decreases and, consequently, the temperature boundary layer below the seed becomes thicker and steeper as the Marangoni convection gets stronger in this region.
Figure 6a–c present the time-averaged supersaturation distribution in the melt in all three cases while Figure 6d shows the supersaturation profiles in the melt along the seed surface. In the computations, the supersaturation S is calculated by using ( c c eq ) / c eq . As seen from Figure 6a–c, in all cases, high supersaturation is observed in the region below the seed, and its strength gets stronger as the EM intensity decreases. We also note that in Cases 2 and 3 the region of high supersaturation becomes much steeper due to the contribution of Marangoni convection. However, in Case 1, this region is thinner as seen in Figure 6a. Such a thin supersaturation region may lead to the dissolution of seed and prevent growth.
In order to provide a more quantitative perspective, the supersaturation profiles in the melt along the seed surface are presented in Figure 6d. As seen, the supersaturation profile in Case 1 is more uniform compared with those of Cases 2 and 3. This shows that the effect of Marangoni flow becomes more dominant in the center as the ratio of EM / Re σ 2 becomes smaller. This ratio represents the contribution of electromagnetic field with respect to Marangoni convection. The smaller value of the ratio indicates a larger non-uniformity in supersaturation distribution. Thus, we can conclude that an optimal supersaturation uniformity can be achieved when this ratio is higher than 0.004.

3.2. Effect of External RMF on the Melt Flow

In this section, we present the simulation results when an applied RMF is considered. For this purpose, we selected the values of magnetic field intensity and rotating frequency as 3 mT and 50 Hz, respectively. This corresponds to the magnetic Taylor number of Ta m = 1.73 × 10 6 . The snapshots of velocity vectors at the top plane are shown in Figure 7. Compared to Figure 4, the flow turns to the azimuthal direction when under an external RMF, and the case with smaller EM appears to be more significant azimuthal flow (Case 6). Thus, the folded wave is suppressed by RMF. As seen from the time-averaged velocity vectors in Figure 8a–c, the application of an RMF alters the flow structures of the melt significantly. It suppresses the radial component of Marangoni convection in the melt while it induces an outward flow below the seed and an upward flow near the bottom of the melt. The influence of RMF becomes more pronounced as the EM field intensity decreases. As a result, the higher supersaturation region below the seed is in Case 1, flattens in Case 2 and eventually disappears in Case 3.
Figure 8d–f present the time-averaged supersaturation profiles along the seed and compared those in the absence of an applied RMF. As we see, in Case 4, the application of RMF reduces supersaturation in the center without affecting its distribution near the seed edge (see Figure 8d). In addition, the supersaturation profile is more uniform than those of Cases 2 and 3 for which the values of Ta m 2 / E M are higher and that of Ta m / Re σ is 3.6. In Case 6, when Ta m 2 / E M > 3400, the supersaturation decreases sharply and its distribution becomes non-uniform. These results show that the application of an external RMF may improve growth conditions for a more uniform crystal growth. However, the RMF intensity needs to be selected carefully with respect to the coils’ input parameters. For instance, when we select Ta m 2 / E M < 3400, Ta m / Re σ is 3.6 or slightly smaller than 3.6 in which case we obtain an optimum condition for uniform growth. If we select Ta m 2 / E M > 3400, Ta m / Re σ must be much smaller than 3.6 in order to avoid a rapid decrease in supersaturation which will not be a favorable condition for growth.

3.3. Combined Effect of Seed Rotation and RMF

Our previous studies [1,2] have shown that the effect of seed rotation is significant when the effect of magnetic fields are taken into account, while it is limited in the absence of magnetic fields. In order to examine this further, we considered a seed rotation of 60 rpm in Case 2 (selected as a reference case) under the effect of an applied RMF. Simulation results are presented in Figure 9. The time-averaged flow velocity vectors in the upper plane of the melt are presented for two cases: Case 7 in which RMF and seed rotation are in the same direction, and Case 8 in which RMF and seed rotation are in opposite directions (the opposite direction was represented by a negative sign in front of the seed rotation Reynolds number).
Figure 10a,b show the time-averaged velocity vectors in Cases 7 and 8, while Figure 10c presents the associated supersaturation profiles. As seen from Figure 10a,b, the melt flow is affected only in the vicinity of the seed. In Case 7, the carbon transport to the seed is enhanced and the downward flow below the seed is suppressed. This is due to the fact that the contribution of seed rotation was more effective when RMF and seed rotation were in the same direction.
In Case 8, however, being in the opposite direction, seed rotation balances the effect of the RMF-induced azimuthal flow. As a result, in this case, the downward flow is enhanced and the supersaturation decreases. This can be seen more quantitatively from Figure 10c. A higher supersaturation and more uniform supersaturation profile are predicted in Case 7 where the seed rotation is in the same direction of the applied RMF. However, in Case 8, the supersaturation value decreases and the supersaturation profile uniformity becomes worse than the case with no seed rotation.

4. Conclusions

A three-dimensional numerical simulation study was carried out to investigate the effects of input parameters of induction coils and an applied rotating magnetic field on the melt flows in the Top-Seeded Solution Growth (TSSG) process of SiC crystals. The following conclusions were drawn from the study:
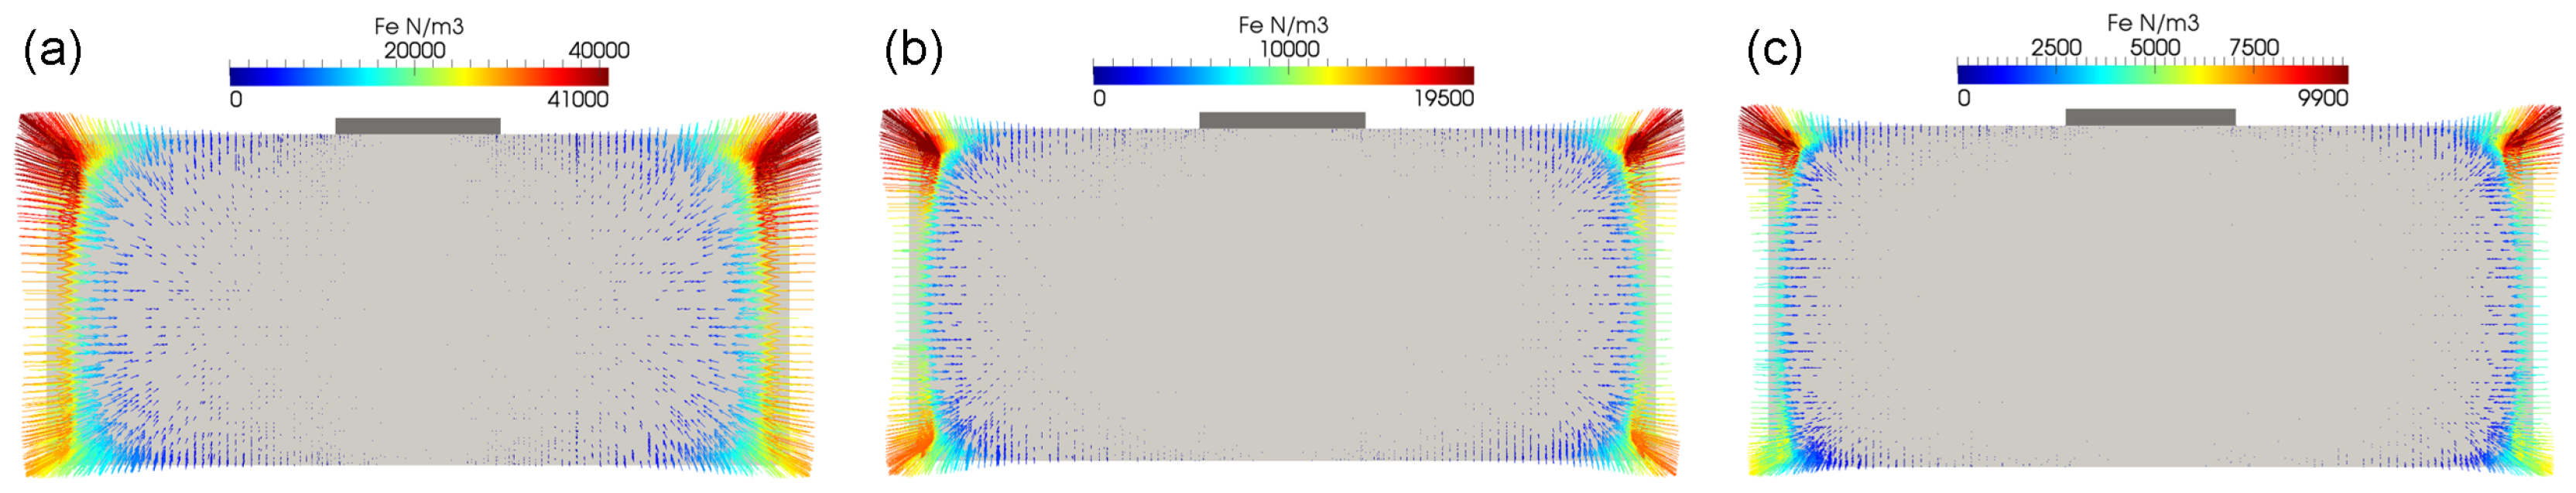
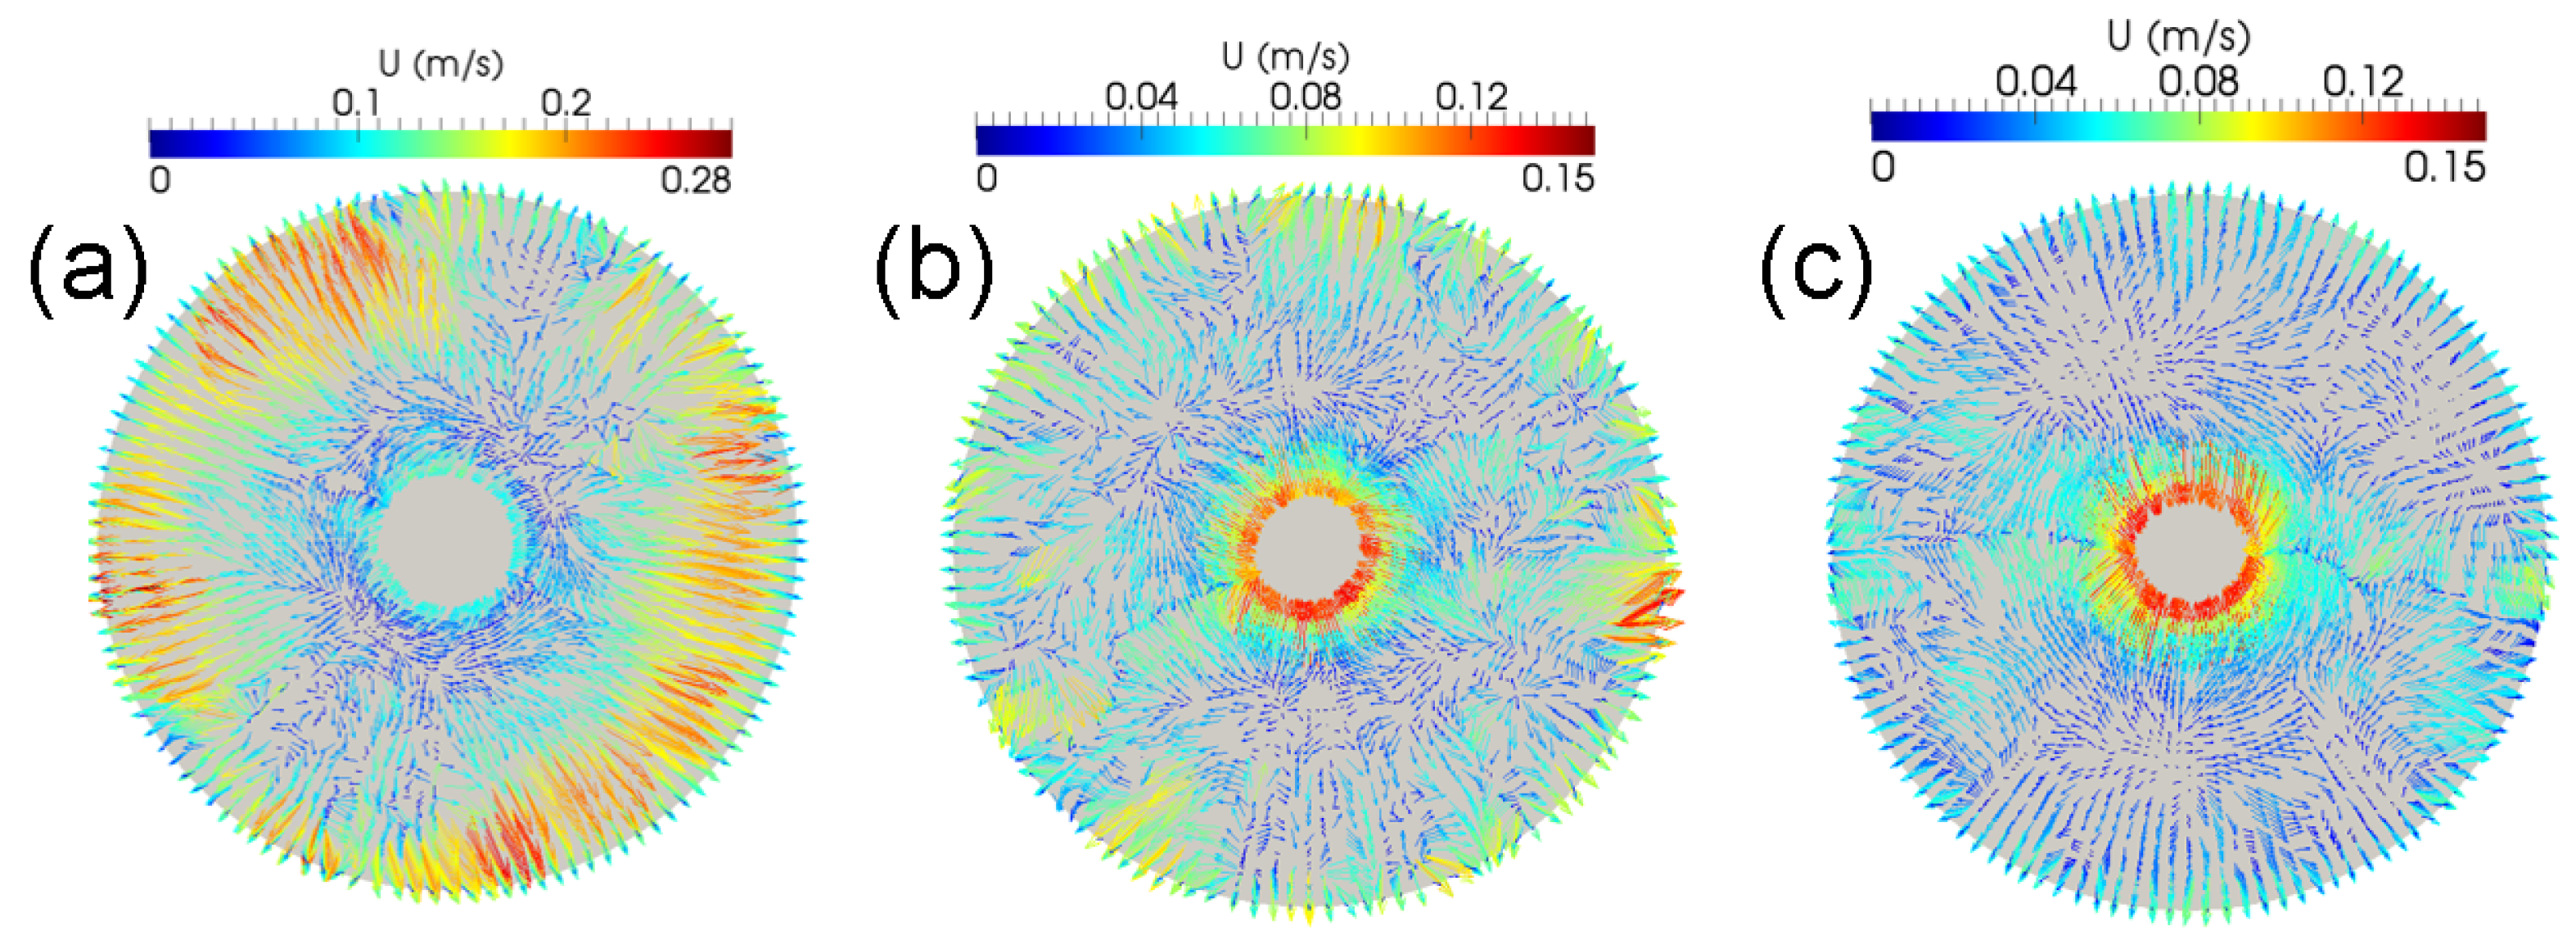
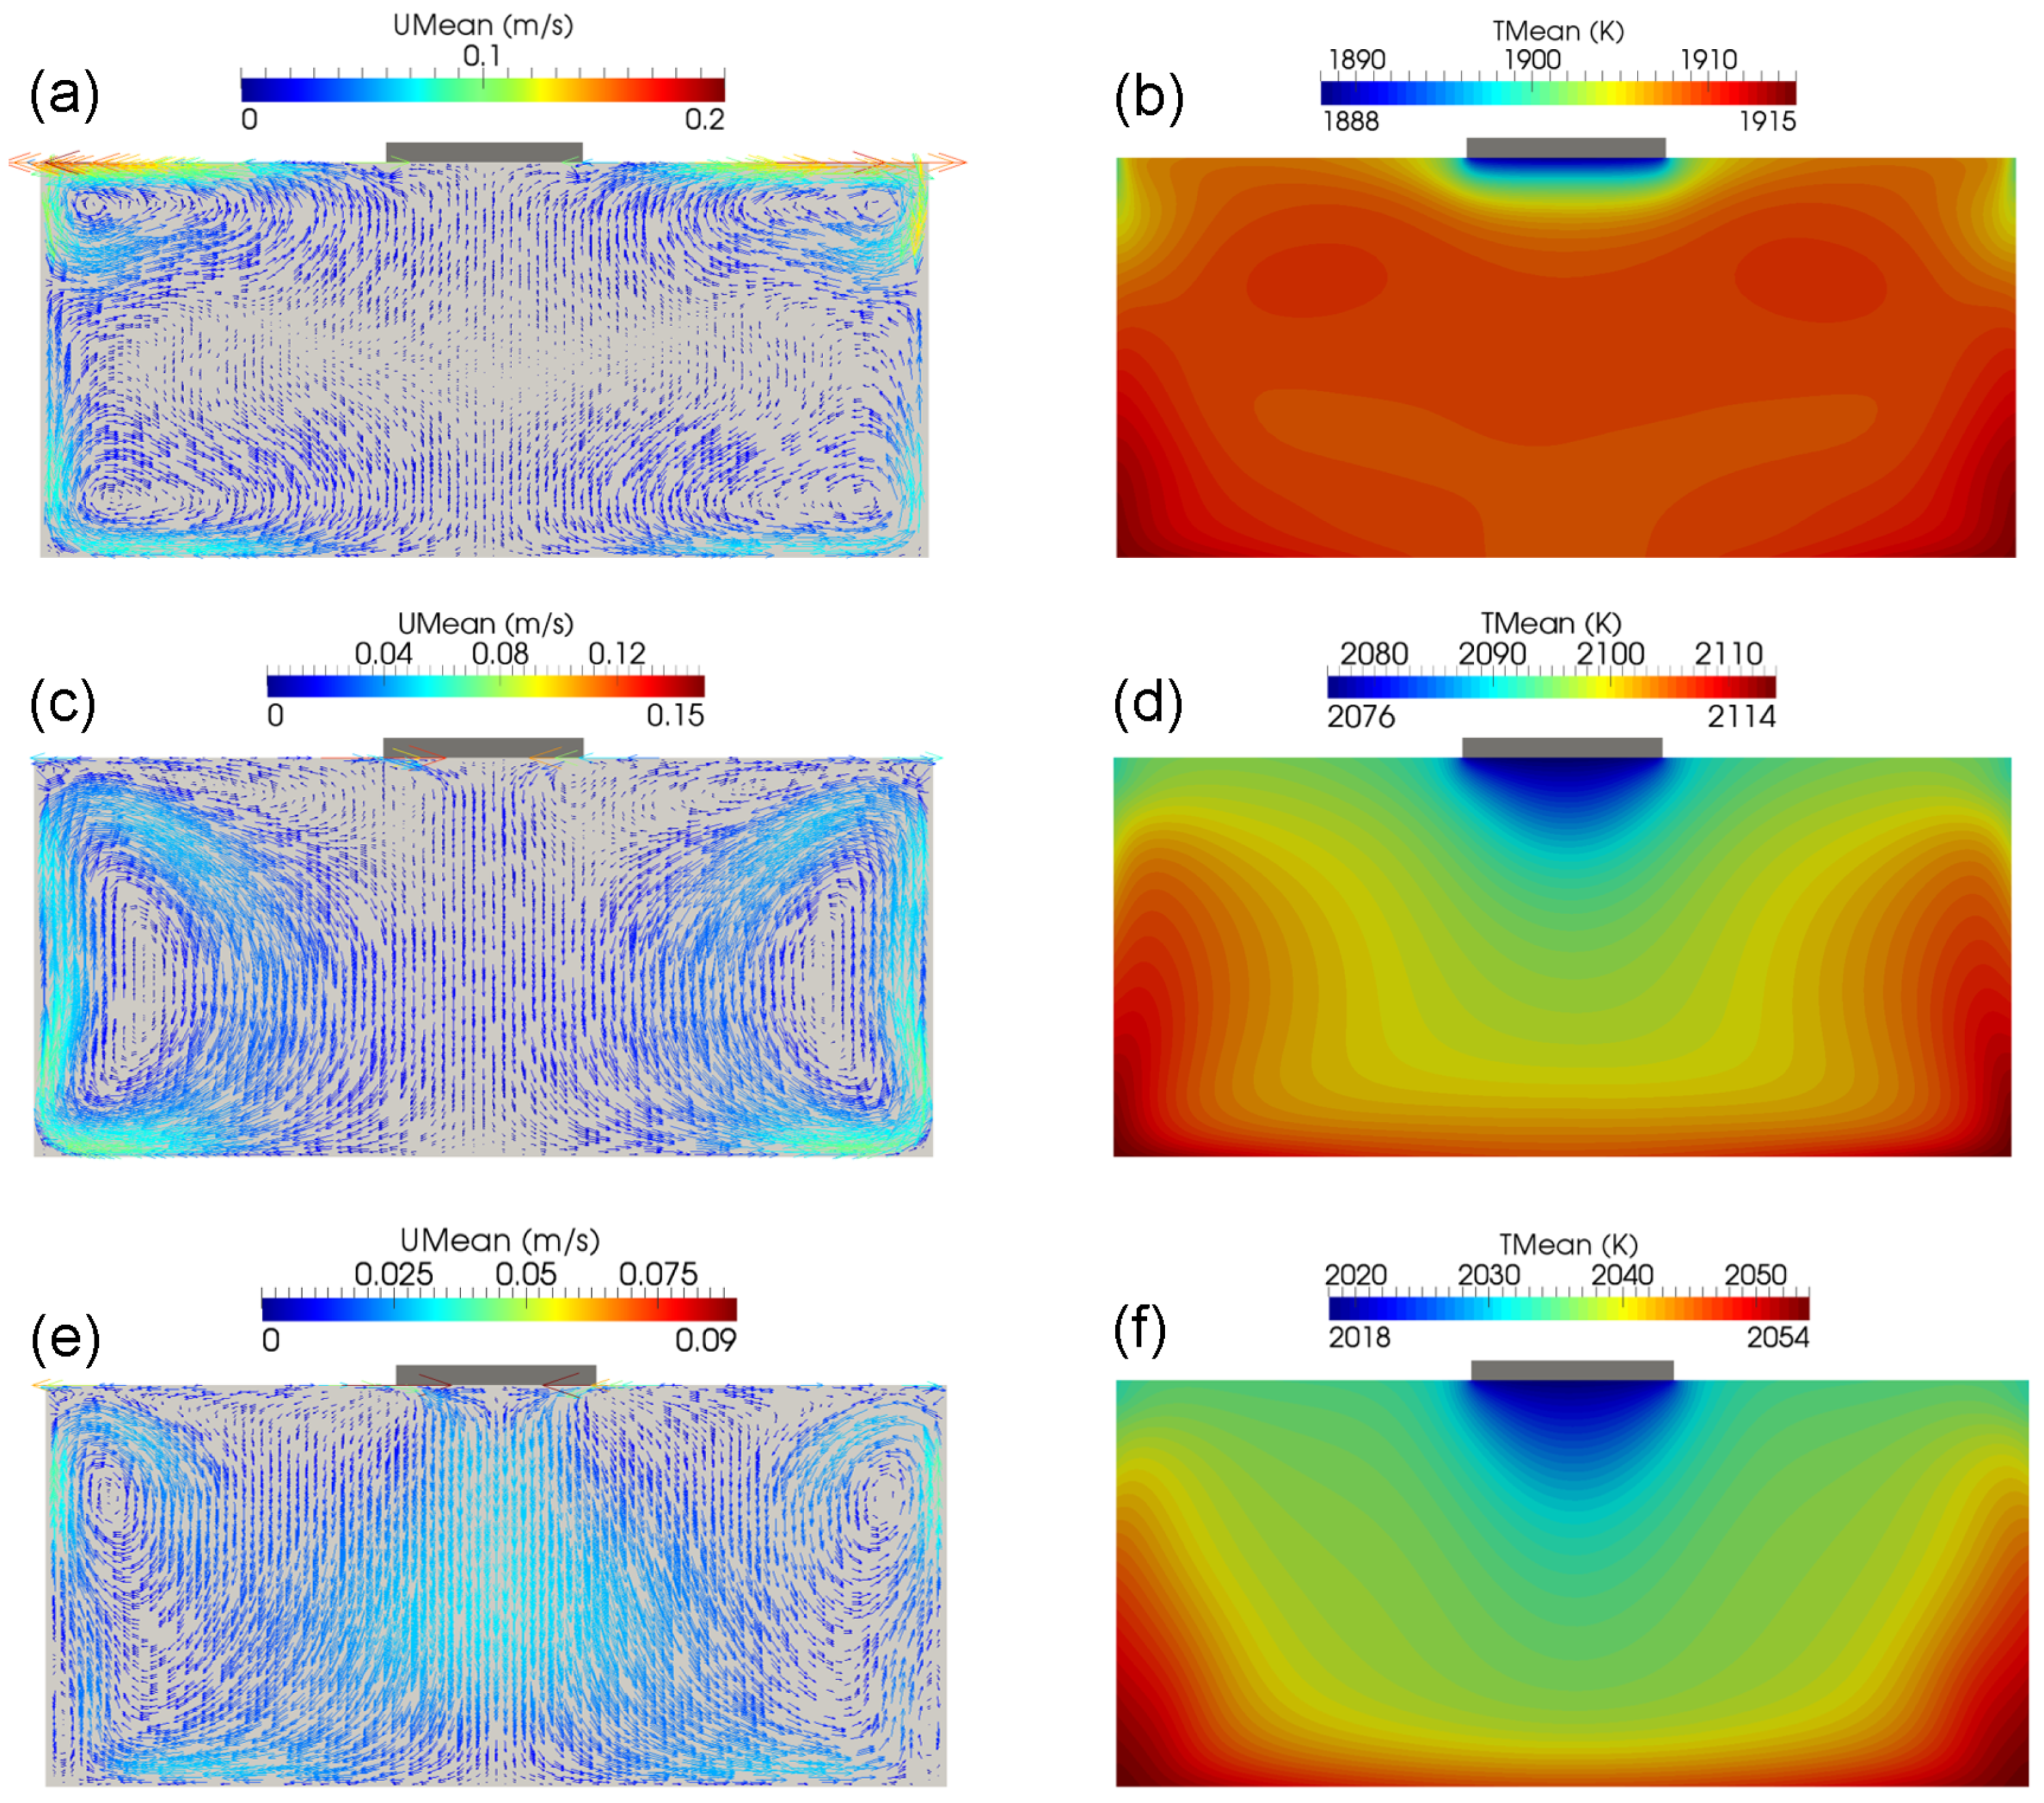
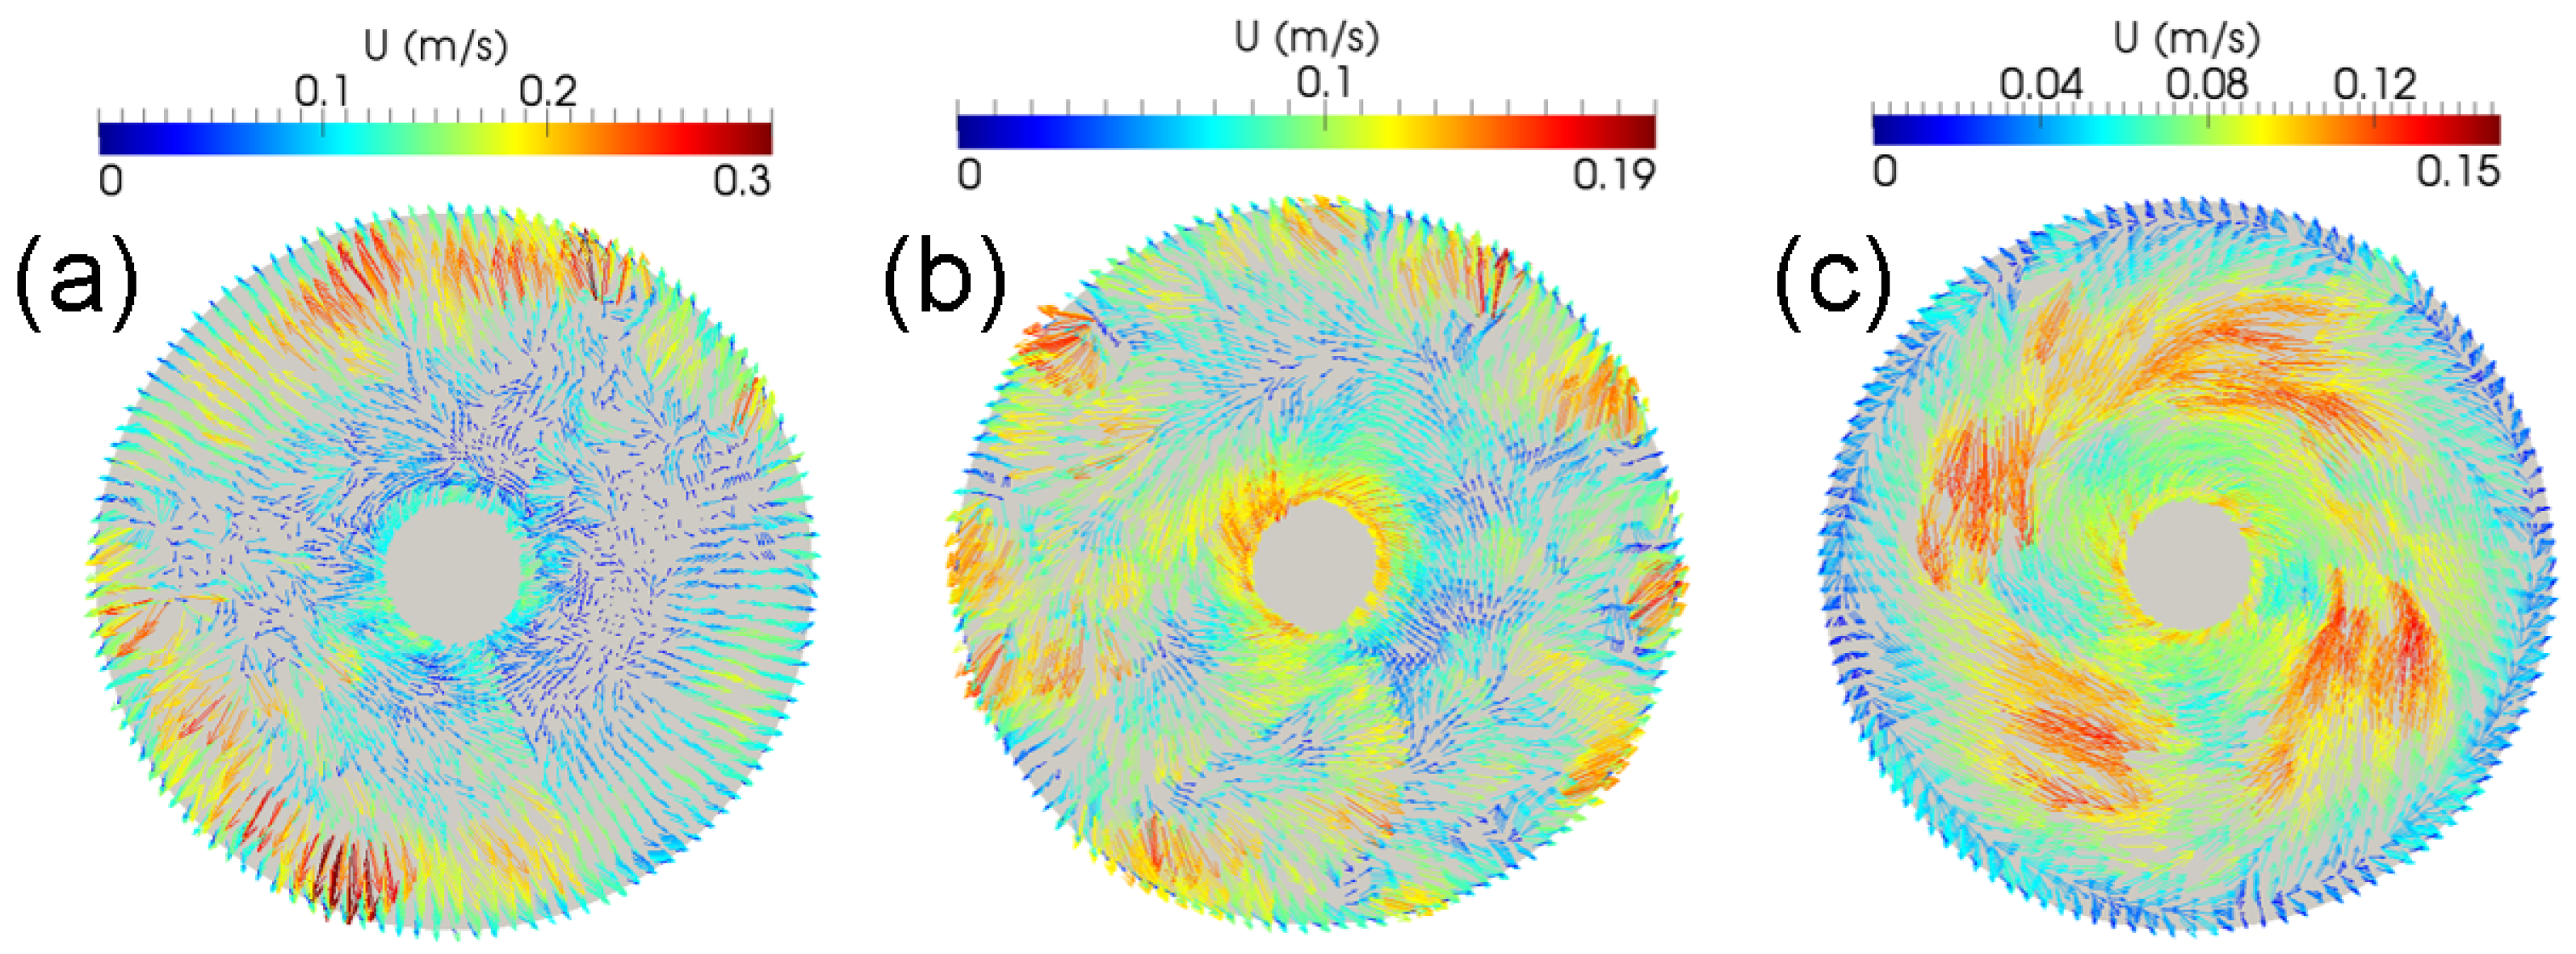
  • Fluid flow in the melt of the TSSG system is mainly the combination of an electromagnetic flow induced by the Lorentz force in the melt body, and Marangoni convection along the melt free surface driven by surface tension gradient.
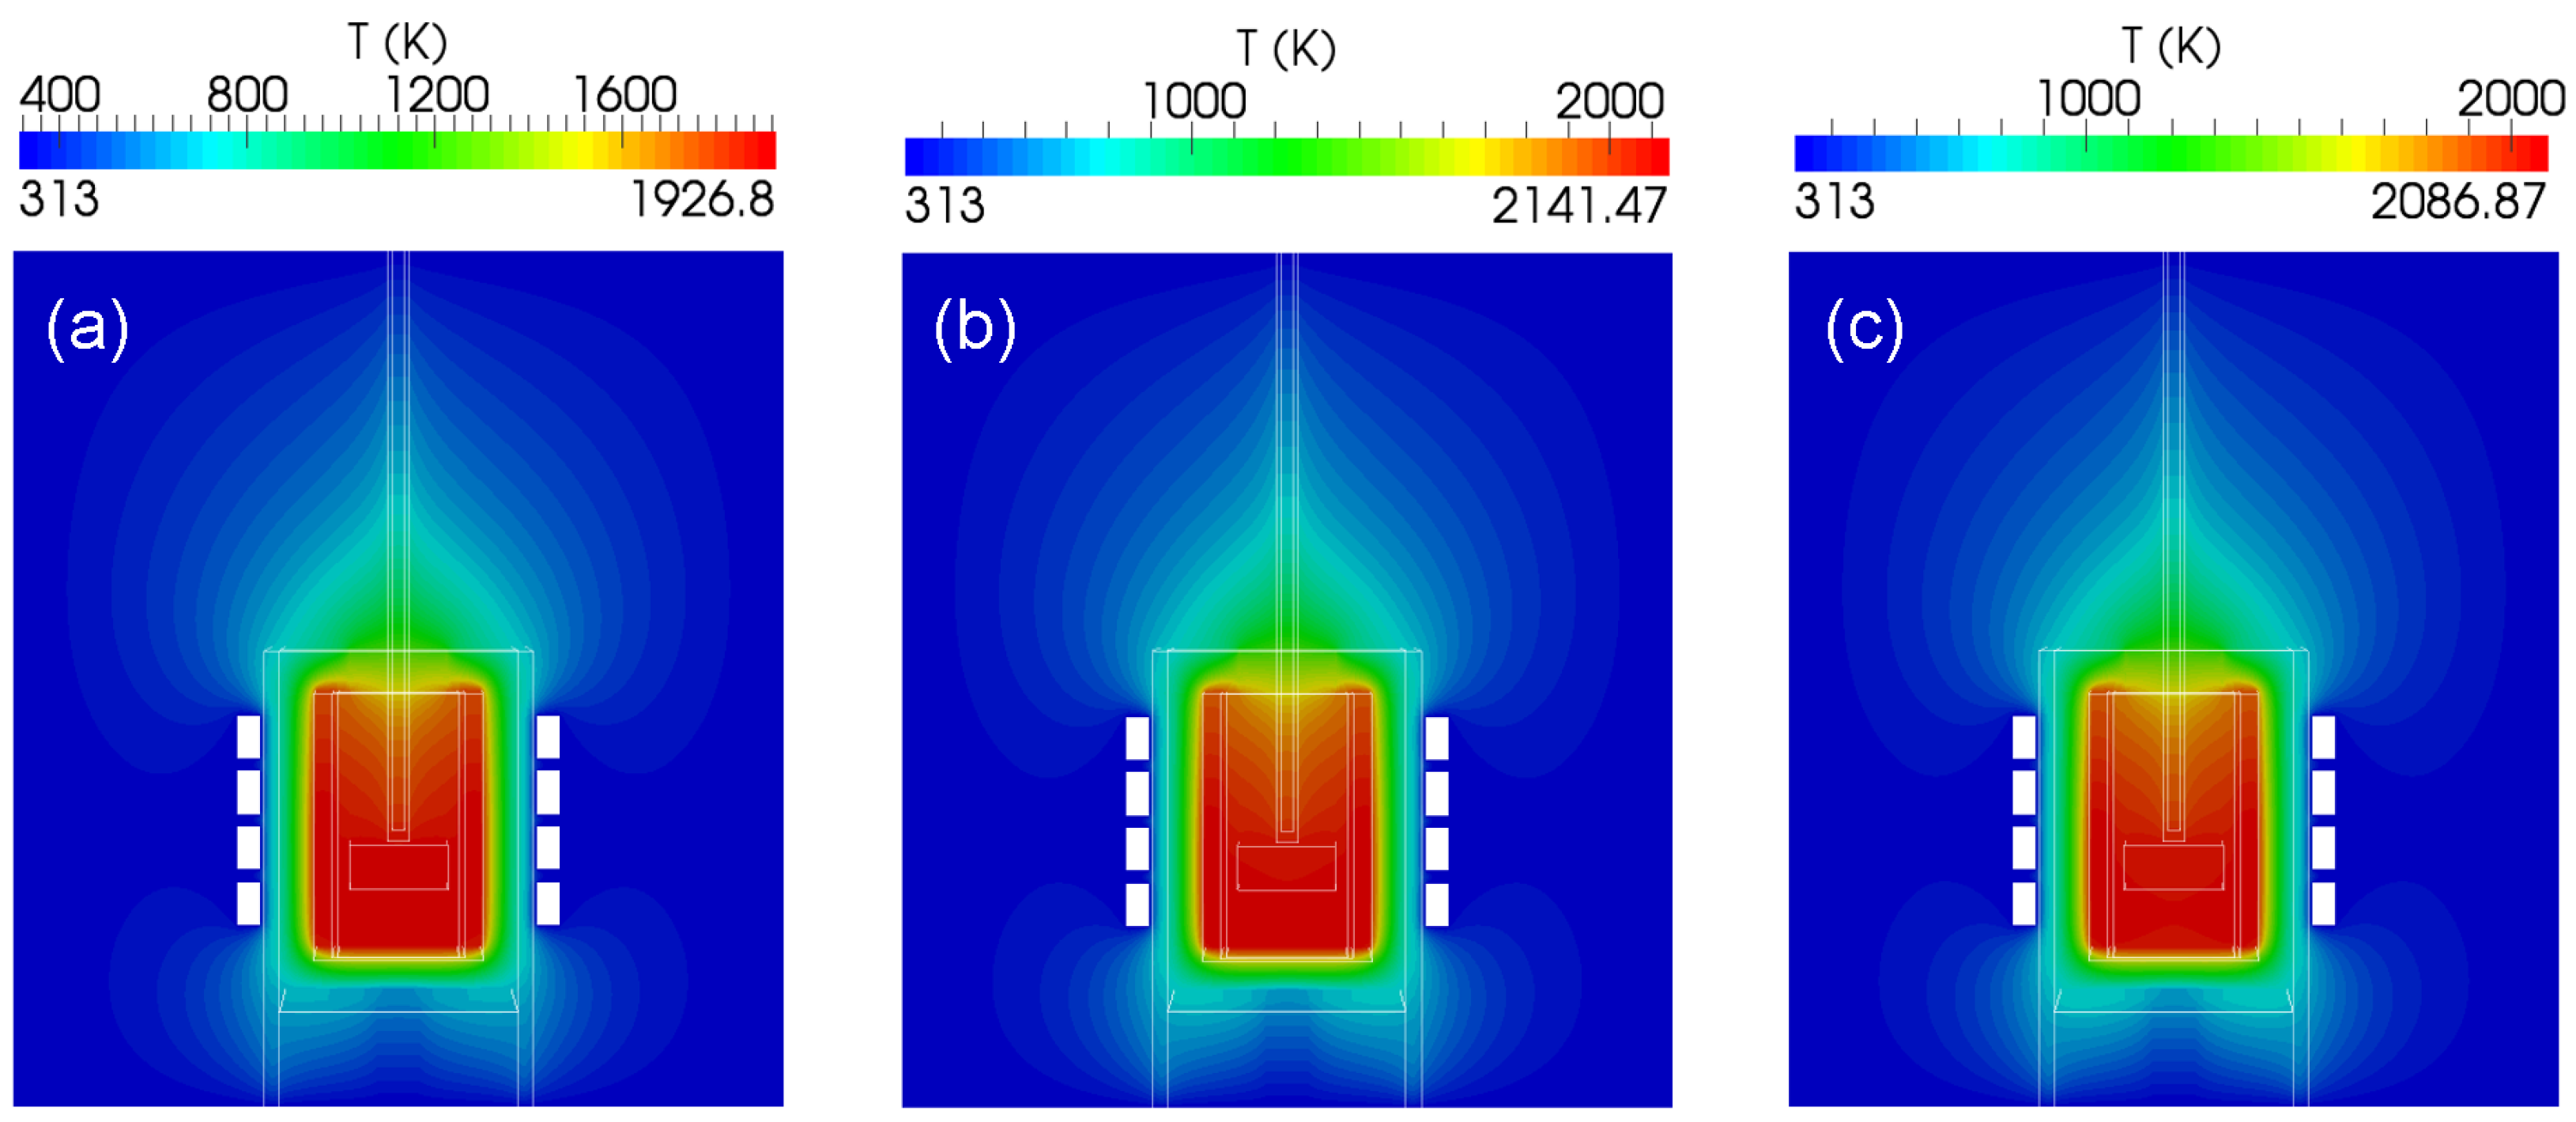
  • Higher coil frequency can reduce the Lorentz force density and enhance the heating temperature.
  • Electromagnetic flow can suppress Marangoni convection near the seed. At the higher coil frequency, the downward flow below the seed due to Marangoni convection becomes more pronounced.
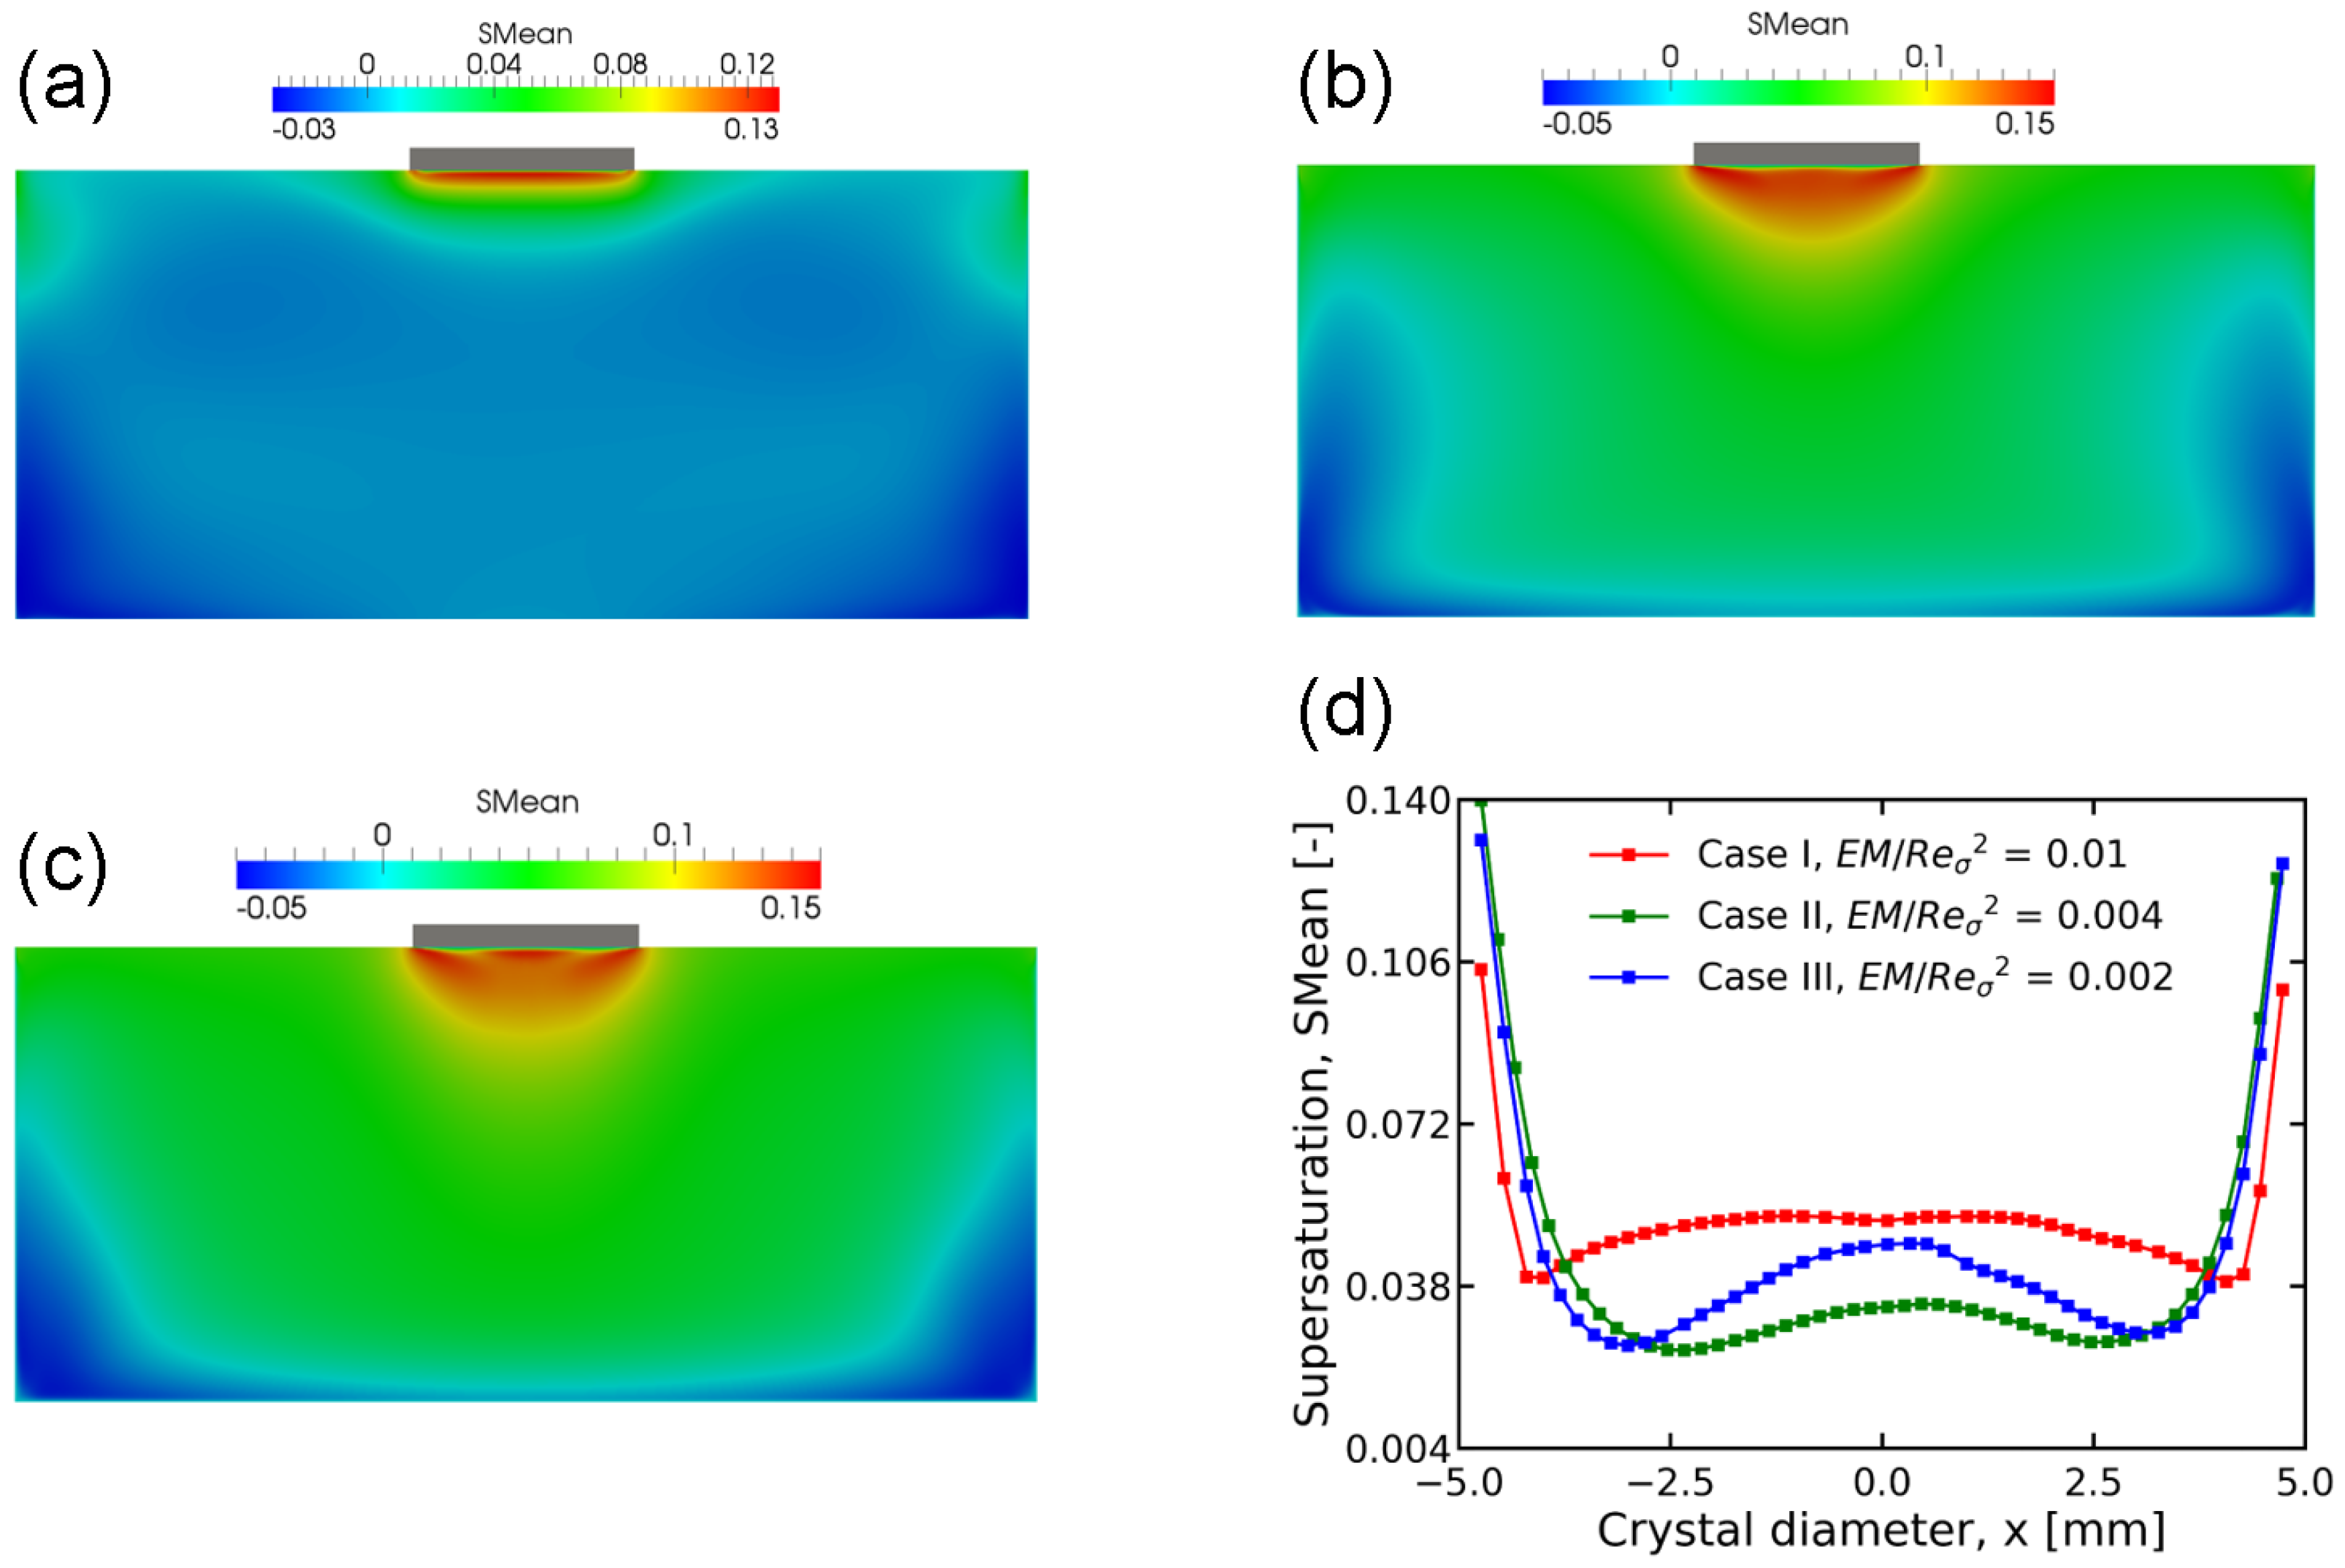
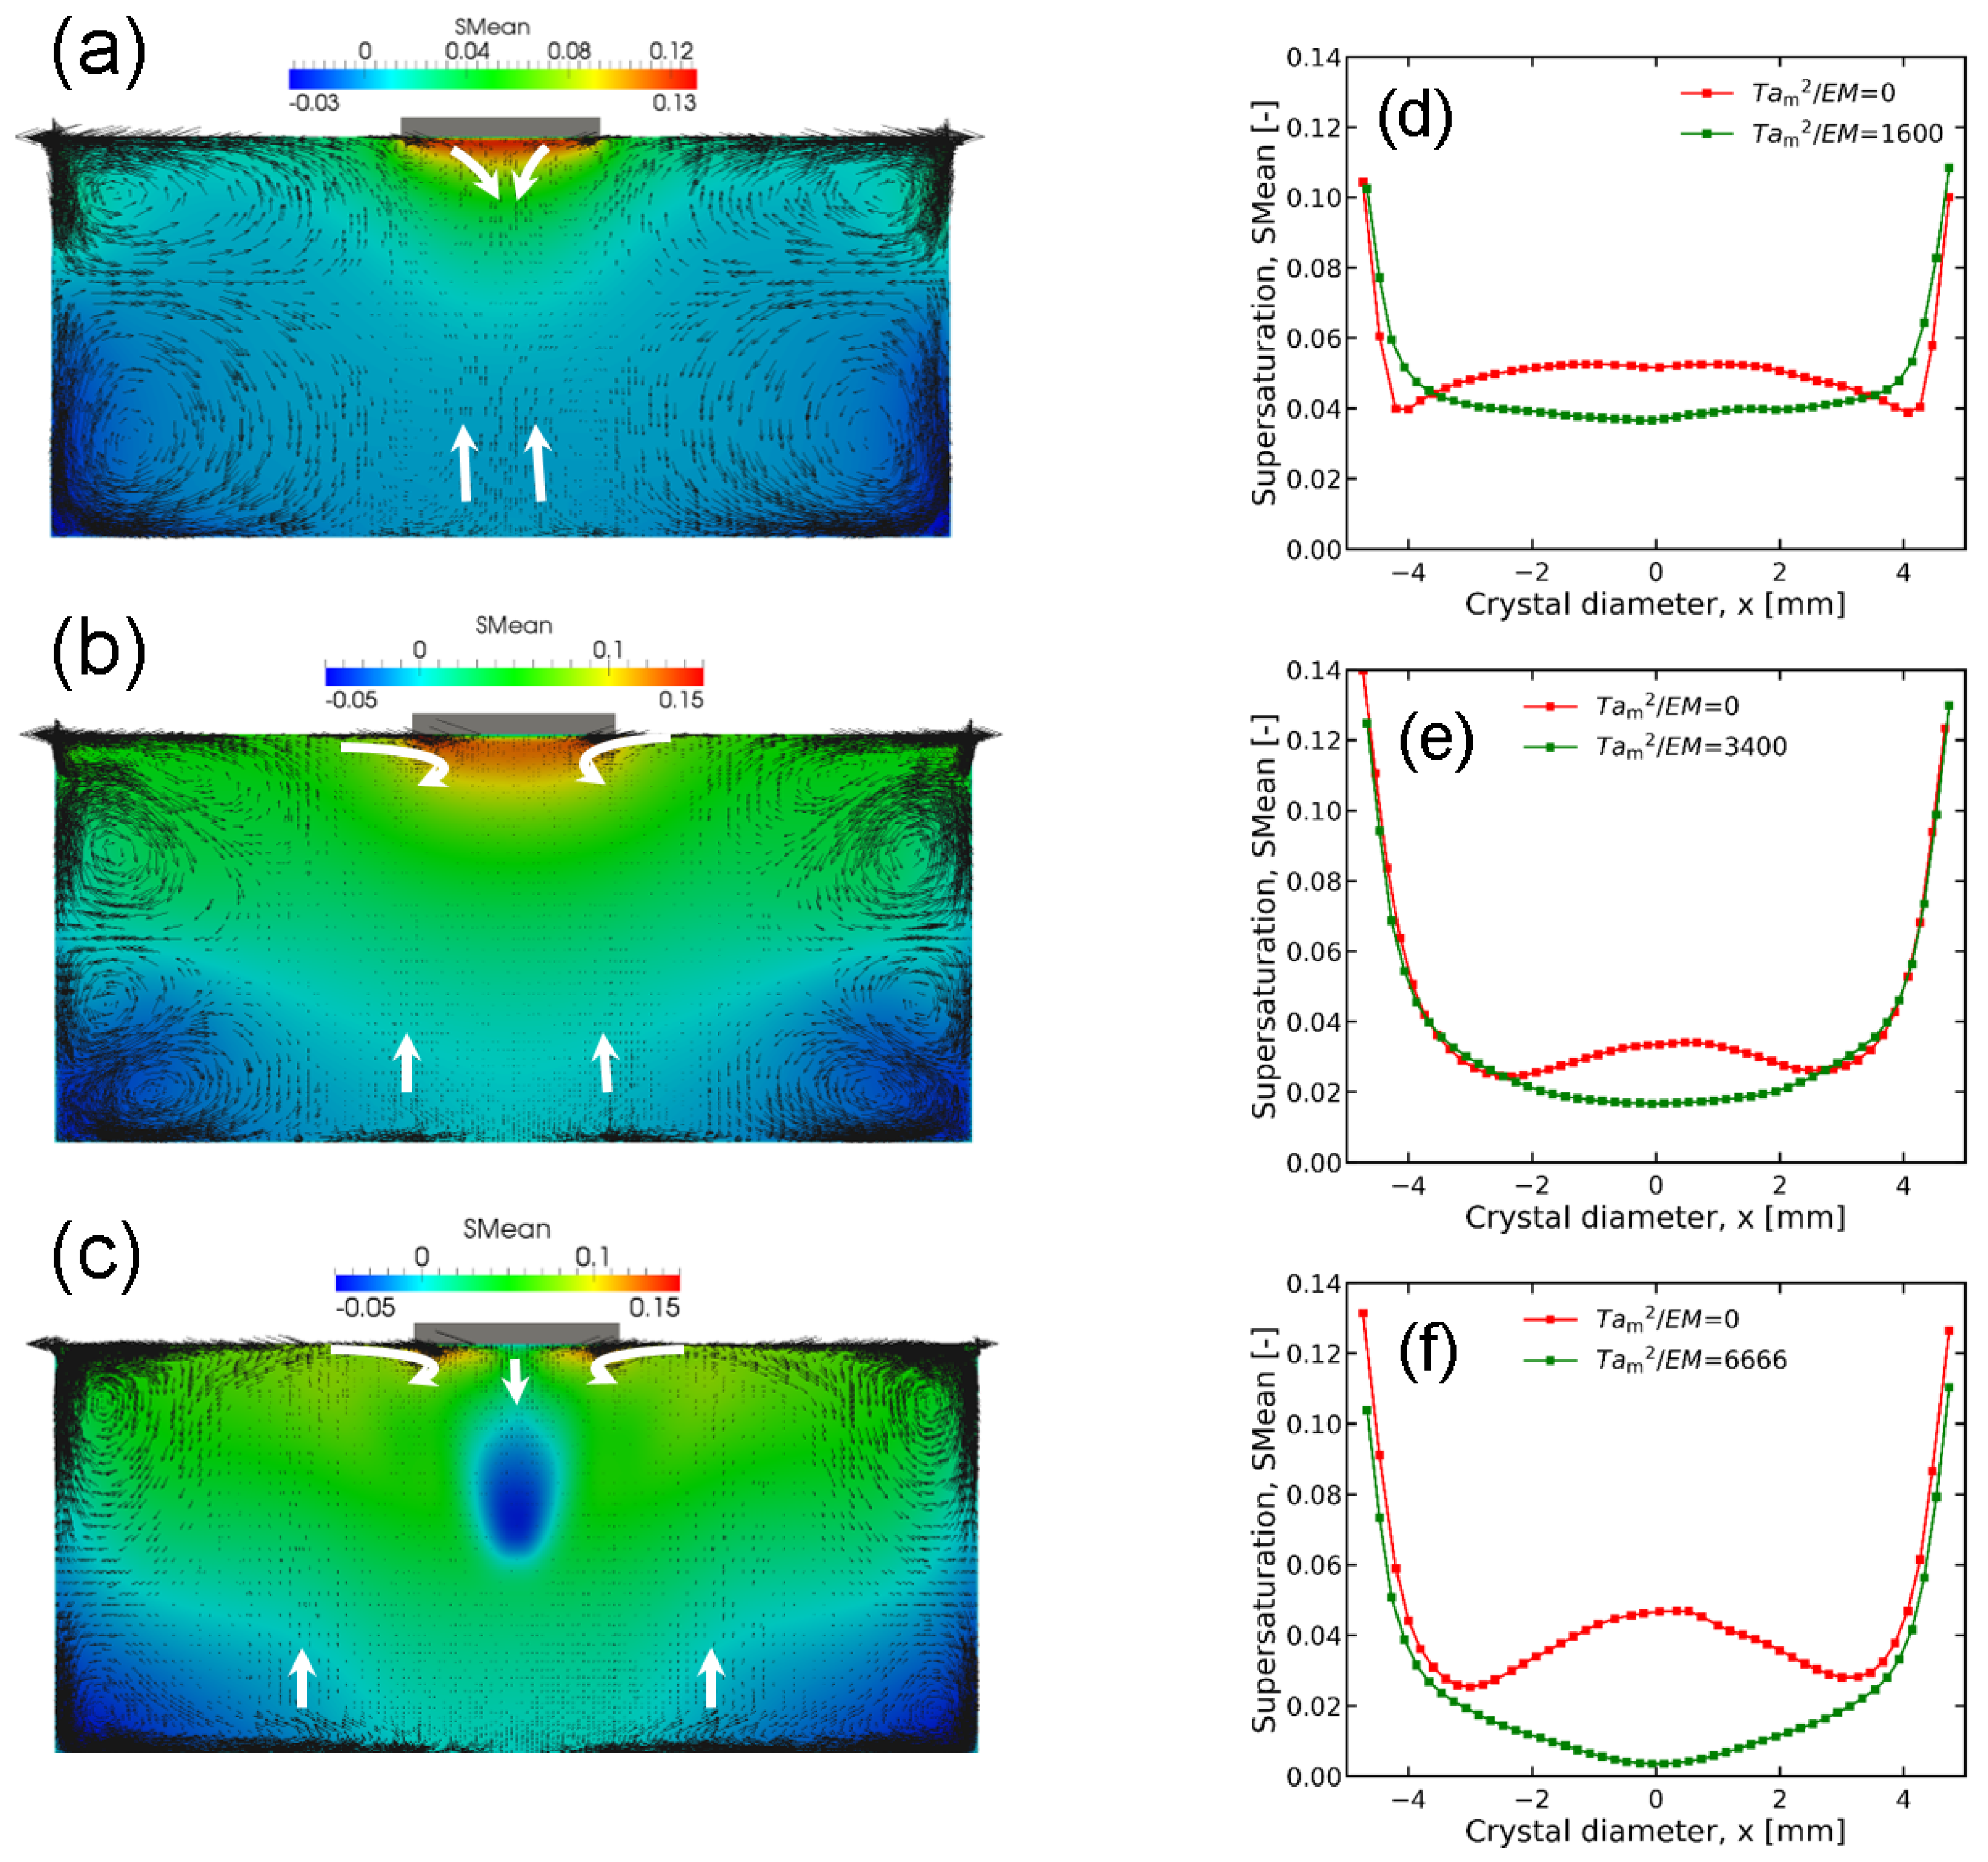
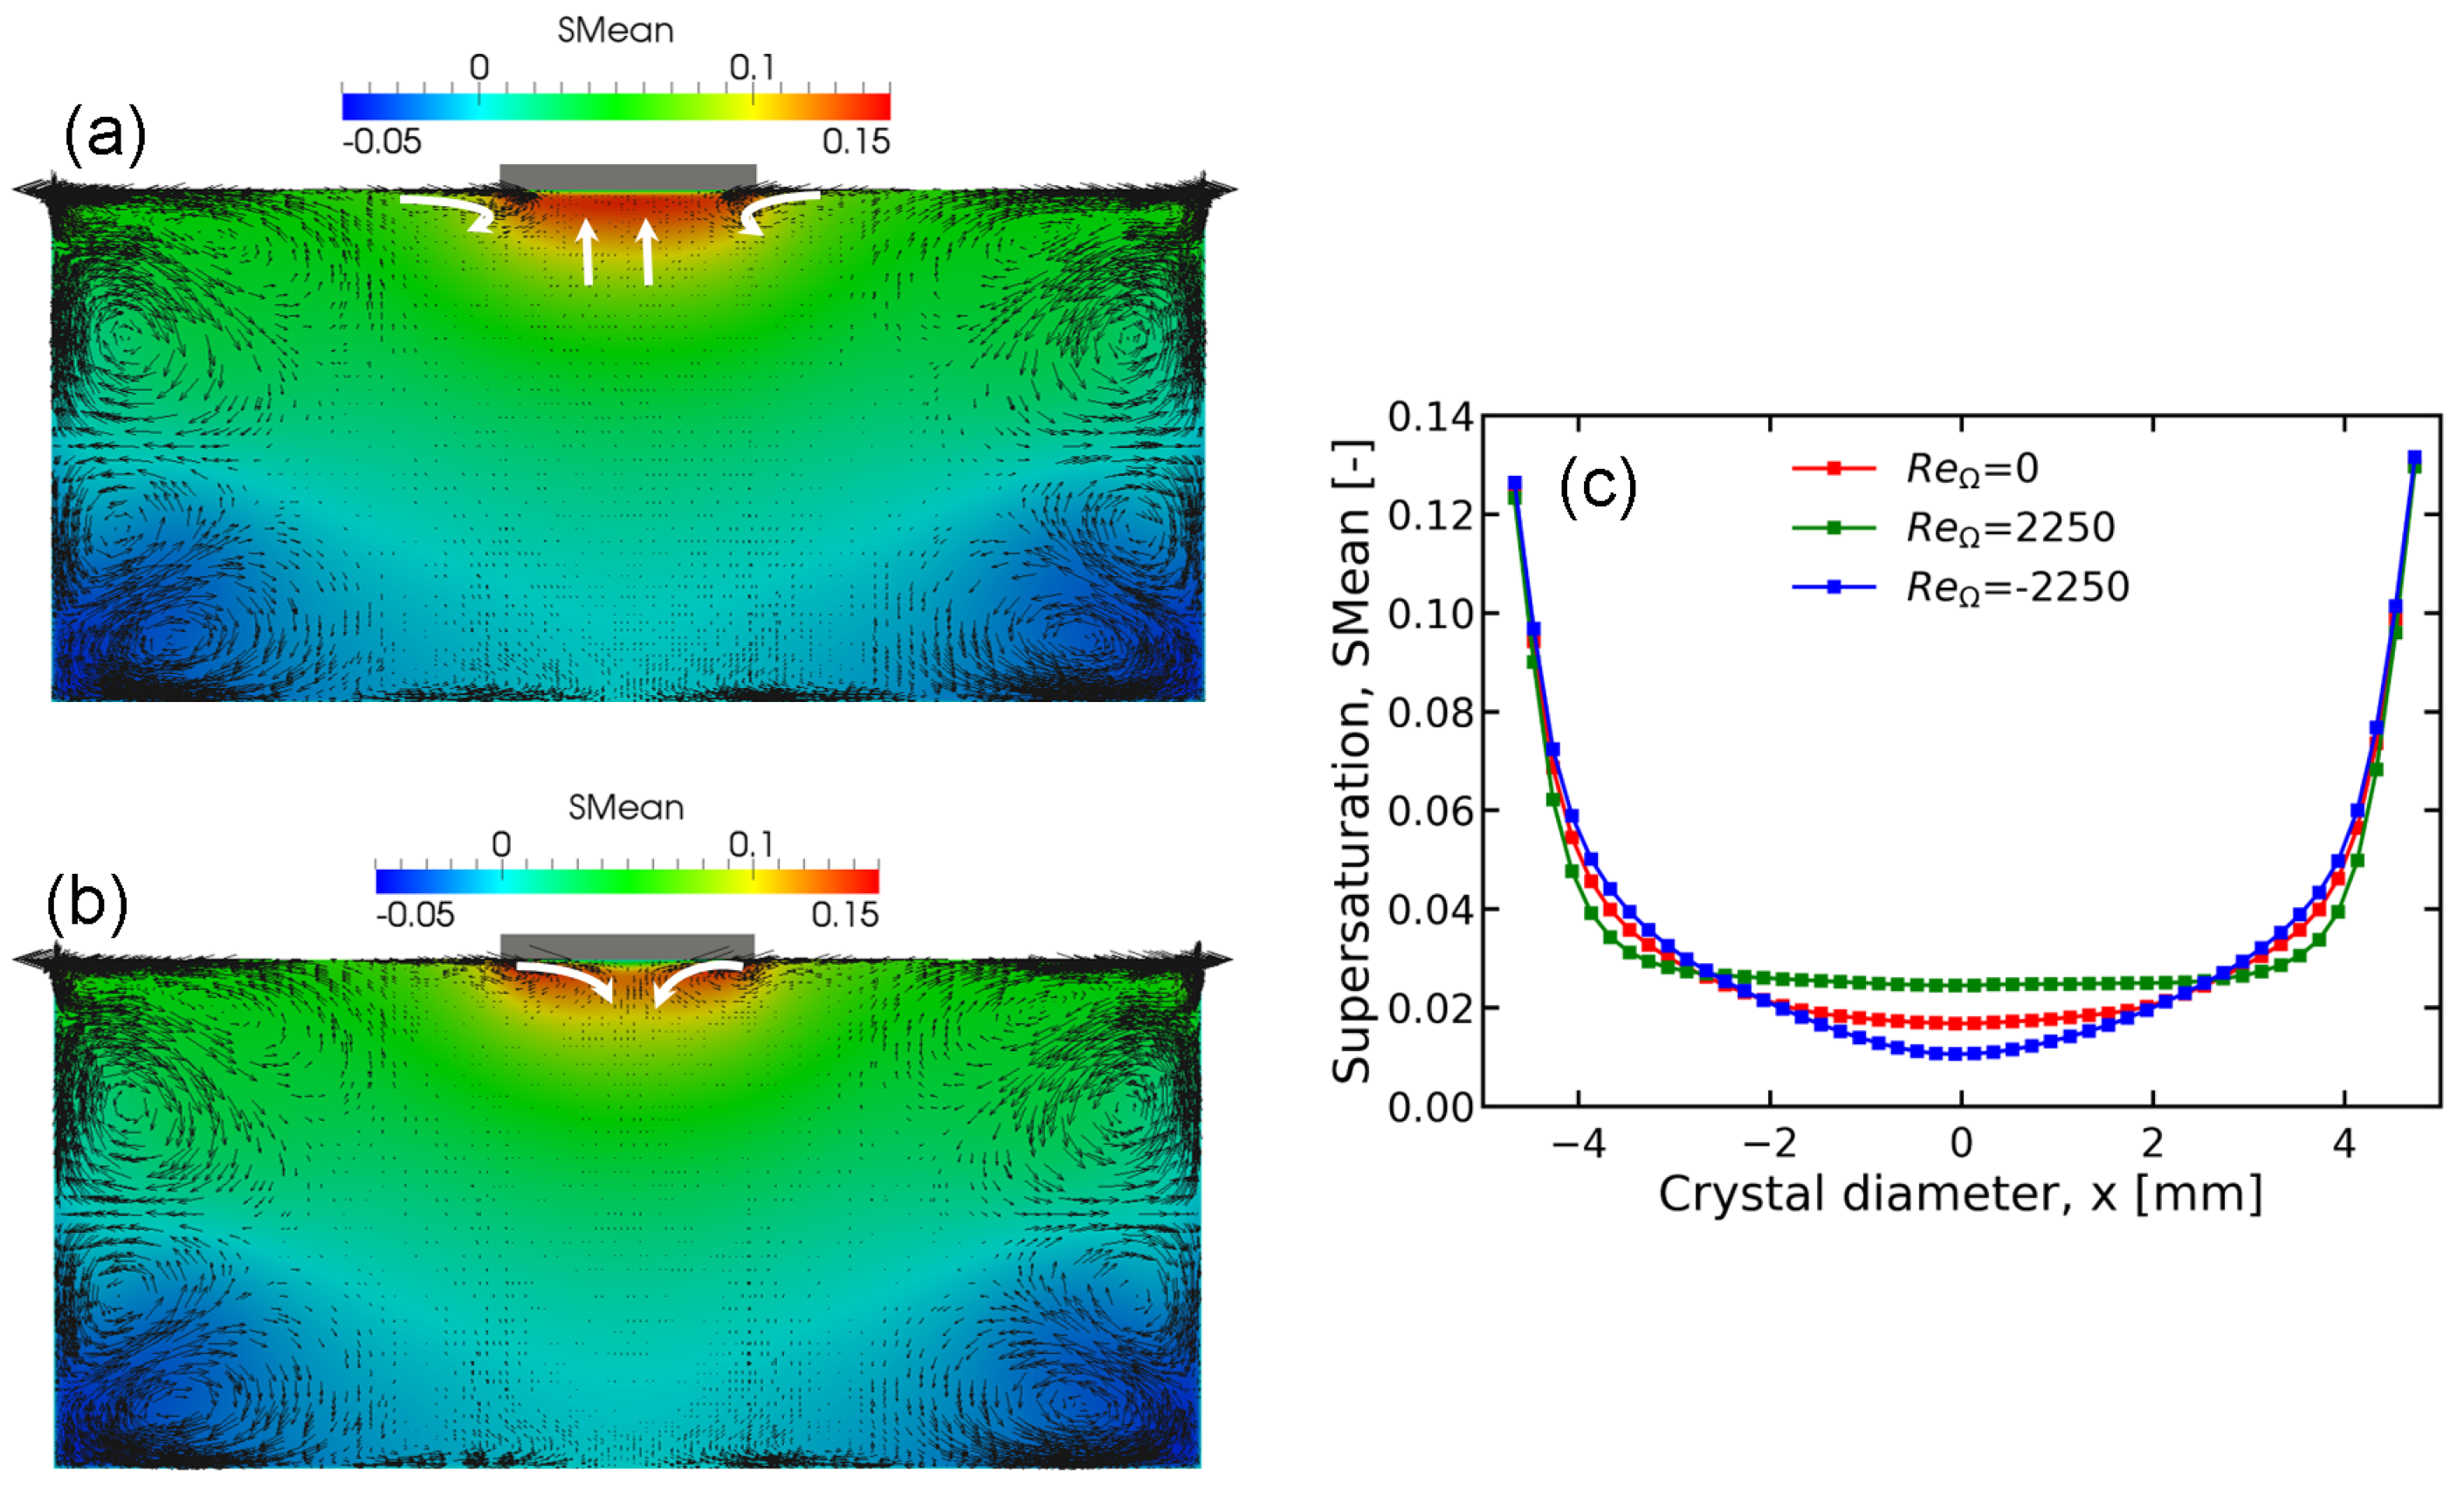
  • Marangoni convection leads to a non-uniform supersaturation distribution in the melt along the seed surface. The supersaturation profile exhibits a high-low-high pattern from the seed center to its edge.
  • An applied RMF can reduce supersaturation below the seed center, and the effect of RMF becomes more significant as the electromagnetic field weakens. When Ta m 2 / E M < 3400, Ta m / Re σ is 3.6 or slightly smaller than 3.6 a uniform supersaturation distribution can be achieved; however, when Ta m 2 / E M > 3400, Ta m / Re σ should be reduced significantly in order to obtain the desired uniformity.
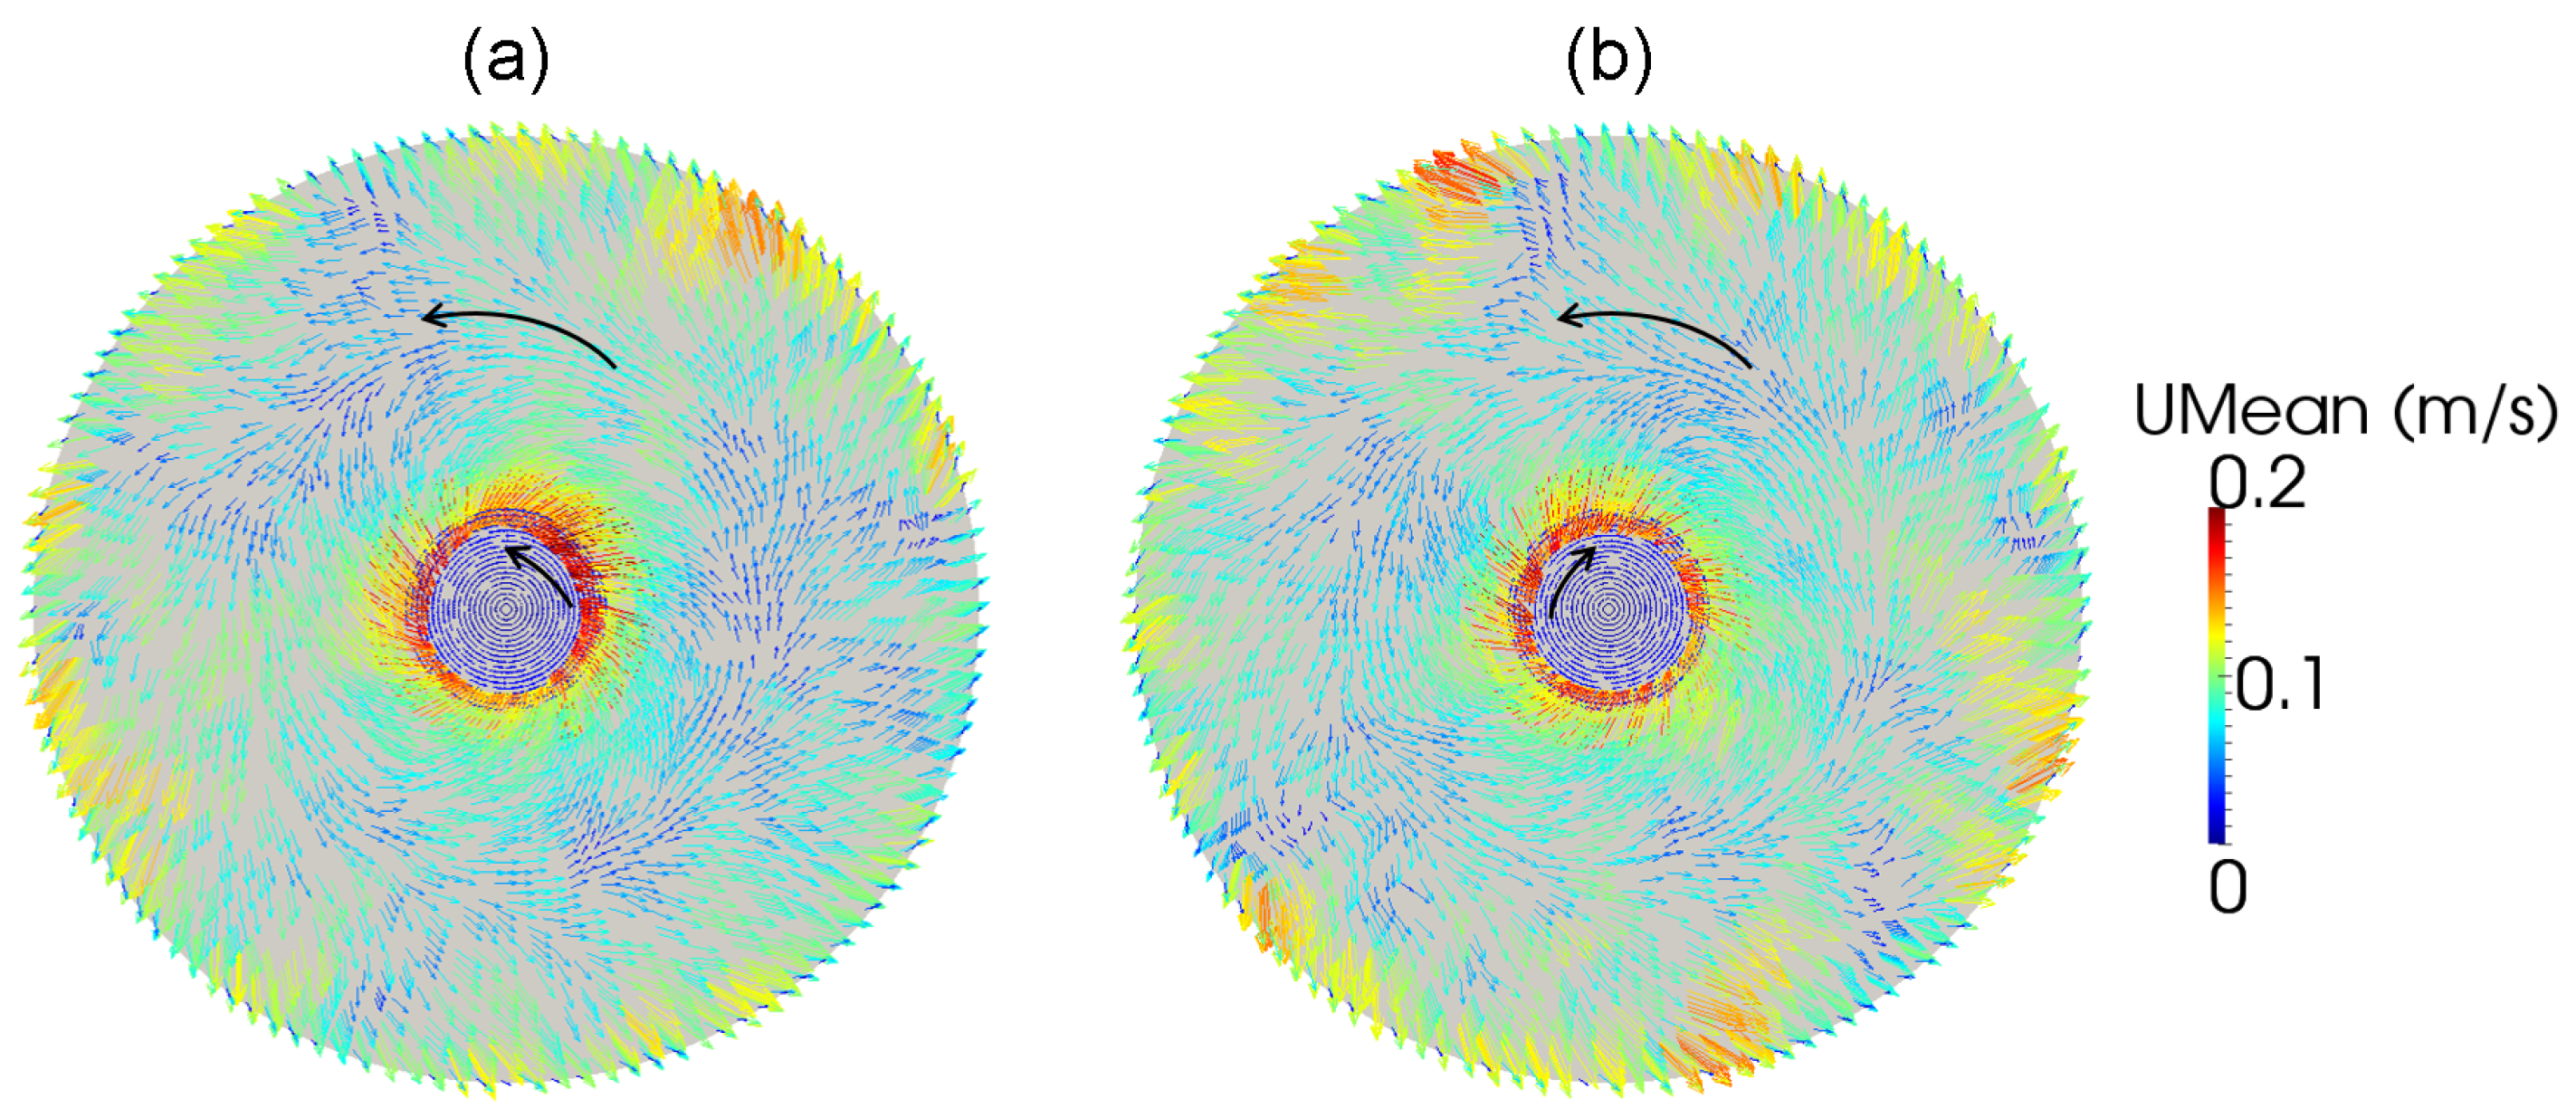
  • When RMF and the seed rotate in the same direction, supersaturation below the seed increases.
We can conclude that the present numerical results suggest the possibility of controlling the melt flow in the TSSG system of SiC by means of an applied RMF and seed rotation. However, it must be mentioned that, since the possible combinations of input parameters of coils, RMF intensity and frequency, and seed rotation rate are many, an optimization study would be an interest as a future work.

Author Contributions

Conceptualization, L.W. and Y.O.; methodology, L.W.; investigation, L.W. and Y.T.; resources, A.S. and Y.O.; data curation, L.W.; writing—original draft preparation, L.W.; writing—review and editing, Y.T. and A.S. and Y.O. and T.U. and S.D.; supervision, A.S. and Y.O.; project administration, Y.O. and T.U.; funding acquisition, Y.O. and T.U. All authors have read and agreed to the published version of the manuscript.

Funding

The research work was financially supported by Grant-in-Aid for Scientific Research (A) (JSPS KAKENHI Grant No. JP18H03839) from the Ministry of Education, Culture, Sports, Science, and Technology of Japan.

Acknowledgments

The authors gratefully acknowledge the computational resources provided by the Research Institute for Information Technology at Kyushu University.

Conflicts of Interest

The authors declare no conflict of interest.

References

  1. Wang, L.; Horiuchi, T.; Sekimoto, A.; Okano, Y.; Ujihara, T.; Dost, S. Three-dimensional numerical analysis of Marangoni convection occurring during the growth process of SiC by the RF-TSSG method. J. Cryst. Growth 2019, 520, 72–81. [Google Scholar] [CrossRef]
  2. Wang, L.; Horiuchi, T.; Sekimoto, A.; Okano, Y.; Ujihara, T.; Dost, S. Numerical investigation of the effect of static magnetic field on the TSSG growth of SiC. J. Cryst. Growth 2018, 498, 140–147. [Google Scholar] [CrossRef]
  3. Takehara, Y.; Sekimoto, A.; Okano, Y.; Ujihara, T.; Dost, S. Bayesian optimization for a high- and uniform-crystal growth rate in the top-seeded solution growth process of silicon carbide under applied magnetic field and seed rotation. J. Cryst. Growth 2020, 532, 125437. [Google Scholar] [CrossRef]
  4. Yamamoto, T.; Adkar, N.; Okano, Y.; Ujihara, T.; Dost, S. Numerical investigation of the transport phenomena occurring in the growth of SiC by the induction heating TSSG method. J. Cryst. Growth 2017, 474, 50–54. [Google Scholar] [CrossRef]
  5. Brückner, F.U.; Schwerdtfeger, K. Single crystal growth with the Czochralski method involving rotational electromagnetic stirring of the melt. J. Cryst. Growth 1994, 139, 351–356. [Google Scholar] [CrossRef]
  6. Ghaddar, C.; Lee, C.; Motakef, S.; Gillies, D. Numerical simulation of THM growth of CdTe in the presence of rotating magnetic fields (RMF). J. Cryst. Growth 1999, 205, 97–111. [Google Scholar] [CrossRef]
  7. Dold, P.; Cröll, A.; Lichtensteiger, M.; Kaiser, T.; Benz, K.W. Floating zone growth of silicon in magnetic fields:: IV. Rotating magnetic fields. J. Cryst. Growth 2001, 231, 95–106. [Google Scholar] [CrossRef]
  8. Kakimoto, K. Effects of rotating magnetic fields on temperature and oxygen distributions in silicon melt. J. Cryst. Growth 2002, 237-239, 1785–1790. [Google Scholar] [CrossRef]
  9. Liu, Y.; Ai, F.; Pan, X.H.; Zhang, Y.; Zhou, Y.F.; Feng, C.D. Effects of rotating magnetic field on Bi12SiO20 crystal growth by vertical zone-melting technique. J. Cryst. Growth 2010, 312, 1622–1626. [Google Scholar] [CrossRef]
  10. Hoshikawa, K.; Kohda, H.; Hirata, H.; Nakanishi, H. Low oxygen content Czochralski silicon crystal growth. Jpn. J. Appl. Phys. 1980, 19, 1–7. [Google Scholar] [CrossRef]
  11. Zhou, X.; Huang, H. Numerical simulation of Cz crystal growth in rotating magnetic field with crystal and crucible rotations. J. Cryst. Growth 2012, 340, 166–170. [Google Scholar] [CrossRef]
  12. Mercier, F.; Nishizawa, S. Comparative numerical study of the effects of rotating and traveling magnetic fields on the carbon transport in the solution growth of SiC crystals. J. Cryst. Growth 2013, 362, 99–102. [Google Scholar] [CrossRef]
  13. Yamamoto, T.; Okano, Y.; Ujihara, T.; Dost, S. Global simulation of the induction heating TSSG process of SiC for the effects of Marangoni convection, free surface deformation and seed rotation. J. Cryst. Growth 2017, 470, 75–88. [Google Scholar] [CrossRef]
  14. Mercier, F.; Dedulle, J.M.; Chaussende, D.; Pons, M. Coupled heat transfer and fluid dynamics modeling of high-temperature SiC solution growth. J. Cryst. Growth 2010, 312, 155–163. [Google Scholar] [CrossRef]
  15. Du, D.X.; Munakata, T. Temperature distribution in an inductively heated CZ crucible. J. Cryst. Growth 2005, 283, 563–575. [Google Scholar] [CrossRef]
  16. Springer, G.Ś.; Wingeier, E.W. Thermal conductivity of neon, argon, and xenon at high temperatures. J. Chem. Phys. 1973, 59, 2747. [Google Scholar] [CrossRef] [Green Version]
  17. Yao, L.; Zeng, Z.; Li, X.; Chen, J.; Zhang, Y.; Mizuseki, H.; Kawazoe, Y. Effects of rotating magnetic fields on thermocapillary flow in a floating half-zone. J. Cryst. Growth 2011, 316, 177–184. [Google Scholar] [CrossRef]
Figure 1. Schematic view of the computational domain used for the TSSG system.
Crystals 10 00111 g001
Figure 2. The thermal field in the furnace in the vertical plane ( y = 0 ) for (a) Case 1, (b) Case 2, and (c) Case 3.
Crystals 10 00111 g002
Figure 3. Lorentz force density distribution in the melt in the vertical plane ( y = 0 ) for (a) Case 1, (b) Case 2, and (c) Case 3.
Crystals 10 00111 g003
Figure 4. The instantaneous flow velocity vectors at the top horizontal plane of the melt for (a) Case 1, (b) Case 2, and (c) Case 3.
Crystals 10 00111 g004
Figure 5. Time-averaged flow velocity vectors and temperature distribution in the vertical plane ( y = 0 ) for (a,b) Case 1, (c,d) Case 2, and (e,f) Case 3.
Crystals 10 00111 g005
Figure 6. Time-averaged supersaturation distribution in the melt at the vertical side for (a) Case 1, (b) Case 2, and (c) Case 3; (d) the computed supersaturation profiles in the melt along the seed surface.
Crystals 10 00111 g006
Figure 7. Flow velocity vectors in the upper plane of the melt under the influence of RMF for (a) Case 4; (b) Case 5; and (c) Case 6.
Crystals 10 00111 g007
Figure 8. Time-averaged velocity vectors (ac) and supersaturation distribution in the melt along the seed surface (df) in the melt at the vertical side for (a,d) Case 4; (b,e) Case 5; and (c,f) Case 6.
Crystals 10 00111 g008
Figure 9. Time-averaged flow velocity vectors in the upper plane of the melt: (a) RMF and seed rotation are in the same direction (Case 7), (b) RMF and seed rotation are in the opposite direction (Case 8).
Crystals 10 00111 g009
Figure 10. Time-averaged velocity vectors and supersaturation distribution in the melt at the vertical side for (a) Case 7 and (b) Case 8; (c) the supersaturation profiles in the melt along the seed for the cases without and with seed rotation.
Crystals 10 00111 g010
Table 1. Physical properties used in the TSSG system [14,15,16].
MaterialsProperty (Symbol)ValueUnit
Si meltDensity ( ρ )2550kg m 3
Viscosity ( μ )8.0 × 10 4 Pa s
Electrical conductivity ( σ e )1.2 × 10 6 S m 1
Thermal conductivity (k)65W m 1 K 1
Specific heat ( C p )1.0 × 10 3 J kg 1 K 1
Surface tension coefficient of temperature ( σ T )−2.5 × 10 4 N m 1 K 1
Thermal expansion coefficient ( β )1.4 × 10 4 K 1
Emissivity ( ϵ )0.3-
GraphiteElectrical conductivity ( σ e )7.54 × 10 4 S m 1
Thermal conductivity (k)108 − 0.0864T + 2.304 × 10 5 T 2 W m 1 K 1
Emissivity ( ϵ )0.66-
InsulatorElectrical conductivity ( σ e )0S m 1
Thermal conductivity (k)0.3W m 1 K 1
Emissivity ( ϵ )0.5-
HeliumElectrical conductivity ( σ e )0S m 1
Thermal conductivity (k)6.35 × 10 2 + 3.1 × 10 4 T
−2.44 × 10 8 T 2
W m 1 K 1
QuartzThermal conductivity (k)1 + 1.25 × 10 3 T W m 1 K 1
Emissivity ( ϵ )0.4-
ChamberEmissivity ( ϵ )0.1-
CoilEmissivity ( ϵ )0.005-
Table 2. Input parameters used for induction coils.
CaseRF Frequency
(kHz)
RF Current
(A/m 2 )
RMF Intensity
(mT)
RMF Frequency
(Hz)
Seed Rotation
(rpm)
1108.57 × 10 6 ---
2256.285 × 10 6 ---
3405.285 × 10 6 ---
4108.57 × 10 6 350-
5256.285 × 10 6 350-
6405.285 × 10 6 350-
7256.285 × 10 6 35060
8256.285 × 10 6 350−60

