Article

Deuteration Effects on the Transport Properties of (TMTTF)2X Salts

1
1. Physikalisches Institut, Universität Stuttgart, Pfaffenwaldring 57, 70569 Stuttgart, Germany
2
Institute for Molecular Science, Myodaiji, Okazaki 444-8585, Japan
*
Author to whom correspondence should be addressed.
Crystals 2020, 10(12), 1085; https://doi.org/10.3390/cryst10121085
Submission received: 20 October 2020 / Revised: 16 November 2020 / Accepted: 24 November 2020 / Published: 27 November 2020
(This article belongs to the Special Issue Organic Conductors)

Abstract

:
The electronic properties in the quasi-one-dimensional Fabre salts are strongly affected by electronic correlations along the molecular stacks, but also by the interactions with the anions located in a cage that is formed by the methyl end groups. We systematically compare the charge transport in deuterated and protonated (TMTTF) 2 X salts with the anions X = Br, PF 6 , SbF 6 , and ClO 4 , ranging from Mott and Efros–Shklovskii variable-range hopping to activated band transport with a temperature dependent energy gap. The strong dependence of charge localization and ordering on the anion size and deuteration confirms the subtle structural involvement of the anions in the charge transport along the TMTTF stack.

Graphical Abstract

1. Introduction

Fascinated by the wealth of exciting physical phenomena summarized in the temperature-pressure phase landscape plotted in Figure 1, the Fabre salts (TMTTF) 2 X—here TMTTF denotes tetramethyl-tetrathiafulvalene and X is a monovalent anion—have been intensely investigated since their discovery in the 1970s [1,2,3].
Under ambient conditions, these salts possess a quasi-one-dimensional metallic state, where the large anisotropy of their electronic properties is based in their stacked molecular structure. With decreasing temperature, the localization of charges takes place over a broad temperature range—a crossover rather than a phase transition. Salts with larger anions, like X = SbF 6 and TaF 6 , exhibit a charge-ordering phase transition at T CO below the localization temperature T ρ . At much lower temperatures T N < 10 K, these compounds undergo a transition to an antiferromagnetic ground state. For salts with smaller anions, e.g., X = PF 6 and AsF 6 , a weaker charge order is observed at temperatures between 100 and 50 K [4]. In addition, these compounds exhibit a spin-Peierls ground state below 20 K. For compounds with even smaller anions, such as, X = Br, no clear charge ordering can be observed; albeit there are indications that weak charge disproportionation takes place around 50 K [5,6]. Here again, antiferromagnetic ordering occurs at low temperatures. Salts containing tetrahedral anions, such as ClO 4 , ReO 4 and BF 4 , also exhibit some ordering of the anions; for that reason, they are not included in Figure 1. This structural phase transition normally occurs at temperatures T AO well below the charge-ordering temperature [7,8,9]. In (TMTTF) 2 ClO 4 , however, no charge ordering is observed at all; but the anion transition T AO occurs below T ρ .
As indicated in the phase diagram (Figure 1), the transitions (going from left to right) can be induced by increasing the external pressure by a few GPa. A similar effect can be seen when ‘internal pressure’ is increased, i.e., by reducing the anion size. Why this is so can be better understood when considering the molecular structure of these salts depicted in Figure 2: The anions, which are segregated between the TMTTF stacks, are positioned in a cage formed by the methyl groups terminating the TMTTF molecules. In a first approximation, the size of the anions determines the separation of the molecular stacks. The degree of this anion confinement in the methyl end-group cage also affects the anion ordering in the tetrahedral anion salts. Even more important, the anion-stack interaction enhances the dimerization within the TMTTF stacks and consequently suppresses charge order [10]. In other words, how freely the anion can move within the confined space affects the anisotropic charge transport in the salt as well as how charges localize and order with decreasing temperature down to their antiferromagnetic and spin Peierls ground states [11].
In order to study these interactions—and more specifically, the effect of confinement of the anion within its methyl end-group cage—we compare protonated with deuterated Fabre salts: (TMTTF) 2 X, for anions X = Br, PF 6 , SbF 6 , and ClO 4 . When the hydrogen atoms in the CH 3 group are exchanged with the heavier deuterium isotope, the dynamics and interaction between the anion and its molecular neighbors are modified. A close comparison of the dc transport results obtained for deuterated and protonated samples should, therefore, provide valuable information on the electronic properties and elucidate further details of this intricate interplay.
In the present paper—after providing details of the experiments in Section 2—we present and discuss the results in Section 3. In the subsequent Section 4, the data are analyzed further with respect to various charge transport mechanisms.

2. Experimental Details

Single crystals of deuterated and protonated (TMTTF) 2 X with X = Br, PF 6 , SbF 6 , ClO 4 were grown electrochemically in an H-type glass cell under ambient conditions, as described in Reference [7]. Needle shaped crystals, ∼1–2 mm long, ∼100 μ m wide, and less than 100 μ m thick, were harvested after several weeks. Here, we denote the hydrogenated (H 12 C 10 S 4 ) 2 X as (H 12 -TMTTF) 2 X and the deuterated analogue (D 12 C 10 S 4 ) 2 X is labelled (D 12 -TMTTF) 2 X.
Direct current (dc) resistivity measurements were performed across a temperature range between 300 K and 4 K, at a ramp rate of | 0.3 K / min | in a glass cryostat using liquid nitrogen and helium for cooling, while the sample chamber was flooded with helium gas to ensure thermal contact between the sample and the cryogenic chambers. The dc resistivity was measured along the molecular stacking direction, i.e., the long needle axis, referred to as the a-axis of the crystal (see Figure 2). In order to perform four-point measurements, four gold wires were attached to the crystal needle with carbon paste. Samples were anchored on a sapphire plate to ensure good thermal contact and electrical insulation from the cryostat’s sample chamber. Data were collected while cooling down as well as while warming up. A Keithley 2612B system source meter and a Keithley 2182 nanovoltmeter were used to perform resistivity measurements. In order to protect the sample from overheating, the current was set to a constant value; the voltage was ramped across four linearly spaced points around 0 V to check the samples’ Ohmic behavior when recording data at a certain temperature.
While the anisotropy of the Fabre salts is interesting by itself, and was elaborated upon in the previous study by Köhler et al. [7], here we focus on measurements along the a-axis, where the data quality is superior and most of the relevant information can be extracted.

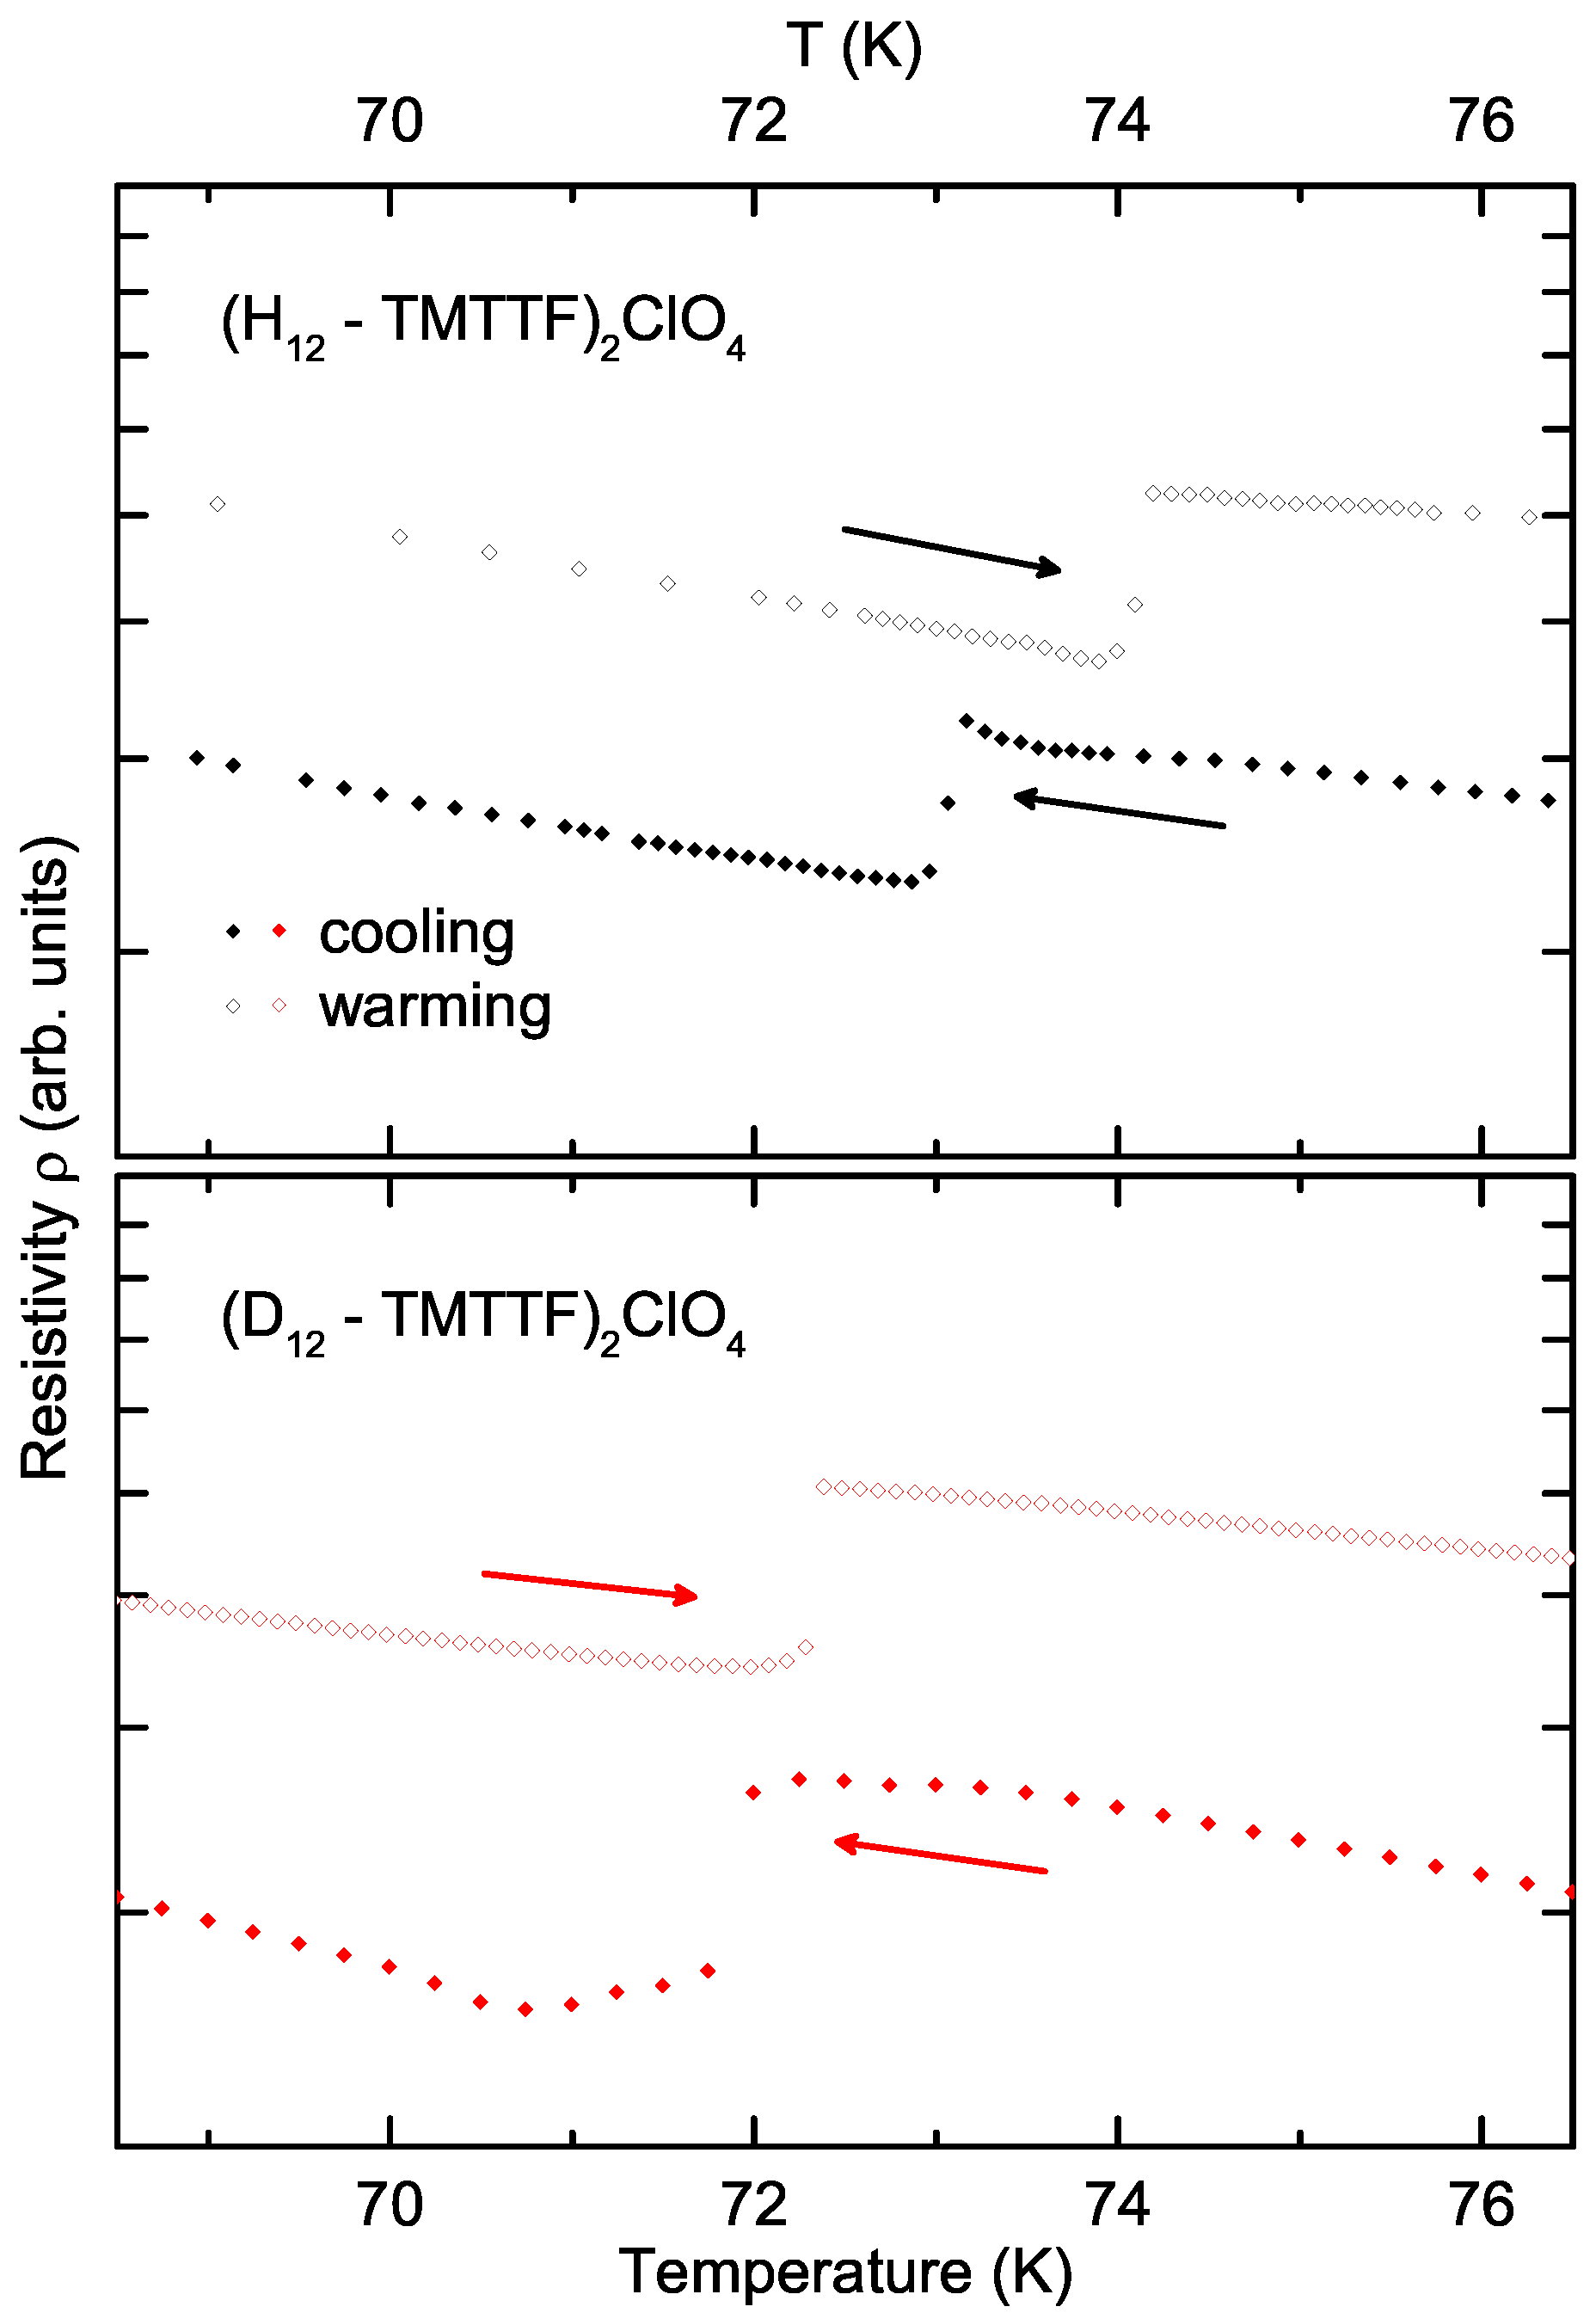
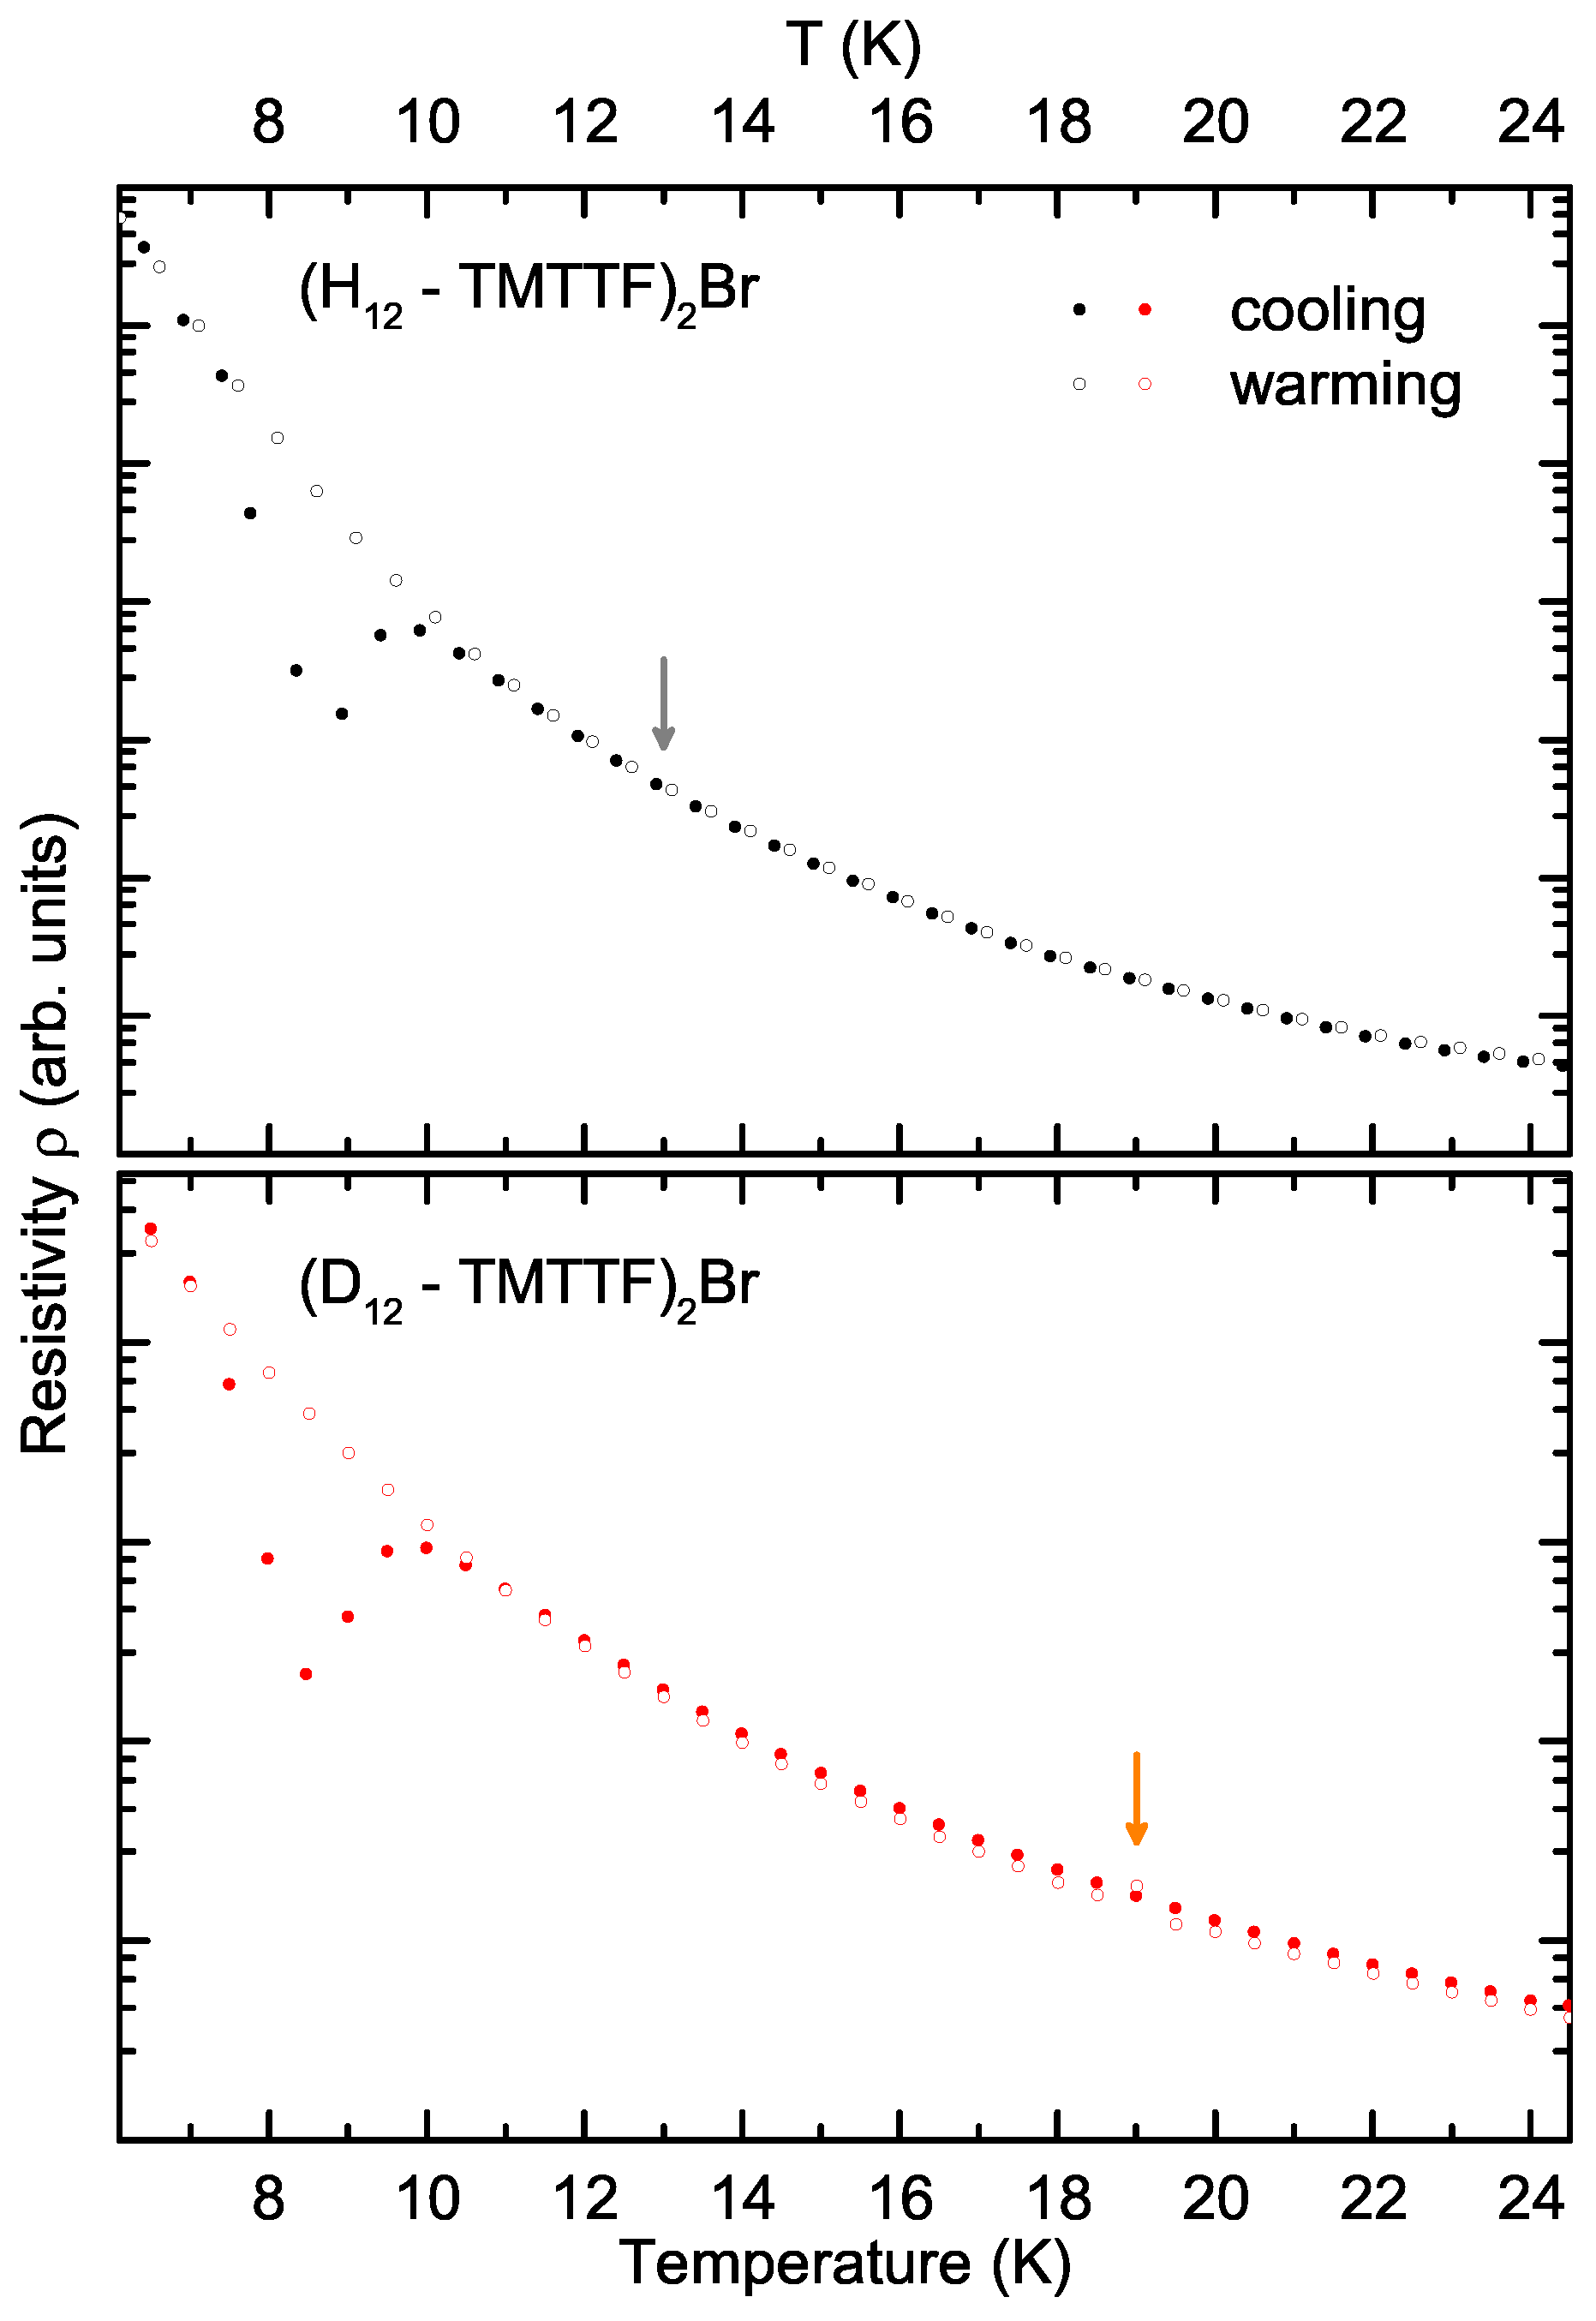
3. Results and Discussion

The recorded dc resistivity versus temperature, ρ ( T ) is plotted in Figure 3 for (TMTTF) 2 X, with the anions X = Br, PF 6 , SbF 6 , ClO 4 , where in each of the panels, the respective protonated (black open squares) and deuterated (red solid diamonds) crystals are compared. All show an overall increase in resistivity upon cooling. The behavior can be typically traced up to the order of 10 6 Ω cm; beyond that bound, sample heating and non-Ohmic properties prevent reliable data acquisition. In the case of the rather good conductor (TMTTF) 2 Br, data are recorded down to T = 4 K. For the salts with larger anions, the resistivity measurements become non-Ohmic already below 20 K or even higher temperatures. The resistivity curve of (TMTTF) 2 Br lies below its deuterated analogue, while for the other salts, the opposite behavior is observed. Arrows mark the charge order (CO) transition for the (TMTTF) 2 Br, (TMTTF) 2 PF 6 and (TMTTF) 2 SbF 6 salts, and the anion order (AO) transition in the (TMTTF) 2 ClO 4 samples (grey arrows for protonated, orange for deuterated crystals).
Table 1 summarizes all phase transition temperatures for the compounds under study. Upon being cooled down from room temperature, the samples exhibit metallic behavior, i.e., the resistivity decreases slightly with lowering temperature. Charges gradually localize and the metallic conductivity freezes: T ρ is the localization temperature which occurs as a broad global minimum in the temperature dependent resistivity curves (Figure 3) and is defined as the temperature where the energy gap Δ ( T ) = 0 in Figure 8 below. The change in localization temperature upon deuteration (see Table 2), i.e., Δ T ρ = T ρ H T ρ D , ranges from tens to slightly more than one-hundred Kelvin. T ρ increases upon deuteration for the Br, PF 6 , and SbF 6 salts, but decreases in (TMTTF) 2 ClO 4 . Because this localization minimum is so shallow and broad, the uncertainties are rather large, as is reflected in the substantially differing T ρ values reported in literature [7,12].
For most Fabre salts, a transition to a 4 k F charge ordered state occurs at T CO . In our compounds containing centrosymmetric anions, this transition is visible as a steepening in the slope of the resistivity curve observed upon cooling, and is especially strong in (TMTTF) 2 SbF 6 , while being less pronounced in (TMTTF) 2 PF 6 and (TMTTF) 2 Br, see Figure 3. This observation is in agreement with the results previously reported [7]. For (TMTTF) 2 PF 6 and (TMTTF) 2 Br the transitions in deuterated and protonated crystals are difficult to infer from the raw data ρ ( T ) , but can be identified in the temperature dependent energy gap plotted in Figure 8. The CO transition temperatures, as marked in our data, are listed in Table 1 [6,7,12,13,14]. T CO increases upon deuteration, as seen in Table 2. The enhancement of the CO transition temperature is largest for small anions [10]. This can be explained in terms of the competition between CO and intrastack dimerization: with the latter decreasing upon deuteration, the CO transition shifts to higher T CO [15].
Non-centrosymmetric anions can arrange in a regular alternation pattern; in the case of (TMTTF) 2 ClO 4 a clear anion ordering is observed at T AO = 73 K. During this transition, a 2 k F superstructure forms along the stacking direction [12], which results from the orientation ordering of the tetrahedral anions in their TMTTF methyl cavity. Just to be clear, the anion order is mediated via the TMTTF stacks and not a direct interaction. For that reason, the coupling via the methyl groups is crucial. A zoomed-in view of the resistivity curves around this transition is presented in Figure 4. Here the cooling (solid symbols) and heating (open symbols) curves of the protonated (black symbols, top curve) and deuterated (red symbols, bottom curve) salts are plotted on a logarithmic resistivity and linear temperature axis. The hysteresis of this transition is more pronounced in the protonated sample ( T AO , H warming T AO , H cooling = 1 K) than in the deuterated sample ( T AO , D warming T AO , D cooling = 0.4 K). The hysteresis is well known from salts with non-centrosymmetric anions [7,8,9] and is an indicator of the first order nature of the AO phase transition. The broader hysteresis implies a stronger interaction of the anions with the caging methyl groups. In other words, if no hysteresis is present, there is basically no potential barrier preventing the phase transition. However, since the difference in hysteresis between the deuterated and protonated samples lies within the error margins of the experiment, it will not be further analysed here [19]. The other striking characteristic of the AO transition is the downward (upward) jump in resistivity upon cooling (heating). The tiny variation in T AO brought about by deuteration ( Δ T AO = 1.2 K)—as summarized in Table 2—is about the uncertainty of this measurement. This agrees with previous experiments that could not resolve any difference upon deuteration [10]. This observation indicates that the interaction between the anion and TMTTF stacks depends, to a lesser extent, on the hydrogen bonds of the methyl groups (indicated by the dotted lines and red left arrow in Figure 5), and must therefore depend more strongly on the Coulomb interaction between the anion ligands and the TMTTF molecules’ sulphur atom (green downward arrow) [10,11].
The structural aspects of the charge and anion ordering transitions have been discussed in detail by Pouget [11,12,20]. Figure 5 illustrates the processes involved in stabilizing the states. Charge order in salts containing centrosymmetric anions (PF 6 , SbF 6 , and possibly Br) are most likely stabilized via the deformation of the methyl end group cavity—the process marked by the red left arrow. In this process, the displacement of the anion, X, polarizes the hydrogen bond network inside the cavity. This, in turn, causes a displacement of the charge on the σ -bonds connected to the hydrogen bonds, shifting the σ -electrons towards the center of the TMTTF molecules, which stabilizes the excess π -holes on the molecules (indicated by the grey ovals in Figure 5). This hypothesis is sustained by the fact that T CO rises with larger anion size and upon deuteration—in both cases, the contact between the anion and its cavity periphery, i.e., the methyl end groups, increases. The second process proposed in reference [11], indicated by the green downward arrow in Figure 5, is that the anion moves towards the sulphur atom of the TMTTF molecule. This directly shortens the anion–sulphur contact distance and would also stabilize the enhanced π -hole density of the TMTTF molecule towards which the anion moves (different π -hole distribution than for the first process; not indicated in Figure 5). This second process is not substantiated experimentally for the charge-order transition, since structural refinement provides no evidence of a sizeable change in the anion-sulphur distance below T CO for the centrosymmetric anion salts [11]. For the anion ordering transition, however, this second process seems to be a likely driving force in most tetrahedral anion salts, even though only very weak changes in the anion-sulphur distance have been reported below T AO for (TMTTF) 2 ClO 4 [11].
Table 1 and Table 2 list the transition temperatures and the difference resulting from deuteration for the spin-Peierls transitions T SP in (TMTTF) 2 PF 6 and the antiferromagnetic transitions T N in (TMTTF) 2 SbF 6 and (TMTTF) 2 Br samples as well, obtained by magnetic probes [18,21]. From our transport experiments on both protonated and deuterated (TMTTF) 2 Br down to T = 4 K, we can access the antiferromagnetic transitions located at T N = 13 K and 19 K, respectively [11,14]. Figure 6 zooms into this low-temperature region of the warming (open symbols) and cooling (solid symbols) ρ ( T ) curves of the protonated (black symbols, top panel) and deuterated (red symbols, bottom panel) Br-salts. T N , as reported in Table 1, is marked by the grey (orange) arrow for the protonated (deuterated) crystal. The antiferromagnetic transition cannot be distinguished for the (H 12 -TMTTF) 2 Br compound, while there seems to be a slight bump in the warming curve of (D 12 -TMTTF) 2 Br at 19 K. This, however, does not exceed the experimental uncertainty sufficiently and should therefore not be interpreted as strong indication of the antiferromagnetic transition. Temperature dependent resistivity measurements performed by Tomić et al. have revealed anomalies at T = 12.5 K and 22 K in protonated (TMTTF) 2 Br [22]. Our cooling curves in Figure 6 show no clear evidence of an anomaly around 22 K. However, between 10 K and 7 K, the cooling curves of both crystals exhibit a pronounced dip with a minimum at 9 K (8 K) for the protonated (deuterated) salt. The underlying cause for this pronounced anomaly is as yet unclear.

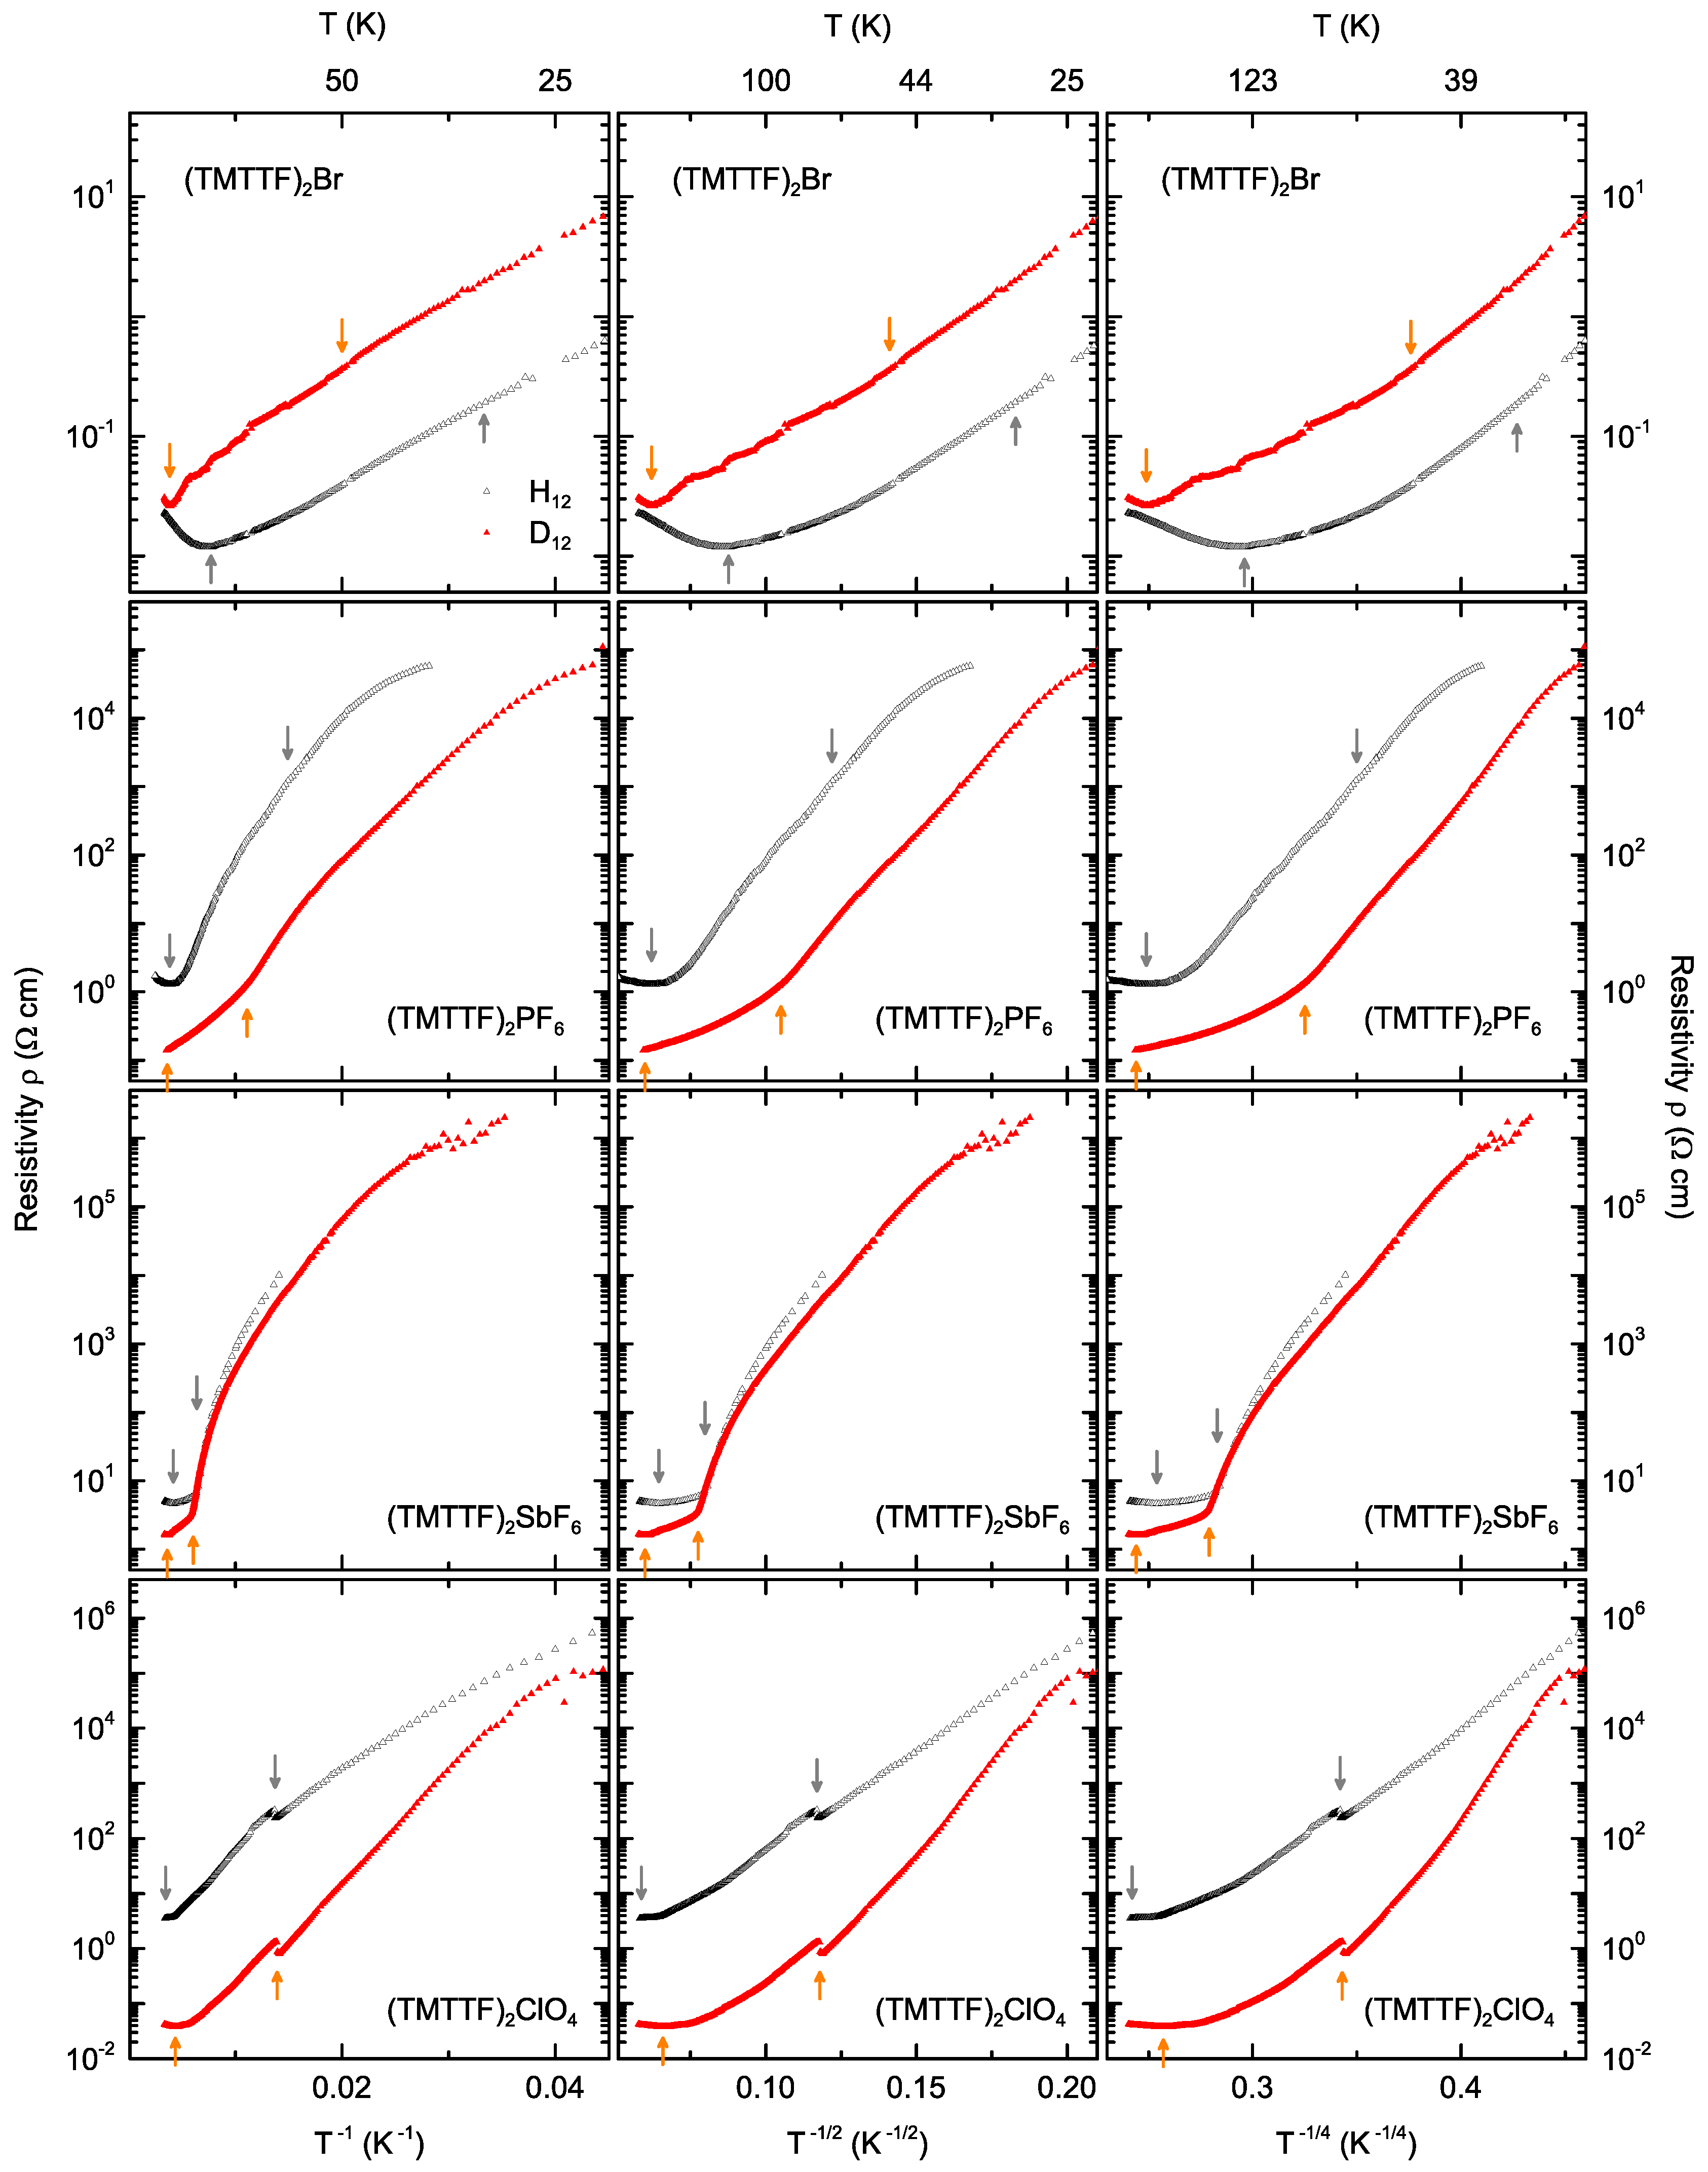
4. Analysis of the Transport Mechanisms

In the following, we analyze and discuss the charge-transport mechanisms and the temperature dependent energy gap, respectively.

4.1. Charge Transport Mechanisms

There are a variety of models to describe the charge transport in organic compounds, ranging from the classical band transport to various hopping transport mechanisms. The underlying mechanism of band transport involves a delocalized molecular wavefunction over the entire volume of the crystalline sample with mean free paths larger than the inter-site distance—usually occurring in highly ordered systems. Hopping transport, on the other hand, is described by transitions between localized sites via tunneling or overcoming potential barriers, the mean free path being on the order of the inter-site distance, and mostly governs electronic properties in more disordered systems. Since the appropriate models depend on the concentration of localized states, carrier density, and electric field strength (among other factors), charge transport within the same sample may have to be described using different models, depending on the temperature range and applied field.
Band transport is applicable for high carrier densities and described by the Arrhenius model, based on an activated temperature dependence of the charge carrier concentration. A linear slope on a graph of logarithmic resistivity versus inverse temperature (left column in Figure 7) indicates band transport in the respective temperature range. Explicitly, the Arrhenuis law is given by
ρ ( T ) = ρ 0 exp Δ T ,
where the energy gap Δ is assumed to be temperature independent and ρ 0 is a constant prefactor [23]. This thermally activated transport was mostly observed along the c-axis of the crystal [7], i.e., perpendicular to the axis investigated here.
Variable range hopping is a phonon-activated process where charge carriers hop between localized states. This effect can be described in terms of a general formula proposed by Mott:
ρ ( T ) exp T 0 T 1 / γ ,
where γ = d + 1 is related to the dimension d of the system [24]. Mott variable-range hopping in three dimensions (right column in Figure 7) assumes a constant density of states. Efros and Shklovskii showed that, at sufficiently low temperatures, the density of states near the Fermi energy is not constant, but vanishes linearly [25,26,27], thus accounting for the so-called Coulomb gap, and resulting in a resistivity dependence of Equation (2) with γ = 2 (central column in Figure 7) in all dimensions—this transport regime being referred to as Efros–Shklovskii variable-range hopping [7,28,29]. For some samples, the disorder may be so high that the Coulomb gap is dominant at all temperatures, leading to overall Efros–Shklovskii hopping. In samples displaying relatively low disorder, on the other hand, the energy scale is such that the carriers may have enough energy to overcome the Coulomb gap at all measurable temperatures, meaning that the density of states is practically constant, leading to overall Mott variable-range hopping [25]. At intermediate disorder, it may be possible to see a crossover from Mott to Efros–Shklovskii hopping with decreasing temperatures in the same samples [30]. Köhler et al. found three-dimensional Mott hopping transport to dominate below 60 K along the stacking axis [7], i.e., the orientation investigated in the present study.
For data analysis, the resistivity was plotted on a logarithmic y-axis versus the inverse temperature, i.e., T 1 , as well as T 1 / 2 , and T 1 / 4 , in Figure 7. A linear slope in the Arrhenius plot would mean that band transport is valid across the applicable temperature range. Similarly, a linear slope in the ln { ρ } versus T 1 / 2 plot indicates Efros–Shklovskii variable-range hopping, while a linear slope in the ln { ρ } versus T 1 / 4 plot is an indication of three-dimensional hopping. Figure 7 compares all three transport models (from left to right) for all four Fabre salts under study (from top to bottom) with protonated and deuterated molecules (open black and solid red symbols, respectively). The arrows indicate the transition temperatures: the localization temperature T ρ being the left most arrows in each panel, and the ordering transitions T CO or T AO being the right arrows (all other transition temperatures were omitted for clarity). The bottom axes are linear in T 1 , T 1 / 2 , and T 1 / 4 , from left to right, while the top axes indicate the converted temperature in Kelvin. Linear fits to the slopes were performed for the temperature ranges 300 K to T ρ , T ρ to T CO or T AO , and temperatures below T CO or T AO . The results are summarized in Table A1 (see Appendix A).
The range above T ρ shows metallic behavior, i.e., the resistivity decreases upon cooling, and none of the above models apply. Below the localization temperature, all samples show an upturn in resistivity, indicating semiconducting behavior, which can be described by activated band transport or variable-range hopping.
In the range between T ρ and T AO , the protonated (TMTTF) 2 Br salt exhibits a slight kink around T = 60 K. Above and below this kink, straight lines could be fitted over similar temperature ranges for all three transport models; hence, no firm conclusion can be drawn from the data about the dominant transport mechanism in this sample. For the deuterated compound of the Br-salt, the Efros–Shklovskii variable-range hopping model could be fitted across the largest temperature range, 255 K–54 K. This may be taken as an indication that the system is rather disordered, as mentioned in the discussion above. The deuterated compound shows a kink around 25 K, in the range between T CO and T N , which is close to the 22 K anomaly reported by Tomić et al. [22].
In (H 12 -TMTTF) 2 PF 6 , the resistivity follows a behavior corresponding to three-dimensional Mott variable-range hopping that extends beyond the T ρ - T CO range to low temperatures. The deuterated counterpart has a kink around T = 160 K and exhibits variable-range hopping across an extended range below T CO as well. This indicates that the (TMTTF) 2 PF 6 salts are more ordered systems than the deuterated Br-salt.
The other salt containing an octahedral anion, (TMTTF) 2 SbF 6 , exhibits three-dimensional variable-range hopping according to Mott from T ρ to T CO with a kink around T = 190 K in the protonated compound, extending to lower temperatures with another kink. The deuterated analogue, on the other hand, shows no clear match to any of the three models at higher temperatures. However, in the low-temperature range, it might exhibit some variable-range hopping.
(TMTTF) 2 ClO 4 does not undergo any pure CO transition, but a pronounced AO transition slightly above 70 K. No significant change in slope is expected across a simple structural transition at T AO when the transport mechanism remains the same; this was observed in other Fabre salts with tetrahedral anions [7,8], for instance. In the Arrhenius plot (left column of Figure 7), we find the slope before and after the AO transition to be rather similar only for the deuterated compound. In other words, (D 12 -TMTTF) 2 ClO 4 exhibits an activated behavior with the same energy gap Δ on both sides of the phase transition, as analyzed in Table A1 (see Appendix A). For the protonated sister compound, however, the slope in the Arrhenius plot differs before and after the AO transition. The hopping model in the central column of Figure 7, however, may indicate that the sample is so disordered that Efros–Shklovskii variable-range hopping is present across the entire temperature range.
To summarize our findings on the discussed transport mechanisms at play in the deuterated and protonated Fabre salts investigated—between room temperature and their localization crossover temperature, T ρ – all compounds display metallic behavior. Below this, all samples show semiconducting behavior, which can be described best by an activated band transport model, or variable-range hopping. The resistivity of (D 12 -TMTTF) 2 Br follows Efros–Shklovskii model across a broad temperature range, indicating it to be a more disordered system than the other compounds. (H 12 -TMTTF) 2 SbF 6 and both types of (TMTTF) 2 PF 6 could be fitted with Mott variable-range hopping over a broad temperature range extending below their respective charge-order transition temperatures—an indication for ordered systems. This finding agrees with previous studies [7], where variable-range hopping transport was found to dominate below T = 60 K in octahedral (TMTTF) 2 Xsalts. (D 12 -TMTTF) 2 ClO 4 could be fitted by an Arrhenius model with the same slope above and below its anion transition, indicating band transport with a constant activation energy across the phase transition, while the behavior observed in the protonated sister compound is best fitted by Efros–Shklovskii variable-range hopping across the AO phase transition, indicating a temperature dependent energy gap in this system.

4.2. Energy Gap

The above discussion illustrates that band transport is not necessarily the best overall model applicable to these samples; certainly, the electrical resistivity ρ ( T ) cannot be simply described by a temperature independent energy gap, like in Equation (1). In particular, when considering the charge ordering as a second-order phase transition, the energy gap should follow a mean-field temperature dependence [7]. In order to investigate this further, the temperature dependent gap
Δ ( T ) = ln ρ ( T ) ρ 0 T ,
was deduced from Equation (1) and plotted in Figure 8 for all samples under investigation. Equation (3) assumes constant ρ 0 , the values of which are listed in Table 3.
The presentation of the temperature dependent energy gap in Figure 8 makes all discussed phase transitions at T ρ , T CO , and T AO clearly visible; one has to keep in mind, however, that the values in the metallic regime are not physically meaningful. Below T ρ different regions of varying gap-behavior can be distinguished. For (TMTTF) 2 Br the energy gap Δ 0 is attributed to the bond dimerization resulting in unequal charge distribution between molecules [7]. Further cooling through T CO causes stronger charge disproportionation between the molecules. Because of the second-order nature of this transition, the corresponding energy gap shows a BCS-like increase. The AO transition occuring in tetrahedral samples at lower temperatures was also found to contribute in a mean-field fashion. The total energy gap is given by [7]
Δ ( T ) = Δ 0 2 + [ Δ CO ( T ) + Δ AO ( T ) ] 2 .
The gaps extracted from Figure 8 are summarized in Table 4, where further details are given. The localization energy gap, Δ 0 , is highest in the (TMTTF) 2 PF 6 and (TMTTF) 2 ClO 4 compounds, where deuteration reduces the value. The opposite is true for (TMTTF) 2 Br and (TMTTF) 2 SbF 6 salts, which show similar values for this gap. The charge-order gap, Δ CO , exhibits a clear trend, increasing with anion size from just above 100 K for the protonated Br-salt to almost 600 K in the deuterated SbF 6 -compound. The anion gap, Δ AO , for (TMTTF) 2 ClO 4 was read off directly from the plot. Since these compounds show no CO transition and the AO causes only little change of slope in the Arrhenuis plot, Δ AO can be set to zero for this special case [7]. The abrupt changes in resistivity are attributed to the prefactor ρ 0 in Equation (1). The fact that the value of Δ AO is smaller than Δ 0 for (TMTTF) 2 ClO 4 seems to be unphysical. For the deuterated sample, however, a simple Arrhenius fit could be identified rather well (Figure 7), and correspondingly no discrepancies were found in the activation energy values. Hence, the ClO 4 -salts seem to pose a challenge to the analysis proposed so far and further investigation is necessary to clarify this case. The total energy gap—last column in Table 4—also reveals a trend of increasing gap energy with increasing anion size. For all samples, except the (TMTTF) 2 PF 6 salts, the deuterated compounds exhibit higher total gap energies than their protonated counterparts.
The increase in charge order gap energy and total gap energy with increasing anion size and upon deuteration (in general), indicates that the deformation of the methyl end-group cavity has a significant effect on the charge order transition—and thus confirms the deuteration and anion size effect shown in the trend of the change in T CO . In a next step, local probes should be applied to monitor the charge distribution in these compounds, and in particular, how it varies with temperature and deuteration.

5. Summary

This comparative study between deuterated and protonated Fabre salts aimed to advance our understanding how the methyl end-groups effect the electronic properties in quasi-one-dimensional charge transfer salts. The different anions are dynamically confined by the terminal methyl groups and their interaction affects the electronic properties and phase transitions. The dc resistivity measurements performed along the stacking axis of the centrosymmetric and tetrahedral (TMTTF) 2 X salts and the data analysis, considering different transport models and a temperature dependent energy gap, have ascertained that the charge ordering transition is strongly affected by the methyl end-group cavity in which the anions are trapped: The change in T ρ and T CO , as well as the energy gap, increase upon deuteration and with increasing anion size. For the centrosymmetric anion salts, variable range hopping was confirmed to describe the charge transport in these samples best. (TMTTF) 2 ClO 4 showed band transport behavior across its anion ordering phase transition. Overall, deuteration seems to have a similar effect on the system as an increase in anion size.

Author Contributions

Conceptualization and supervision, M.D.; synthesis of deuterated molecules, T.N.; investigation and analysis, A.R.; writing and editing, A.R. and M.D. All authors have read and agreed to the published version of the manuscript.

Funding

The project was supported by the Deutsche Forschungsgemeinschaft (DFG).

Acknowledgments

We acknowledge continuous crystal growth and thorough sample preparation by G. Untereiner; deuterated TMTTF crystals were grown by A. Moradpour. We acknowledge fruitful discussions with E. Rose and finally thank R. Rösslhuber and D. Liu for experimental support.

Conflicts of Interest

The authors declare no conflict of interest.

Appendix A

Table A1. Summary of linear fit parameters of the plots ρ ( T ) vs. T 1 , T 1 / 2 , and T 1 / 4 in Figure 7.
#Linear Fit# over
Entire# Temp Range
Best# Linear# FitLinear Fit# over
Entire# Temp Range
Best# Linear# FitLinear Fit# over
Entire# Temp Range
Best# Linear# Fit
(TMTTF) 2 X 300 K- T ρ T ρ T CO or T AO T AO or T CO T N or T SP or 4 K
H 12 –Bractual temperature range (K)300–130130–3030–13
T 1 best fit temp range (K) 300–180 130–6060–30 24–13
slope−89.595−106.55448.07838.04852.804 54.75757.149
y-intercept−1.352−1.282−2.349−2.233−2.457 −2.598−2.741
T 1 / 2 best fit temp range (K) 300–181 130–6160–27 24–13
slope−11.206−14.08212.4628.11816.354 24.57926.979
y-intercept−1.005−0.819−3.126−2.662−3.711 −5.317−5.899
T 1 / 4 best fit temp range (K) 300–167 130–6349–27 22–10
slope−6.044−7.0768.8195.16713.597 25.02629.727
y-intercept−0.1930.069−4.671−3.482−6.529 −11.669−13.983
D 12 –Bractual temperature range (K)300–260260–5050–8
T 1 best fit temp range (K) 295–260 157–174173–8989–48 50–2525–10
slope−127.055−119.42171.181141.63174.23254.111 40.05252.86242.037
y-intercept−1.096−1.124−1.789−2.146−1.789−1.537 −1.050−1.461−1.002
T 1 / 2 best fit temp range (K) 295–260 255–54 50–2525–10
slope−15.423−14.36214.05313.994 18.51417.77721.234
y-intercept−0.628−0.692−2.443−2.438 −3.047−2.942−3.640
T 1 / 4 best fit temp range (K) 295–261 257–177186–6767–48 50–2525–10
slope−7.535−6.9958.63810.2248.54711.621 17.35714.51021.126
y-intercept0.2920.159−3.751−4.155−3.730−4.816 −7.047−5.896−8.875
H 12 –PF 6 actual temperature range (K)300–260260–6767–19 (data ends at 35)
T 1 best fit temp range (K) 300–260 200–107109–67 100–51
slope−34.808(not linear)299.215371.644235.220 132.518211.301
y-intercept0.240 −1.166−1.650−0.419 1.274−0.124
T 1 / 2 best fit temp range (K) 300–260 181–65 124–47
slope−4.125(not linear)53.10656.448 38.39250.922
y-intercept0.363 −3.432−3.758 −1.483−3.168
T 1 / 4 best fit temp range (K) 300–260 188–44 67–35
slope−1.974(not linear)31.61034.964 29.290(see previous range)
y-intercept0.598 −8.103−9.142 −7.059(see previous range)
D 12 –PF 6 actual temperature range (K)300–280280–9090–13 (good data up to 20)
T 1 best fit temp range (K) 300–280 239–119157–90 59–30
slope4.722(too small)124.022115.341139.517 148.637151.236
y-intercept−0.869 −1.325−1.282−1.458 −1.221−1.113
T 1 / 2 best fit temp range (K) 300–280 287–161163–101 87–26
slope0.532(too small)20.03814.25323.332 46.48647.952
y-intercept−0.883 −2.115−1.710−2.426 −4.693−4.879
T 1 / 4 best fit temp range (K) 300–280 280–155163–103 89–23
slope0.268(too small)11.2137.76113.707 36.14436.353
y-intercept−0.917 −3.675−2.764−4.438 −11.642−11.717
H 12 –SbF 6 actual temperature range (K)300–240240–157157–8 (good data ends at 70)
T 1 best fit temp range (K) 296–251 228–165 (not linear) 110–70 (not linear)
slope−47.048−54.09770.62566.416 393.592273.853
y-intercept0.8590.8840.3510.367 −1.1770.196
T 1 / 2 best fit temp range (K) 296–249 219–165 (not linear) 157–114112–70
slope−5.746−6.53210.12310.124 78.505121.77159.678
y-intercept1.0341.081−0.011−0.018 −5.042−8.825−3.043
T 1 / 4 best fit temp range (K) 297–252 234–182199–157 157–114116–71
slope−2.734−3.2095.4133.5897.915 49.33971.70738.894
y-intercept1.3591.475−0.734−0.256−1.421 −12.770−19.378−9.373
D 12 –SbF 6 actual temperature range (K)300–280280–166166–8 (good data to 27)
T 1 best fit temp range (K) 300–286 231–181 111–64 (not linear)
slope−101.615−126.631134.304128.026 203.142247.267
y-intercept0.5600.644−0.296−0.274 0.3360.176
T 1 / 2 best fit temp range (K) 300–287 231–184 112–44
slope−11.269−14.92618.24317.713 52.76252.129
y-intercept0.8711.084−0.912−0.886 −2.845−2.557
T 1 / 4 best fit temp range (K) 300–286 229–183 126–38
slope−5.666−7.1509.5119.482 37.19836.190
y-intercept1.5821.940−2.150−2.154 −9.280−8.818
H 12 –ClO 4 actual temperature range (K)300–290290–7374–7273–4 (good data ends at 20)
T 1 best fit temp range (K) 300–290 232–73.2 87–73.2 73.17–72.87 72.5–52 53–29
slope4.567(too small)204.468209.608 147.605 −2694.026116.853147.693 119.150
y-intercept0.536 −0.264−0.316 0.495 39.3180.8380.334 0.903
T 1 / 2 best fit temp range (K) 300–290 233–131130–8887–73.0 73.17–72.82 72.6–54 72–24
slope0.533(too small)35.38928.92743.91731.979 −630.60737.24836.931 37.704
y-intercept0.520 −1.723−1.304−2.591−1.233 73.220−2.002−1.970 −2.063
T 1 / 4 best fit temp range (K) 300–290 237–136138–8987–73.1135–73.173.17–72.87 72.8–5353–2272.6–22
slope0.257(too small)21.39215.57826.85722.31227.831−308.94729.32926.11430.64929.310
y-intercept0.489 −4.929−3.397−6.691−5.118−6.988108.098−7.715−6.583−8.268−7.709
D 12 –ClO 4 actual temperature range (K)300–230230–7373–7073–4 (good data to 18)
T 1 best fit temp range (K) 300–230 138–71.1 90–72.4 72.23–70.74 70.6–56 70.4–29
slope−44.010(not linear)172.713197.157 193.418 −655.223167.089220.575 208.745
y-intercept−1.234 −2.309−2.569 −2.514 0.137−2.198−3.206 −3.014
T 1 / 2 best fit temp range (K) 300–230 137–96 96–72.2 72.26–70.73 70.8–57 56–30
slope−5.544(not linear)30.79333.654 43.408 −185.30556.47755.196 64.775
y-intercept−1.060 −3.641−3.989 −4.948 21.896−6.765−6.656 −7.990
T 1 / 4 best fit temp range (K) 300–230 137–96 95–72.1 72.24–70.74 70.6–5670.9–4346–25
slope−2.778(not linear)18.21520.594 28.769 −106.88045.71939.23841.63855.276
y-intercept−0.712 −6.314−7.137 −9.713 36.728−15.919−13.627−14.473−19.754

References and Notes

  1. Lebed, A. (Ed.) The Physics of Organic Superconductors and Conductors; Springer: Berlin, Germany, 2008. [Google Scholar]
  2. Dressel, M. Spin-charge separation in quasi one-dimensional organic conductors. Naturwissenschaften 2003, 90, 337–344. [Google Scholar] [CrossRef] [PubMed] [Green Version]
  3. Dressel, M. Ordering phenomena in quasi-one-dimensional organic conductors. Naturwissenschaften 2007, 94, 527–541. [Google Scholar] [CrossRef] [PubMed] [Green Version]
  4. Dressel, M.; Dumm, M.; Knoblauch, T.; Masino, M. Comprehensive optical investigations of charge order in organic chain compounds (TMTTF)2X. Crystals 2012, 2, 528–578. [Google Scholar] [CrossRef] [Green Version]
  5. Nad, F.; Monceau, P.; Fabre, J.M. Low frequency dielectric permittivity of quasi-one-dimensional conductor (TMTTF)2Br. Eur. Phys. J. B 1998, 3, 301–306. [Google Scholar] [CrossRef]
  6. Coulon, C.; Lalet, G.; Pouget, J.P.; Foury-Leylekian, P.; Mouradpour, A.; Fabre, J.M. Anisotropic conductivity and charge ordering in (TMTTF)2X salts probed by ESR. Phys. Rev. B 2007, 76, 085126. [Google Scholar] [CrossRef]
  7. Köhler, B.; Rose, E.; Dumm, M.; Untereiner, G.; Dressel, M. Comprehensive transport study of anisotropy and ordering phenomena in quasi-one-dimensional (TMTTF)2X salts (X = PF6, AsF6, SbF6, BF4, ClO4, ReO4). Phys. Rev. B 2011, 84, 035124. [Google Scholar] [CrossRef] [Green Version]
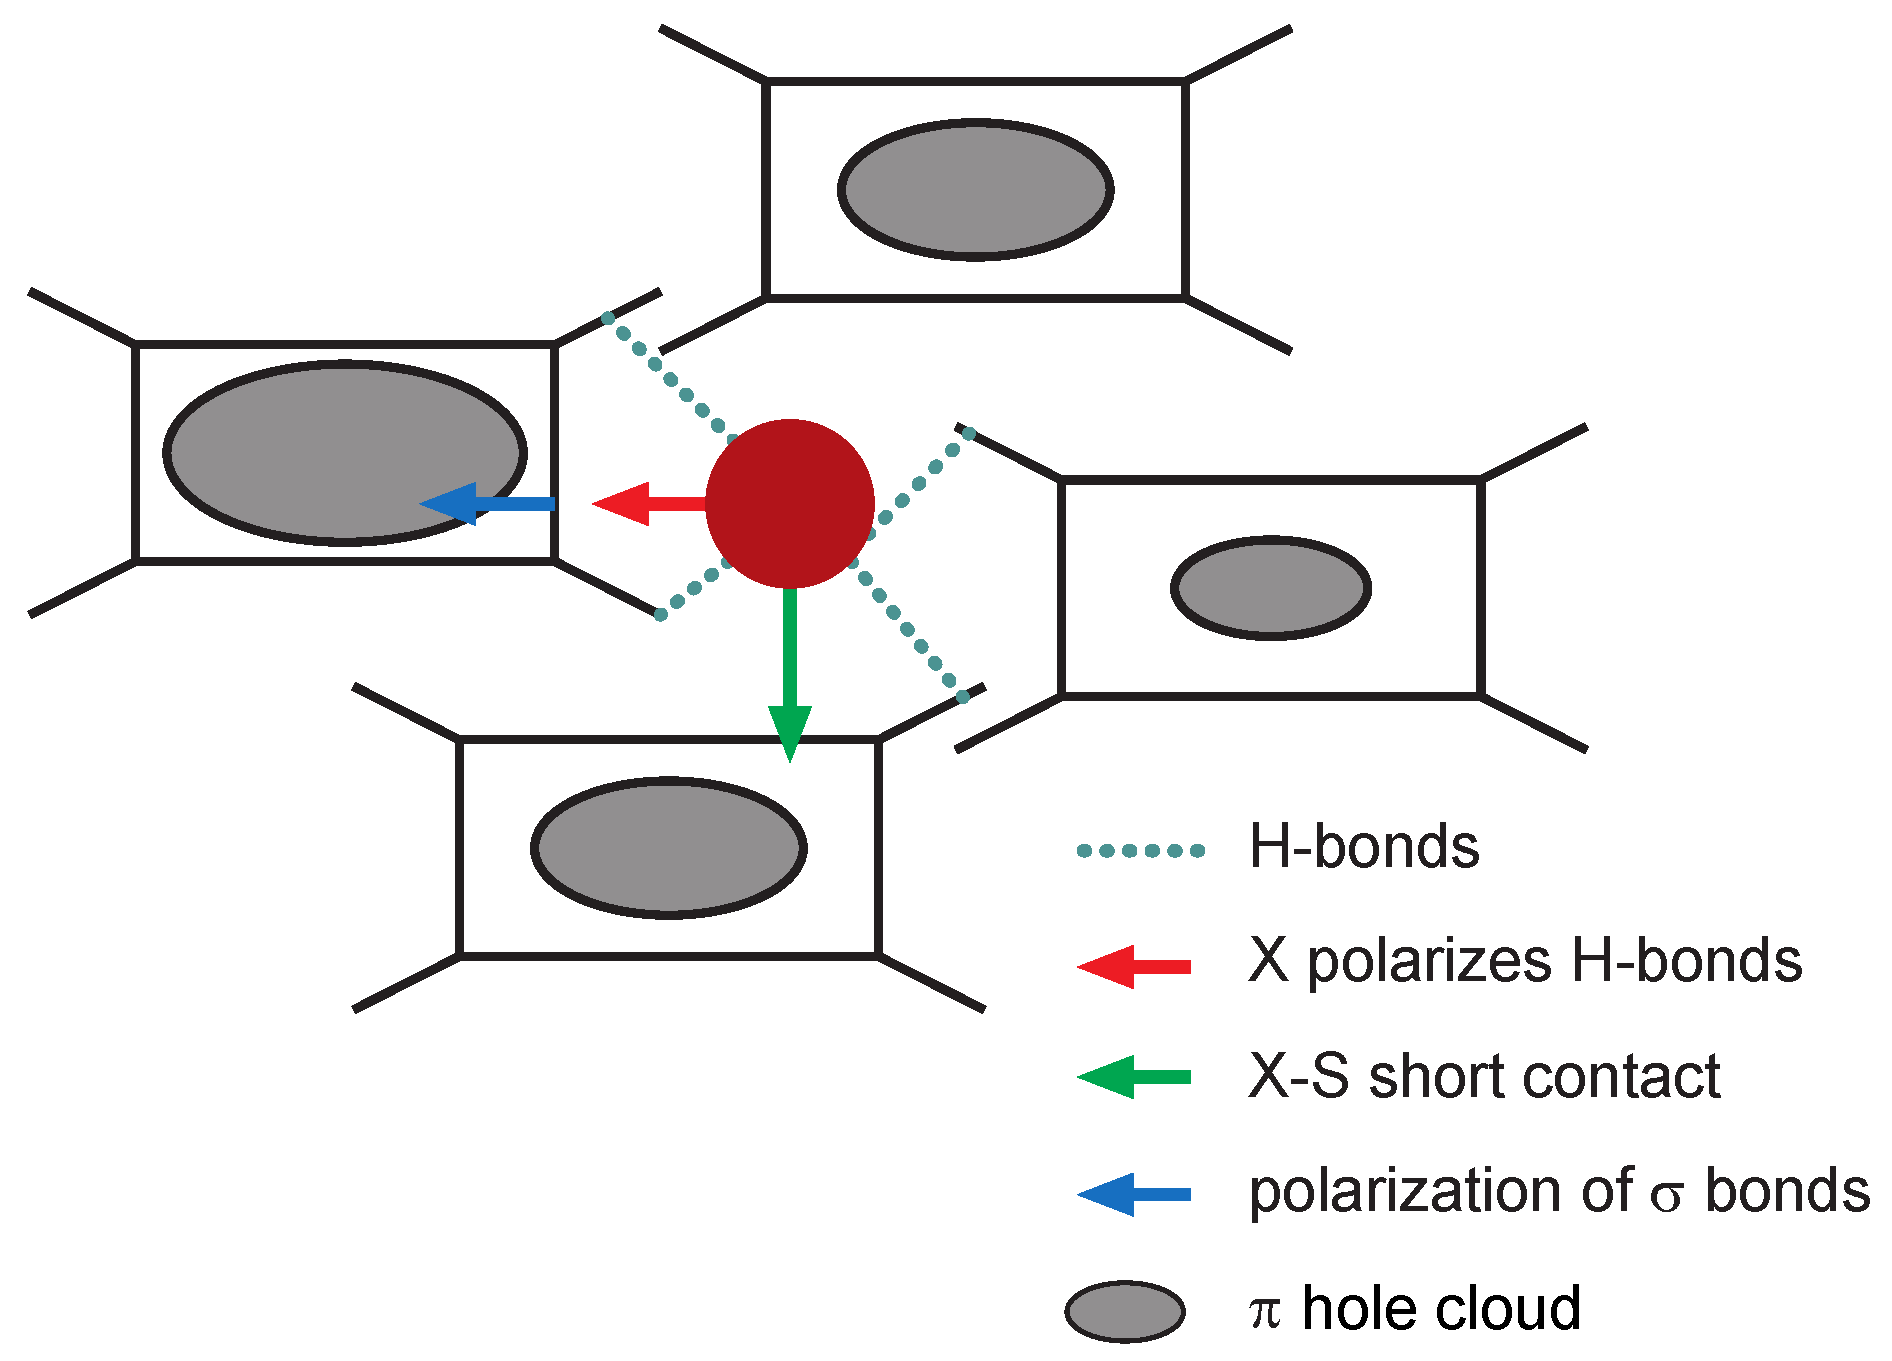
  8. Rose, E.; Dressel, M. Coupling between molecular chains and anions in (TMTTF)2X salts. Phys. B Condens. Matter 2012, 407, 1787–1792. [Google Scholar] [CrossRef]
  9. Rösslhuber, R.; Rose, E.; Ivek, T.; Pustogow, A.; Breier, T.; Geiger, M.; Schrem, K.; Untereiner, G.; Dressel, M. Structural and Electronic Properties of (TMTTF)2X Salts with Tetrahedral Anions. Crystals 2018, 8, 121. [Google Scholar] [CrossRef] [Green Version]
  10. Pustogow, A.; Peterseim, T.; Kolatschek, S.; Engel, L.; Dressel, M. Electronic correlations versus lattice interactions: Interplay of charge and anion orders in (TMTTF)2X. Phys. Rev. B 2016, 94, 195125. [Google Scholar] [CrossRef]
  11. Pouget, J.P. Structural Aspects of the Bechgaard and Fabre Salts: An Update. Crystals 2012, 2, 466–520. [Google Scholar] [CrossRef]
  12. Pouget, J.P.; Alemany, P.; Canadell, E. Donor-anion interactions in quarter-filled low-dimensional organic conductors. Mater. Horiz. 2018, 5, 590–640. [Google Scholar] [CrossRef] [Green Version]
  13. Pouget, J.P.; Foury-Leylekian, P.; Bolloc’h, D.; Hennion, B.; Ravy, S.; Coulon, C.; Cardoso, V.; Moradpour, A. Neutron-scattering evidence for a spin-peierls ground state in (TMTTF)2PF6. J. Low Temp. Phys. 2006, 142, 147–152. [Google Scholar] [CrossRef]
  14. Asada, M.; Nakamura, T. Magnetic resonance investigation for a possible antiferromagnetic subphase in (TMTTF)2Br. Phys. Rev. B 2017, 96, 125120. [Google Scholar] [CrossRef]
  15. Furukawa, K.; Hara, T.; Nakamura, T. Deuteration effect and possible origin of the charge-ordering transition of (TMTTF)2X. J. Phys. Soc. Jpn. 2005, 74, 3288. [Google Scholar] [CrossRef]
  16. Nad, F.; Monceau, P.; Nakamura, T.; Furukawa, K. The effect of deuteration on the transition into a charge ordered state of (TMTTF)2X salts. J. Phys. Condens. Matter 2005, 17, L399–L406. [Google Scholar] [CrossRef]
  17. Dumm, M.; Loidl, A.; Fravel, B.W.; Starkey, K.P.; Montgomery, L.K.; Dressel, M. Electron spin resonance studies on the organic linear-chain compounds (TMTCF)2X(C = S, Se; X = PF6, AsF6, ClO4, Br). Phys. Rev. B 2000, 61, 511–521. [Google Scholar] [CrossRef]
  18. Salameh, B.; Yasin, S.; Dumm, M.; Untereiner, G.; Montgomery, L.; Dressel, M. Spin dynamics of the organic linear chain compounds (TMTTF)2X (X = SbF6, AsF6, BF4, ReO4, and SCN). Phys. Rev. B 2011, 83, 205126. [Google Scholar] [CrossRef]
  19. We cannot guarantee that the experiments have been conducted under exactly the same conditions. Cooling rates as well as heat transfer rates may have differed between the measurements on the deuterated and protonated crystals, which may influence the hysteresis of this transition.
  20. Pouget, J.P.; Ravy, S. Structural aspects of the Bechgaard salts and related compounds. J. Phys. I 1996, 6, 1501–1525. [Google Scholar] [CrossRef]
  21. Dumm, M.; Loidl, A.; Alavi, B.; Starkey, K.P.; Montgomery, L.K.; Dressel, M. Comprehensive ESR-Study of the Antiferromagnetic Ground States in the One-Dimensional Spin Systems (TMTSF)2PF6, (TMTSF)2AsF6, and (TMTTF)2Br. Phys. Rev. B 2000, 62, 6512–6520. [Google Scholar] [CrossRef]
  22. Tomić, S.; Biskup, N.; Dolamski Babić, S.; Maki, K. Commensurate Spin-Density Wave State in (TMTTF)2Br: Single-Particle and Collective Charge Dynamics. Europhys. Lett. 1994, 26, 295–301. [Google Scholar] [CrossRef]
  23. Baranovski, S. Charge Transport in Disordered Solids with Applications in Electronics; John Wiley & Sons: West Sussex, UK, 2006. [Google Scholar]
  24. Mott, N.F.; Davies, E. Electronic Processes in Non-Crystalline Materials, 2nd ed.; Clarendon Press: Oxford, UK, 1979. [Google Scholar]
  25. Efros, A.L.; Shklovskii, B.I. Coulomb gap and low temperature conductivity of disordered systems. J. Phys. C 1975, 8, L49. [Google Scholar] [CrossRef]
  26. Shklovskii, B.I.; Efros, A.L. Electronic Properties of Doped Semiconductors; Springer: Berlin, Germany, 1984. [Google Scholar]
  27. Khondaker, S.I.; Shlimak, I.S.; Nicholls, J.T.; Pepper, M.; Ritchie, D.A. Crossover phenomenon for two-dimensional hopping conductivity and density-of-states near the Fermi level. Solid State Commun. 1999, 109, 751. [Google Scholar] [CrossRef]
  28. Strictly speaking γ = 2 is also obtained in the case of one-dimensional transport (d = 1). The thorough study of anisotropic transport reveals that at low-temperatures one-dimensional models do not apply despite the appreciable anisotropy.
  29. Dressel, M.; Petukhov, K.; Salameh, B.; Zornoza, P.; Giamarchi, T. Scaling Behavior of the Longitudinal and Transverse Transport in Quasi One-Dimensional Organic Conductors. Phys. Rev. B 2005, 71, 075104. [Google Scholar] [CrossRef] [Green Version]
  30. Joung, D.; Khondaker, S.I. Efros-Shklovskii variable range hopping in reduced graphene oxide sheets of varying carbon sp2 fraction. Phys. Rev. B 2012, 86, 235423. [Google Scholar] [CrossRef] [Green Version]
Figure 1. Phase diagram of the (TMTTF) 2 X family. The ambient pressure positions of the charge-transfer salts with centrosymmetric anions X = SbF 6 , PF 6 , and Br are indicated by arrows. 1D metal denotes the quasi-one-dimensional metallic properties, CO the charge-ordered phase, AFM stands for antiferromagnetism and SP for spin-Peierls state.
Crystals 10 01085 g001
Figure 2. Molecular structure model of the (TMTTF) 2 X salt. As a representative example, an octahedral salt, e.g., (TMTTF) 2 PF 6 , is depicted here. All Fabre salts, containing octahedral, tetrahedral, or mono-atomic anions, have this triclinic crystal structure. The crystal structure is the same for undeuterated and deuterated samples investigated in this study.
Crystals 10 01085 g002
Figure 3. Temperature dependent dc resistivity ρ ( T ) measured along the a-axis of deuterated (D 12 ) (red solid diamonds) and protonated (H 12 ) (black open squares) (TMTTF) 2 X salts (X = Br, PF 6 , SbF 6 , ClO 4 ). Note the logarithmic vertical axes. Arrows mark the charge ordering [for (TMTTF) 2 Br, (TMTTF) 2 PF 6 , (TMTTF) 2 SbF 6 ] and anion ordering [for (TMTTF) 2 ClO 4 ] transitions for the deuterated (orange) and protonated (grey) samples.
Crystals 10 01085 g003
Figure 4. Anion transition of the protonated (black symbols, top panel) and deuterated (red symbols, bottom panel) (TMTTF) 2 ClO 4 crystals. Cooling (solid symbols, indicated by left arrow) and warming (open symbols, indicated by right arrow) are plotted to show the hysteresis. Note the logarithmic resistivity axis and linear temperature axis.
Crystals 10 01085 g004
Figure 5. A schematic representation of the molecular structure of (TMTTF) 2 X salts. The rectangles represent the TMTTF molecules with their methyl end groups (four ‘legs’ sticking out). The latter form a cage between the organic molecules containing the anion, X (filled dark red sphere in the diagram). Depending on the size of the anion and the methyl end-groups (whether they are deuterated or protonated) this cage forms a spacious or a more confined trap for the anion to move about in. The blue dotted lines represent the hydrogen bonds forming between the anion and the methyl end groups. Figure adapted from Pouget [11].
Crystals 10 01085 g005
Figure 6. Resistivity ρ ( T ) in the low-temperature regime of the protonated (black symbols, top panel) and deuterated (red symbols, bottom panel) of the (TMTTF) 2 Br compounds: cooling (solid symbols) and warming (open symbols). Arrows indicate the AFM transition temperatures obtained by magnetic probes.
Crystals 10 01085 g006
Figure 7. Comparison between three transport models, namely, Arrhenius (left column), three-dimensional variable-range hopping with Coulomb gap considered according to Efros and Shklovskii (central column) and three-dimensional Mott variable-range hopping without electronic correlations (right column), for all four protonated (shown by black symbols) and deuterated (red) salts (top to bottom). A given model is relevant in regions where the corresponding curves are linear. Supplementary data regarding the linear fits are provided in Table A1 (see Appendix A).
Crystals 10 01085 g007
Figure 8. Temperature dependent energy gap Δ ( T ) for the protonated (black symbolds) and deuterated (red dots) Fabre salts (TMTTF) 2 X (X = Br, PF 6 , SbF 6 and ClO 4 ) as calculated via Equation (3). The right most orange (grey) arrows indicate T ρ of the deuterated (protonated) compounds. From right to left, the next set of arrows indicate the charge and anion ordering transitions T CO or T AO , while the left most set of arrows in the top panel [(TMTTF) 2 Br salts] indicate the AFM ordering at T N .
Crystals 10 01085 g008
Table 1. Phase transition temperatures T ρ , T CO , T AO , T SP , T N , for H 12 - and (D 12 -TMTTF) 2 X , with X = Br, PF 6 , SbF 6 , ClO 4 , as determined from the dc resistivity data plotted in Figure 3. Note that some temperatures are better identified in the alternative presentation displayed in Figure 8. Since the low-temperature magnetic phase transitions for the Br, PF 6 , and SbF 6 salts could not be resolved in our measurements, literature values are supplied for T SP of H 12 - and (D 12 -TMTTF) 2 PF 6 compounds from References [7,13], as well as for T N of the (TMTTF) 2 Br and (TMTTF) 2 SbF 6 salts as they appear in the last column, from References [11,13,14,15,16,17,18].
Anions        Transition Temperatures (K)
X   T ρ   T CO   T AO   T SP   T N
BrH 12 130  30 13
D 12 260  50 19
PF 6 H 12 260  67 19
D 12 280  90 13
SbF 6 H 12 240157   6
D 12 280168   8
ClO 4 H 12 290 73.1
D 12 230 71.9
Table 2. Changes observed in transition temperatures, Δ T , upon deuteration of the (TMTTF) 2 X salts, calculated from values given in Table 1 using Δ T = T * H T * D for the respective quantities. In the case of resistivity minimum T ρ , the error bar may reach ± 25  K.
Anions  Change in Transition Temperature (K)
X   Δ T ρ    Δ T CO    Δ T AO    Δ T SP    Δ T N
Br−130−20 −6
PF 6  −20−23 6
SbF 6  −40−11 −2
ClO 4   60 1.2
Table 3. The constant resistivity ρ 0 from Equation (3) for the protonated and deuterated Fabre salts (TMTTF) 2 Br, (TMTTF) 2 PF 6 , (TMTTF) 2 SbF 6 and (TMTTF) 2 ClO 4 , as determined for Figure 8. The energy gap at the localization temperature T ρ was set to zero by adjusting ρ 0 .
Anions X     ρ 0 ( Ω cm)
BrH 12     0.01184
D 12     0.02606
PF 6 H 12     1.286
D 12     0.1401
SbF 6 H 12     4.638
D 12     1.585
ClO 4 H 12     3.557
D 12     0.03818
Table 4. Energy gaps for (TMTTF) 2 X (X = Br, PF 6 , SbF 6 and ClO 4 ) as read off Figure 8. As suggested by Köhler et al., Δ 0 was extracted at T CO , while Δ CO and Δ AO were read off at the highest point between T CO or T AO and T 0 K, respectively. Δ is the total gap energy as calculated according to Equation (4).
Anions X    Δ 0 (K) Δ CO (K) Δ AO (K) Δ (K)
BrH 12 90110 140
D 12 130135 190
PF 6 H 12 460460 650
D 12 200330 390
SbF 6 H 12 60545 550
D 12 140570 585
ClO 4 H 12 330 315450
D 12 260 370450
Publisher’s Note: MDPI stays neutral with regard to jurisdictional claims in published maps and institutional affiliations.

