Abstract
The beta-Al2O3 solid electrolyte doped with Chromium was synthesized via a citrate-nitrate combustion method, which started with NaNO3, LiNO3, Cr(NO3)3·9H2O, and Al(NO3)3·9H2O as the raw materials in this paper. The thermal behavior analysis, structure, and ionic conductivity of the beta-Al2O3 solid electrolyte were studied by the thermogravimetry/differential scanning calorimetry (TG/DSC), X-ray diffraction (XRD), scanning electron microscopy (SEM), and electrochemical impedance spectroscopy (EIS). Meanwhile, the relative density and bending strength of the samples were also measured. The results showed that with the appropriate Chromium doping, the calcining temperature of the precursor powders was only 1100 °C, the β″-Al2O3 phase content, bending strength, relative density, and ionic conductivity were all improved with a compact and uniform cross section micrograph. The optimized sample contained 94% of β″-Al2O3 phase and exhibited a relative density up to 98.13% of the theoretical density. In addition, it showed a good bending strength (215 MPa) and a satisficed ionic conductivity (0.110 S cm−1 at 350 °C).
1. Introduction
The beta-Al2O3 solid electrolyte has a high ionic conductivity between 300 °C and 350 °C [1,2,3]. It possesses the good prospects for the application of the electrolyte materials in the secondary batteries, such as sodium sulfur battery, sodium-nickel chloride battery, and other new types of Na+ conductor battery [4,5,6,7]. The applications in other devices include gas sensors [8,9], sodium heat engine for direct thermoelectric energy conversion [10], and galvanic cells for measurement of thermodynamic data [11]. So, it is crucial to prepare the electrolyte material with uniform composition, high density, and good ionic conductivity for the preparation of battery.
Doping oxides in the ceramic materials had been indicated to improve the properties of the final samples. For example, some reports showed that an appropriate addition of Li2O or MgO could improve the sodium ionic conductivity of the beta-Al2O3 solid electrolyte [12,13,14,15,16]. But the mechanical properties were not satisfactory. S. Shan et al. [17] reported that the beta-Al2O3 solid electrolyte with TiO2 doping exhibited a bending strength up to 180 MPa compared to about 100 MPa without doping. But an excess TiO2 doping enhanced the formation of β phase and caused a partially sintered microstructure with large pores. Z. Wang et al. [18] synthesized the beta-Al2O3 ceramic material doped with CoO and the relative density reached a maximum of 97.98%, compared to only 95.55% of the non-doping sample. The conductivity of the material increased the most from 0.022 S cm–1 for the undoped sample to 0.061 S cm–1 with CoO added. D. Xu et al. [19] found that a small amount of Y2O3 could improve the mechanical strength and electrical conductivity by doubling zeta process to prepare the beta-Al2O3 solid electrolyte. When the amount of doping was 0.5 wt%, the bending strength (204 MPa) and conductivity (0.035 S cm–1 at 300 °C) were approximately 16% and 52% higher compared to the un-doped samples, respectively.
There were many reports that the properties of ceramics with Cr elements doping were optimized. For example, S. Ma et al. [20] studied the effect of Cr2O3 doping on the properties of the ZnO-Bi2O3-MnO2-based varistor. The study showed that Cr2O3 additive could promote the grain-growth of samples at a relatively low sintering temperature, and the final varistor ceramics met low breakdown voltages with low leakage current. S. Zhang et al. [21] prepared sapphirine glass ceramics with small quantities of Cr2O3 additive. The crystallization exothermic temperature of the parent glass decreased with addition of Cr2O3, it can also promote grain refinement of the sapphirine phase. M. Khodael et al. [22] studied the effect of Cr2O3 additions on liquid-phase sintered SiC ceramics, the results showed that Cr2O3 nanoparticles improved the densification of samples. However, we had not found any report on the effect of Cr doping on the performance of beta-Al2O3 solid electrolyte. So, in this paper, we investigated the structure and performances of the beta-Al2O3 solid electrolyte with different contents of Cr2O3 doping by X-ray diffraction (XRD), scan electron microscopy (SEM), and electrochemical impedance spectroscopy (EIS).
The conventional synthesis of beta-Al2O3 solid electrolyte was carried out by solid-state reaction [23,24,25,26]. But the transition from β″-Al2O3 to β-Al2O3 at high temperature would lead to a decrease in conductivity [27]. The soft-chemical methods had been reported as more suitable routes for ceramic systems. The resulting powders with higher purity and surface area could be sintered at relatively low temperatures [12,28,29,30,31,32]. So, we used a citrate-nitrate combustion method to study in this article.
2. Experimental
2.1. Synthesis
In this work, the beta-Al2O3 solid electrolytes with Chromium additions were synthesized via a citrate-nitrate combustion method. NaNO3(AR), LiNO3(AR), Cr(NO3)3·9H2O(AR), and Al(NO3)3·9H2O(AR) were dissolved in de-ionized water, where Li+ was a conventional stabilizer forβ″-Al2O3 [13]. Among them, Na2O was 9.5 wt%, Li2O was 0.7 wt%, Cr2O3 was 0 wt%, 0.05 wt%, 0.1 wt%, 0.15 wt%, 0.25 wt%, 0.5 wt%, 0.75 wt%, and 1 wt%, respectively, and the rest was Al2O3. The citric acid (CA) was added to the solution above as chelating agent with the mole amount equal to the total metal cations. The mixed solution was stirred at 80 °C for several hours to obtain a yellowish gel. Then, the resulting gel was dried at 120 °C for 24 h and ball-milled to get the dry gel powders. The dry gel was first slowly heated to 600 °C for 2 h and then calcined at different temperatures from 700 °C to 1200 °C for 2 h in the box resistance furnace in air. The precursor powders were ball-milled for 10 h with anhydrous ethanol for 10 h, and dried. Rectangular and cylindrical samples were pressed at 300 MPa with precursor powders and an appropriate amount of 5 wt% polyvinyl alcohols, the sizes were height (3 mm) × width (4 mm) × length (40 mm) and diameter (16 mm) × height (2 mm), respectively. Finally, it was fired at 1600 °C for 10 min and cooled at 1450 °C for 2 h to accelerate the formation of β″-Al2O3 phases.
2.2. Characterization
In order to determine the thermal stabilities of the dry gel powders, the thermogravimetry/differential scanning calorimetry (TG-DSC) analyses were carried out by a TG–DSC analyzer (STA449C, Netzsch, Germany) from room temperature (20 °C) to 1400 °C in air atmosphere, with a heating rate of 10 °C min−1.
The crystal structure of the powders calcined at different temperatures was performed by X-ray diffraction (XRD, Rigaku, Japan) with Cu Kα radiation (λ = 1.5406 Å) at a scanning speed of 10° min−1 in the 2θ range of 5°–80°. The relative ratios of β-Al2O3 and β″-Al2O3 were quantitatively calculated by the following equation [33].
where Iβ and Iβ″ were the peak intensities at 44.50° and 45.90°, respectively.
The surface microstructures of the sinters were characterized by a scanning electron microscope (SEM, JEOL, JSM5900, Japan).
The bending strength of the samples were performed by the Electronic Universal Testing Machine (CMT6203, MTS, USA) with three-point bending method (span 30 mm) on rectangular samples with a cross-section of 3 mm × 4 mm.
The densities of the sintered samples were measured using Archimedean principle under the room temperature (20 °C). The measured density, Db (g cm−3) was calculated using Equation (2) [18]. Each data was taken from five samples.
where m1 (g) was the weight of the dry sample, m2 (g) was the weight of the saturated sample suspended in the anhydrous ethanol, m3 (g) was the weight of the saturated sample in the air, and D1 was the density of the anhydrous ethanol at 20 °C (0.7903 g cm−3).
The ionic conductivities of the sintered samples were investigated via AC impedance analysis on an electrochemical working station (Solartron 1260 + 1287, Ametek, UK) at the temperature from 50 °C to 400 °C with 50 °C interval. The frequency range was from 107 Hz to 0.1 Hz and the signal amplitude of 20 mV. The sintered cylindrical samples for ionic conductivity measurements were covered with silver paste on their parallel surfaces and then fired to ensure good bonding and to obtain silver electrode as the current collector.
3. Results
3.1. Analysis of The Dry Gel Precursor Powders
The XRD spectra of the dry gel with different amounts of Cr2O3 had been measured and showed almost the same. In order to enlarge the spectra for comparison, we chose three of them for drawing, as shown in Figure 1. The dry gel precursor powders exhibited an amorphous pattern and no crystal diffraction peaks. So, the metal ions had been fully complexed by CA.
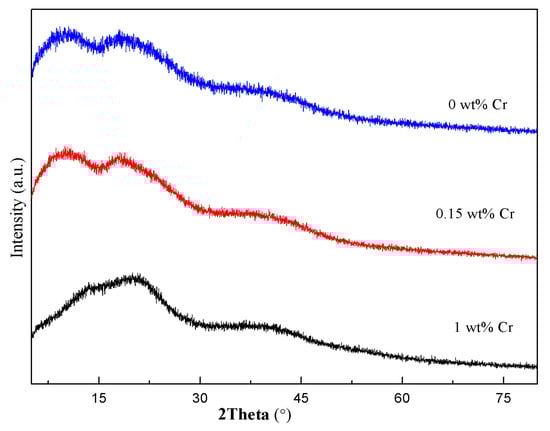
Figure 1.
X-ray diffraction (XRD) spectra of the dry gel with different amounts of Cr2O3 doping.
Figure 2 displayed the TG and DSC curves of the dry gel containing 0 wt% and 0.15 wt% Cr2O3, respectively. Due to a small amount of doping, we only chose 0.15 wt% doping experiment for thermal analysis. As in Figure 2a, there was an endothermic peak at 214 °C, and the mass loss was about 30.81%, which corresponded to the melting point of CA and could be explained as an autocatalytic anionic oxidation–reduction reaction between the nitrates and CA in conjunction with moisture and CA evaporation [34]. The endothermic peak could be explained by a competing reaction among oxidation–reduction reaction, vaporization, and decomposition of the gel, as shown in other systems [35,36]. The exothermic peak at 401 °C was the decomposition of the metal CA compounds and the formation of the oxide solid solution. The other exothermic peak at 526 °C was the decomposition of the unreacted nitrate. After 600 °C, the quality of the sample tended to be constant, which indicated that the thermal decomposition process was basically completed. There was an endothermic peak at about 900 °C and an exothermic peak at 1100 °C, which corresponded to the crystal transition temperatures [12,37]. According to Figure 2, there was a little influence on the reaction temperature with 0.15 wt% Cr2O3 doping before 600 °C. However, the reaction temperature reduced about 50 °C after 600 °C. It indicated that the 0.15 wt% Cr2O3 doping could reduce the phase transition temperature at high temperature and make the phase change process become easier.
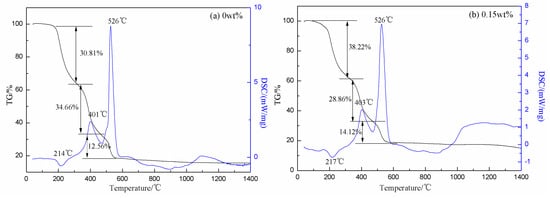
Figure 2.
Thermogravimetry (TG) and differential scanning calorimetry (DSC) curves of the dry gel with different amounts of Cr2O3 doping (a) 0 wt% Cr2O3; (b) 0.15 wt% Cr2O3.
Figure 3 presented the XRD spectra of the precursor powders with 0.15 wt% Cr2O3 doping at different calcining temperatures. When the calcining temperature was 700 °C, the phase was Na2Al2xO3x+1 (The Powder Diffraction File (PDF) No. 29-1164), but the diffraction peaks of the phase were weak. The phase of Al2Li3 was produced at the same time. When the calcining temperature was up to 800 °C, the diffraction peaks of the phase became sharp and m-Al2O3 (PDF No. 12-593) was produced. When the calcining temperature was 900 °C and 950 °C, the diffraction peaks of the Na2Al2xO3x+1 phase were stronger, while Al2Li3 phase and m-Al2O3 phase disappeared. However, when the calcining temperature was up to 1000 °C, the diffraction peaks of the Na2Al2xO3x+1 phase were very weak and the diffraction peaks of the β″/β-Al2O3 phases appeared. When the calcining temperature was 1050 °C, there was no Na2Al2xO3x+1 phase and the diffraction peaks of the β″/β-Al2O3 phases existed only. As the calcining temperature continued to increase, the intensity of diffraction peaks gradually increased. Table 1 showed the β″-Al2O3 phase contents of the precursor powders with different calcining temperatures according to Equation (1). When the calcining temperature was over 1100 °C, the β″-Al2O3 phase contents decreased. This was because the β″-Al2O3 phase could transform to the β-Al2O3 phase at the high temperatures. So, the calcining temperature of the precursor powders was 1100 °C, which was 150 °C lower than that of the solid-state method [24].
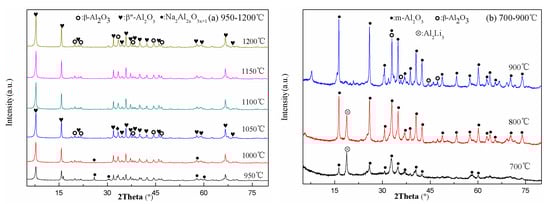
Figure 3.
XRD spectra of the precursor powders at different calcining temperatures (a) 950–1200 °C; (b) 700–900 °C.

Table 1.
The β″-Al2O3 phase contents of the precursor powders at different calcining temperatures.
3.2. Analysis of The Sinters
3.2.1. Phase Analysis
Figure 4 displayed the XRD spectra of the sinters with different amounts of Cr2O3. Figure 4 showed that all the samples were composed of the β- and β″-Al2O3 phases. The characteristic diffraction peaks of the β″-Al2O3 phase were very strong, while the intensity of the β-Al2O3 phase was very weak. The β″-Al2O3 phase contents of the sinters were calculated according to Equation (1) and shown in Table 2. When the Cr2O3 doping content was 0.15 wt%, the β″-Al2O3 phase content was up to maximum (94%). It could be observed that the Cr2O3 doping improved effectively the stability of the β″-Al2O3 phase at high temperatures. According to Boilot and Thery′s theory [38], when the radius of divalent metal ions was under 0.097 nm, the divalent metal ions were able to enter the spinel block to stabilize the β″-Al2O3 phase structure. Because the radius of element Cr was 0.0615 nm, the Cr3+ ions occupied the vacancies of the Al3+ ions to improve the diffusion coefficients of aluminum ions and stabilize the β″-Al2O3 phase structure. However, due to the small doping amount of Cr, only 1 wt%, there wasn’t an expected continuous shift in Figure 4 [39]. The irregular shift of the diffraction pattern might be caused by the misalignment of the sample and the sample holder during the test.
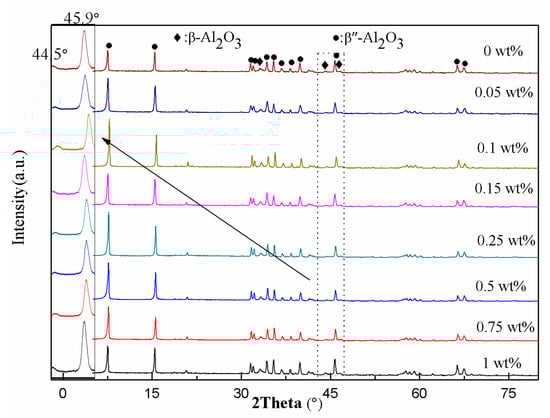
Figure 4.
XRD spectra of the sinters for different amounts of Cr2O3 doping (sintering temperature: 1450 °C).
Table 2.
The β″-Al2O3 phase contents of the sinters for different amounts of Cr2O3 doping.
3.2.2. Microstructure Analysis
Figure 5 showed the cross section micrographs of the sinters with different amounts of Cr2O3 doping. As shown in Figure 5a, the microstructure of the sample was lath-like grains with an average size in the range of 2–10 μm and there were many large pores. When the Cr2O3 doping content was 0.05 wt%, the particles were cylindrical shape and the average size changed smaller. When the Cr2O3 doping content was 0.15 wt%, the size of the particle was uniform and the arrangement was regular. But, there were also some tiny pores. When the Cr2O3 doping content was more than 0.15 wt%, the cross section micrograph of the beta-Al2O3 sinters appeared the molten state and the microstructure was massive exaggerated grains. Due to the increasing of Cr2O3 doping, the crystal nucleation of the sample became easier. Therefore, the particles became more uniform and compact. While the Cr2O3 doping contents continued to increase, the Cr ions tended to gather in the grain boundary or the vicinity of the grain boundary to lead the size of the grain to become uneven and make the samples more easily to appear the molten state [20,40,41].
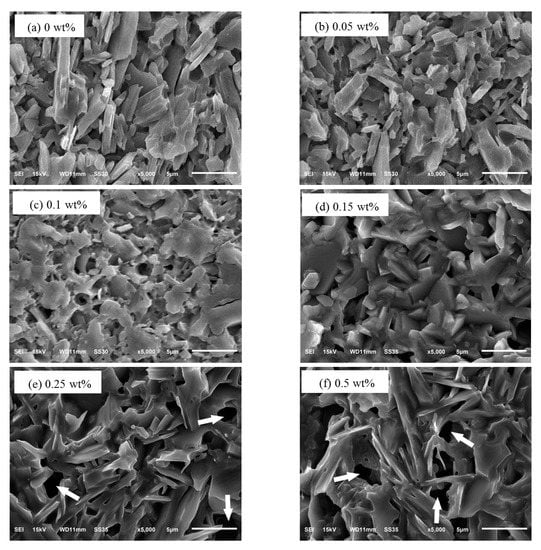
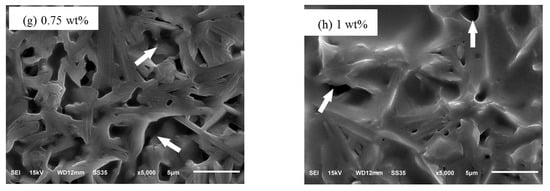
Figure 5.
The microstructures of the sinters for different amounts of Cr2O3 doping: (a) 0 wt%; (b) 0.05 wt%; (c) 0.1 wt%; (d) 0.15 wt%; (e) 0.25 wt%; (f) 0.5 wt%; (g) 0.75 wt%; (h) 1 wt%.
3.2.3. Volume Density Measurement
Figure 6 showed the measured densities and the relative densities of the sinters with different amounts of Cr2O3. The relative density of the undoped sample was 95.93% (the measured density was 3.0875 g cm−3). When the Cr2O3 doping content was 0.15 wt%, the relative density reached the maximum 98.13% (3.1504 g cm3). With the analysis of Figure 5d, the particle size of the sample was uniform and the microstructure had no obvious defects and compact. So, the relative density was large. With the increasing of the Cr2O3 doping contents, the relative density of the samples reduced sharply. According to Figure 5e,h, the cross section microstructure of the samples gradually had the molten state and the pores indicated by arrows were bigger than before the relative density decreased.
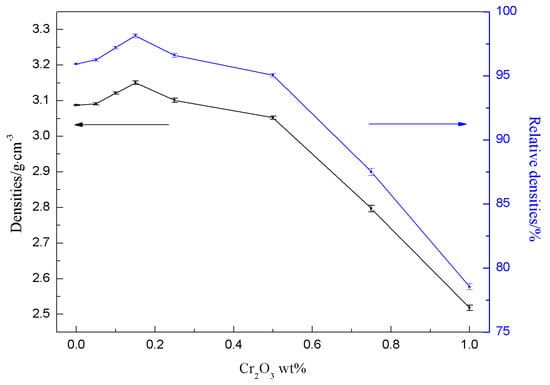
Figure 6.
The densities and the relative densities of the sinters for different amounts of Cr2O3 doping.
3.2.4. Bending Strength Analysis
The bending strengths of the sinters with different amounts of Cr2O3 were shown in Table 3. The bending strength of the undoped sample was only 150 MPa. When the Cr2O3 doping content was 0.15 wt%, the bending strength was up to 215 MPa. The microstructure of the sample was uniform and compact, so the binding force between the atoms was large. The bending strength was decreased with the excessive Cr2O3 doping contents. It was attributed to the nonuniform microstructure and the increase number of the pores.
Table 3.
Some calculated parameters and measured properties of the sinters with different amounts of Cr2O3 doping.
3.2.5. Ionic Conductivity Analysis
Figure 7 presented the AC impedance spectra of the sinters with different content of Cr2O3 doping at 350 °C. Figure 7b,c showed the equivalent circuits of the beta-Al2O3 solid electrolytes at different temperatures. Where Rg was the grain resistance, CPEg was the grain capacitance, Rgb was the grain boundary resistance, CPEgb was the grain boundary capacitance, and CPEct was the interface capacitance. As we know, the ionic conductivity was determined by the grain resistance and the grain boundary resistance [18]. The total resistance was calculated by the following equation.
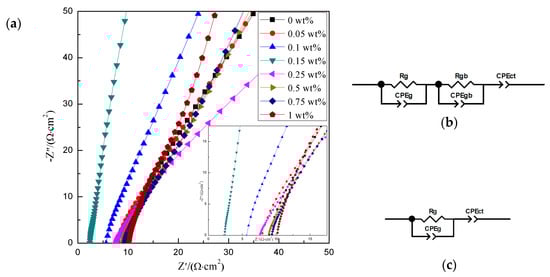
Figure 7.
The impedance spectra (a) of the sinters with different amounts of Cr2O3 doping at 350 °C; equivalent circuits: (b) <300 °C; (c) ≥300 °C.
The ionic conductivities of the sinters according to the equivalent circuit at 350 °C were shown in Table 3. The conductivity of the undoped sample was only 0.061 S cm−1. The ionic conductivity reached the maximum 0.110 S cm−1 when the Cr2O3 doping content was 0.15 wt%. It was because the β″-Al2O3 phase content was the best and the cross section micrograph was compact and uniform. It would destroy the microstructure of the samples by doping excessive Cr2O3 content. Then, the particles grew without order and the size of grains became large. It made the structure abnormal and loose to increase the resistance of the grain boundary; thereby, it deteriorated the ionic conductivity.
It was found that the plots of ln(σT) verses (1000 T−1) were linear over the temperature range. Figure 8 showed the Arrhenius plot of resistivity data for the sinters with different amounts of Cr2O3. The relationship conformed to Arrhenius equation.
where R was the gas constant, T was the absolute temperature.
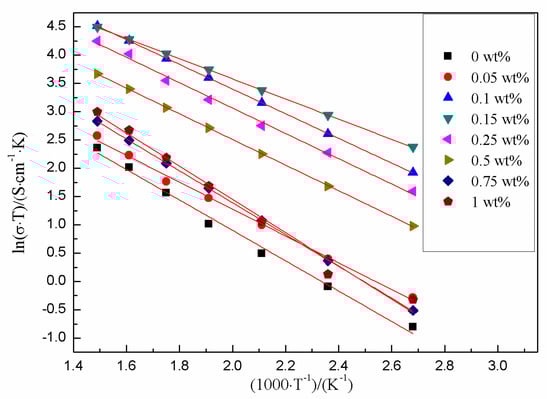
Figure 8.
Arrhenius plot of resistivity data for the sinters with different amounts of Cr2O3 doping.
The corresponding values for Ea (activation energy) of all the samples were listed in Table 3. The low Ea indicated that the Na ions migrated easily. The lowest Ea of all the samples was 0.155 eV when the Cr2O3 doping content was 0.15 wt%.
4. Conclusions
In this paper, Chromium doped beta-Al2O3 solid electrolyte was synthesized via the citrate-nitrate combustion method and the highly reactive precursors were obtained. The calcining temperature of the precursor powders was as low as 1100 °C. The doping amount was the key factor to affect the properties of the final samples. A small amount of Chromium doping could improve both the mechanical properties and ionic conductivities of the beta-Al2O3 solid electrolyte. An excess Chromium doping could destroy the microstructure and the performance of the samples. The optimal amount of Cr2O3 doping was 0.15 wt%, the β″-Al2O3 phase content was 94% with a uniform and compact microstructure. The relative density was 98.13% of the theoretical density. In addition, it showed a good bending strength (215 MPa) and a satisficed ionic conductivity (0.110 S cm−1 at 350 °C).
Author Contributions
Conceptualization, J.S. and Y.H.; methodology, J.S. and Y.H.; writing—review and editing, J.S., Y.H., and C.Z.; funding acquisition, C.Z. All authors have read and agreed to the published version of the manuscript.
Funding
This research was funded by the National Natural Science Foundation of China (Grant No.21203095).
Acknowledgments
The authors appreciate the Jiangsu National Synergetic Innovation Center for Advanced Materials (SICAM) and the Priority Academic Program Development of Jiangsu Higher Education Institutions.
Conflicts of Interest
The authors declare no conflict of interest.
References
- Slater, M.D.; Kim, D.; Lee, E.; Johnson, C.S. Sodium-Ion Batteries. Adv. Funct. Mater. 2012, 23, 947–958. [Google Scholar] [CrossRef]
- Ellis, B.L.; Nazar, L.F. Sodium and sodium-ion energy storage batteries. Curr. Opin. Solid State Mater. Sci. 2012, 16, 168–177. [Google Scholar] [CrossRef]
- Hueso, K.; Palomares, V.; Armand, M.; Rojo, T. Challenges and perspectives on high and intermediate-temperature sodium batteries. Nano Res. 2017, 10, 4082–4114. [Google Scholar] [CrossRef]
- Prakash, J.; Redey, L.; Vissers, D.R. Dynamic performance measurements of Na/NiCl2 cells for electric vehicle applications. J. Power Sources 2000, 87, 195–200. [Google Scholar] [CrossRef]
- Wen, Z.; Gu, Z.; Xu, X.; Cao, J.; Zhang, F.; Lin, Z. Research activities in Shanghai Institute of Ceramics, Chinese Academy of Sciences on the solid electrolytes for sodium sulfur batteries. J. Power Sources 2008, 184, 641–645. [Google Scholar] [CrossRef]
- Mali, A.; Petric, A. Fabrication of a thin walled β″-alumina electrolyte cells. J. Power Sources 2011, 196, 5191–5196. [Google Scholar] [CrossRef]
- Liang, S.; Yang, Y.; Li, K.; Zhang, X. A study on the preparation of oriented beta″-alumina ceramics using rod/flake-like boehmite as precursors and their properties. J. Eur. Ceram. Soc. 2020, 40, 4047–4055. [Google Scholar] [CrossRef]
- Takikawa, O. Characteristics of the Na/beta-alumina/Na cell as a sodium vapor pressure sensor. Solid State Ionics 1982, 7, 101–107. [Google Scholar] [CrossRef]
- Liu, J.; Weppner, W. Beta″-alumina solid electrolytes for solid state electrochemical CO2 gas sensors. Solid State Commun. 1990, 76, 311–313. [Google Scholar] [CrossRef]
- Hunt, T.; Weber, N.; Cole, T. High efficiency thermoelectric conversion with beta″-alumina electrolytes, the sodium heat engine. Solid State Ionics 1981, 5, 263–265. [Google Scholar] [CrossRef]
- Petric, A.; Pelton, A.D.; Saboungi, M.L. Thermodynamic properties of liquid K-Bi alloys by electromotive force measurements. J. Phys. F: Met. Phys. 1988, 18, 1473–1489. [Google Scholar] [CrossRef]
- Zhang, G.; Wen, Z.; Wu, X.; Zhang, J.; Ma, G.; Jin, J. Sol–gel synthesis of Mg2+ stabilized Na-β″/β-Al2O3 solid electrolyte for sodium anode battery. J. Alloy. Compd. 2014, 613, 80–86. [Google Scholar] [CrossRef]
- Park, J.; Kim, K.; Lim, S. Influence of stabilizers on Na-β′′-Al2O3 phase formation in Li2O(MgO)-Na2O-Al2O3 ternary systems. J. Mater. Sci. 1998, 33, 5671–5675. [Google Scholar] [CrossRef]
- Girija, T.; Virkar, A.V. Low temperature electrochemical cells with sodium β″-alumina solid electrolyte (BASE). J. Power Sources 2008, 180, 653–656. [Google Scholar] [CrossRef]
- Zhang, C.; Zhang, L.; Zhang, X.; Zheng, P.; Li, F. Synthesis of lithium-doped Na-β″-alumina composite electrolytes by a vapor phase process. Ceram. Int. 2020, 46, 3009–3014. [Google Scholar] [CrossRef]
- Chen, G.; Lu, J.; Zhou, X.; Chen, L.; Jiang, X. Solid-state synthesis of high performance Na-β″-Al2O3 solid electrolyte doped with MgO. Ceram. Int. 2016, 42, 16055–16062. [Google Scholar] [CrossRef]
- Shan, S.-J.; Yang, L.-P.; Liu, X.-M.; Wei, X.-L.; Yang, H.; Shen, X.-D. Preparation and characterization of TiO2 doped and MgO stabilized Na–β″-Al2O3 electrolyte via a citrate sol–gel method. J. Alloy. Compd. 2013, 563, 176–179. [Google Scholar] [CrossRef]
- Wang, Z.; Feng, X.; Zhang, T.; Xie, Z.; Song, F.; Li, Y. Preparation and characterization of CoO-doped and Li2O-stabilized Na-β″-Al2O3 solid electrolyte via a solid-state reaction method. Ceram. Int. 2020, 46, 24668–24673. [Google Scholar] [CrossRef]
- Xu, D.; Jiang, H.; Li, M.; Hai, O.; Zhang, Y. Synthesis and characterization of Y2O3 doped Na–β″-Al2O3 solid electrolyte by double zeta process. Ceram. Int. 2015, 41, 5355–5361. [Google Scholar] [CrossRef]
- Ma, S.; Xu, Z.; Chu, R.; Hao, J.; Liu, M.; Cheng, L.; Li, G. Influence of Cr2O3 on ZnO–Bi2O3–MnO2-based varistor ceramics. Ceram. Int. 2014, 40, 10149–10152. [Google Scholar] [CrossRef]
- Zhang, S.; Zhang, Y.; Qu, Z. Effects of soluble Cr2O3 doping on the glass structure, microstructure, crystallization behavior, and properties of MgO–Al2O3–SiO2 sapphirine glass ceramics. Mater. Chem. Phys. 2020, 252, 123115. [Google Scholar] [CrossRef]
- Khodaei, M.; Yaghobizadeh, O.; Baharvandi, H.R.; Esmaeeli, S.; Javi, H. The effect of Cr2O3 additions on sinterability and mechanical properties of liquid-phase sintered SiC ceramics. J. Alloy. Compd. 2020, 829, 154501. [Google Scholar] [CrossRef]
- Barison, S.; Fasolin, S.; Mortalò, C.; Boldrini, S.; Fabrizio, M. Effect of precursors on β-alumina electrolyte preparation. J. Eur. Ceram. Soc. 2015, 35, 2099–2107. [Google Scholar] [CrossRef]
- Zhu, C.; Xue, J. Structure and properties relationships of beta-Al2O3 electrolyte materials. J. Alloy. Compd. 2012, 517, 182–185. [Google Scholar] [CrossRef]
- Canfield, N.L.; Kim, J.Y.; Bonnett, J.F.; Pearson, R.L.; Sprenkle, V.L.; Jung, K. Effects of fabrication conditions on mechanical properties and microstructure of duplex β″-Al2O3 solid electrolyte. Mater. Sci. Eng. B 2015, 197, 43–50. [Google Scholar] [CrossRef]
- Hodge, J.D. Kinetics of the beta″-to-beta Transformation in the System Na2O-A12O3. J. Am. Ceram. Soc. 1983, 66, 166–169. [Google Scholar] [CrossRef]
- Hodge, J.D. Phase Relations in the System Na2O-Li2O-Al2O3. J. Am. Ceram. Soc. 2006, 67, 183–185. [Google Scholar] [CrossRef]
- Wang, J.; Jiang, X.-P.; Wei, X.-L.; Yang, H.; Shen, X.-D. Synthesis of Na-β″-Al2O3 electrolytes by microwave sintering precursors derived from the sol–gel method. J. Alloy. Compd. 2010, 497, 295–299. [Google Scholar] [CrossRef]
- Wei, X.-L.; Xia, Y.; Liu, X.-M.; Yang, H.; Shen, X.-D. Preparation of sodium beta″-alumina electrolyte thin film by electrophoretic deposition using Taguchi experimental design approach. Electrochimica Acta 2014, 136, 250–256. [Google Scholar] [CrossRef]
- Park, H.C.; Lee, Y.B.; Lee, S.G.; Lee, C.-H.; Kim, J.K.; Hong, S.S.; Park, S.S. Synthesis of beta-alumina powders by microwave heating from solution-derived precipitates. Ceram. Int. 2005, 31, 293–296. [Google Scholar] [CrossRef]
- Yaghtin, A.; Masoudpanah, S.; Hasheminiasari, M.; Salehi, A.; Safanama, D.; Ong, C.K.; Adams, S.; Reddy, M.V. Effect of Reducing Agent on Solution Synthesis of Li3V2(PO4)3 Cathode Material for Lithium Ion Batteries. Molecules 2020, 25, 3746. [Google Scholar] [CrossRef] [PubMed]
- Salehi, A.; Masoudpanah, S.; Hasheminiasari, M.; Yaghtin, A.; Safanama, D.; Ong, C.; Adams, S.; Zaghib, K.; Reddy, M.V. Facile synthesis of hierarchical porous Na3V2(PO4)3/C composites with high-performance Na storage properties. J. Power Sources 2021, 481, 228828. [Google Scholar] [CrossRef]
- Pekarsky, A.; Nicholson, P.S. The relative stability of spray-frozen/freeze-dried β″-Al2O3 powders. Mater. Res. Bull. 1980, 15, 1517–1524. [Google Scholar] [CrossRef]
- Mali, A.; Petric, A. Synthesis of sodium β″-alumina powder by sol–gel combustion. J. Eur. Ceram. Soc. 2012, 32, 1229–1234. [Google Scholar] [CrossRef]
- Mali, A.; Ataie, A. Structural characterization of nano-crystalline BaFe12O19 powders synthesized by sol–gel combustion route. Scr. Mater. 2005, 53, 1065–1070. [Google Scholar] [CrossRef]
- Choy, J.-H.; Yoo, J.-S.; Han, Y.-S.; Kim, Y.-H. Citrate sol-gel method for the preparation of β/β′’-alumina. Mater. Lett. 1993, 16, 226–230. [Google Scholar] [CrossRef]
- Li, N.; Wenab, Z.; Wu, X.; Zhang, J.; Liu, Y. Synthesis of nano-Na-β″/β-Al2O3 powders by a citrate complex process. J. Alloy. Compd. 2009, 479, 648–651. [Google Scholar] [CrossRef]
- Boilot, J.; Théry, J. Influence de l’addition d’ions etrangers sur la stabilite relative et la conductivite electrique des phases de type alumine β et β″. Mater. Res. Bull. 1976, 11, 407–413. [Google Scholar] [CrossRef]
- Yang, L.-P.; Shan, S.-J.; Wei, X.-L.; Liu, X.-M.; Yang, H.; Shen, X.-D. The mechanical and electrical properties of ZrO2–TiO2–Na-β/β″-alumina composite electrolyte synthesized via a citrate sol–gel method. Ceram. Int. 2014, 40, 9055–9060. [Google Scholar] [CrossRef]
- Li, Z.-X.; Wang, B.-L. Robust Attitude Tracking Control of Spacecraft in the Presence of Disturbances. J. Guid. Control. Dyn. 2007, 30, 1156–1159. [Google Scholar] [CrossRef]
- Wu, J.; Shi, J.; Hong, Y.; Zhu, P.C. Effect of Chromium on electrochemical and mechanical properties of beta-AL2O3 solid electrolyte. Mater. Res. Express 2020, 7, 105502. [Google Scholar] [CrossRef]
Publisher’s Note: MDPI stays neutral with regard to jurisdictional claims in published maps and institutional affiliations. |
© 2020 by the authors. Licensee MDPI, Basel, Switzerland. This article is an open access article distributed under the terms and conditions of the Creative Commons Attribution (CC BY) license (http://creativecommons.org/licenses/by/4.0/).