Article

Enhancing the Solubility and Dissolution Performance of Safinamide Using Salts

School of Chemical Engineering and Resource Recycling, Wuzhou University, Wuzhou 543000, China
*
Author to whom correspondence should be addressed.
Crystals 2020, 10(11), 989; https://doi.org/10.3390/cryst10110989
Submission received: 16 September 2020 / Revised: 24 October 2020 / Accepted: 29 October 2020 / Published: 31 October 2020

Abstract

:
Safinamide (SAF) is an anti-Parkinson’s disease (PD) drug that has selective monoamine oxidase type-B (MAO-B) inhibition activity. In 2017, SAF was approved by the U.S. Food and Drug Administration (FDA) as safinamide mesylate (SAF-MS, marketed as Xadago). Owing to its poor solubility in water, SAF is a Biopharmaceutics Classification System BCS Class II compound. In this study, four salts of safinamide (with hydrochloric acid (HCl), hydrobromic acid (HBr), and maleic acid (MA)) were obtained and characterized using single crystal X-ray diffraction (SCXRD), powder X-ray diffraction (PXRD), differential scanning calorimetry (DSC), and thermogravimetry (TG). The solubility and dissolution rate of all salts were systematically studied in water and phosphate buffer (pH 6.86) solutions. The accelerated stability tests indicated that all salts, except SAF-MA, had good stability under high humidity conditions.

Graphical Abstract

1. Introduction

Approximate 40% of drug candidates fail during the late stages of drug discovery owing to their poor water solubility and intrinsic dissolution rate (IDR) [1,2]. Recently, many methods have been developed, such as solid dispersion [3], nanocrystals [4], cocrystal [5,6,7], salts [8,9,10], to improve the water solubility of poorly soluble drugs [11]. One of the key challenges is to improve the solubility of poorly soluble drugs without changing their other properties, including stability, covalent bonding structures, mechanical properties, and pharmacological behaviors. The formation of salts is a well-established approach for tailoring the physicochemical properties of drugs without altering the drug molecule [12,13,14,15,16,17,18,19,20,21].
Safinamide (SAF, Figure 1) is an anti-Parkinson’s disease drug with selective monoamine oxidase type-B inhibition activity [22,23,24,25,26]. Safinamide is a Biopharmaceutics Classification System (BCS) II drug with low solubility and high permeability, and it has been commercialized in its salt form, safinamide mesylate (marketed as Xadago) and was approved, in 2017, by the U.S. Food and Drug Administration. To date, there have been no relevant studies undertaken on the crystal structure and physicochemical properties of cocrystals and salts of safinamide. In the present study, a series of conformers containing organic and inorganic acids were used to interact with safinamide (Supplementary Materials Table S1), and four novel salts of safinamide with hydrochloric acid (HCl), hydrobromic acid (HBr), and maleic acid (MA) were prepared and characterized, and their solubilities, IDRs and stability were evaluated. The results indicated that all novel salts had improved solubilities and IDRs.

2. Materials and Methods

2.1. Instrumentations and Materials

Safinamide (SAF) was purchased from Shanghai BioChemPartner Co. Ltd. (Shanghai, China). The coformers HCl, HBr, and MA were purchased from Aladdin Biochemical Technology Co. Ltd. (Shanghai, China). All solvents used were purchased from Ghtech Co. Ltd. (Guangzhou, China). The data from the X-ray diffraction of the powdered chemicals were measured using a powder diffractometer model D8 ADVANCE (Karlsruhe, Germany) with a tube of Cu Kα radiation (λ = 1.5418 Å) at 40 mA and 40 kV and data were collected within the range of 3–60°. Differential scanning calorimetry (DSC) was performed on a Mettler-Toledo machine at a rate of heating of 10 °C/min within the range of 25–250 °C under nitrogen flow at a rate of 20 mL/min. Thermogravimetric (TG) analysis was performed on a Perkin-Elmer TGA 4000 (Shanghai, China) equipment with a heating rate of 10 °C/min in the 25–500 °C range under nitrogen flow at a rate of 20 mL/min. All single crystal X-ray diffraction (SCXRD) data were collected on a Bruker Apex II CCD diffractometer (Karlsruhe, Germany) with Mo Kα radiation (λ = 0.71073 Å) at 293 K. The X-ray generator was operated at 50 kV and 30 mA. All the structures were solved by direct methods and refined using SHELX-97 (SHELX97 version) [27,28]. All atoms were placed at the geometrically calculated positions, except for the O–H and N–H hydrogen atoms. The crystallographic parameters of all the salts are summarized in Table 1 and the hydrogen bonds are listed in Table 2.

2.2. Preparation of Safinamide Salts

SAF-HCl (1:1) salt: In a 25 mL round-bottom flask, SAF (40 mg) and HCl (30 μL) were dissolved in 4 mL of ethyl-acetate-water saturated solution and stirred constantly for 1 h. The flask was, then, kept at room temperature to slowly evaporate, and needle single crystals were obtained after 7–10 days.
SAF-HBr (1:1) salt: In a 25 mL round-bottom flask, SAF (40 mg) and HBr (50 μL) were dissolved in 5 mL of methanol/water (9:1, v/v) and stirred constantly for 1 h. The flask was, then, kept at room temperature to slowly evaporate, and block single crystals were obtained after 7–10 days.
SAF-MA (1:1) salt: In a 25 mL round-bottom flask, SAF (20 mg) and MA (7.7 mg) were dissolved in 4 mL of methanol and stirred constantly for 1 h. The flask was, then, kept at room temperature to slowly evaporate, and needle single crystals were obtained after 4–5 days.
SAF-MA-H2O (1:1:1) salt: In a 25 mL round-bottom flask, SAF (40 mg) and MA (15.4 mg) were dissolved in 6 mL of acetone/water (4:1, v/v) and stirred constantly for 1 h. The flask was, then, kept at room temperature to slowly evaporate, and needle single crystals were obtained after 2–3 days.

2.3. Solubility and Intrinsic Dissolution Rate (IDR) Studies

Previous studies on the solubility of SAF and related salts have been conducted using the excessive powder dissolution method [29]. SAF absorbance was determined at a wavelength λmax = 225 nm in water and phosphate buffer (pH 6.86) solutions. The curve of intensity versus the concentration calibration was plotted using this absorbance value for the SAF and related salts. For the solubility experiments, excessive safinamide and its salts were placed in water and pH 6.86 phosphate buffer medium, respectively. In all solubility experiments, the solutions were stirred at a speed of 500 rpm using a magnetic stirrer at a temperature of 37 °C and the stirring process lasted for 24 h. During the process, subsamples (5 mL) were removed and filtered using membrane filters (0.22 μm). Then, based on UV-spectroscopy, the absorbance was determined. The undissolved residues were vacuum dried and further characterized by powder X-ray diffraction (PXRD). All tests were repeated six times.
The IDRs of the SAF and its related salts were determined using a PJ-3 LAB Tablet Four-Usage Tester (Tianjin Guoming Medical Equipment Co. LTD (Tianjin, China)). A total of 150 mg sample (SAF and its salts) was compressed with a smooth surface by applying a pressure of 1.8 MPa for 5 min in an area of 1.3 cm2. The pellets were dipped in a dissolution medium (500 mL), i.e., water or pH 6.86 phosphate buffer medium. The temperature was set at 37 °C and a rotating paddle was used to stir the medium at 100 rpm. The dissolution medium (5 mL) was withdrawn at the following intervals: 5, 10, 15, 20, 30, 45, 60, 90, and 120 min, and replaced each time with the same amount of fresh medium. Samples were filtered through 0.22 μm membrane filters, and then the absorbance was determined using a UV-spectroscopy. All tests were performed in triplicate.

2.4. Stability Studies

The stability studies of SAF and its salts was performed under different humidity environments at 25 °C. The different relative humidity treatments were 75% (sodium chloride in saturated state), 85% (potassium chloride in saturated state), and 97% (potassium sulfate in saturated state). The samples were placed in an incubator after 14 days and assessed using PXRD data.

3. Results

3.1. Crystal Structure Analysis

3.1.1. Crystal Structure of SAF-HCl (1:1) Salt

The SAF-HCl salt crystallize in an orthorhombic space group P212121. The asymmetric unit of SAF-HCl contained one SAFH+ cation and one Cl- anion, which were connected by N1+−H1B···Cl1 (3.219(4) Å) and N2−H2A···Cl1 (3.228(4) Å) charge-assisted hydrogen bond forming a one-dimensional zigzag chain structure (Figure 2).

3.1.2. Crystal Structure of SAF-HBr (1:1) Salt

Similar to SAF-HCl, the SAF-HBr salt crystallize in an orthorhombic space group P212121 with one SAFH+ cation and one Br- anion in the asymmetric unit. A one-dimensional zigzag chain structure was observed between SAF cations and HBr anions through N1+−H1A···Br1 (3.436(4) Å), N1+−H1B···Br1 (3.410(4) Å), N1−H2A···Br1 (3.503(4) Å), and N2−H2B···Br1 (3.443(4) Å) charge-assisted hydrogen bonds (Figure 3).

3.1.3. Crystal Structure of SAF/MA (1:1) Salt

The SAF-MA salt crystallize in an orthorhombic space group P212121. The asymmetric unit of SAF-MA contained one SAFH+ cation and one MA- anion, which were connected by N1+−H1B···O4 (3.049(5) Å), O5–H5···O4 (2.439(5) Å), N2−H2B···O5 (3.066(5) Å), and N2−H2A···O2 (2.908(5) Å) charge-assisted hydrogen bond forming a trimerical R 4 4 (11) two-dimensional sheet structure (Figure 4). The two-dimensional sheet was further linked through N1+−H1A···O3 (2.760(5) Å) charge-assisted hydrogen bond forming a three-dimensional structure.

3.1.4. Crystal Structure of SAF/MA/H2O (1:1:1) Salt Hydrate

The SAF-MA-H2O salt hydrate crystallize in a triclinic space group P1. The asymmetric unit of SAF-MA-H2O contained one SAFH+ cation, one MA- anion, and one water molecule, which were connected by N1+−H1A···O7 (2.787(3) Å), N1+−H1B···O6 (2.825(3) Å), N2−H2A···O3 (2.909(3) Å), N2−H2B···O4 (3.000(3) Å), O4–H4···O5 (2.402(3) Å), and O7−H7C···O6 (2.846(3) Å) charge-assisted hydrogen bond forming a closely linked R 7 7 (20) two-dimensional sheet structure (Figure 5).

3.2. Powder X-ray Diffraction (PXRD) Analyse

The PXRD diffractograms of SAF, SAF-HCl, SAF-HBr, SAF-MA and SAF-MA-H2O are shown in Figure 6. The results demonstrated that the experimental patterns were consistent with the simulated patterns calculated by Mercury using the refined single crystal X-ray data.

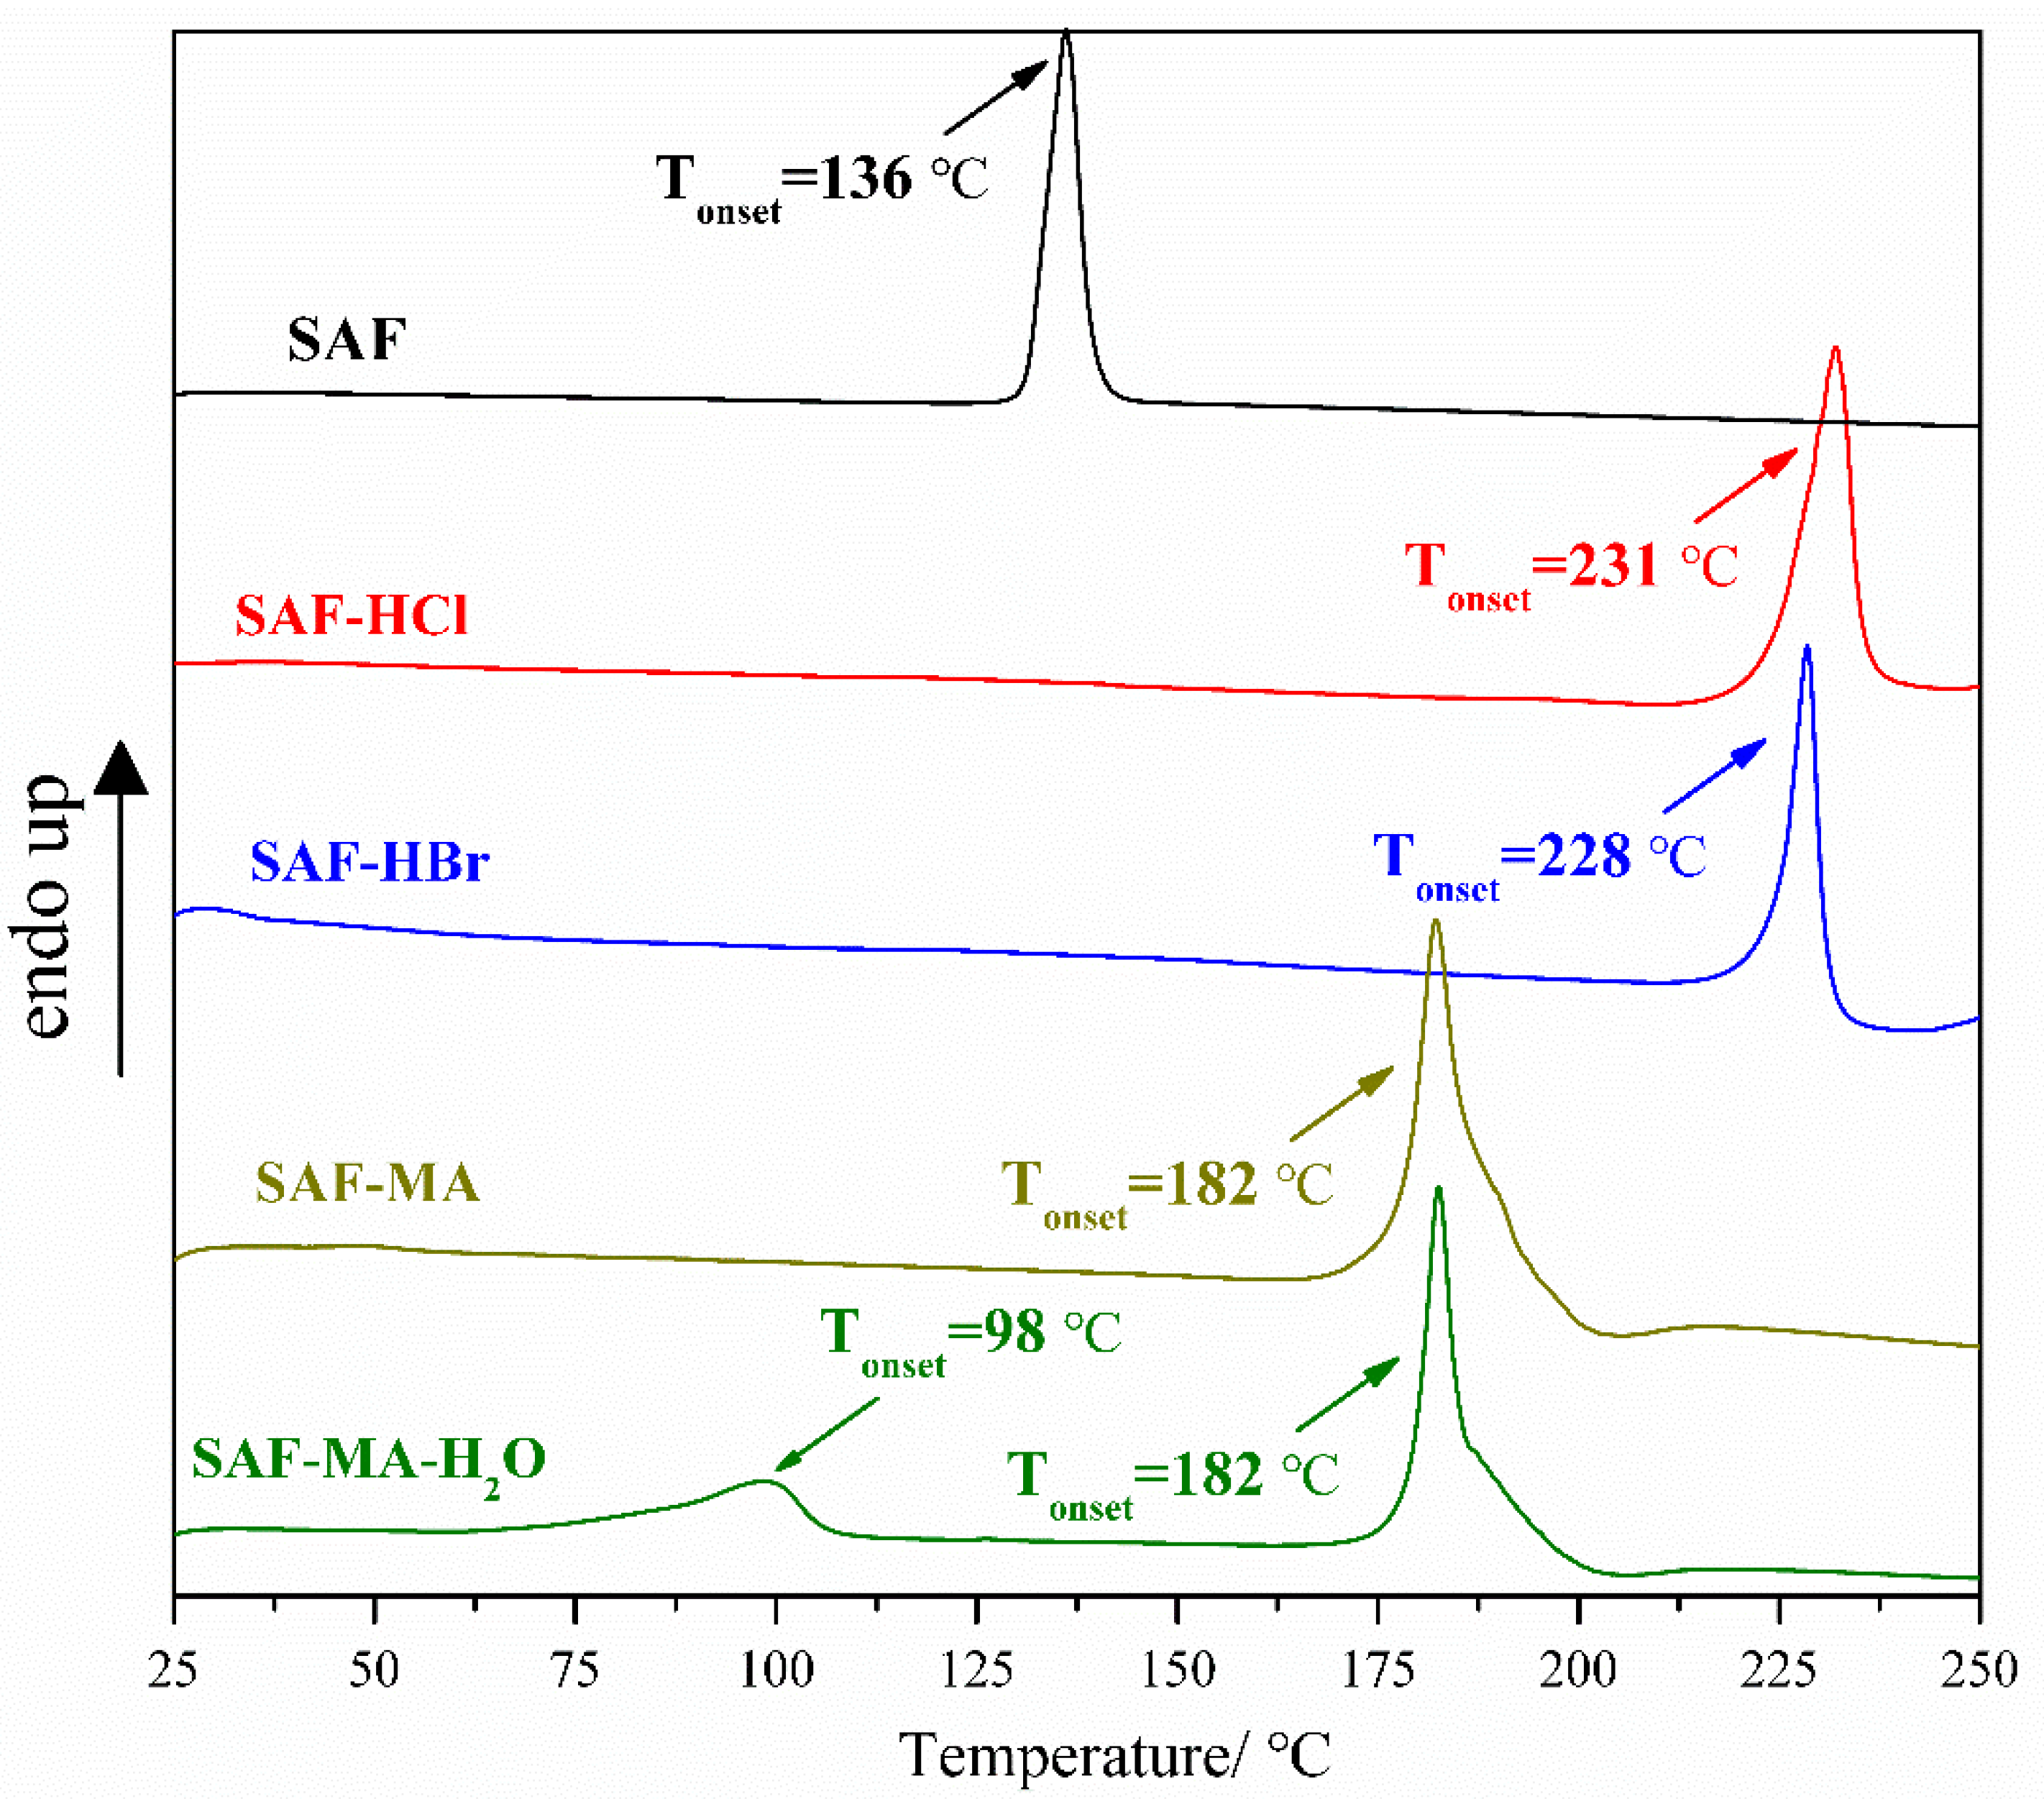
3.3. Thermal Analyses

Differential scanning calorimetry and thermogravimetry methods are usually employed to assess the thermodynamic stability of solid forms. Herein, the DSC and TG curves of SAF and all salts are shown in Figure 7 and Figure S1. The DSC curves of SAF, SAF-HCl, SAF-HBr, and SAF-MA showed an endothermic peak at 136 °C, 231 °C, 228 °C, and 182 °C, respectively, with the temperature attributed to the melting point of the solid forms. The DSC curve of SAF-MA-H2O exhibited abroad peak in the range of 50–110 °C, which may be attributed to the release of water in the crystal cell. Another endothermic peak at 182 °C was observed, which was assigned to the melting point of SAF-MA-H2O. The TG curves of SAF, SAF-HCl, SAF-HBr, and SAF-MA began to decompose with the formation of volatile compound(s) at 200 °C, 224 °C, 222 °C, and 177 °C, respectively. The TG curves of SAF-MA-H2O showed a weight loss of 4.38% at the range of 50–110 °C, which was attributed to water loss (calculated 4.13%). SAF-MA-H2O began to decompose at 177 °C, which meant that the melting observed was a melting/degradation due to the fact that the baseline was not reached after the phase transition, and then we continued the TGA experiments that confirmed the decomposition phenomenon.

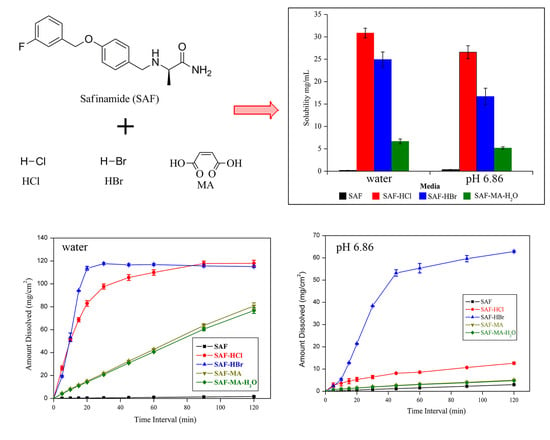
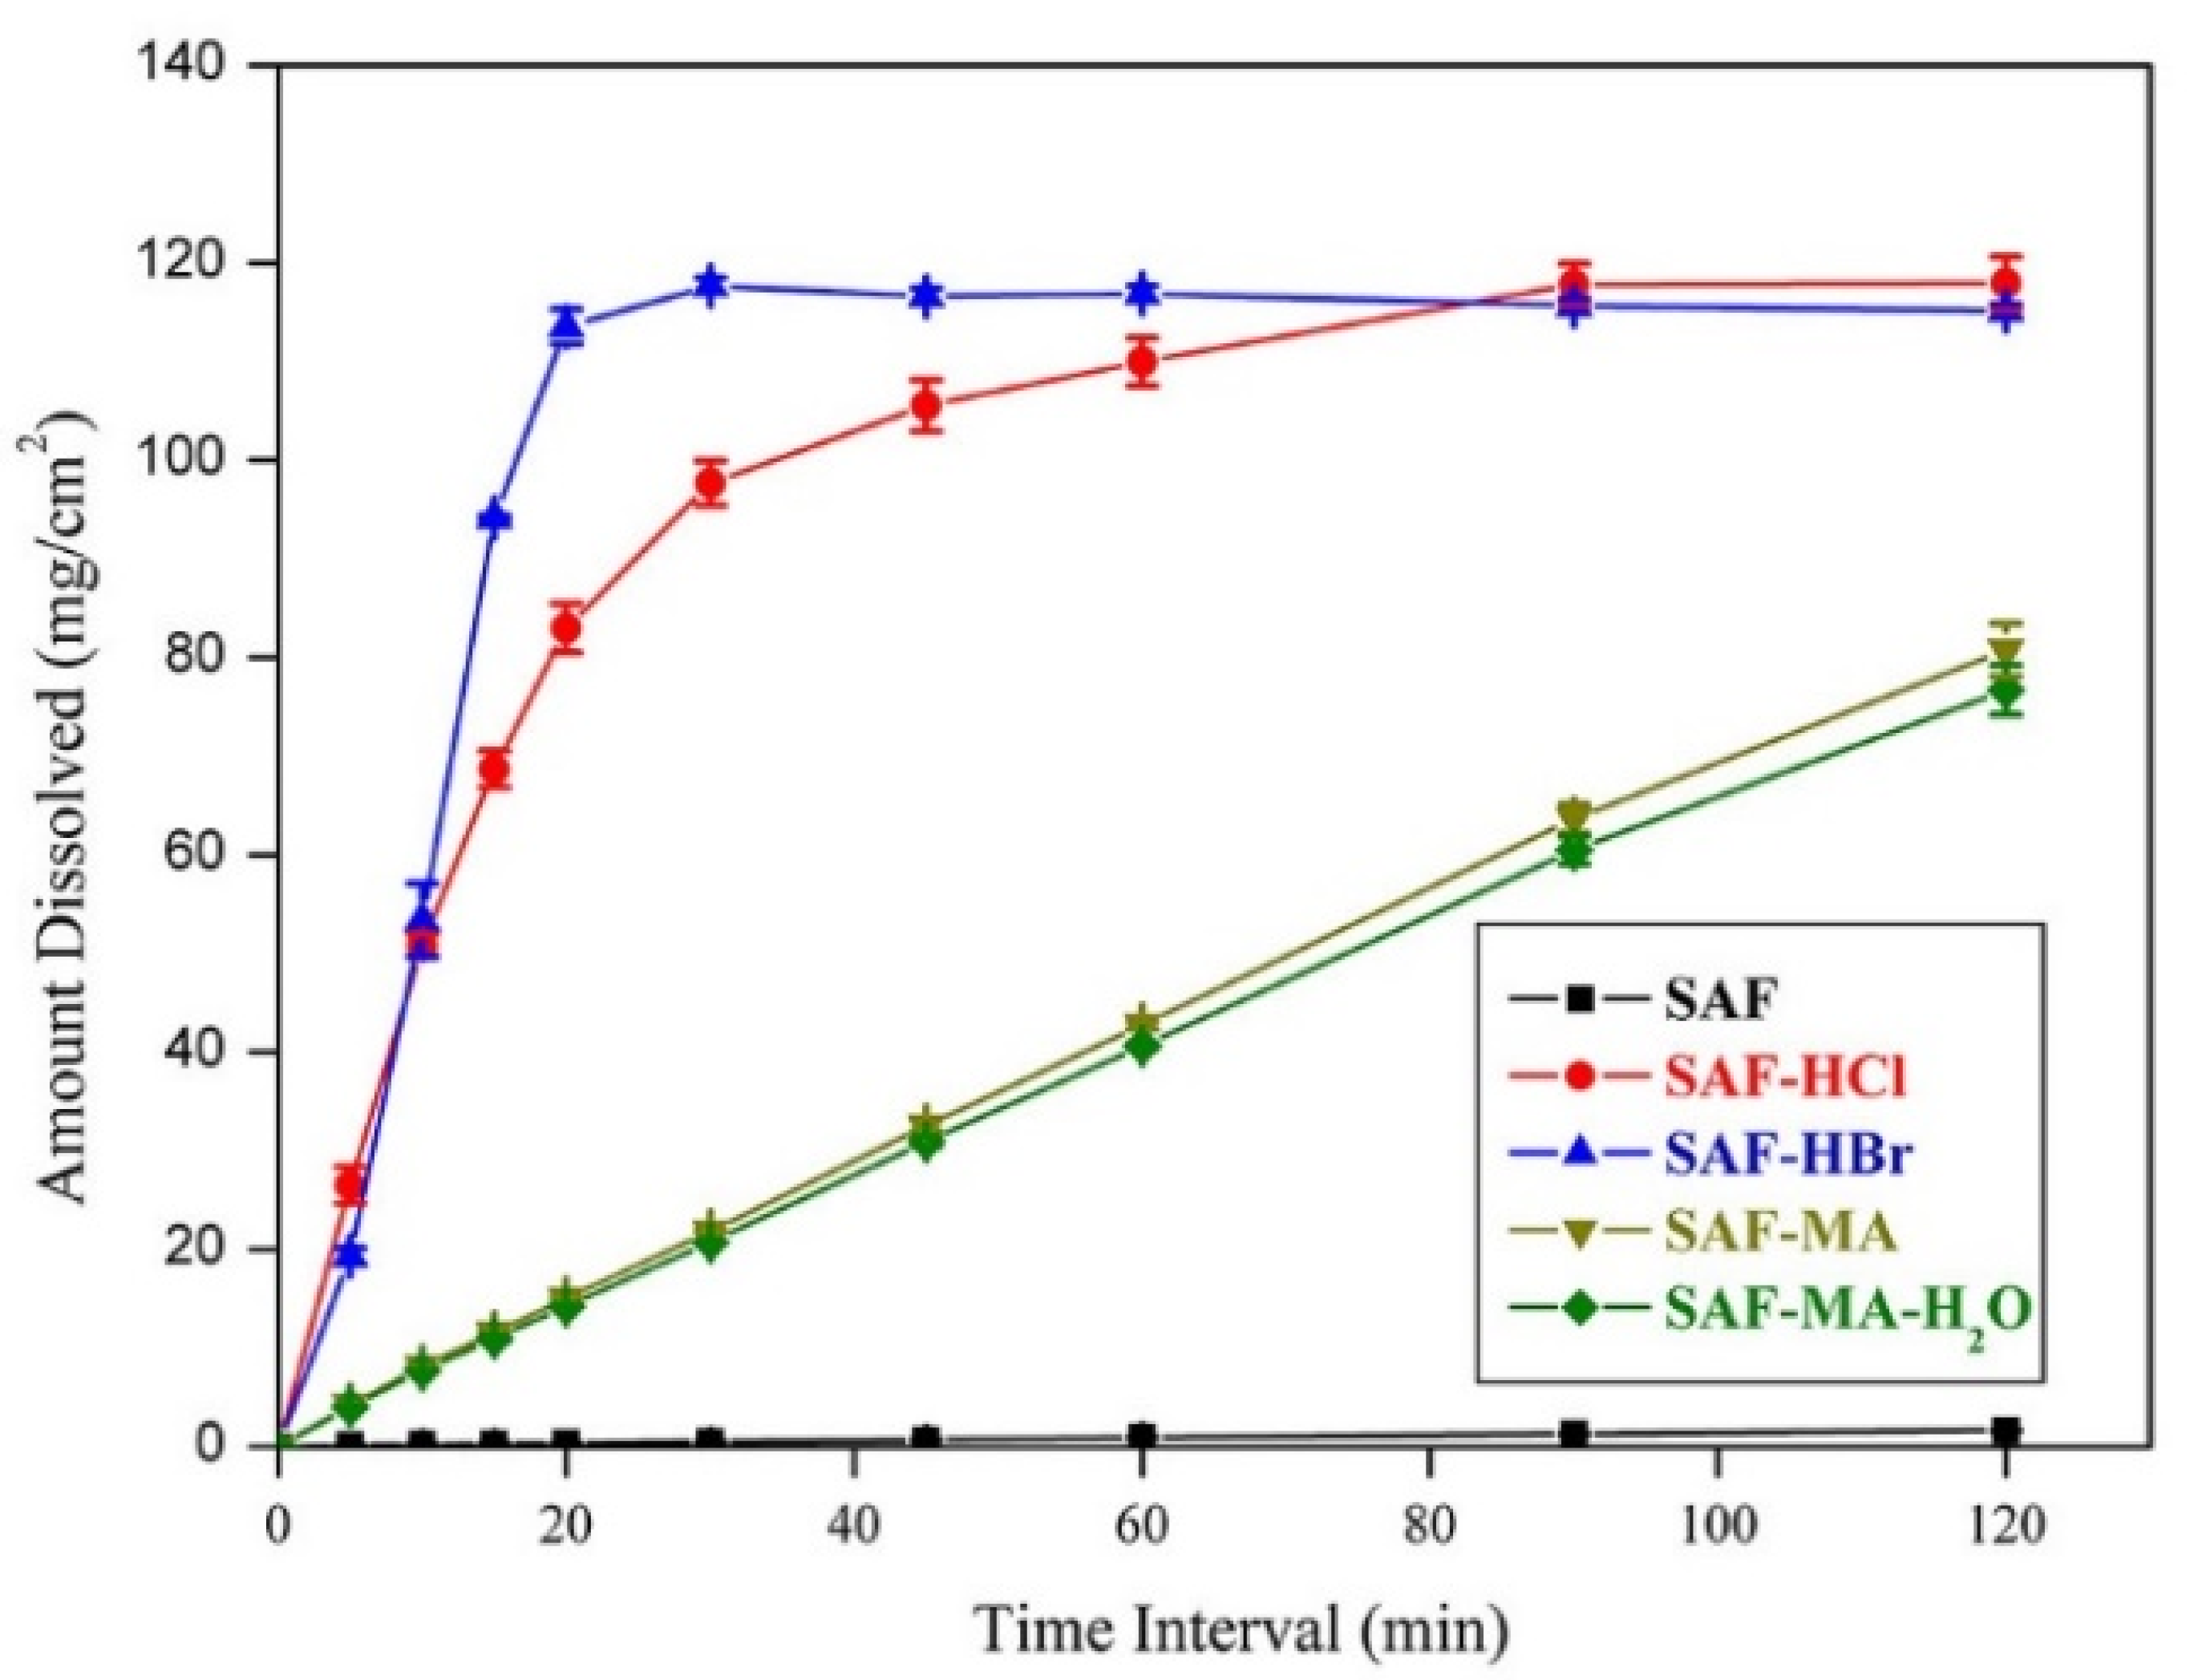
3.4. Solubility and Dissolution Studies

Solubility is the intrinsic property of a drug and affects its absorption in the body, whereas the dissolution rate is a dynamical parameter that is a measure within a specific time. The solubility and IDR at 37 °C for the SAF and its salts are listed in Table 3. PXRD analyses of the undissolved residue at the completion of the solubility experiments indicated that SAF, SAF-HCl, SAF-HBr, and SAF-MA-H2O salts were stable in water and phosphate buffer (pH 6.86) solution (Figures S2–S5), whereas SAF-MA salt was completely transformed to SAF-MA-H2O (Figure S6).
The solubility profiles for SAF and its salts are shown in Figure 8 and the result showed the SAF-HCl, SAF-HBr, and SAF-MA-H2O salts exhibited a significant solubility advantage over that of SAF either in water or phosphate buffer (pH 6.86). The solubility values followed the order of SAF-HCl > SAF-HBr > SAF-MA-H2O > SAF in water and pH 6.86 phosphate buffer. Interestingly, the IDR values followed the order of SAF-HBr > SAF-HCl > SAF-MA > SAF-MA-H2O > SAF in water and phosphate buffer (pH 6.86) (Figures S7 and S8). The IDR results indicated that SAF-HBr showed better dissolution dynamics than that of SAF-HCl, although SAF-HCl had a higher solubility. The intrinsic dissolution profiles in water and phosphate buffer (pH 6.86) are shown in Figure 9 and Figure 10. The results confirmed that the dissolution rates of the four salts produced in the present study were superior to that of SAF. The SAF-HBr salt exhibited the best dissolution enhancement as compared with the others in water and phosphate buffer (pH 6.86). Thus, SAF-HCl salt had a better dissolution rate that that of SAF-HBr salt from 90 min to 120 min. This may be attributed to the solubility advantage of SAF-HCl.

3.5. Stability Studies

Drug stability is an important index for evaluating drug shelf life. The accelerated stability tests of SAF and all four salts under different humidity conditions (25 °C/75%, 25 °C/85%, 25 °C/97%) were tested for 14 days. The results from the PXRD analysis indicated that all salts except SAF-MA had good stability under the three humidity conditions (Figures S9–S12). However, the SAF-MA salt was not stable at high humidity (Figure S13) and some of this salt transformed to SAF-MA-H2O. The evidence for this was the characteristic peaks at 7.96, 11.16, 15.76 and 16.22°, which were attributed to the SAF-MA-H2O salt.

4. Conclusions

In summary, four pharmaceutical salts of anti-Parkinson’s disease drug safinamide were successfully synthesized and characterized using slow solvent evaporation techniques. The crystal structures and physicochemical properties of these salts were investigated. The solubility studies revealed that SAF-HCl, SAF-HBr, and SAF-MA-H2O salts improved the solubility of this API in water and phosphate buffer (pH 6.86). All salt forms exhibited better dissolution rates than that of SAF. Furthermore, SAF-MA salt completely transformed to SAF-MA-H2O in water and phosphate buffer (pH 6.86). The accelerated stability tests indicated that all salts, except SAF-MA, had good stability. Considering the solubility, dissolution rate, and stability advantages, SAF-HCl, SAF-HBr, and SAF-MA-H2O salts have the potential to be developed into effective oral preparations.

Supplementary Materials

The following are available online at https://www.mdpi.com/2073-4352/10/11/989/s1, Figure S1: Thermogravimetry (TG) curves of SAF, SAF-HCl, SAF-HBr, SAF-MA, and SAF-MA-H2O salts, Figure S2: PXRD analysis of the residual materials of SAF after 24 h solubility in aqueous and pH 6.86 phosphate buffer medium, Figure S3: PXRD analysis of the residual materials of SAF-HCl after 24 h solubility in aqueous and pH 6.86 phosphate buffer medium, Figure S4: PXRD analysis of the residual materials of SAF-HBr after 24 h solubility in aqueous and pH 6.86 phosphate buffer medium, Figure S5: PXRD analysis of the residual materials of SAF-MA-H2O after 24 h solubility in aqueous and pH 6.86 phosphate buffer medium, Figure S6: PXRD analysis of the residual materials of SAF-MA after 24 h solubility in aqueous and pH 6.86 phosphate buffer medium, Figure S7: IDR profiles for SAF, SAF-HCl (20 min shown), SAF-HBr (20 min shown), SAF-MA and SAF-MA-H2O salts in water at 37 °C, Figure S8: IDR profiles for SAF, SAF-HCl (30 min shown), SAF-HBr (30 min shown), SAF-MA, and SAF-MA-H2O salts in phosphate buffer pH 6.86 at 37 °C, Figure S9: PXRD profiles for SAF after storage at 25 °C under various RH conditions for 14 days, Figure S10: PXRD profiles for SAF-HCl salt after storage at 25 °C under various RH conditions for 14 days, Figure S11: PXRD profiles for SAF-HBr salt after storage at 25 °C under various RH conditions for 14 days, Figure S12: PXRD profiles for SAF-MA-H2O salt after storage at 25 °C under various RH conditions for 14 days, Figure S13: PXRD profiles for SAF-MA after storage at 25 °C under various RH conditions for 14 days. Crystallographic data, deposition number 2010646-2010649, were deposited with the Cambridge Crystallographic Data Centre. These data can be obtained free of charge from the Cambridge Crystallographic Data Centre via www.ccdc.cam.ac.uk/structures.

Author Contributions

Conceptualization, L.G. and X.-R.Z.; methodology, L.G. and X.-R.Z.; formal analysis, L.G., X.-R.Z., and Q.L.; investigation, L.G., X.-R.Z., and Q.L.; writing—original draft preparation, L.G. and X.-R.Z.; funding acquisition, L.G. and X.-R.Z. All authors have read and agreed to the published version of the manuscript.

Funding

This research was funded by the Guangxi Natural Science Foundation (grant no. 2018GXNSFBA281167), the Basic Ability Promotion Project of Middle-aged and Young Teachers in Colleges and Universities in Guangxi (grant nos. 2019KY0700 and 2020KY17020) and the Wuzhou University Foundation (grant no. 2018B011).

Conflicts of Interest

The authors declare no conflict of interest.

References

  1. Lipinski, C.A.; Lombardo, F.B.; Dominy, W.; Feeney, P.J. Experimental and computational approaches to estimate solubility and permeability in drug discovery and development q settings. Adv. Drug Deliv. Rev. 2001, 1–3, 3–26. [Google Scholar] [CrossRef]
  2. Lipinski, C.A. Poor aqueous solubility-An industry wide problem in drug discovery. Am. Pharm. Rev. 2002, 5, 82–85. [Google Scholar]
  3. Leuner, C.; Dressman, J. Improving drug solubility for oral delivery using solid dispersions. Eur. J. Pharm. Biopharm. 2000, 50, 47–60. [Google Scholar] [CrossRef]
  4. Hecq, J.; Deleers, M.; Fanara, D.; Vranckx, H.; Amighi, K. Preparation and characterization of nanocrystals for solubility and dissolution rate enhancement of nifedipine. Int. J. Pharm. 2005, 1–2, 167–177. [Google Scholar] [CrossRef] [PubMed]
  5. Ahmad, I.; Ganie, A.A.; Dar, A.A. Achievement of enhanced solubility and improved optics in the molecular complexes based on sulfonate-pyridinium supramolecular synthon. CrystEngComm 2020, 22, 3933–3942. [Google Scholar] [CrossRef]
  6. Huang, N.; Nair, R.H. Engineering cocrystal solubility, stability, and pH(max) by micellar solubilization. J. Pharm. Sci. 2011, 100, 5219–5234. [Google Scholar] [CrossRef] [Green Version]
  7. Huang, Y.; Zhang, B.; Gao, Y.; Zhang, J.; Shi, L. Baicalein-nicotinamide cocrystal with enhanced solubility, dissolution, and oral bioavailability. J. Pharm. Sci. 2014, 103, 2330–2337. [Google Scholar] [CrossRef]
  8. Sanphui, P.; Tothadi, S.; Ganguly, S.; Desiraju, G.R. Salt and cocrystals of sildenafil with dicarboxylic acids: Solubility and pharmacokinetic advantage of the glutarate salt. Mol. Pharm. 2013, 10, 4687–4697. [Google Scholar] [CrossRef]
  9. Gao, L.; Zhang, X.R.; Yang, S.P.; Liu, J.J.; Chen, C.J. Improved solubility of vortioxetine using c2-c4 straight-chain dicarboxylic acid salt hydrates. Crystals 2018, 8, 352. [Google Scholar] [CrossRef] [Green Version]
  10. Dai, X.L.; Wu, C.; Li, J.H.; Liu, L.C.; He, X.; Lu, T.B.; Chen, J.M. Modulating the solubility and pharmacokinetic properties of 5-fluorouracil via cocrystallization. CrystEngComm 2020, 22, 3670–3682. [Google Scholar] [CrossRef]
  11. Couillaud, B.M.; Espeau, P.; Mignet, N.; Corvis, Y. State of the art of pharmaceutical solid forms: From crystal property issues to nanocrystals formulation. ChemMedChem 2019, 14, 8–23. [Google Scholar] [CrossRef] [Green Version]
  12. Sathisaran, I.; Dalvi, S. Engineering Cocrystals of Poorly Water-Soluble Drugs to Enhance Dissolution in Aqueous Medium. Pharmaceutics 2018, 10, 108. [Google Scholar] [CrossRef] [PubMed] [Green Version]
  13. Owoyemi, B.C.D.; da Silva, C.C.; Diniz, L.F.; Souza, M.S.; Ellena, J.A.; Carneiro, R.L. Fluconazolium oxalate: Synthesis and structural characterization of a highly soluble crystalline form. CrystEngComm 2019, 21, 1114–1121. [Google Scholar] [CrossRef]
  14. Arabiani, M.R.; Lodagekar, A.; Yadav, B.; Chavan, R.B.; Shastri, N.R.; Purohit, P.Y.; Shelat, P.; Dave, D. Mechanochemical synthesis of brexpiprazole cocrystals to improve its pharmaceutical attributes. CrystEngComm 2019, 21, 800–806. [Google Scholar] [CrossRef]
  15. Park, B.; Yoon, W.; Yun, J.; Ban, E.; Yun, H.; Kim, A. Emodin-nicotinamide (1:2) cocrystal identified by thermal screening to improve emodin solubility. Int. J. Pharm. 2019, 557, 26–35. [Google Scholar] [CrossRef] [PubMed]
  16. Lu, Q.; Dun, J.; Chen, J.M.; Liu, S.; Sun, C.C. Improving solid-state properties of berberine chloride through forming a salt cocrystal with citric acid. Int. J. Pharm. 2019, 554, 14–20. [Google Scholar] [CrossRef]
  17. Childs, S.L.; Hardcastle, K.I. Cocrystals of chlorzoxazone with carboxylic acids. CrystEngComm 2007, 9, 364–367. [Google Scholar] [CrossRef]
  18. Brittain, H.G. Cocrystal Systems of Pharmaceutical Interest: 2011. Cryst. Growth Des. 2012, 12, 1046–1054. [Google Scholar] [CrossRef]
  19. Barbas, R.; Font-Bardia, M.; Paradkar, A.; Hunter, C.A.; Prohens, R. Combined Virtual/Experimental Multicomponent Solid Forms Screening of Sildenafil: New Salts, Cocrystals and Hybrid Salt-Cocrystals. Cryst. Growth Des. 2018, 18, 7618–7627. [Google Scholar] [CrossRef]
  20. Nechipadappu, S.K.; Reddy, I.R.; Tarafder, K.; Trivedi, D.R. Salt/Cocrystal of Anti-Fibrinolytic Hemostatic Drug Tranexamic acid: Structural, DFT, and Stability Study of Salt/Cocrystal with GRAS Molecules. Cryst. Growth Des. 2018, 19, 347–361. [Google Scholar] [CrossRef]
  21. Sarma, B.; Bora, P.; Saikia, B. Regulation of π…π Stacking Interactions in Small Molecule Cocrystals and/or Salts for Physiochemical Property Modulation. Cryst. Growth Des. 2018, 18, 1448–1458. [Google Scholar]
  22. Onofrj, M.; Bonanni, L.; Thomas, A. An expert opinion on safinamide in Parkinson’s disease. Expert. Opin. Investig. Drugs 2008, 17, 1115–1125. [Google Scholar] [CrossRef] [PubMed]
  23. Borgohain, R.; Kandadai, R.M. Safinamide: A novel anti-Parkinsonian drug with multiple actions. Neurodegener. Dis. Manag. 2013, 3, 231–240. [Google Scholar] [CrossRef]
  24. Stocchi, F.; Arnold, G.; Onofrj, M.; Kwiecinski, H.; Faroello, R.G. Improvement of motor function in early Parkinson disease by safinamide. Neurology 2004, 63, 746–748. [Google Scholar] [CrossRef]
  25. Deeks, E.D. Safinamide: First Global Approval. Drugs 2015, 75, 705–711. [Google Scholar] [CrossRef] [PubMed]
  26. Blair, H.A.; Dhilon, S. Safinamide: A Review in Parkinson’s Disease. CNS Drugs 2017, 31, 169–176. [Google Scholar] [CrossRef]
  27. Sheldrick, G.M. SHELXS 97, Program for the Solution of Crystal Structure; University of Göttingen: Göttingen, Germany, 1997. [Google Scholar]
  28. Sheldrick, G.M. SHELXL97, Program for the Refinement of Crystal Structure; University of Göttingen: Göttingen, Germany, 1997. [Google Scholar]
  29. Schultheiss, N. Pharmaceutical Cocrystals and Their Physicochemical Properties. Cryst. Growth Des. 2009, 9, 2950–2967. [Google Scholar] [CrossRef] [Green Version]
Figure 1. Chemical structures of safinamide and coformers.
Crystals 10 00989 g001
Figure 2. Safinamide (SAF) cations and hydrochloric acid (HCl) anions form a one-dimension zigzag chain structure.
Crystals 10 00989 g002
Figure 3. SAF cations and hydrobromic acid (HBr) anions form a one-dimension zigzag chain structure.
Crystals 10 00989 g003
Figure 4. SAF cations and maleic acid (MA) anions form a R 4 4 (11) synthon through N1+−H1B···O4, O5–H5···O4, N2−H2B···O5, and N2−H2A···O2 hydrogen bonds.
Crystals 10 00989 g004
Figure 5. SAF cations, MA anions, and water molecules form a closely linked R 7 7 (20) two-dimensional sheet structure.
Crystals 10 00989 g005
Figure 6. Experimental (black) and simulated (red) PXRD patterns for SAF, SAF-HCl, SAF-HBr, SAF-MA, and SAF-MA-H2O salts.
Crystals 10 00989 g006
Figure 7. Differential scanning calorimetry thermograms of SAF, SAF-HCl, SAF-HBr, SAF-MA, and SAF-MA-H2O salts.
Crystals 10 00989 g007
Figure 8. Solubility studies in water and pH 6.86 media. SAF, SAF-HCl, SAF-HBr, and SAF-MA-H2O (n = 6).
Crystals 10 00989 g008
Figure 9. Dissolution profiles for SAF, SAF-HCl, SAF-HBr, SAF-MA, and SAF-MA-H2O in water at 37 °C.
Crystals 10 00989 g009
Figure 10. Dissolution profiles for SAF, SAF-HCl, SAF-HBr, SAF-MA and SAF-MA-H2O in phosphate buffer pH 6.86 at 37 °C.
Crystals 10 00989 g010
Table 1. Crystallographic parameters of safinamide and its pharmaceutical salts.
TitleSAF-HClSAF-HBrSAF-MASAF-MA-H2O
Chemical formulaC17H20N2O2F+, ClC17H20N2O2F+, BrC17H20N2O2F+, C4H3O4C17H20N2O2F+, C4H3O4, H2O
Molecular formulaC17H20N2O2FClC17H20N2O2FBrC21H24N2O6FC21H25N2O7F
Formula weight338.80383.26418.41436.43
Crystal systemorthorhombicorthorhombicorthorhombictriclinic
Space groupP212121P212121P212121P1
a [Å]5.2766(8)5.2340(4)5.7326(5)5.9202(8)
b [Å]12.174(2)13.8352(11)9.2498(12)8.5781(11)
c [Å]26.389(5)24.0985(17)38.155(4)11.8413(15)
α[°]909090105.072(11)
β[°]909090101.299(11)
γ[°]909090105.145(11)
Z4441
V (Å3)1695.2(5)1745.1(2)2023.2(4)537.57(12)
Dcalc (g cm−3)1.3271.4591.3741.348
μ (mm−1)0.2462.3760.1070.107
R1 (I > 2σ (I))0.06330.04490.08090.0512
wR2 (all data, F2)0.07800.07830.13720.1062
GOF0.9550.9941.0621.029
Rint0.05370.05880.09170.0323
Largest diff. peak and hole (e·Å−3)0.200/−0.1820.416/−0.3310.184/−0.2050.153/−0.124
CCDC2010647201064620106492010648
Table 2. Hydrogen bond distances (Å) and angles (°) of safinamide and its salts.
H-Bondd(D−H)d(H···A)d(D···A)∠(DHA)Symmetry Code
SAF-HCl
N1+−H1A···Cl10.972.463.366(4)156−x, y−1/2, −z+1/2
N1+−H1B···Cl10.892.363.219(4)164−x, y−1/2, −z+1/2
N2−H2A···Cl10.862.373.228(4)175x, y−1, z
N2−H2B···Cl10.892.563.332(4)145x−1, y−1, z
SAF-HBr
N1+−H1A···Br10.892.543.436(4)176−x+1, y+1/2, −z+1/2
N1+−H1B···Br11.042.453.410(4)152−x+1, y+1/2, −z+1/2
N2−H2A···Br10.862.793.503(4)141x+1, y+1, z
N2−H2B···Br10.862.593.443(4)170x, y+1, z
SAF-MA
N1+−H1A···O30.871.892.760(5)174x, y, z
N1+−H1B···O41.012.053.049(5)169x−1, y, z
N2−H2A···O20.961.972.908(5)163−x+1, y−1/2, −z+1/2
N2−H2B···O50.902.353.066(5)137−x+1, y−1/2, −z+1/2
O5−H5···O40.941.512.439(5)173x, y, z
SAF-MA-H2O
N1+−H1A···O70.901.922.787(3)161x, y−1, z
N1+−H1B···O60.901.992.825(3)153x, y, z
N2−H2A···O30.862.072.909(3)166x+1, y, z+1
N2−H2B···O40.872.193.000(3)155x, y, z+1
O7−H7C···O60.902.092.846(3)141x−1, y+1, z
O4−H4···O50.901.622.402(3)142x, y, z
Table 3. Solubility and intrinsic dissolution rate (IDR) of safinamide and its new salts in water and pH 6.86.
CompoundAqueous Solubility (mg/mL)Solubility at pH 6.86 (mg/mL)IDR in Aqueous Medium
(mg/cm2/min)
IDR at pH 6.86
(mg/cm2/min)
SAF0.190.390.0130.024
SAF-HCl30.8626.594.160.14
SAF-HBr24.9316.696.031.49
SAF-MAUnstableUnstable0.670.037
SAF-MA-H2O6.665.180.640.035
Publisher’s Note: MDPI stays neutral with regard to jurisdictional claims in published maps and institutional affiliations.

