Article

Investigating the Interaction between Persistent Slip Bands and Surface Hard Coatings via Crystal Plasticity Simulations

1
Department of Mechanical Engineering, Auburn University, Auburn, AL 36849, USA
2
National Center for Additive Manufacturing Excellence (NCAME), Auburn University, Auburn, AL 36849, USA
3
Mechanical and Materials Engineering, University of Nebraska-Lincoln, Lincoln, NE 68588, USA
4
Nebraska Center for Materials and Nanoscience, University of Nebraska-Lincoln, Lincoln, NE 68588, USA
*
Author to whom correspondence should be addressed.
Crystals 2020, 10(11), 1012; https://doi.org/10.3390/cryst10111012
Submission received: 21 September 2020 / Revised: 2 November 2020 / Accepted: 4 November 2020 / Published: 6 November 2020
(This article belongs to the Special Issue Crystal Plasticity at Micro- and Nano-scale Dimensions)

Abstract

:
Fatigue cracks often initiate from the surface extrusion/intrusions formed due to the operation of persistent slip bands (PSBs). Suppression of these surface topographical features by hard surface coatings can significantly extend fatigue lives under lower stress amplitudes (i.e., high cycle fatigue), while cracks initiate early in the coating or in the coating–substrate interface under higher stress amplitudes (i.e., low cycle fatigue), deteriorating the fatigue performance. However, both beneficial and detrimental effects of the coatings appear to be affected by the coating–substrate material combination and coating thickness. A quantitative understanding of the role of these factors in the fatigue performance of materials is still lacking. In this study, crystal plasticity simulations were employed to elucidate the dependence of the coating’s effects on two factors—i.e., the coating thickness and loading amplitudes. The results revealed that the thicker coatings more effectively suppress the operation of the PSBs, but generate higher tensile and shear stresses, normal and parallel to the interfaces, respectively, promoting interfacial delamination. The tensile stresses parallel to the interface within the coating, which favors coating fracture, are not sensitive to the coating thickness.

Graphical Abstract

1. Introduction

Fatigue cracks for many metals often initiate from surface markings (i.e., intrusions and extrusions) formed due to cyclic slip localization [1,2]. This localized slip activity is associated with permanent changes in the microstructure of the material developed during the cyclic loading, and the slip markings can re-emerge at the same locations upon reapplication of the load even after surface polishing [3]. Due to their persistent nature, these surface markings are commonly referred to as persistent slip markings (PSMs), and the localized deformation volume is referred to as persistent slip bands (PSBs). Cyclic plastic deformation in the PSBs is typically accommodated by the motion of dislocations on the primary slip system [4,5,6].
For FCC materials, these dislocations have the same Burgers vectors and form very organized bundles known as veins (see Figure 1a). When these bundles collapse along the primary slip direction, PSBs are formed [7]. A typical dislocation microstructure (i.e., the ladder structure) of the PSBs constitutes regularly spaced dislocation walls separating dislocation channels, in which screw “runner” dislocation propagates in a to-and-fro manner. The width of the dislocation channels within PSBs are on the order of 1 μm and is significantly larger than that of the one between dislocation veins. The cyclic plastic deformation therefore localizes at the PSBs [4].
PSBs typically form within a specific range of resolved plastic shear strain amplitude of Δγpl/2 ≈ 0.0001~0.01, within which the volume fraction of the PSBs linearly varies from 0% to 100%. The precise values of this range are also material-dependent. This behavior for single-crystal Cu is shown by the cyclic stress–strain curve obtained by Mughrabi [8] (see Figure 1b). Accordingly, the plastic strain amplitude within the PSB is constant at around 1% [9]. In addition, the width of the PSBs is slightly material-dependent but generally invariant with respect to the loading amplitude. As a result, the change in loading amplitude only alters the PSB density—i.e., the higher the loading amplitude is, the higher the PSB density becomes [10].
In polycrystalline metals, the location of the PSBs may shift from the surface to subsurface under very low stress or strain amplitudes (i.e., in the very high cycle fatigue regime) owing to the absence of global plasticity and the dominance of the subsurface, localized plastic deformations due to the elastic incompatibility among grains or between grains and defects [10]. Thus, the corresponding PSB–grain boundary interaction may lead to subsurface fatigue crack initiation [11]. Nevertheless, the PSM-induced surface crack initiation is still the governing mechanism in the low cycle fatigue (LCF) and high cycles fatigue (HCF) regimes encountered in many engineering applications [12,13,14]. Therefore, any surface treatments that act to suppress or interfere with the formation and/or operation of the PSBs may delay the initiation of fatigue cracks and substantially extend fatigue life. Well-known methods in this regard include intermittent surface repolishing, shot/sand surface peening, and surface hard coatings [3,15,16,17,18,19].
Surface repolishing aims to completely remove the PSMs—together with any other roughness created due to cyclic loading—at appropriate intervals mid-service, eliminating any stress concentrations (even crack embryos). Fatigue life had been shown to be extended almost indefinitely using this method, as long as sufficient serviceable material remained [15]. However, this method, due to its subtractive nature, is not suitable for part surfaces that require tight tolerances. Shot/sand peening, on the other hand, is performed prior to service and induces plastic deformation on the surface layer driven by the impact of shot or sand particles, which leaves a compressive residual stress and a refined microstructure on the surface [16,18]. However, this method results in a relatively rough surface finish and is not suitable for mating surfaces. Lastly, surface hard coatings can circumvent some disadvantages of the other methods because they are generally very thin (a few hundred nm to a μm) and create a smooth surface [19].
There are extensive works focused on examining the effect of various types of coatings—including metallic mono-/multi-layers, ceramic, metallic glass, diamond-like carbon—on the fatigue resistance of metallic specimens [17,20,21,22,23,24,25,26]. It has been generally observed that the coatings can improve the HCF performance of the test specimens, while they are often detrimental to the LCF performance. In the LCF regime, higher loading amplitudes tend to induce fracture within the coatings and/or lead to delamination at the coating–substrate interfaces. The precise effect of coatings on the fatigue resistance of a material greatly depends on several factors, including the coating–substrate material combination, mechanical properties and thickness of the coating, and the binding and shear strengths of the coating–substrate interface, etc. [17,19,27]. However, due to the time-intensive nature of the fatigue data generation, systemic evaluations of the influence of the aforementioned factors are still lacking.
Using crystal plasticity (CP) simulations, we aim to elucidate the effect of the coating thickness and the applied cyclic plastic strain amplitude on several characteristics of PSB–coating interaction that tend to influence the fatigue performance of coated materials. These characteristics include (1) the suppressive effects of coatings on the operation of PSBs, (2) the normal stress developed in the coating layer along the loading direction, (3) the interfacial normal stress developed perpendicular to the interface, and (4) the interfacial shear stress developed parallel to the interface. The first characteristic retards, while the rest accelerate, the initiation of fatigue cracks in the substrate. This work by no means attempts to perform direct CP simulations of fatigue failure of coated metallic materials. Instead, it focuses on the interaction between the coating and the PSBs under different loading amplitudes and aspires to generate an understanding that may benefit the geometrical design and material selection of the coatings. Indeed, cyclic damage (in the forms of dislocations and vacancy) accumulates during each cycle via cyclic plasticity and, upon reaching a critical level, leads to the initiation of fatigue cracks [28,29]. The surface coatings’ suppression of the plastic deformation per cycle is therefore indicative of the coatings’ beneficial effects on a part’s overall fatigue resistance. As such, instead of simulating the accumulation of cyclic damage over the entire fatigue life, this work only considers the loading portion of a single cyclic loading period after the PSBs has formed.

2. Computational Methods

CP simulations were performed using the Düsseldorf advanced material simulation kit (DAMASK) developed by the Max-Planck-Institut für Eisenforschung [30]. Spectral solver based on fast Fourier transform (FFT) implemented in the Portable, Extensible Toolkit for Scientific Computation (PETSc) was utilized to solve for the displacement field [31,32]. The simulation model is composed of substrates made of a single crystalline austenitic stainless steel (SS) 316 and physical vapor-deposited (PVD) thin Cr coatings. Prior literature has indicated that the common PVD Cr coatings are nanocrystalline and exhibit isotropic mechanical behavior [19].

2.1. Model Setup

Figure 2 illustrates the geometries of the simulation model. To investigate the characteristics of the interaction between PSBs and surface coatings, only the tensile loading portion of one fatigue cycle is applied. The intended boundary conditions (BCs) on the lateral coating surfaces are free—i.e., the surface tractions are zero. A rate-controlled uniaxial tension was applied by enforcing only the zz component of the deformation gradient rate tensor (zz), while ensuring that σxx = 0 and σyy = 0. Since this work employed the spectral solver implemented in PETSc, which imposed a full periodic BC on the computational cells [30], the presence of free surfaces was mimicked by adding two soft ~1-μm thick buffers layers on both sides of the sample (see Figure 2a), which is similar to the approach by [4,33,34]. A strong contrast in elastic moduli and strengths existed between the buffer layers and the samples (the elastic constants were at least one order of magnitude lower and the strengths were at least three orders of magnitudes lower for the buffer layer). The effective BCs are therefore free, periodic, and periodic in the x-, y-, and z-directions, respectively.
To conserve computational resources, the y-dimension of the simulation cells was minimized and kept constant at ~0.2 μm. Thus, the models were thin slab-shaped. The width of the substrate along the x-direction was also kept constant at ~34 μm. The PSBs were modeled to be 45° off the loading axis (z) and to have a constant thickness of tPSB = 1 μm in accordance with direct experimental observations in the open literature. Indeed, for metallic materials such as Cu, Ni, and SS 316, the thickness of the PSBs was ~1 μm [12,35]. Constrained by the periodic BC, the height of the models along the z-direction was dictated by the thickness (tPSB) of and spacing (dPSB) between the PSBs—i.e., h = √2 (tPSB + dPSB). The spacing dPSB varied between 1 and 8 μm, which corresponds to a PSB volume fraction of 50%~11%, and an overall shear plastic strain range of approximately Δγpl = 0.01~0.002 assuming a 0.01 plastic strain amplitude in the PSBs. Three different coating thicknesses (tcoat), namely 0.5, 1.0, and 2.0 µm, were considered here. These parameters of the models are listed in Table 1.
Both isotropic and anisotropic plastic flow rules have been utilized in the models. The buffer layers and the coatings were treated by isotropic plasticity. This assumption is sound since the buffer layers only have marginal resistance to deformation and the nanocrystalline Cr coatings exhibit isotropic mechanical behavior. Correspondingly, the plastic flow rule is written as [30]
γ ˙ p = γ ˙ 0 ( 3 J 2 M ξ ) n ,
where γ ˙ p   is the plastic shear strain rate, γ ˙ 0 is a reference strain rate, n is the stress exponent, J2 is the second invariant of the deviatoric stress tensor, and M is the Taylor factor. The ξ term in the denominator is the resistance to plastic flow. The rate of ξ is given as
ξ ˙ = γ ˙ p h 0 | 1 ξ ξ | a sgn ( 1 ξ ξ ) ,
where γ ˙ p   is the plastic shear strain rate, h0 is the strain hardening coefficient, ξ is the saturation resistance to plastic flow, and a is a material-dependent exponent.
Anisotropic plasticity was used for the substrate (including both the matrix and the PSBs) and a phenomenological hardening law was used. The flow rule is written as
γ ˙ p α = γ ˙ 0 α | τ α ξ α | n sgn ( τ α ) ,
where τα is the resolved shear stress on the slip system α, ξα is the slip resistance on the slip system, γ ˙ 0 α is the reference strain rate, and n is the stress exponent. Since only the loading portion of a cyclic loading period was modeled, the back-stress term—which is necessary to capture the kinematic hardening effect in cyclic loading—is not included in the present study. The rate form of the resistance ξα is given as
ξ ˙ α = h 0 s s α = 1 N s | γ ˙ α | | 1 ξ α ξ α | a sgn ( 1 ξ α ξ α ) h α α ,
where γ ˙ α is shear strain rate on the slip system α , ξ is the resistance saturation value, hαα is the slip hardening matrix (including both self- and latent hardening), and a is a material-dependent exponent.
The elastic and plastic flow constants used for the SS 316, PSB, coatings, and buffer layers are summarized in Table 2 and Table 3. The stress–strain behaviors produced by the elastic and plastic constants are shown in Figure 3. The elastic constants of both the Cr coating and the SS 316 substrate (including both the PSBs and the matrix) were obtained from the open literature [36,37,38]. To obtain the plastic flow constants of SS 316, the stress–strain response of a “virtual single crystal”—which was an average of many tensile tests (>50) on single crystals of randomized orientations under the isostrain assumption—was fitted to an experimental curve [39,40,41]. This technique, also referred to as the “material point” simulation, is a standardized practice to establish flow constants for crystal plasticity simulations [30,42,43].
PSBs within the substrate were modeled as different materials with identical elastic constants and crystallographic orientations but lower shear resistances (~100 MPa in the PSBs compared to ~300 MPa in the matrix) on the primary slip system. As discussed in the introduction, due to the wider dislocation channels within the PSB compared to the matrix, the PSBs have substantially lower critical resolved shear stress (CRSS). The applied overall strains are therefore localized within the PSBs. For pure Cu, Ni, and Ag, the respective CRSSs are ~30, 50, and 20 MPa [44]. As for SS316, the CRSS of PSBs is not known to the authors’ best knowledge and must be assumed. Considering the solid solution strengthening effect in SS316, the highest known CRSSs among the three aforementioned elemental metals, i.e., 50 MPa of Ni, was used. Assuming a Schmid factor of 0.5 (which applies for the current model geometries), the corresponding tensile yield strength is 100 MPa. As will be shown in Section 3, this choice of the CRSS appears to be sufficient to capture the strain localization within the PSBs. The slip activity on the secondary systems was completely suppressed by applying much higher critical resolved shear stresses (~40 GPa). The plastic flow constants of the coating and the buffer layer were calibrated so that they reproduce yield strengths of 750 and ~0 MPa, respectively.
Note that the crystallographic orientation of the substrate must be defined carefully, so that the primary slip system in the PSB experiences maximum shear stress under the tensile loading applied (see Figure 2b). In other words, the primary slip direction and slip plane should both be 45° off the loading axis. A cubic grid with the characteristic size ~0.09 × ~0.09 × ~0.09 μm has been chosen for all the models, leading to 2 Fourier points (FPs) along the y-direction, 400 to 440 (FP) along the x-direction, and 30 to 135 (FP) along the z-direction. The one-FP per voxel configuration is comparable to the one-integration point, C3D8R finite element type (according to ABAQUS), which was emulated in the model setup by DAMASK [45].

2.2. Post-Processing

The results were visualized using the open-source software package Paraview [46]. In all of the visualizations, the buffer layers have been removed to avoid any confusion. All the results visualized correspond to a specific point in the loading history, i.e., when the average shear strain in the primary slip system in the PSBs equals ~1%. Therefore, PSB volume fractions of 50%~11% correspond to overall shear plastic strain ranges of approximately Δγpl = 1%~0.2%. Due to the presence of the coatings, the shear strain on the active slip system within the PSBs may vary depending on the distance to the coating–substrate interface. To assess the suppressive effect of coatings on the operations of PSBs, the plastic strain within the PSBs were plotted as a function of the x-coordinate. For this purpose, the PSBs were sliced into discrete bins of equal thickness along the x-direction. Average shear strain on the primary slip system was then obtained for each bin.

3. Results and Discussion

The results of the simulations were analyzed with respect to four characteristics of the coating–PSB interaction—i.e., (1) the suppressive effects of coatings on the operation of PSBs, (2) the normal stress developed in the coating layer along the loading direction, (3) the interfacial normal stress developed perpendicular to the interface, and (4) the interfacial shear stress developed parallel to the interface. For instance, typical results, including the distributions of shear strain, as well as shear and normal stresses of three selected simulations, are shown in Figure 4 for three cases: (a) tcoat = 0.5 µm, dPSB = 1 µm, and Δγpl = 0.01, (b) tcoat = 0.5 µm, dPSB = 8 µm, and Δγpl = 0.002, and (c) tcoat = 2 µm, dPSB = 1 µm, and Δγpl = 0.01, respectively. Note that the dPSB and Δγpl parameters are coupled, as discussed in the previous section. Apparently, all these characteristics appear to be influenced by both the coating thickness and overall loading amplitude (reflected in the density of PSBs). In what follows, we analyze and discuss these influences from the four aforementioned aspects.

3.1. Suppressive Effects of the Coating on the Operation of PSBs (Distribution of Plastic Shear Strain in the PSBs)

Comparing the first column of Figure 4a,c, it is apparent that the thicker coating (tcoat = 2 µm) inhibited the slip activities (γprimary) within the PSB, especially at locations near the coating–substrate interfaces. As expected, this suppression effect was attenuated with the increase in the strain amplitude applied (compare Figure 4a,b, which represented higher and lower applied strain amplitudes, respectively). To quantitatively compare the suppressive effect of the coatings, the plastic shear strain on the primary slip system within the PSBs are plotted in Figure 5 as a function of the distance from the coating–substrate interface along the x-direction. The plots were generated using the binning analysis, described in Section 2.2. Each panel of the figure corresponds to a different PSB spacing (dPSB) and, accordingly, a different applied plastic strain range (Δγpl). The plots were obtained at the point of loading history which corresponds to an average of ~1% plastic shear strain over the entire PSBs.
The qualitative observations made in Figure 4 are echoed in Figure 5. Coatings with increasing thickness had stronger suppression effects on the operation of PSBs. This is reflected by the consistently lower shear strain magnitudes in PSBs that interacted with thicker coatings. Comparing Figure 5a–d), the suppression effects were attenuated significantly with the increasing applied strain amplitude. This is concomitant with the increasing plastic shear strain in the PSBs near the coating–substrate interfaces as the loading amplitude increases. For instance, at a lower applied strain range (such as at 0.002 for the case of dPSB = 8 µm as shown in Figure 5d), the coatings had a profound effect suppressing the plastic shear strains near the coating–substrate interface. With a coating thickness of 0.5 µm, the shear strain within the distance of 0.5 µm from the interface was lower than the prescribed 1% magnitude. With a coating thickness of 2 µm, this distance extended beyond 2 µm. However, at a higher applied plastic shear strain range of 0.01, this distance reduced to 0.13 µm for the thinner coating and ~1.3 µm for the thicker coating, shown in Figure 5a. The attenuation at higher strain amplitudes (smaller dPSB) can be ascribed to the close coupling of neighboring PSB–substrate interactions, which induced larger elastic deflections within the coatings. As will be demonstrated in the later sections, this coupling also influences the stresses at/near the coating–substrate interfaces.

3.2. Fracture Tendency within the Coatings (Distribution of σzz in the Coatings)

Hard coatings, especially ceramic ones, may fracture from pre-existing flaws due to tensile stresses parallel to the coating layer. As shown in the third column of Figure 4a,b, the tensile stress (σzz) in the coating appear to rise at the locations where PSBs intersect with the coating for specimens at a small coating thickness of tcoat = 0.5 μm. In addition, due to the load transfer from the substrates to the coatings, σzz is discontinuous across the interface. Due to the superposition of the neighboring PSB–coating interactions, the maximum σzz may be higher at a smaller PSB spacing (higher applied strain ranges). As an example, the profiles of σzz in the coating near the interface along the z-direction (i.e., values on the dashed lines shown in Figure 4) are plotted in Figure 6 for the 0.5-μm thick coating.
The observations made from Figure 4 are confirmed in the σzz profiles shown in Figure 6, noting the values of the stress within the blue shades (locations on the interfaces where PSBs intersect with the coatings). At higher applied strain amplitudes (such as the 0.01 plastic strain range reflected by dPSB = 1 μm, Figure 6a), both the overall and the peak values of the σzz are higher compared to lower applied strain amplitudes, indicating a higher tendency to develop tensile fracture, as expected. Figure 7a shows the variation of the peak σzz values as a function of dPSB (reflecting the applied strain amplitude Δγpl), demonstrating a similar decreasing trend of the peak σzz with increasing dPSB for all tcoat values.
Comparing the third column of Figure 4c with that of the Figure 4a,b, it is interesting to note that when the thickness of the coating is large, the distribution of the σzz within the coating is less influenced by the presence of the PSBs. For instance, Figure 8 shows the profiles of σzz in the coating along the z-direction at both the surface and the interface. In both coating thicknesses shown, the profiles of σzz in the coatings at the interface were nearly identical (see the thick and the thin dashed lines). However, for the case of a thin coating (tcoat = 0.5 μm), significant variations in the stress can be observed on the surface (thin solid line). However, when the coating is thick (tcoat = 2 μm), σzz is approximately invariant at the surface (thick solid line). The combined observations made in the third column of Figure 4 and in Figure 8 imply that a coating’s sensitivity to the presence of a potential surface flaw in the coating is different for different coating thicknesses. For instance, a thinner coating only experiences higher tensile stresses near the PSBs, a flaw at other locations may still be relatively safe and may not lead to early onset of fracture. On the other hand, the tensile stress on the surface of thicker coatings is uniform which makes thick coatings more susceptible to tensile fracture from surface flaws.
To further investigate the variation of σzz at different locations within the coating, its standard deviation (SD) along the z-direction for all model geometries was calculated. Figure 9 shows the SD of σzz at interface and the coating surface with respect to the ratio of dPSB to the coating thickness tcoat (i.e., λ = dPSB/tcoat). It is evident that, as the ratio λ increases (i.e., thickness of the coating decreases with respect to the PSB spacing), the variation of σzz along the z-direction at the coating surface significantly increases. On the other hand, the variation of σzz at the interface is always quite significant and is not affected by λ. This agrees with the observations made earlier in Figure 8.

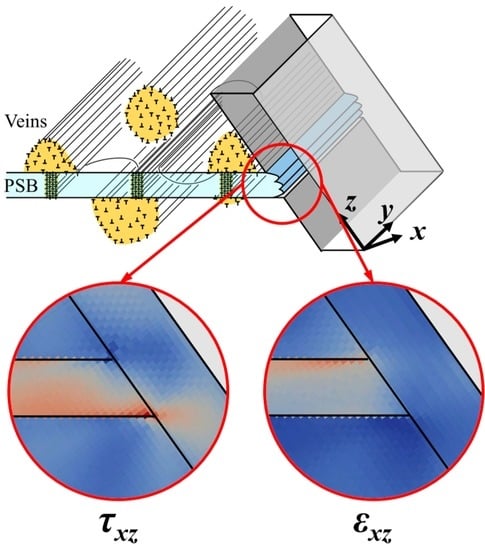
3.3. Delamination Tendency at the Coating–Substrate Interface

The tendency for coating–substrate delamination was assessed by evaluating the interfacial stresses σxx and τxz, which were perpendicular and parallel to the interfaces, respectively. As shown in Figure 4, due to the model setup of a perfectly bonded interface, both σxx and τxz stress components were continuous across the interface. Similar to the behavior of σzz, σxx appeared to slightly increase when the loading amplitude increased (i.e., when dPSB decreased). Interestingly, the magnitude of τxz showed an opposite trend—it appeared to decrease when the loading amplitude increased (i.e., when dPSB decreased). This can be seen by comparing Figure 4a, 4b in the second and the fourth columns. The opposite trends observed here may be ascribed to the “symmetries” in the σxx and τxz values on both sides of the location where the PSBs intersect with the coating.
In Figure 6, the profiles of σxx and τxz at the interface along the z-direction (i.e., values on the dashed lines shown in Figure 4) are plotted for the 0.5-μm coating thickness. At the PSB spacing of 8 μm, the interfacial stresses induced by an individual PSB is clear (see Figure 6d). The sign of the τxz component is opposite at the locations left and right of the intersection between the PSB and coating (see the red and blue arrows marking the ±τxz). On the other hand, the sign of the σxx is the same on the left and right of this intersection—i.e., both values are positive (see the red arrows marking the +σxx in Figure 6d). As a result, when the density of the PSB increases, the superposition of the stress fields from neighboring PSB–coating interactions increases the maximum magnitude of σxx and reduces the maximum magnitude of the τxz. The variation of the maximum σxx and τxz stresses are discernable from Figure 6 by comparing the four panels. In addition, the magnitude of both stress components also increased with increasing coating thickness (compare Figure 4a and Figure 4c in the second and fourth columns). The σxx and τxz appeared to somewhat signify the “suppressive” action of the coatings—as a function of the thickness—on the operations of the PSBs (compare Figure 4 and Figure 5). In other words, the suppressive effects tend to be stronger when the values of these stresses increase.
For a clearer comparison, the peak values of these stresses for all the simulations have been obtained and plotted in Figure 7b,c. The substantial increases in the peak σxx and τxz values due to the increase in the coating thickness are also evident. The combined action of the two stresses may be responsible for the delamination of the coating–substrate interface. This is in line with the critical plane approach put forth by Fatemi and Socie [47], which stated that the planes with large plastic shear strain and large normal stress tend to initiate fatigue cracks.
Figure 5 has shown that the suppression imposed by the coating on the operation of the PSBs is more effective at larger coating thicknesses. Nevertheless, excessively thick coatings are associated with the risk of early crack initiation due to coating tensile fracture (with pre-existing surface flaws) and coating–substrate delamination (due to the combined action of both tensile and shear stresses at the interface). Therefore, thicker coatings are only preferred if a coating with higher fracture toughness as well as an ideal coating–substrate adhesion can be achieved. Otherwise, thicker coatings may be detrimental to the fatigue performance of the coated parts.
On the other hand, while the applied plastic shear strain range is expected to monotonically affect the tendency of tensile fracture in the coating (i.e., higher amplitude leads to easier fracture), its effect on coating–substrate delamination may be more complex. Since the increase in the applied strain range decreases τxz but increases σxx, there may exist an intermediate plastic shear strain amplitude that favors delamination the most, assuming that the interfacial delamination is driven by the combined action of normal and shear stresses.

4. Conclusions

Crystal plasticity-based simulations were used to investigate the suppressive effects of coatings on the operation of surface PSBs. The impact of both coating thickness and the applied strain amplitude (reflected by a variable density of PSBs) on the suppressive effects were evaluated. Four characteristics of the PSB–coating interactions—including (1) the suppressive effects of coatings on the operation of PSBs, (2) the normal stress developed in the coating layer along the loading direction, (3) the interfacial normal stress developed perpendicular to the interface, and (4) the interfacial shear stress developed parallel to the interface—were investigated.
The following conclusions can be drawn from this research:
(1)
Assuming a perfect coating–substrate adhesion and the absence of coating fracture, thicker coatings offered better suppression against the plastic shear deformation of the PSBs.
(2)
The suppression effects of the coatings were attenuated at higher applied plastic shear strains (higher PSB densities).
(3)
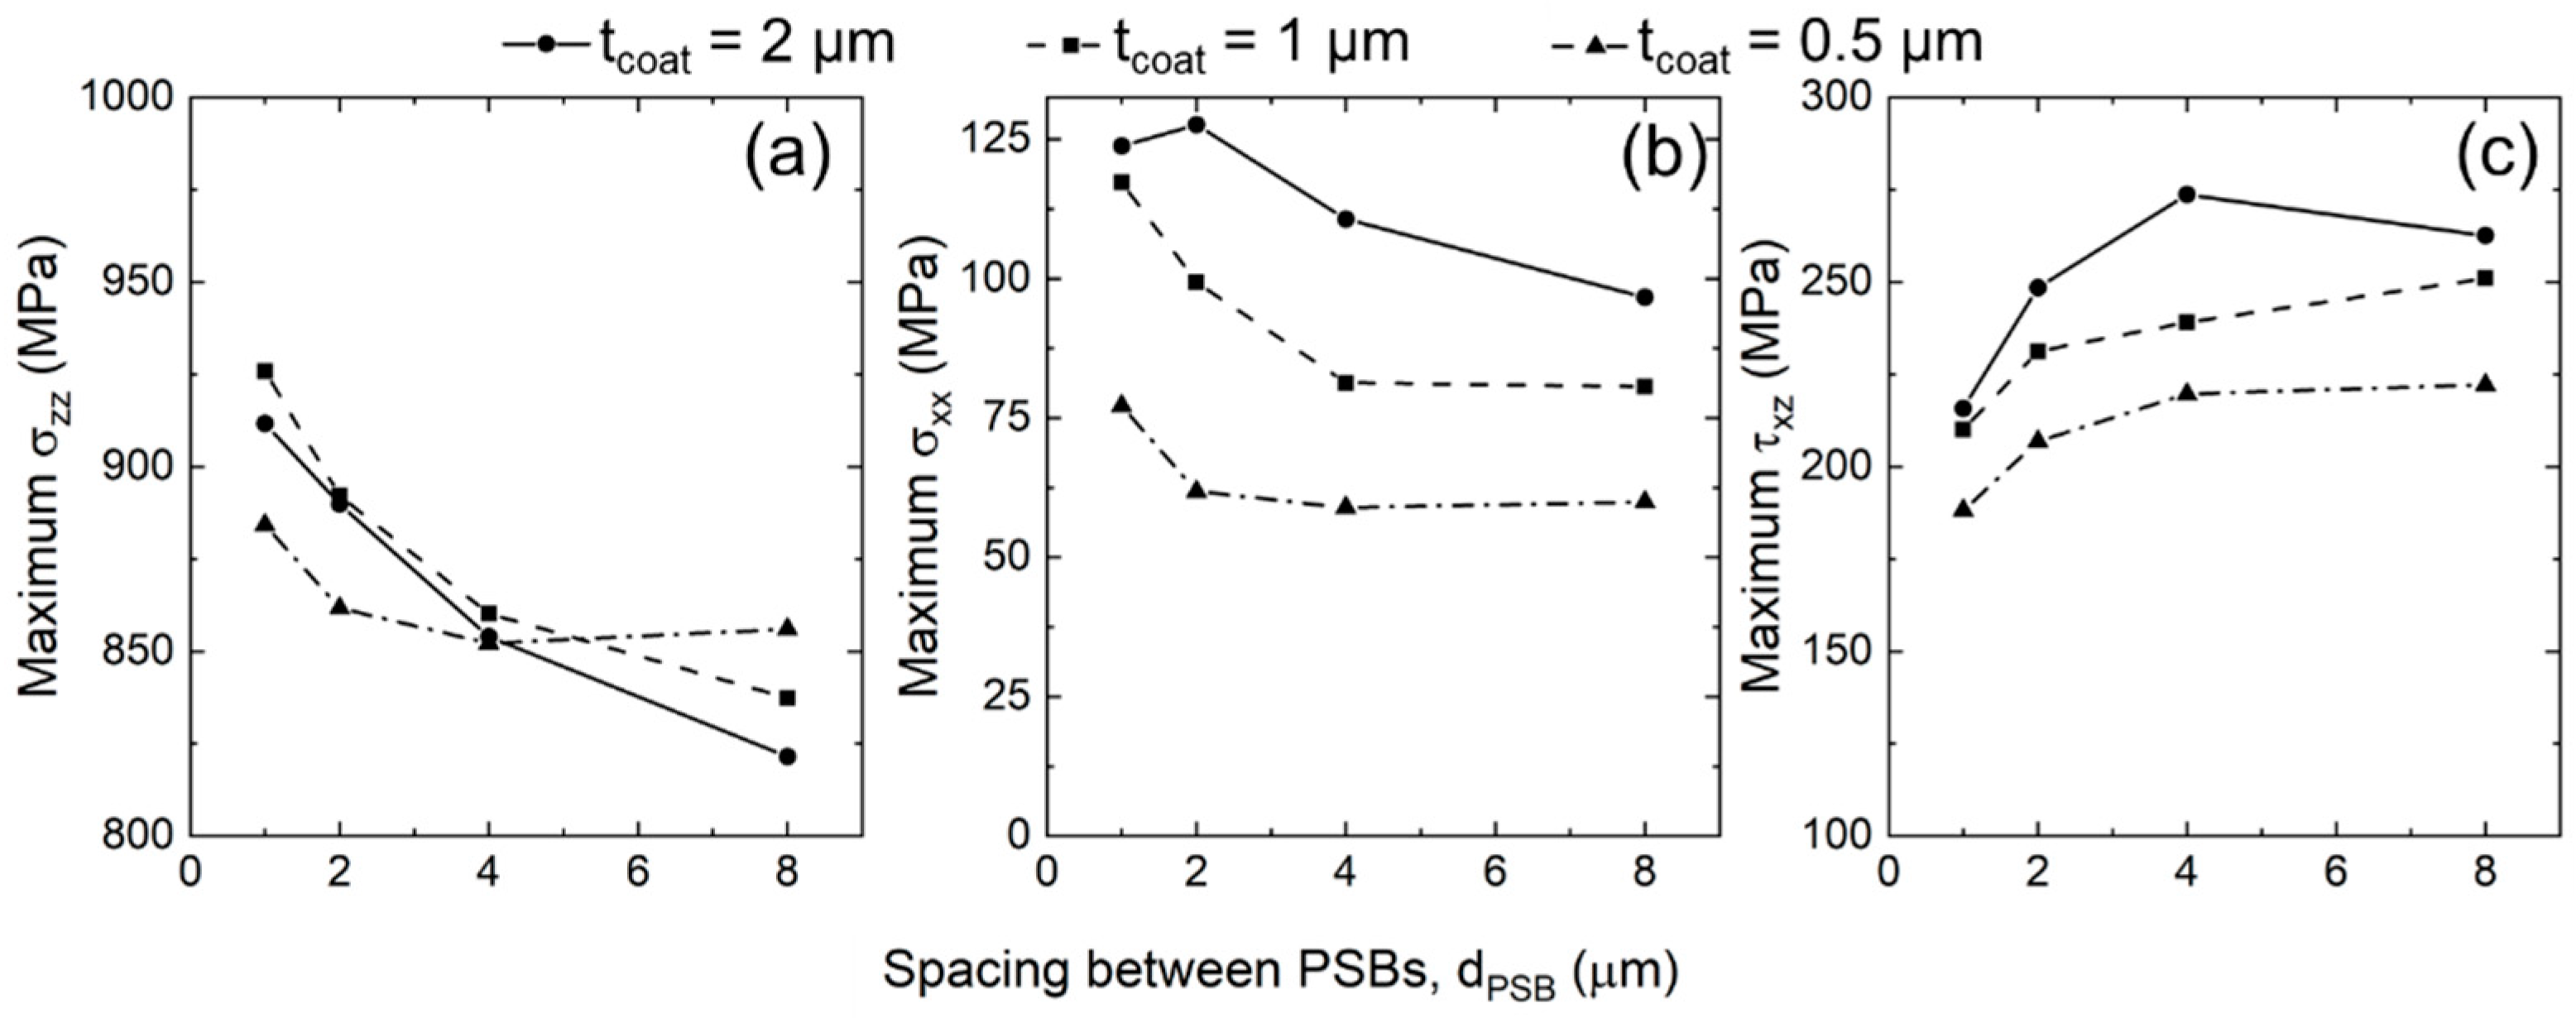
The distribution of the normal stress parallel to the loading direction in thinner coatings was highly heterogeneous and was strongly affected by the PSBs. However, the distribution of this stress was much more uniform for thicker coatings.
(4)
The interfacial shear stress parallel to the loading direction and the interfacial normal stress perpendicular to the interface increased significantly with increasing coating thickness, which can potentially result in delamination.
(5)
The peak values of the stresses mentioned in Conclusions (3) and (4) varied differently with increasing applied strains due to the superposition of the stress fields caused by the neighboring PSB–coating interactions.
In general, although thicker coatings may be beneficial to the fatigue performance of the coated parts, excessive coating thickness can lead to early crack initiation due to coating tensile fracture and coating–substrate delamination. The beneficial effect of the coatings on fatigue performance therefore is limited by the fracture toughness of the coating, and the adhesion strength of the coating–substrate interfaces. Therefore, the enhancement in the fatigue performance of a coating–substrate system hinges upon the careful selection of the correct coating–substrate material combination as well as the appropriate coating thickness.

Author Contributions

Conceptualization, S.S., J.W., and N.S.; methodology, S.S.; validation, M.S.D. and S.S.; formal analysis, M.S.D., S.S., J.W., and N.S.; investigation, M.S.D., S.S., J.W., and N.S.; resources, S.S., N.S., and J.W.; data curation, M.S.D. and S.S.; writing—original draft preparation, S.S.; writing—review and editing, M.S.D., S.S., J.W., and N.S.; visualization, M.S.D. and S.S.; supervision, S.S. and N.S.; project administration, S.S., J.W., and N.S.; funding acquisition, S.S., J.W., and N.S. All authors have read and agreed to the published version of the manuscript.

Funding

M.S.D., S.S., and N.S. acknowledge the support by the U.S. Department of Energy, Office of Science, Office of Basic Energy Sciences, under Award Number DE-SC0019378. J.W. acknowledges the support by the Department of Energy (DOE) Office of Nuclear Energy and Nuclear Energy University Program through Award No. DE-NEUP-18-15703.

Acknowledgments

The authors acknowledge the helpful discussions with Wenjin Meng, Michael M. Khonsari, and Shengmin Guo at Louisiana State University.

Conflicts of Interest

The authors declare no conflict of interest. Disclaimer: This report was prepared as an account of work sponsored by an agency of the United States Government. Neither the United States Government nor any agency thereof, nor any of their employees, makes any warranty, express or implied, or assumes any legal liability or responsibility for the accuracy, completeness, or usefulness of any information, apparatus, product, or process disclosed, or represents that its use would not infringe privately owned rights. Reference herein to any specific commercial product, process, or service by trade name, trademark, manufacturer, or otherwise does not necessarily constitute or imply its endorsement, recommendation, or favoring by the United States Government or any agency thereof. The views and opinions of authors expressed herein do not necessarily state or reflect those of the United States Government or any agency FA R&D Special TC NOVEMBER 2017- FF Page 4 of 12 thereof.

References

  1. Ewing, J.A.; Humfrey, J.C.W. The Fracture of Metals under Repeated Alternations of Stress. Philos. Trans. R. Soc. A 1903, 200, 241–250. [Google Scholar] [CrossRef] [Green Version]
  2. Stephens, R.I.; Fatemi, A.; Stephens, R.R.; Fuchs, H.O. Metal Fatigue in Engineering, 2nd ed.; John Wiley & Sons: Hoboken, NJ, USA, 2000; ISBN 978-0-471-51059-8. [Google Scholar]
  3. Thompson, N.; Wadsworth, N.; Louat, N. Xi. The origin of fatigue fracture in copper. Philos. Mag. 1956, 1, 113–126. [Google Scholar] [CrossRef]
  4. Dodaran, M.; Khonsari, M.M.; Shao, S. Critical operating stress of persistent slip bands in Cu. Comput. Mater. Sci. 2019, 165, 114–120. [Google Scholar] [CrossRef]
  5. Kuhlmann-Wilsdorf, D.; Laird, C. Dislocation behavior in fatigue. Mater. Sci. Eng. 1977, 27, 137–156. [Google Scholar] [CrossRef]
  6. Kuhlmann-Wilsdorf, D. Theory of plastic deformation—Properties of low energy dislocation structures. Mater. Sci. Eng. A 1989, 113, 1–41. [Google Scholar] [CrossRef]
  7. Neumann, P. Low energy dislocation configurations: A possible key to the understanding of fatigue. Mater. Sci. Eng. 1986, 81, 465–475. [Google Scholar] [CrossRef]
  8. Mughrabi, H. The cyclic hardening and saturation behaviour of copper single crystals. Mater. Sci. Eng. 1978, 33, 207–223. [Google Scholar] [CrossRef]
  9. Hancock, J.; Grosskreutz, J. Mechanisms of fatigue hardening in copper single crystals. Acta Metall. 1969, 17, 77–97. [Google Scholar] [CrossRef]
  10. Castelluccio, G.M.; Musinski, W.D.; McDowell, D.L. Computational micromechanics of fatigue of microstructures in the HCF–VHCF regimes. Int. J. Fatigue 2016, 93, 387–396. [Google Scholar] [CrossRef] [Green Version]
  11. Mughrabi, H.; Wang, R.; Differt, K.; Essmann, U. Fatigue Crack Initiation by Cyclic Slip Irreversibilities in High-Cycle Fatigue. In Fatigue Mechanisms: Advances in Quantitative Measurement of Physical Damage; ASTM International: West Conshohocken, PA, USA, 1983; Volume 5, pp. 35–41. [Google Scholar]
  12. Mughrabi, H. Cyclic Slip Irreversibilities and the Evolution of Fatigue Damage. Metall. Mater. Trans. A 2009, 40, 1257–1279. [Google Scholar] [CrossRef]
  13. Man, J.; Obrtlík, K.; Polák, J. Extrusions and intrusions in fatigued metals. Part 1. State of the art and history†. Philos. Mag. 2009, 89, 1295–1336. [Google Scholar] [CrossRef]
  14. Man, J.; Klapetek, P.; Man, O.; Weidner†, A.; Obrtlík, K.; Polák, J. Extrusions and intrusions in fatigued metals. Part 2. AFM and EBSD study of the early growth of extrusions and intrusions in 316L steel fatigued at room temperature. Philos. Mag. 2009, 89, 1337–1372. [Google Scholar] [CrossRef]
  15. Basinski, Z.S.; Pascual, R.; Basinski, S.J. Low amplitude fatigue of copper single crystals—I. The role of the surface in fatigue failure. Acta Metall. 1983, 31, 591–602. [Google Scholar] [CrossRef]
  16. Soyama, H.; Chighizola, C.R.; Hill, M.R. Effect of compressive residual stress introduced by cavitation peening and shot peening on the improvement of fatigue strength of stainless steel. J. Mater. Process. Technol. 2021, 288, 116877. [Google Scholar] [CrossRef]
  17. Lee, C.M.; Chu, J.P.; Chang, W.Z.; Lee, J.W.; Jang, J.S.C.; Liaw, P.K. Fatigue property improvements of Ti–6Al–4V by thin film coatings of metallic glass and TiN: A comparison study. Thin Solid Films 2014, 561, 33–37. [Google Scholar] [CrossRef]
  18. Bagherifard, S.; Fernández Pariente, I.; Ghelichi, R.; Guagliano, M. Fatigue properties of nanocrystallized surfaces obtained by high energy shot peening. Procedia Eng. 2010, 2, 1683–1690. [Google Scholar] [CrossRef] [Green Version]
  19. Zhang, B.; Haghshenas, A.; Zhang, X.; Zhao, J.; Shao, S.; Khonsari, M.M.; Guo, S.; Meng, W.J. On the failure mechanisms of Cr-coated 316 stainless steel in bending fatigue tests. Int. J. Fatigue 2020, 139, 105733. [Google Scholar] [CrossRef]
  20. Yu, C.-C.; Chu, J.P.; Jia, H.; Shen, Y.-L.; Gao, Y.; Liaw, P.K.; Yokoyama, Y. Influence of thin-film metallic glass coating on fatigue behavior of bulk metallic glass: Experiments and finite element modeling. Mater. Sci. Eng. A 2017, 692, 146–155. [Google Scholar] [CrossRef] [Green Version]
  21. Tsai, P.H.; Li, T.H.; Hsu, K.T.; Ke, J.H.; Jang, J.S.C.; Chu, J.P. Coating thickness effect of metallic glass thin film on the fatigue-properties improvement of 7075 aluminum alloy. Thin Solid Films 2019, 677, 68–72. [Google Scholar] [CrossRef]
  22. Su, Y.L.; Yao, S.H.; Wei, C.S.; Kao, W.H.; Wu, C.T. Influence of single- and multilayer TiN films on the axial tension and fatigue performance of AISI 1045 steel. Thin Solid Films 1999, 338, 177–184. [Google Scholar] [CrossRef]
  23. Zhou, Y.; Rao, G.B.; Wang, J.Q.; Zhang, B.; Yu, Z.M.; Ke, W.; Han, E.H. Influence of Ti/TiN bilayered and multilayered films on the axial fatigue performance of Ti46Al8Nb alloy. Thin Solid Films 2011, 519, 2207–2212. [Google Scholar] [CrossRef]
  24. Wang, Y.M.; Zhang, P.F.; Guo, L.X.; Ouyang, J.H.; Zhou, Y.; Jia, D.C. Effect of microarc oxidation coating on fatigue performance of Ti–Al–Zr alloy. Appl. Surf. Sci. 2009, 255, 8616–8623. [Google Scholar] [CrossRef]
  25. Du, D.; Liu, D.; Ye, Z.; Zhang, X.; Li, F.; Zhou, Z.; Yu, L. Fretting wear and fretting fatigue behaviors of diamond-like carbon and graphite-like carbon films deposited on Ti-6Al-4V alloy. Appl. Surf. Sci. 2014, 313, 462–469. [Google Scholar] [CrossRef]
  26. Stoudt, M.; Ricker, R.; Cammarata, R. The influence of a multilayered metallic coating on fatigue crack nucleation. Int. J. Fatigue 2001, 23, 215–223. [Google Scholar] [CrossRef]
  27. Akebono, H.; Komotori, J.; Suzuki, H. The Effect of coating thickness on fatigue properties of steel thermally sprayed with ni -based self-fluxing alloy. Int. J. Mod. Phys. B 2006, 20, 3599–3604. [Google Scholar] [CrossRef]
  28. Sangid, M.D.; Maier, H.J.; Sehitoglu, H. A physically based fatigue model for prediction of crack initiation from persistent slip bands in polycrystals. Acta Mater. 2011, 59, 328–341. [Google Scholar] [CrossRef]
  29. Sangid, M.D. The physics of fatigue crack initiation. Int. J. Fatigue 2013, 57, 58–72. [Google Scholar] [CrossRef]
  30. Roters, F.; Diehl, M.; Shanthraj, P.; Eisenlohr, P.; Reuber, C.; Wong, S.L.; Maiti, T.; Ebrahimi, A.; Hochrainer, T.; Fabritius, H.-O.; et al. DAMASK—The Düsseldorf Advanced Material Simulation Kit for modeling multi-physics crystal plasticity, thermal, and damage phenomena from the single crystal up to the component scale. Comput. Mater. Sci. 2019, 158, 420–478. [Google Scholar] [CrossRef]
  31. Eisenlohr, P.; Diehl, M.; Lebensohn, R.A.; Roters, F. A spectral method solution to crystal elasto-viscoplasticity at finite strains. Int. J. Plast. 2013, 46, 37–53. [Google Scholar] [CrossRef]
  32. Shanthraj, P.; Eisenlohr, P.; Diehl, M.; Roters, F. Numerically robust spectral methods for crystal plasticity simulations of heterogeneous materials. Int. J. Plast. 2015, 66, 31–45. [Google Scholar] [CrossRef]
  33. Pokharel, R.; Lind, J.; Kanjarla, A.K.; Lebensohn, R.A.; Li, S.F.; Kenesei, P.; Suter, R.M.; Rollett, A.D. Polycrystal Plasticity: Comparison Between Grain—Scale Observations of Deformation and Simulations. Annu. Rev. Condens. Matter Phys. 2014, 5, 317–346. [Google Scholar] [CrossRef]
  34. Dodaran, M.; Wang, J.; Chen, Y.; Meng, W.J.; Shao, S. Energetic, structural and mechanical properties of terraced interfaces. Acta Mater. 2019, 171. [Google Scholar] [CrossRef]
  35. Lavenstein, S.; Gu, Y.; Madisetti, D.; El-Awady, J.A. The heterogeneity of persistent slip band nucleation and evolution in metals at the micrometer scale. Science 2020, 370, eabb2690. [Google Scholar] [CrossRef]
  36. Palmer, S.B.; Lee, E.W. The elastic constants of chromium. Philos. Mag. A J. Theor. Exp. Appl. Phys. 1971, 24, 311–318. [Google Scholar] [CrossRef]
  37. Dodaran, M.; Ettefagh, A.H.; Guo, S.M.; Khonsari, M.M.; Meng, W.J.; Shamsaei, N.; Shao, S. Effect of alloying elements on the γ’ antiphase boundary energy in Ni-base superalloys. Intermetallics 2020, 117. [Google Scholar] [CrossRef]
  38. Bolef, D.I.; de Klerk, J. Anomalies in the Elastic Constants and Thermal Expansion of Chromium Single Crystals. Phys. Rev. 1963, 129, 1063–1067. [Google Scholar] [CrossRef]
  39. Kweon, H.D.; Kim, J.W.; Song, O.; Oh, D. Determination of true stress-strain curve of type 304 and 316 stainless steels using a typical tensile test and finite element analysis. Nucl. Eng. Technol. 2020. [Google Scholar] [CrossRef]
  40. Zhang, X.; Mu, Y.; Dodaran, M.; Shao, S.; Moldovan, D.; Meng, W.J. Mechanical failure of CrN/Cu/CrN interfacial regions under tensile loading. Acta Mater. 2018, 160, 1–13. [Google Scholar] [CrossRef]
  41. Zhang, B.; Dodaran, M.; Ahmed, S.; Shao, S.; Meng, W.J.; Juul, K.J.; Nielsen, K.L. Grain-size affected mechanical response and deformation behavior in microscale reverse extrusion. Materialia 2019, 6. [Google Scholar] [CrossRef]
  42. Marin, E.B. On the Formulation of a Crystal Plasticity Model; Sandia National Laboratories: Albuquerque, NM, USA; Livermore, CA, USA, 2006. [Google Scholar]
  43. Lienert, U.; Han, T.-S.; Almer, J.; Dawson, P.R.; Leffers, T.; Margulies, L.; Nielsen, S.F.; Poulsen, H.F.; Schmidt, S. Investigating the effect of grain interaction during plastic deformation of copper. Acta Mater. 2004, 52, 4461–4467. [Google Scholar] [CrossRef]
  44. Tu, S.-T.; Zhang, X.-C. Fatigue Crack Initiation Mechanisms. In Reference Module in Materials Science and Materials Engineering; Elsevier: Amsterdam, The Netherlands, 2016. [Google Scholar]
  45. Diehl, M. A Spectral Method Using Fast Fourier Transform To Solve Elastoviscoplastic Mechanical Boundary Value Problems; TU München: München, Germany, 2010. [Google Scholar]
  46. Ahrens, J.; Geveci, B.; Law, C. ParaView: An End-User Tool for Large-Data Visualization. In Visualization Handbook; Elsevier: Amsterdam, The Netherlands, 2005; pp. 717–731. [Google Scholar]
  47. Fatemi, A.; Socie, D.F. A critical plane approach to multiaxial fatigue damage including out-of-phase loading. Fatigue Fract. Eng. Mater. Struct. 1988, 11, 149–165. [Google Scholar] [CrossRef]
Figure 1. (a) A schematic illustration of a persistent slip band (PSB), vein structure, specimen surface, and the surface persistent slip marking (PSM). (b) The cyclic stress–strain curve of single-crystal Cu [8].
Crystals 10 01012 g001
Figure 2. Schematic representation of model geometries: (a) a three-dimensional view of the overall geometry of the models omitting the details of the sample, and (b) the front view of the simulation cells highlighting the interior geometry and dimensions of the sample.
Crystals 10 01012 g002
Figure 3. The stress–strain responses of the four material types considered in this study.
Crystals 10 01012 g003
Figure 4. Contour plots of shear strains within the PSBs, as well as normal and shear stresses near the coating–substrate interfaces (marked using the black dashed lines) for four cases of simulations: (a) tcoat = 0.5 µm, dPSB = 1 µm, and Δγpl = 0.01, (b) tcoat = 0.5 µm, dPSB = 8 µm, and Δγpl = 0.002, and (c) tcoat = 2 µm, dPSB = 1 µm, and Δγpl = 0.01.
Crystals 10 01012 g004
Figure 5. Distribution of shear strain along x on the primary slip system within the PSBs for various PSB spacings and equivalent applied plastic strain ranges: (a) dPSB = 1 μm and Δγpl = 0.01, (b) dPSB = 2 μm and Δγpl = 0.007, (c) dPSB = 4 μm and Δγpl = 0.004, and (d) dPSB = 8 μm and Δγpl = 0.002.
Crystals 10 01012 g005
Figure 6. Stress profiles, including the σzz in the coating near the interface, σxx at the interface, and τxz at the interface, of the computational cells with 0.5-μm coating thickness. The blue shades indicate the locations where the PSBs intersect with the coatings. Note that the horizontal axes are not of the same scale, which led to their different appearance in thickness. The four panels respectively show data for (a) dPSB = 1 μm and Δγpl = 0.01, (b) dPSB = 2 μm and Δγpl = 0.007, (c) dPSB = 4 μm and Δγpl = 0.004, and (d) dPSB = 8 μm and Δγpl = 0.002.
Crystals 10 01012 g006
Figure 7. The maximum stresses, including (a) σzz in the coating at the interface, as well as (b) σxx and (c) τxz at the interface, as functions of the increasing PSB spacing, dPSB. Note that the applied plastic shear strain range is inversely related to dPSB—i.e., dPSB = 1 μm corresponds to Δγpl = 0.01, dPSB = 2 μm corresponds to Δγpl = 0.007, dPSB = 4 μm corresponds to Δγpl = 0.004, and dPSB = 8 μm corresponds to Δγpl = 0.002.
Crystals 10 01012 g007
Figure 8. The profiles of σzz along the z-direction on both sides of the coating for two simulations: (1) tcoat = 0.5 μm, dPSB = 1 μm and (2) tcoat = 2 μm, dPSB = 1 μm. The corresponding stress and strain contours of these two simulations have been shown in Figure 4a,c. The blue shade indicates the location where the PSBs intersect with the coating.
Crystals 10 01012 g008
Figure 9. The standard deviation (SD) of σzz at two locations—i.e., at the coating–substrate interface and coating surface, versus the ratio λ = dPSB/tcoat.
Crystals 10 01012 g009
Table 1. Design of simulations performed in the current study. The meaning of tPSB and dPSB are shown in Figure 2b.
tPSB (μm)dPSB (μm)
0.51248
11248
21248
Table 2. Anisotropic elastic and plastic material constants used for SS316 substrate (including PSB).
MaterialC11 (GPa)C12 (GPa)C44 (GPa) γ ˙ 0 (1/sec)nξ0 (MPa)ξ (MPa)ah0 (MPa)
SS 316 matrix207.0133.0117.00.00120.0115.0430.02.2550.0
PSB primary207.0133.0117.00.00150.040.0 1400.0 12.2550.0
1 These values are for the primary slip system in the PSB. The slip activities in the secondary slip systems were suppressed by using much higher slip resistances (at least 1000 times higher).
Table 3. Isotropic elastic and plastic material constants used for the buffer layers and coatings.
MaterialC11 (GPa)C12 (GPa) γ ˙ 0 (1/sec)Mnξ0 (MPa)ξ (MPa)ah0 (MPa)
Buffer20.010.00.1353.06.32.57.5
Coating279.0115.00.001302020.0 1100.0 12.518.0
1 Although the ξ0 and ξ appear to be quite low, when combined with the M and n, they produced a true yield strength of 750 MPa and a strength of 2.5 GPa at 0.5 strain (see Figure 3).
Publisher’s Note: MDPI stays neutral with regard to jurisdictional claims in published maps and institutional affiliations.

