Article

Synthesis of ZnO Hollow Microspheres and Analysis of Their Gas Sensing Properties for n-Butanol

School of Materials Science and Engineering, Shandong University of Science and Technology, Qingdao 266590, China
*
Author to whom correspondence should be addressed.
Crystals 2020, 10(11), 1010; https://doi.org/10.3390/cryst10111010
Submission received: 2 October 2020 / Revised: 3 November 2020 / Accepted: 5 November 2020 / Published: 6 November 2020

Abstract

:
ZnO hollow microspheres with a diameter of approximately 1.4 μm were successfully synthesized by a facile one-step chemical precipitation method using trisodium citrate dihydrate as a morphology control agent. The ZnO hollow microspheres consisted of nanoplates and had good dispersibility. Control experiments revealed that trisodium citrate dihydrate played an important role in regulating the morphologies of ZnO products. The morphology of the ZnO product evolved from nanowires to hollow microspheres with the addition of trisodium citrate dihydrate. The sensor response of ZnO hollow microspheres toward 100 ppm n-butanol reached 86.6 at the optimum operating temperature of 340 °C, which was approximately three times higher than that of ZnO nanowires. In addition, the ZnO hollow microspheres also displayed good selectivity and long-term work stability toward n-butanol. The excellent gas sensing performance of ZnO hollow microspheres may be ascribed to the unique hollow sphere structure with high exposed polar crystal surface.

Graphical Abstract

1. Introduction

ZnO, as a typical wide band gap (3.37 V) n-type metal oxide semiconductor, has been widely studied and utilized due to its advantages of low cost, good stability, and versatile design [1,2]. Until now, zinc oxide has attracted extensive attention in various fields such as solar cells [3], photodetectors [4], field emitters [5], photocatalysts [6], light emitting diodes [7] as well as gas sensors [8,9,10,11,12,13,14,15,16]. In particular, ZnO is considered as one of the most important gas sensing materials during the detection of ethanol, methanol, carbon monoxide, hydrogen, and so on. However, pure ZnO gas sensors are still limited due to its low sensor response, poor selectivity, or poor stability.
In order to improve the gas sensing properties of ZnO, many efforts have been devoted by adjusting the crystal structure. ZnO has three types of crystal structures including wurtzite, sphalerite, and octahedron. Wurtzite is the common crystal structure of ZnO because of its stability. The exposed crystal plane has great influence on the gas sensing performance of ZnO. The polar plane of (0001) in wurtzite ZnO is beneficial to improving the gas sensing performance. For example, 3D porous ZnO structures with (0001) facets was synthesized by the wet-chemical process and exhibited excellent gas sensing properties for NO2 detection [17]. Nanodisk-like ZnO structures with (0001) facets showed a two times response value for 2-chlorophenol gas sensing compared with nanowalls like ZnO [18]. Xu synthesized ZnO porous nanosheets with (0001) facets, which displayed enhanced ethanol gas sensing performance. The experimental and computational results both confirmed that the (0001) plane is favorable in improving the gas sensing properties of ZnO [19]. Therefore, it is of great significance to design ZnO microstructure exposed (0001) facets for advanced gas sensors.
In addition to increasing the polar surface of ZnO, the morphology and microstructure are also important for its gas sensing properties. Up to now, ZnO with unique microstructures has been synthesized for enhancing gas sensing performance. One dimensional nanostructures such as nanowires, nanorods, nanofibers; two dimensional nanostructures such as nanosheets, nanobelts, nanodisks; and three dimensional nanostructures such as nanoflowers, hierarchical structures, and nanospheres [20,21,22,23,24]. Recently, ZnO nano/microspheres with hollow structures have been seen as attractive for advanced gas sensors due to their high active surface area. For examples, Han and co-workers prepared ZnO hollow nanospheres using polystyrene spheres as a template, which displayed excellent gas sensing toward n-butanol [25]. Guo’s group also synthesized ZnO hollow microspheres that assembled from nanorods. The ZnO hollow microsphere showed superior gas sensing properties due to their abundant reactive sites [26]. Li et al. fabricated ZnO hollow microspheres by a microwave-assisted method, which displayed high response and fast response speed toward ethanol and methanol [27]. From the above discussion, it is obvious that polar surface and hollow microspheres are both beneficial in enhancing the gas sensing performance of ZnO. However, ZnO with the combined advantages of polar surface and hollow spheres is rarely reported. Inspired by previous reports, we tried to improve the gas sensing properties of ZnO by designing hollow microspheres with high active polar surface.
In this paper, we successfully synthesized ZnO hollow microspheres with exposed planes of {0001} by a simple chemical precipitation method using trisodium citrate dihydrate as a morphology control agent. The ZnO hollow microspheres had good dispersibility and consisted of nanoplates. The influence of trisodium citrate dihydrate on the morphology of ZnO was investigated. Gas sensing test results showed that the as-prepared ZnO displayed excellent gas sensing toward n-butanol. The mechanism of improved gas sensing performance is also discussed.

2. Experimental

2.1. Materials

Zinc acetate dihydrate was purchased from Sinopharm Chemical Reagent Co. Ltd (Shanghai, China). Aqueous ammonia (25 wt%) and trisodium citrate dihydrate (TCD) were purchased from Chengdu Kelong Chemical Reagent Co. Ltd (Chengdu, China). All reagents were of analytical-grade and used without further purification.

2.2. Fabrication of ZnO Hollow Microspheres

In a typical process, 1.1 g of zinc acetate dihydrate and 0.06 g of TCD were added and dissolved completely in 200 mL deionized water using a 500 mL beaker. Then, 5 mL of ammonium hydroxide was dropped into the above solution with continuous magnetic stirring. After that, the mixture was heated at 90 °C for 40 min under an oil-bath condition with magnetic stirring. After the solution cooled naturally to room temperature, the white precipitate was collected and washed several times with distilled water and absolute ethanol. After being dried at 60 °C for 24 h, ZnO hollow microspheres were obtained.
For comparison, ZnO samples with other morphologies were synthesized using the same process by varying the amount of TCD. In order to investigate the formation process of the ZnO hollow microspheres, the ZnO samples were prepared using the same process with different reaction time.

2.3. Characterization of ZnO Hollow Microspheres

The crystal phase of the as-synthesized ZnO powders was characterized by an x-ray diffractometer (XRD, D/MAX-2500, Rigaku D/Max2500PC, Tokyo, Japan). The morphology of the samples was observed by field emission scanning electron microscopy (FE-SEM, Nova Nano SEM 450, Lincoln, NE, USA). The microstructure of the products was examined by high-resolution scanning electron microscopy (HRTEM, JEM-2100, Tokyo, Japan). The nitrogen adsorption isotherm was measured to estimate the specific surface area by the Brunauer–Emmett–Teller (BET) equation (Quadrasorb Anton Paar, Austria). All of the detailed information of the instruments is provided in Supplementary Materials.

2.4. Fabrication and Gas Sensing Test of ZnO Based Gas Sensors

A photo of the ZnO gas sensor is given in Figure S1. The details of its fabrication are listed as follows: ZnO powders and binder (obtained by dissolving 1 g of ethylcellulose in 20 mL of terpilenol) were ground together in an agate mortar to form the paste. Then, the paste was coated on an Al2O3 tube, which was connected with two Au electrodes and four Pt wires. After being dried at 60 °C for 1 h in an oven, the coated Al2O3 tube was annealed in a muffle furnace at 500 °C for 2 h. A Ni–Cr alloy coil was threaded through the ceramic tube to regulate the sensor’s operating temperature. Finally, the gas sensor was fabricated after welding the coated Al2O3 tube and Ni–Cr alloy coil on a foundation bed. All the sensors were aged on the aging equipment by supplying a 1.73 V voltage for seven days to improve their work stability. The gas sensing performance of sensors was tested by the WS-30A gas sensing test system (Zhengzhou Winsen Electronics Technology Co. Ltd., Zhengzhou, China). For details of the testing process, see [19]. The sensor response was defined as Ra/Rg, where Ra and Rg are the resistance of the sensor at the air and test gas atmospheres, respectively. The response and recovery time were obtained from the time that the sensor resistance changed to 90% of the stabilized resistance value.

3. Results and Discussion

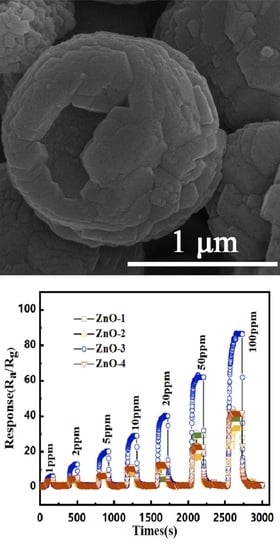
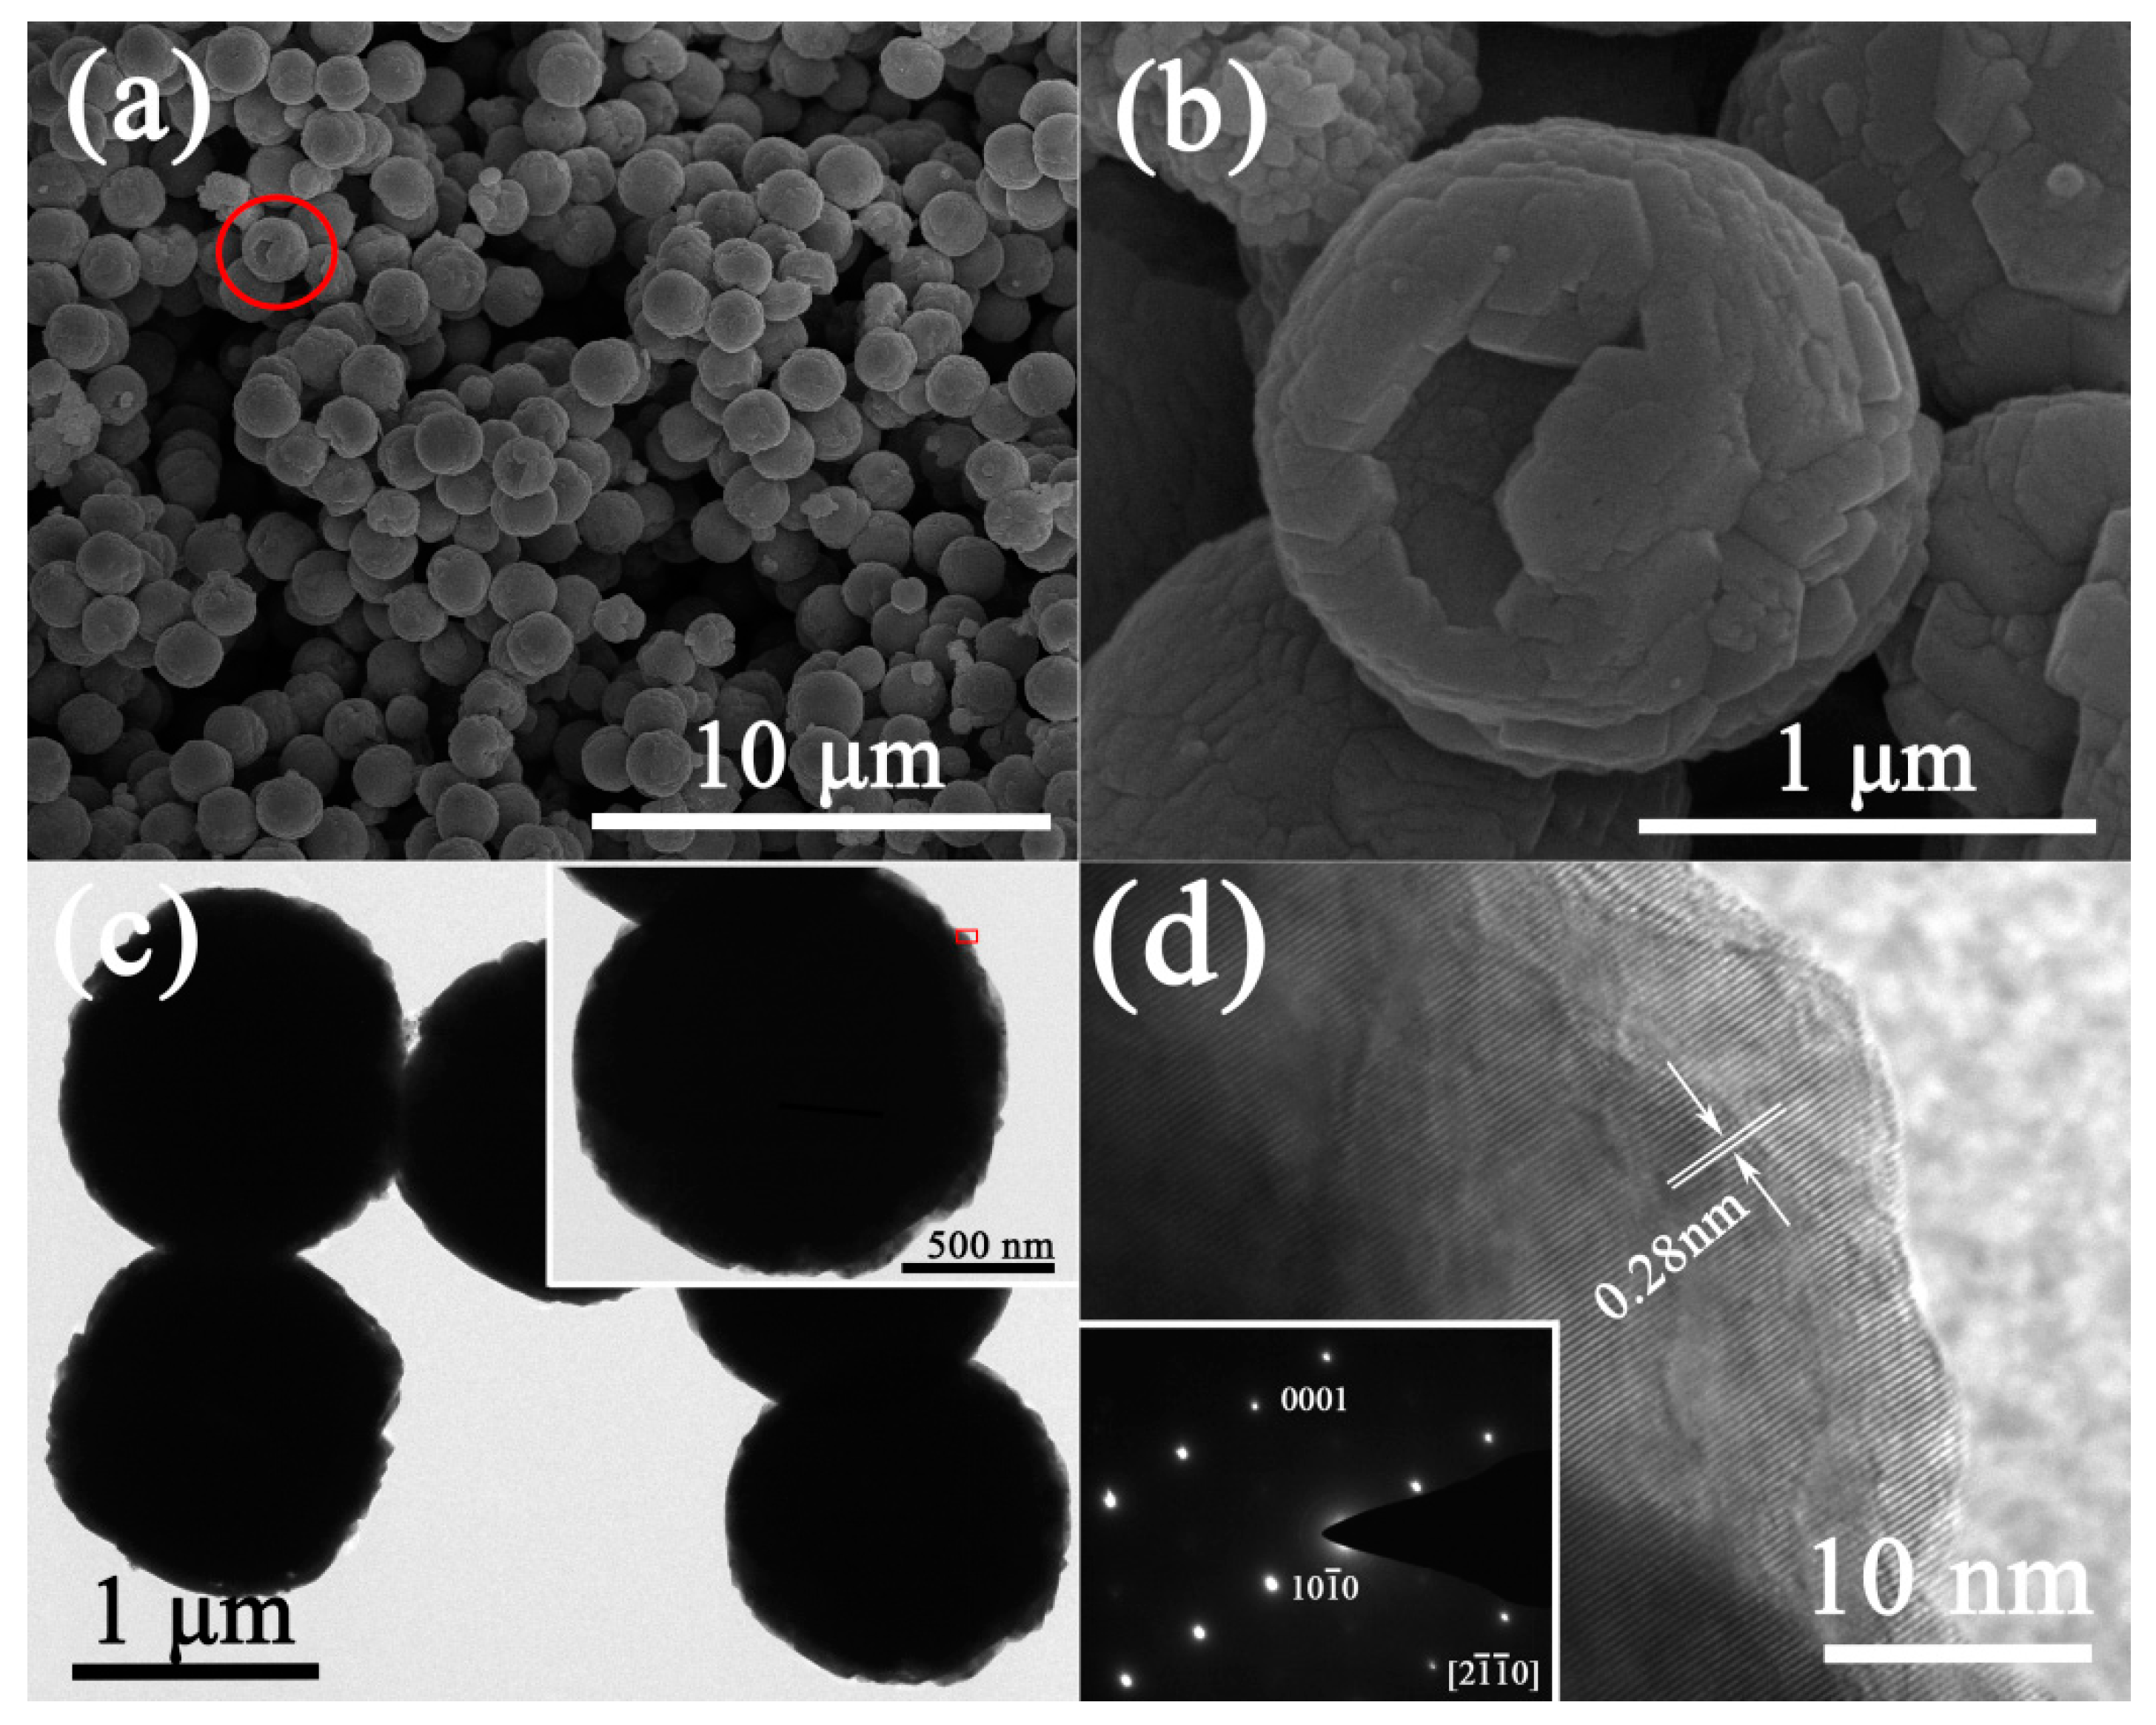
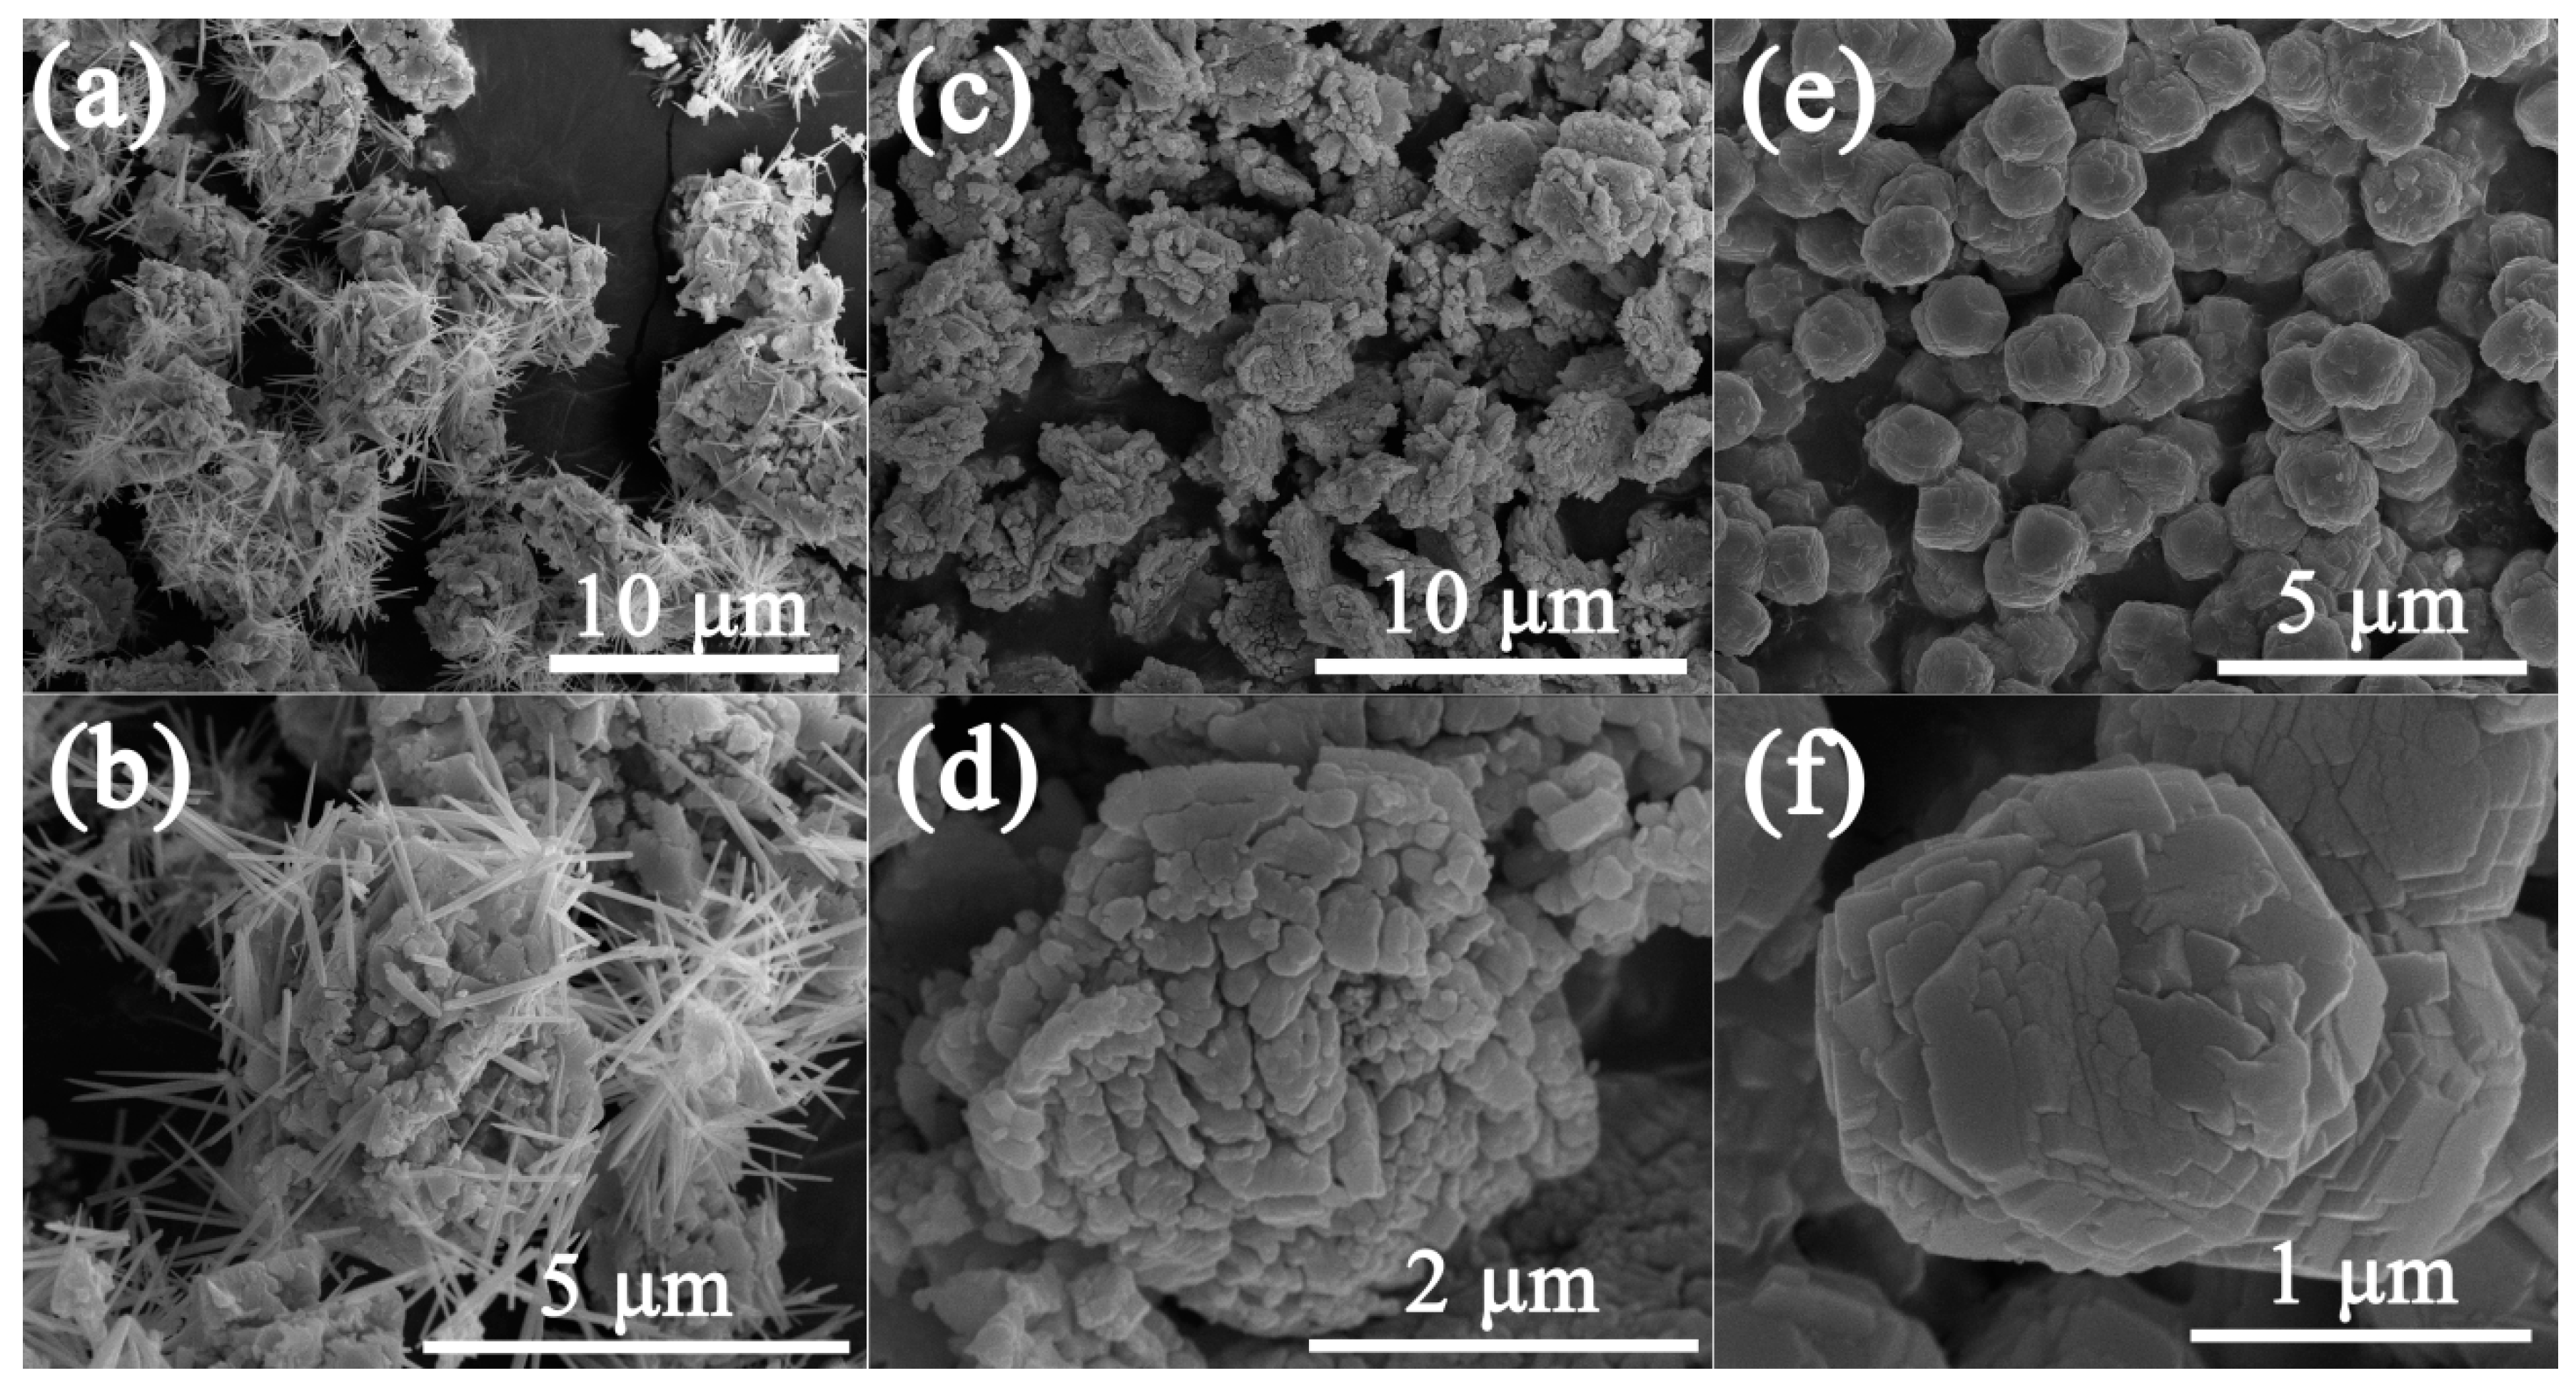
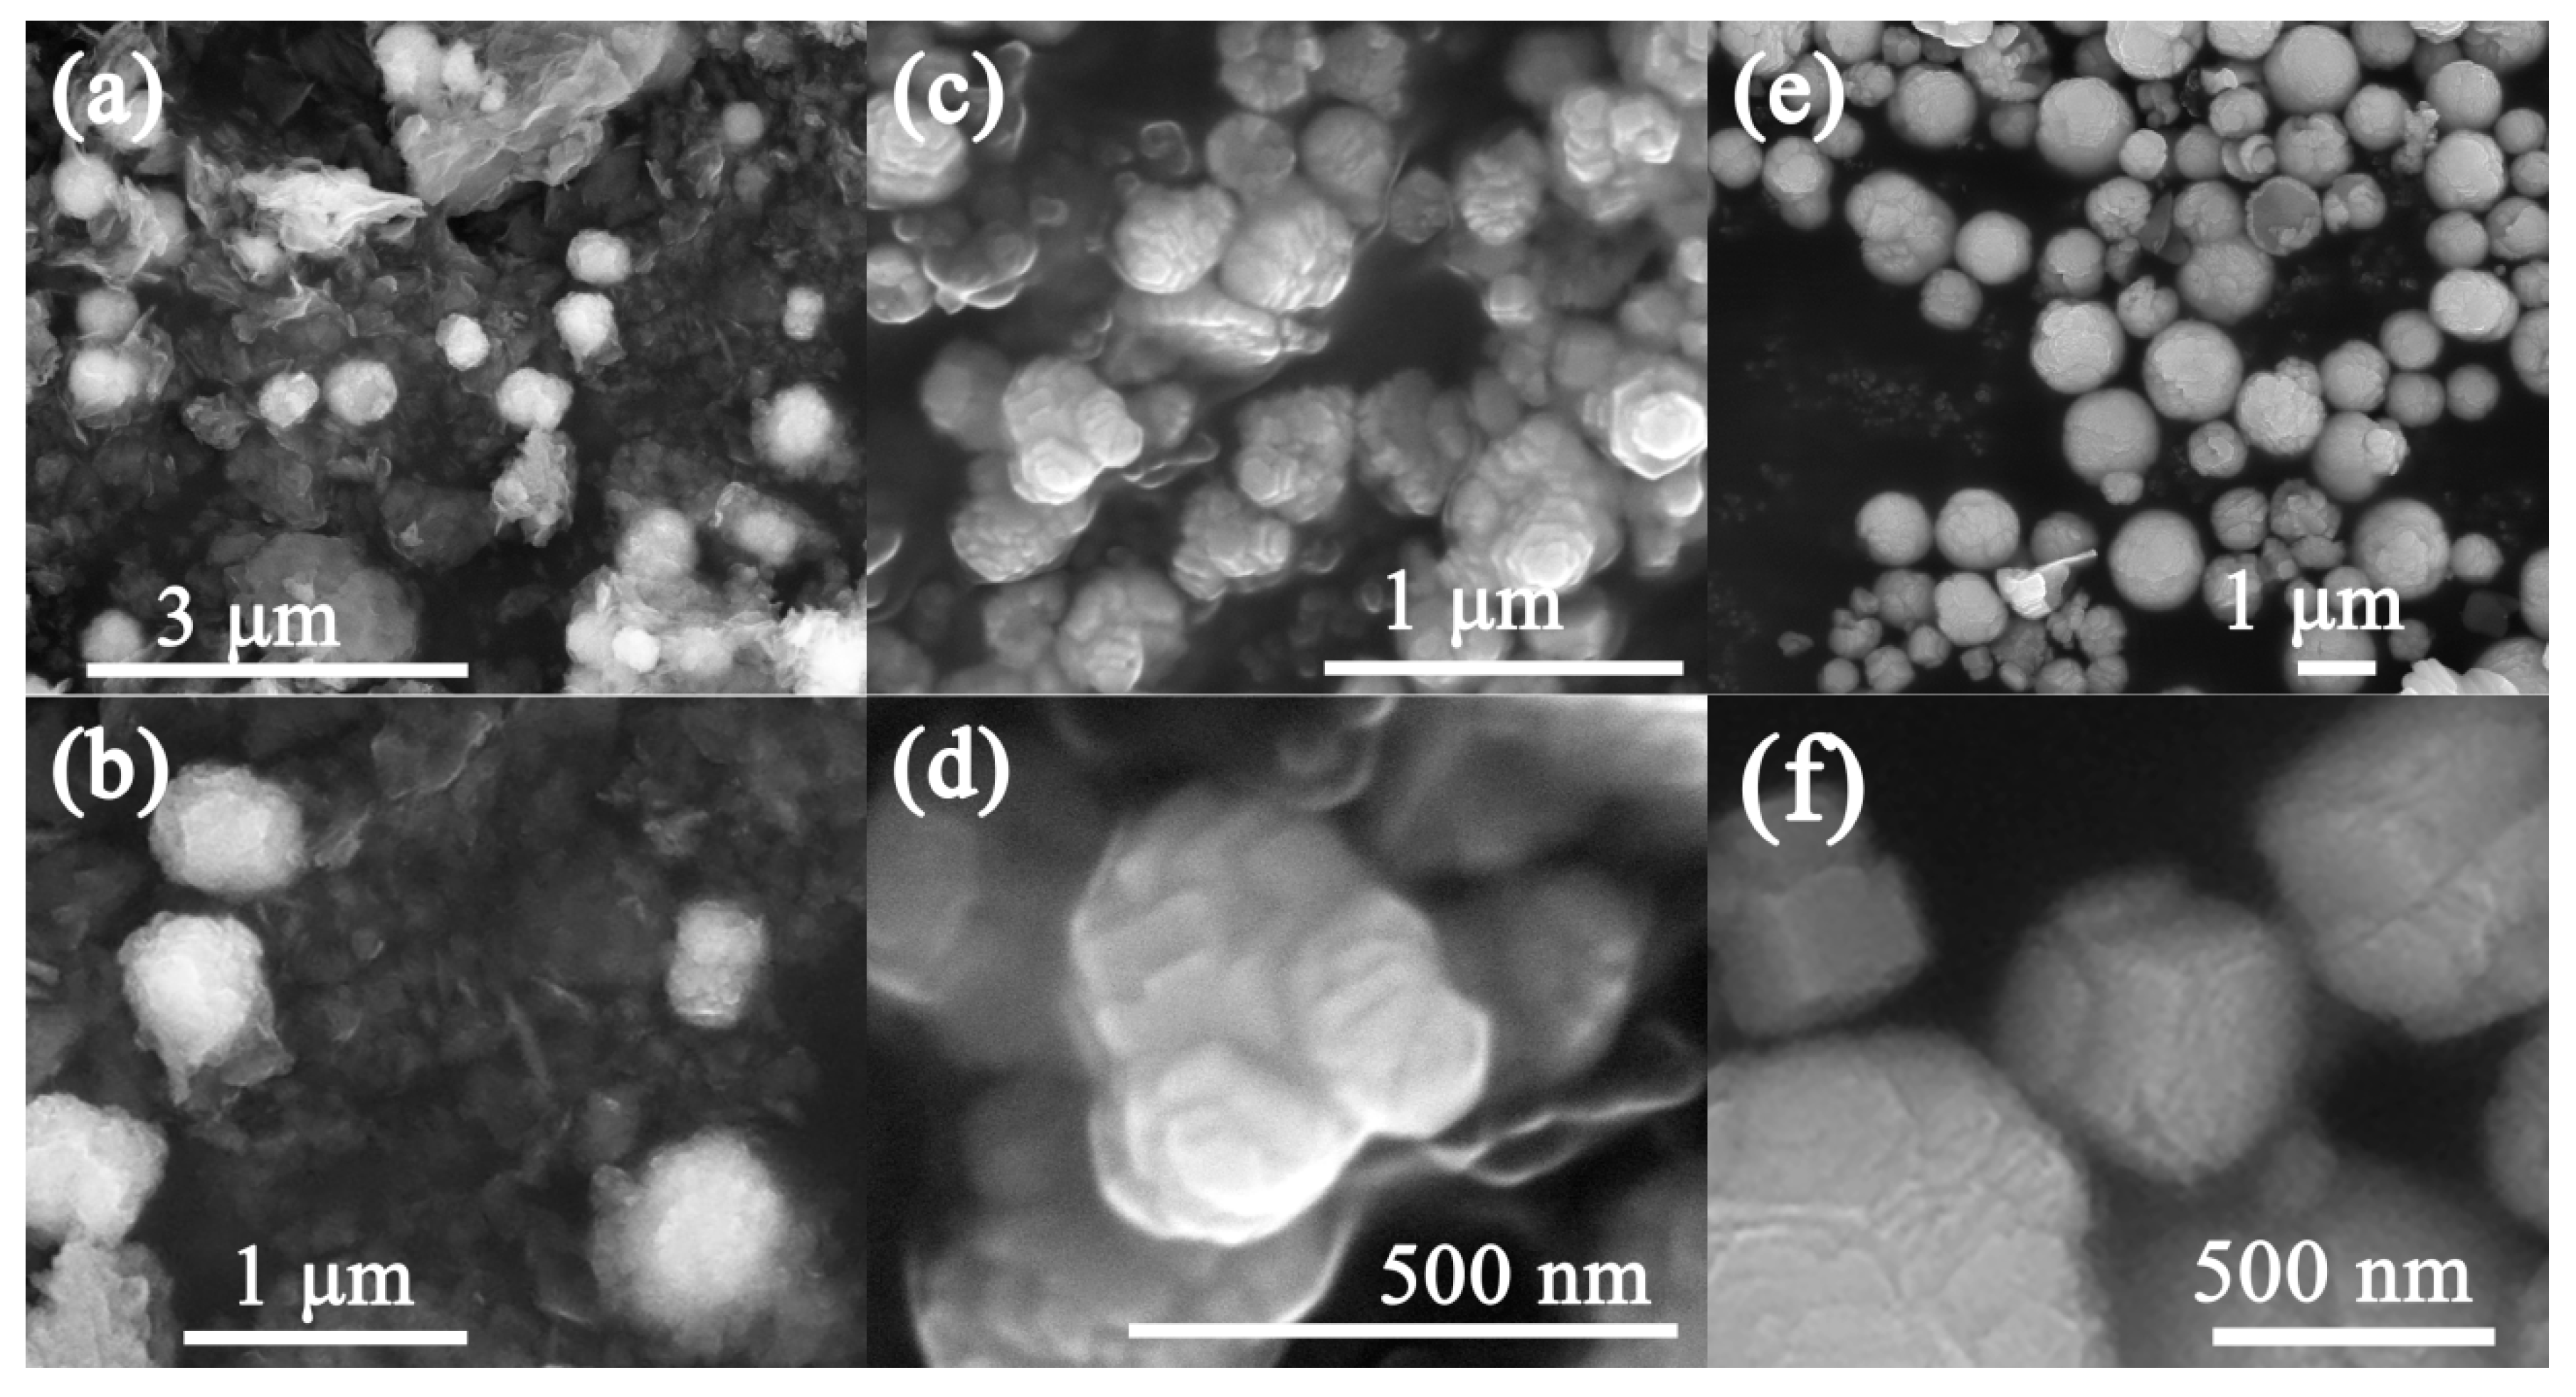
3.1. Morphology and Microstructure Analysis of ZnO Hollow Microspheres

The morphology and the microstructure of ZnO product were investigated by SEM and TEM. As shown in Figure 1a, the products had a microsphere morphology with good dispersibility and uniform size. The high-magnification SEM image (Figure 1b) of as-prepared ZnO microspheres revealed that the ZnO microsphere had a hole on the surface, which confirmed its hollow microsphere structure. The diameter of the ZnO hollow microsphere was approximately 1.4 μm and the thickness of the shell was approximately 100 nm. In particular, the ZnO microsphere consisted of hexagonal nanoplates. The exposed surface was the top of the hexagonal nanoplates, which was ascribed to the polar surface of hexagonal wurtzite ZnO. In order to examine the detailed microstructure of the as-prepared ZnO microspheres, HR-TEM was carried out. The black circles with uniform size confirmed the microsphere microstructure of the sample (Figure 1c). In the HR-TEM image (Figure 1d), the interplanar spacing of 0.28 nm confirmed that the crystal face in the direction of the radius was (10 1 ¯ 0). Therefore, the exposed surface perpendicular to the radius was (0001) or (000 1 ¯ ). The selected area electron diffraction (SAED) pattern (inset of Figure 1d) showed a single crystal structure of the ZnO nanoplate. According to previous reports [27], the unique hollow microsphere structure with high exposed polar surface is favorable to improve the gas sensing performance of ZnO.
Figure 2 shows the XRD pattern of the as-prepared ZnO microspheres. The diffraction peaks at 31.8°, 34.4°, 36.3°, 47.6°, 56.6°, 62.9°, and 68.0° were indexed well as the (100), (002), (101), (102), (110), (103), and (112) crystal planes, respectively. The sharp diffraction peaks well agreed with the standard peaks of hexagonal wurtzite ZnO (JCPDS: 36–1451; a = b = 3.250 Å, c = 5.207 Å), indicating a high purity and good crystallinity of ZnO product.
In order to investigate the influence of TCD on the morphology and microstructure of ZnO, control experiments were carried out by varying the amount of TCD. As shown in Figure 3a,b, the sample prepared without TCD was composed of nanowires and particles. The nanowires and particles aggregated together, leading to poor dispersibility. When the amount of TCD increased to 0.03 g, the morphology of the product transformed to aggregation of nanoparticles. Meanwhile, the nanowires disappeared (Figure 3c,d). With the amount of TCD increased to 0.06 g, ZnO hollow spheres were obtained (Figure 1a,b). If the amount of TCD was increased to 0.12 g, the spheres morphology was still maintained. However, the aggregation of spheres could be observed (Figure 3e,f). From the above discussion, it is obvious that TCD has great influence on the morphology of ZnO. TCD is usually used as a morphology control agent during the fabrication of nano-materials. Zn2+ is easily captured by TCD due to its functional groups, therefore, the ZnO seeds formed on the surface of TCD. ZnO crystals grew along the direction of [0001] under the control of TCD, resulting in the formation of hollow spheres.
In order to further understand the growing process of zinc oxide hollow microspheres, the ZnO products obtained at different times were observed by SEM. As shown in Figure 4a–f, when the reaction time was carried out for 5 min (Figure 4a,b), silk-like flaky structures were formed in the product. In addition, some sphere-like structures were formed by the aggregation of the flaky structures. With the reaction time increasing to 10 min, the flaky structures disappeared and the morphology of the product transformed to the aggregation of nanoplates. It is obvious that the nanoplates that composed the aggregation had a hexagonal shape (Figure 4c,d). With the reaction time further increased to 20 min, ZnO microspheres were observed, as shown in Figure 4e. However, the sizes of the product ranged from approximately 200 nm to 1.2 μm. In particular, the broken spheres confirm the hollow characterization of the product (Figure 4e). High magnification SEM image revealed that the ZnO spheres were assembled by nanoplates (Figure 4f). Finally, ZnO hollow microspheres were obtained at 40 min (Figure 1a).
On the basis of the above results, a possible evolution of ZnO microspheres was proposed. At the beginning, hydroxyl ions were produced from NH3·H2O due to the dissociation and reacted with Zn2+, resulting in the formation of Zn ( OH ) 4 2 (Equations (1) and (2)). With the increase in OH- concentration, the ZnO crystal nucleus was formed first in a flaky structure (Equation (3)). In order to reduce the surface energy, some of the flaky structures were assembled into spheres. As the reaction was carried out, all the flaky structures aggregated to spheres and the nanoplate formed a hexagonal shape under the direction of TCD. TCD is considered as a typical morphology control agent due to its capturing role. The capture effect of TCD promotes the growth of the (0001) plane. Finally, the product formed hollow spheres due to the “Ostwald ripening” process [27].
NH 3   +   H 2 O     NH 4 + +   OH
Zn 2 + +   4 OH -     Zn ( OH ) 4 2  
Zn ( OH ) 4 2     ZnO   +   H 2 O   + 2 OH

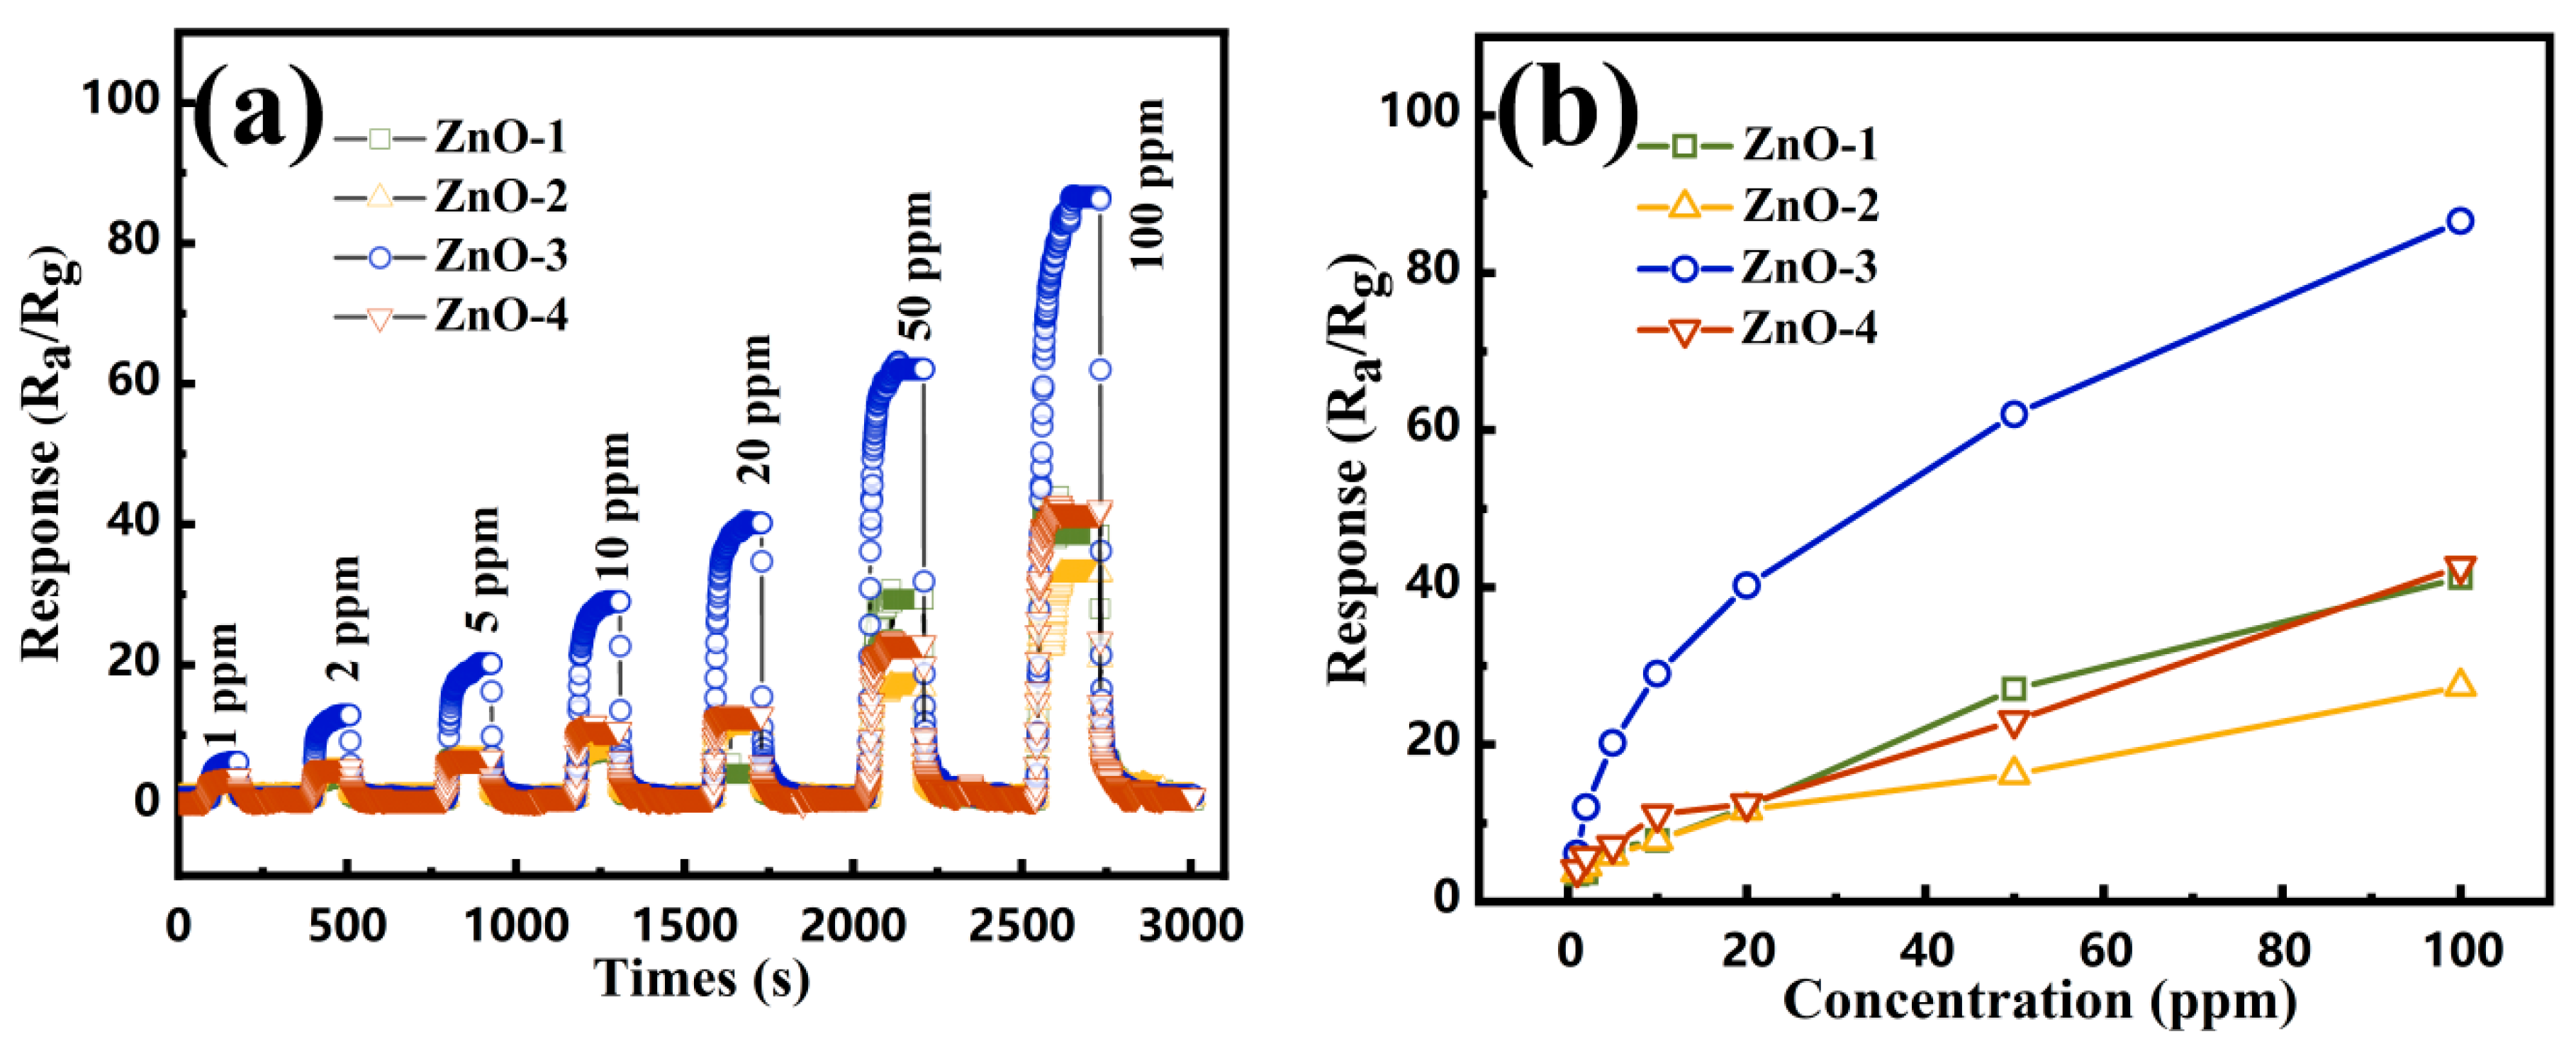
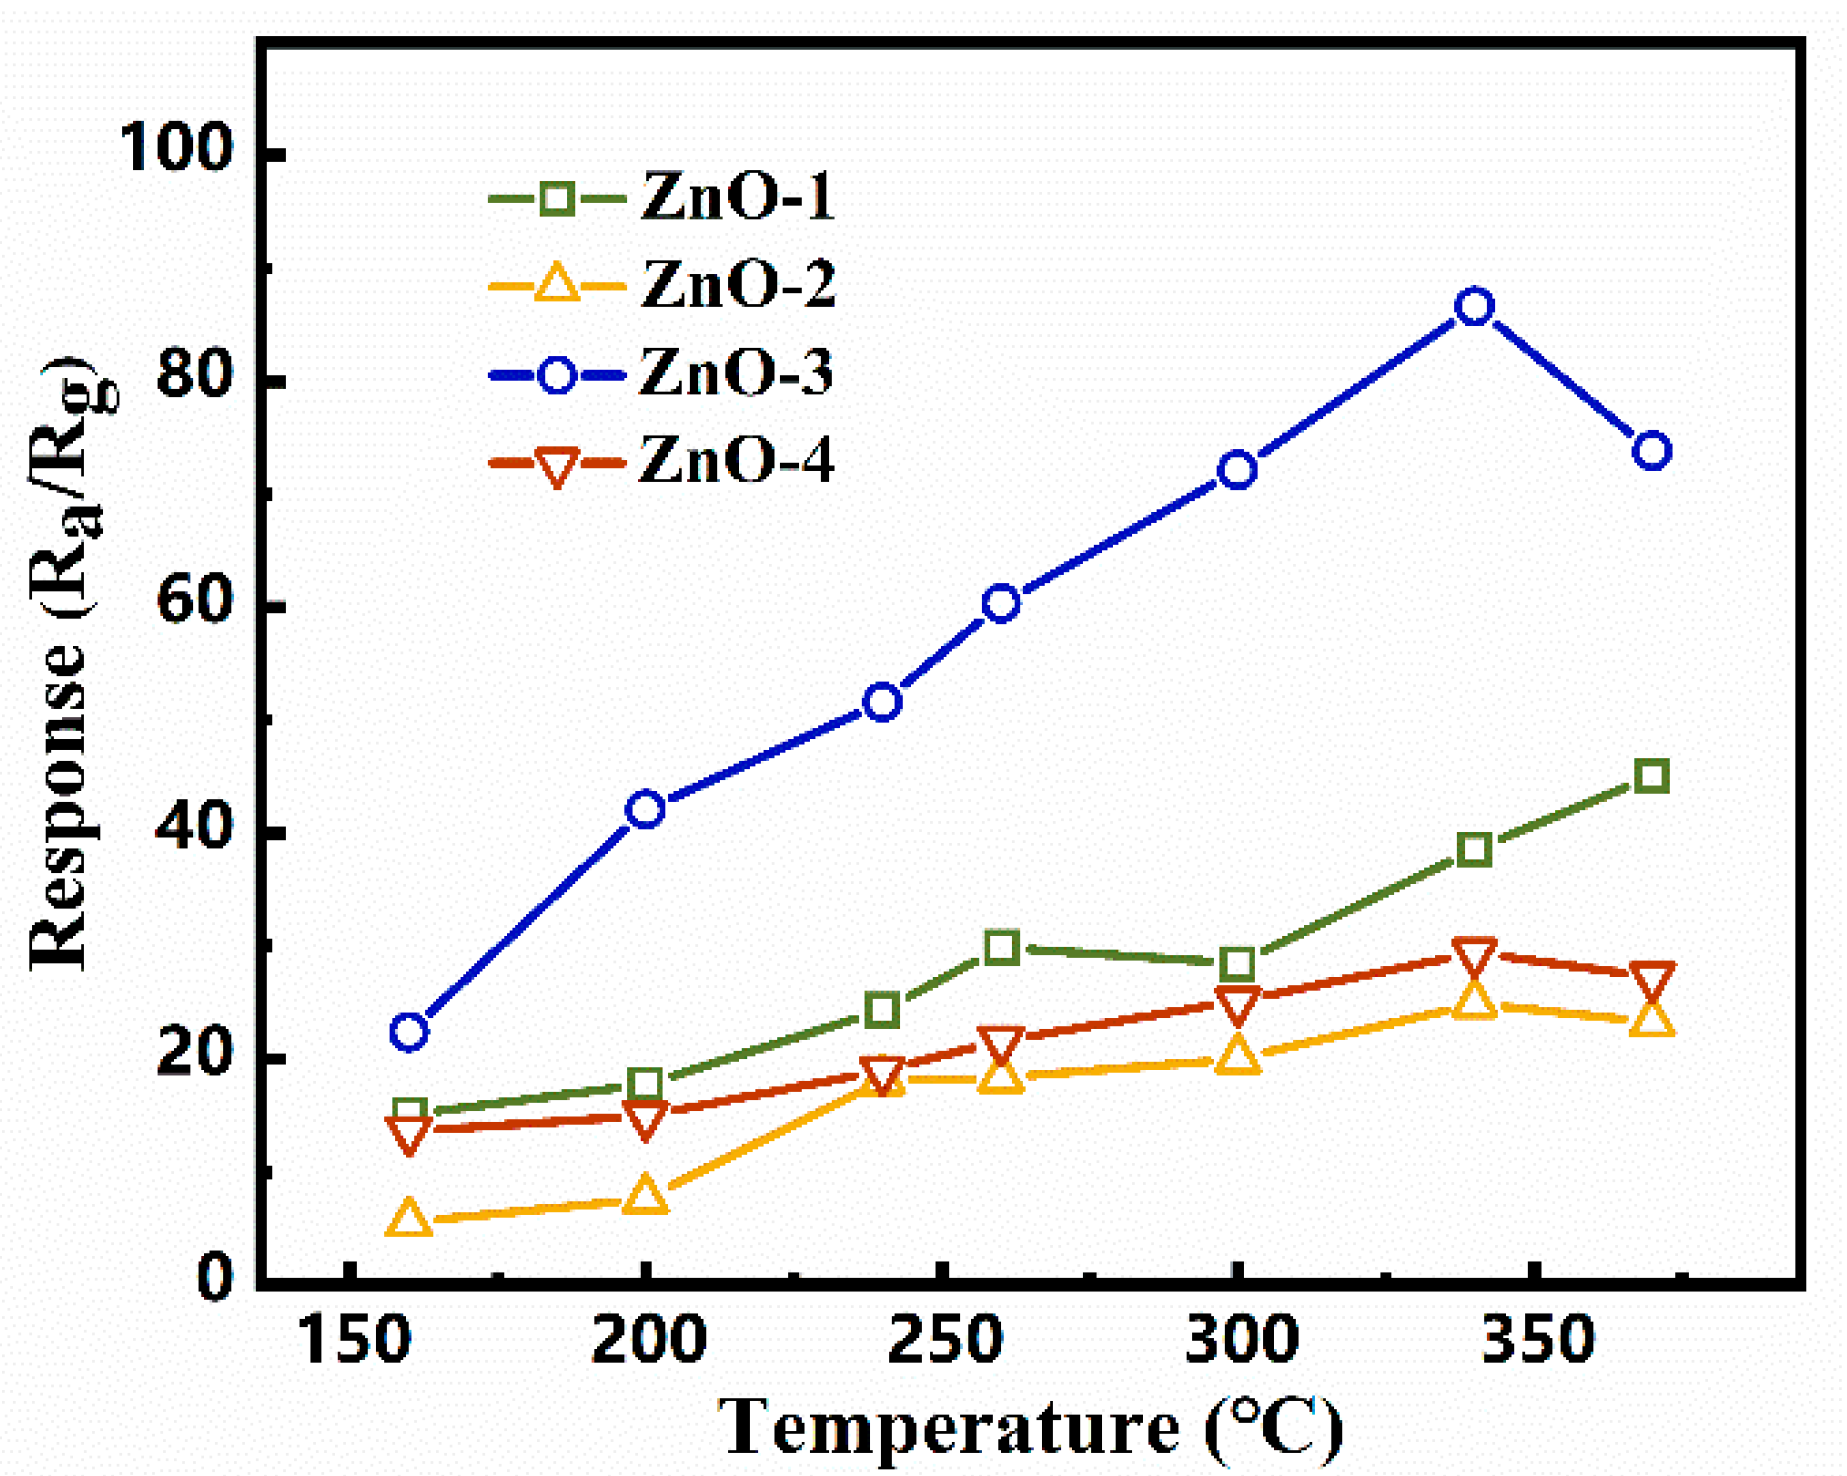
3.2. Gas Sensing Properties of ZnO Hollow Microspheres

N-butanol is a colorless, irritating, flammable, and explosive organic volatile chemical with an anesthetic effect. It is widely used as a plasticizer, solvent, and extractant in the fields of ester, coatings, and medicine [20,28]. Prolonged exposure to n-butanol can cause dizziness, headaches, and skin problems [29]. Therefore, it is necessary to monitor the concentration of n-butanol in real time. In this work, we examined the gas sensing properties of ZnO gas sensors with different microstructures, which were prepared by varying the amount of TCD. The sensors were named as ZnO-1, ZnO-2, ZnO-3, and ZnO-4, which correspond to the TCD amount of 0, 0.03, 0.06, and 0.12 g, respectively.
The optimum operating temperature of the sensors was determined by testing their responses under different operating temperatures using 100 ppm n-butanol as the test gas. As shown in Figure 5, all the sensors had high responses toward n-butanol ranging from 160 °C to 370 °C. It is obvious that the ZnO-3 sensor had higher responses in comparison to other sensors, indicating the enhanced gas sensing properties of ZnO hollow spheres than the other ZnO samples. The response of ZnO-3 increased from 160 °C to 340 °C and then decreased with a further increase in the operating temperature, confirming the optimum operating temperature of 340 °C. The decrease in the response may be ascribed to the desorption of n-butanol on the ZnO surface at high temperature. The response of ZnO-3 at 340 °C reached 86.6, which was more than two times higher than that of other sensors at the same temperature. The highest response of ZnO-3 was attributed to its hollow microsphere structures with uniform size and good dispersibility. The unique structure of ZnO-3 provides more active sites for gas sensing, resulting in a high response to n-butanol. As for the other samples, the aggregation of product reduced the gas sensing reaction active sites. Therefore, ZnO-3 displayed the highest response out of all the other sensors. In addition, the response of the ZnO-1 sensor increased with the operating temperature even at 370 °C, suggesting its optimum operating temperature is higher than 370 °C. Therefore, the addition of TCD enhances the response of the sensor while it decreases the optimum operating temperature.
Figure 6a and Figure S2 show the dynamic responses of the sensors toward different concentrations of n-butanol. All the sensors displayed obvious responses toward it at a concentration ranging from 1 ppm to 100 ppm and the response amplitudes increased with n-butanol concentration. The response amplitudes of the ZnO-3 sensor were much higher than that of other sensors at the same concentration, indicating its improved gas sensing performance. The response and recovery time of the sensor were 17 s and 250 s, respectively, which were much longer than our previous reports. The reason may be ascribed to the hollow sphere structures, which are difficult for gas diffusion. The responses of the sensors toward n-butanol at different concentrations are shown in Figure 6b. The response of ZnO-3 toward 1 ppm n-butanol reached 6.1, indicating the low detection limit. In addition, the response of 6.1 was much larger than the response value reported in previous literature [30]. Selectivity is very important for the application of gas sensors [31]. The selectivity of the sensors toward n-butanol was also examined using triethylamine, ethanol, methanol, ammonia, acetone, and benzene for comparison. The response of ZnO-3 toward n-butanol was much higher than that of other gases, indicating its good selectivity to n-butanol (Figure 7a). Figure 7b shows the responses of the sensor after working at different times. The response of ZnO-3 toward 100 ppm n-butanol remained at 83 after working for 30 days, suggesting its good working stability. As a typical volatile organic compound, N-butanol is considered as a markable gas of medical diagnosis. In order to satisfy the requirement of application, the gas sensing properties of ZnO may be improved by UV irradiation and surface decoration [32], which will be carried out in further work.

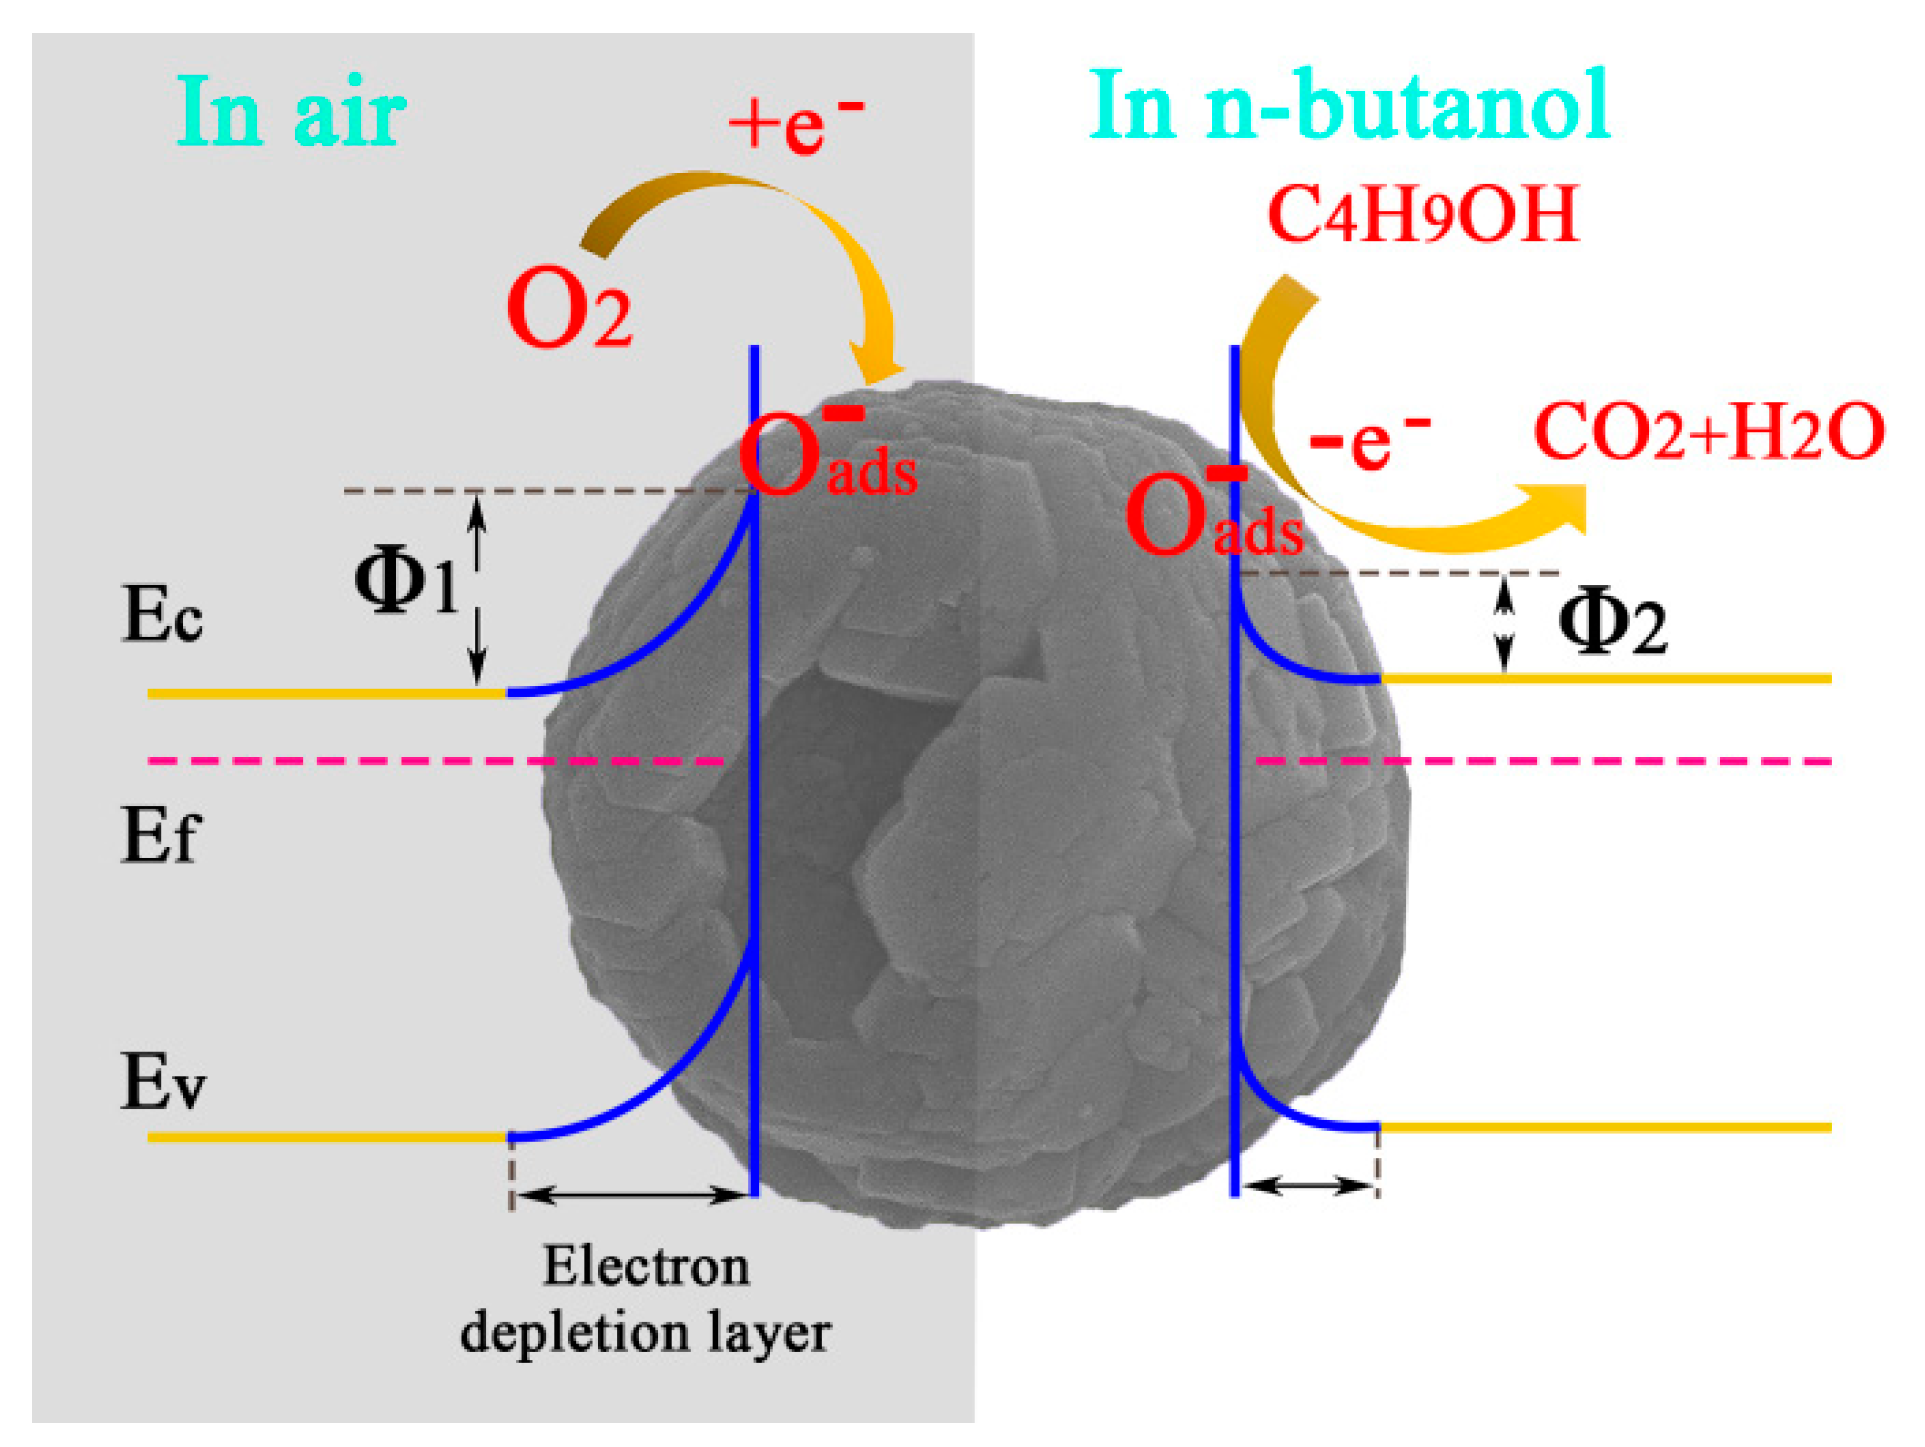
3.3. Gas Sensing Mechanism of the ZnO Hollow Microspheres

The gas sensing mechanism of ZnO is usually explained using the surface charge control model. In an air atmosphere, the oxygen molecules are absorbed on the surface of ZnO (Figure 8). At an operating temperature of 340 °C, the absorbed oxygen molecules are transformed to oxygen ions (O, O2, or O2−) by capturing electrons from the conduction band of ZnO (Equations (4)–(6)). An electron-depletion layer formed in the ZnO sensing layer. Therefore, the ZnO sensor has a high resistance in an air atmosphere (Ra). When the n-butanol is injected, n-butanol molecules decompose to CO2 and H2O through the redox reaction between n-butanol and oxygen ions. Meanwhile, the captured electrons by O species are released back into the conduction band of materials by this reaction (Equations (7)–(8)) [23]. As a result, the resistance of the material decreases to a low value (Rg). The sensor response of the sensor is determined by the ratio of Ra and Rg.
As discussed above, the specific surface area plays an important role for improved sensing properties, therefore, the specific surface area of the ZnO-1 and ZnO-3 samples were examined by the Brunauer–Emmett–Teller (BET) method. As shown in Figure S3, the volume absorption of ZnO-1 and ZnO-3 were very low. The BET surface area of ZnO-1 and ZnO-3 were 6.25 and 5.95 m2·g−1, respectively. This result confirms the similar specific surface area of ZnO-1 and ZnO-3. However, the sensing property of ZnO-3 was much better than that of ZnO-1, suggesting the reason for the improved gas sensing is not attributed to the specific surface area.
The enhanced gas sensing properties of ZnO-3 may be ascribed to the polar (0001) plane. Compared to other samples, ZnO-3 consisted of a hexagonal nanoplate with exposed (0001) plane. The polar (0001) plane has been demonstrated to be more active during the gas sensing process as more exposed Zn atoms can form stronger bonds with gas molecules and thus facilitate the transfer of electrons, which in turn leads to the improvement in the gas-sensitive property [18,19].
O 2 ( gas )   =   O 2 ( ads )
O 2 ( ads )   +   e -   =   O 2 - ( ads )
O 2 - ( ads )   +   e -     =   2 O   - ( ads )
C 4 H 10 O ( gas )   =   C 4 H 10 O ( ads )
C 4 H 10 O ( ads )   +   12 O   - ( ads )   =   4 CO 2 ( ads )   +   5 H 2 O ( l )   +   12 e -

4. Conclusions

In summary, ZnO hollow microspheres with a diameter of approximately 1.4 μm were synthesized by a wet chemistry method at 90 °C. The as-prepared ZnO hollow microspheres consisted of hexagonal nanoplates with exposed (0001) polar crystal planes. The influences of TCD on the microstructure and growth process were investigated by carrying out a control experiment. Gas sensing test results indicate that the ZnO hollow microspheres displayed excellent gas sensing performance toward n-butanol. The response of ZnO hollow microspheres toward 100 ppm n-butanol was 86.6 at 340 °C, which was much higher than that of the other samples. The ZnO hollow microspheres also displayed high selectivity and long-time work stability toward n-butanol. The enhanced gas sensing performance of ZnO was attributed to the hollow sphere structure with high exposed polar crystal planes.

Supplementary Materials

The following are available online at https://www.mdpi.com/2073-4352/10/11/1010/s1, Figure S1: Photograph of the gas sensor. Figure S2: Dynamic response curve of resistance. Figure S3: Nitrogen adsorption and desorption isotherm of ZnO-1 (a) and ZnO-3 (b). (The insets are pore size distribution).

Author Contributions

Conceptualization, X.W. and S.W.; methodology, S.W.; software, X.C.; validation, S.W., G.Q.; formal analysis, S.W.; investigation, G.Q.; resources, H.C.; data curation, S.W.; writing—original draft preparation, S.W.; writing—review and editing, X.W.; visualization, G.Q.; supervision, X.C.; project administration, X.W.; funding acquisition, X.W. and H.C. All authors have read and agreed to the published version of the manuscript.

Funding

This research received no external funding.

Acknowledgments

This work was supported by Distinguished Taishan Scholars in Climbing Plan (No. tspd20161006), the Shandong Provincial Natural Science Foundation (No. ZR2019MEM049), and the Natural Science Foundation of China (No. 51772167).

Conflicts of Interest

The authors declare there are no conflicts of interest.

References

  1. Saboor, F.H.; Khodadadi, A.A.; Mortazavi, Y.; Asgari, M. Microemulsion synthesized silica/ZnO stable core/shell sensors highly selective to ethanol with minimum sensitivity to humidity. Sens. Actuator B Chem. 2017, 238, 1070–1083. [Google Scholar] [CrossRef]
  2. Hang, T.; Wu, J.; Xiao, S.; Li, B.; Li, H.; Yang, C.; Yang, C.; Hu, N.; Xu, Y.; Zhang, Y.; et al. Anti-biofouling NH3 gas sensor based on reentrant thorny ZnO/graphene hybrid nanowalls. Microsyst. Nanoeng. 2020, 6, 41. [Google Scholar] [CrossRef]
  3. Liu, Z.; Yang, P. Optoelectronic performances on different structures of Al-doped ZnO. J. Am. Ceram. Soc. 2018, 101, 5615–5626. [Google Scholar] [CrossRef]
  4. Li, C.; Han, C.; Zhang, Y.; Zang, Z.; Wang, M.; Tang, X.; Du, J. Enhanced photoresponse of self-powered perovskite photodetector based on ZnO nanoparticles decorated CsPbBr3 films. Sol. Energy Mater. Sol. Cells 2017, 172, 341–346. [Google Scholar] [CrossRef]
  5. Wang, L.; Zhao, Y.; Zheng, K.; She, J.; Deng, S.; Xu, N.; Chen, J. Fabrication of large-area ZnO nanowire field emitter arrays by thermal oxidation for high-current application. Appl. Surf. Sci. 2019, 484, 966–974. [Google Scholar] [CrossRef]
  6. Kuo, T.-J.; Lin, C.-N.; Kuo, C.-L.; Huang, M.H. Growth of ultralong ZnO nanowires on silicon substrates by vapor transport and their use as recyclable photocatalysts. Chem. Mater. 2007, 19, 5143–5147. [Google Scholar] [CrossRef]
  7. Saito, B.N.; Haneda, H.; Sekiguchi, T.; Ohashi, N.; Sakaguchi, I.; Koumoto, K. Low-Temperature Fabrication of Light-Emitting Zinc Oxide Micropatterns Using Self-Assembled Monolayers. Adv. Mater. 2002, 14, 418–421. [Google Scholar] [CrossRef]
  8. Yang, X.; Zhang, S.; Yu, Q.; Zhao, L.; Sun, P.; Wang, T.; Liu, F.; Yan, X.; Gao, Y.; Liang, X.; et al. One step synthesis of branched SnO2/ZnO heterostructures and their enhanced gas-sensing properties. Sens. Actuator B Chem. 2019, 281, 415–423. [Google Scholar] [CrossRef]
  9. Lynall, D.; Tseng, A.C.; Nair, S.V.; Savelyev, I.G.; Blumin, M.; Wang, S.; Wang, Z.M.; Ruda, H.E. Nonlinear Chemical Sensitivity Enhancement of Nanowires in the Ultralow Concentration Regime. ACS Nano 2020, 14, 964–973. [Google Scholar] [CrossRef]
  10. Kim, Y.; Kang, S.K.; Oh, N.C.; Lee, H.D.; Lee, S.M.; Park, J.; Kim, H. Improved Sensitivity in Schottky Contacted Two-Dimensional MoS2 Gas Sensor. ACS Appl. Mat. Interfaces 2019, 11, 38902–38909. [Google Scholar] [CrossRef]
  11. Dai, J.; Ogbeide, O.; Macadam, N.; Sun, Q.; Yu, W.; Li, Y.; Su, B.L.; Hasan, T.; Huang, X.; Huang, W. Printed gas sensors. Chem. Soc. Rev. 2020, 49, 1756–1789. [Google Scholar] [CrossRef] [PubMed]
  12. Chen, H.; Sun, L.; Li, G.-D.; Zou, X. Well-Tuned Surface Oxygen Chemistry of Cation Off-Stoichiometric Spinel Oxides for Highly Selective and Sensitive Formaldehyde Detection. Chem. Mater. 2018, 30, 2018–2027. [Google Scholar] [CrossRef]
  13. Wang, X.; Liu, F.; Chen, X.; Lu, G.; Song, X.; Tian, J.; Cui, H.; Zhang, G.; Gao, K. SnO2 core-shell hollow microspheres co-modification with Au and NiO nanoparticles for acetone gas sensing. Powder Technol. 2020, 364, 159–166. [Google Scholar] [CrossRef]
  14. Wang, X.; Qiu, S.; Liu, J.; He, C.; Lu, G.; Liu, W. Synthesis of Mesoporous SnO2 Spheres and Application in Gas Sensors. Eur. J. Inorg. Chem. 2014, 2014, 863–869. [Google Scholar] [CrossRef]
  15. Yang, C.; Xu, Y.; Zheng, L.; Zhao, Y.; Zheng, W.; Liu, X.; Zhang, J. Hierarchical NiCo2O4 microspheres assembled by nanorods with p-type response for detection of triethylamine. Chin. Chem. Lett. 2020, 31, 2077–2082. [Google Scholar] [CrossRef]
  16. Wang, S.; Guo, Y.; Xue, Y.; Wang, X.; Cui, H.; Tian, J. Homophase structure for promoting electron transfer in gas-sensing. Sens. Actuator B Chem. 2019, 298, 126940. [Google Scholar] [CrossRef]
  17. Chang, J.; Ahmad, M.Z.; Wlodarski, W.; Waclawik, E.R. Self-assembled 3D ZnO porous structures with exposed reactive {0001} facets and their enhanced gas sensitivity. Sensors 2013, 13, 8445–8460. [Google Scholar] [CrossRef]
  18. Li, Z.; Pan, W.; Zhang, D.; Zhan, J. Morphology-dependent gas-sensing properties of ZnO nanostructures for chlorophenol. Chem. Asian J. 2010, 5, 1854–1859. [Google Scholar] [CrossRef]
  19. Xu, J.; Xue, Z.; Qin, N.; Cheng, Z.; Xiang, Q. The crystal facet-dependent gas sensing properties of ZnO nanosheets: Experimental and computational study. Sens. Actuator B Chem. 2017, 242, 148–157. [Google Scholar] [CrossRef]
  20. Liu, F.; Huang, G.; Wang, X.; Xie, X.; Xu, G.; Lu, G.; He, X.; Tian, J.; Cui, H. High response and selectivity of single crystalline ZnO nanorods modified by In2O3 nanoparticles for n-butanol gas sensing. Sens. Actuator B Chem. 2018, 277, 144–151. [Google Scholar] [CrossRef]
  21. Kaneti, Y.V.; Yue, J.; Jiang, X.; Yu, A. Controllable Synthesis of ZnO Nanoflakes with Exposed (10 1 ¯ 0) for Enhanced Gas Sensing Performance. J. Phys. Chem. C 2013, 117, 13153–13162. [Google Scholar] [CrossRef]
  22. Huang, J.; Wu, Y.; Gu, C.; Zhai, M.; Yu, K.; Yang, M.; Liu, J. Large-scale synthesis of flowerlike ZnO nanostructure by a simple chemical solution route and its gas-sensing property. Sens. Actuator B Chem. 2010, 146, 206–212. [Google Scholar] [CrossRef]
  23. Liu, X.; Chen, N.; Xing, X.; Li, Y.; Xiao, X.; Wang, Y.; Djerdj, I. A high-performance n-butanol gas sensor based on ZnO nanoparticles synthesized by a low-temperature solvothermal route. RSC Adv. 2015, 5, 54372–54378. [Google Scholar] [CrossRef]
  24. Shen, Z.; Zhang, X.; Ma, X.; Mi, R.; Chen, Y.; Ruan, S. The significant improvement for BTX (benzene, toluene and xylene) sensing performance based on Au-decorated hierarchical ZnO porous rose-like architectures. Sens. Actuator B Chem. 2018, 262, 86–94. [Google Scholar] [CrossRef]
  25. Han, B.; Liu, X.; Xing, X.; Chen, N.; Xiao, X.; Liu, S.; Wang, Y. A high response butanol gas sensor based on ZnO hollow spheres. Sens. Actuator B Chem. 2016, 237, 423–430. [Google Scholar] [CrossRef]
  26. Guo, W.; Liu, T.; Sun, R.; Chen, Y.; Zeng, W.; Wang, Z. Hollow, porous, and yttrium functionalized ZnO nanospheres with enhanced gas-sensing performances. Sens. Actuator B Chem. 2013, 178, 53–62. [Google Scholar] [CrossRef]
  27. Li, X.; Sun, P.; Yang, T.; Zhao, J.; Wang, Z.; Wang, W.; Liu, Y.; Lu, G.; Du, Y. Template-free microwave-assisted synthesis of ZnO hollow microspheres and their application in gas sensing. CrystEngComm 2013, 15, 2949–2955. [Google Scholar] [CrossRef]
  28. Xu, Y.; Zheng, L.; Yang, C.; Zheng, W.; Liu, X.; Zhang, J. Chemiresistive sensors based on core-shell ZnO@TiO2 nanorods designed by atomic layer deposition for n-butanol detection. Sens. Actuator B Chem. 2020, 310, 127846. [Google Scholar] [CrossRef]
  29. Lv, L.; Cheng, P.; Wang, Y.; Xu, L.; Zhang, B.; Lv, C.; Ma, J.; Zhang, Y. Sb-doped three-dimensional ZnFe2O4 macroporous spheres for N-butanol chemiresistive gas sensors. Sens. Actuator B Chem. 2020, 320, 128384. [Google Scholar] [CrossRef]
  30. Xu, Y.; Liu, P.; Sun, D.; Sun, Y.; Zhang, G.; Gao, D. Tunable synthesis of uniform ZnO nanospheres and their size-dependent gas sensing performance toward n-butanol. Mater. Lett. 2015, 161, 495–498. [Google Scholar] [CrossRef]
  31. Walker, J.M.; Akbar, S.A.; Morris, P.A. Synergistic effects in gas sensing semiconducting oxide nano-heterostructures: A review. Sens. Actuator B Chem. 2019, 286, 624–640. [Google Scholar] [CrossRef]
  32. Saidi, T.; Palmowski, D.; Babicz-Kiewlicz, S.; Welearegay, G.T.; Bari, N.E.; Smulko, J.; Bouchikhi, B. Exhale breath gas sensing using pristine and functionalized WO3 nanowire sensors enhanced by UV-light irradiation. Sens. Actuator B Chem. 2018, 273, 1719–1729. [Google Scholar] [CrossRef]
Figure 1. (a,b) SEM, (c) TEM, and (d) HR-TEM images of ZnO microspheres. The inset of (d) was the SAED pattern of the ZnO microspheres.
Crystals 10 01010 g001
Figure 2. X-ray diffraction (XRD) pattern of the as-prepared ZnO hollow microspheres.
Crystals 10 01010 g002
Figure 3. ZnO obtained with different amounts of TCD: 0 g (a,b), 0.03 g (c,d), or 0.12 g (e,f).
Crystals 10 01010 g003
Figure 4. ZnO obtained with different reaction times: 5 min (a,b), 10 min (c,d), or 20 min (e,f).
Crystals 10 01010 g004
Figure 5. Responses of sensors exposed to 100 ppm n-butanol at different operating temperatures.
Crystals 10 01010 g005
Figure 6. (a) Dynamitic curves and (b) responses to different concentrations of n-butanol at 340 °C.
Crystals 10 01010 g006
Figure 7. (a) Selectivity and (b) long-term stability of ZnO hollow microspheres.
Crystals 10 01010 g007
Figure 8. Schematic illustration of the sensing mechanism and the energy band diagram.
Crystals 10 01010 g008
Publisher’s Note: MDPI stays neutral with regard to jurisdictional claims in published maps and institutional affiliations.

