1. Introduction
Over the last decades, duplex stainless steels (DSS) have progressively been used in certain industrial areas instead of traditional austenitic stainless steels for the last decades due to their excellent mechanical properties and corrosion resistance, in spite of their relatively high cost. In these industrial sectors, often highly corrosive gases and fluids are stored and transported, e.g., marine, paper, pulp, chemical, nuclear, and petrochemical industries. DSS have much higher strength and higher PREN (Pitting Resistance Equivalent Number, Super DSSs have PREN > 40) than traditional austenitic stainless steels. Their increasing usage is supported by their low cost/lifetime rate [
1,
2].
Their favorable characteristics are realized by a particular microstructure which is composed of austenitic and ferritic phases having near the same volume ratio (50–50%). As a consequence of the nearly same amount of these phases this type of duplex steels have got improved corrosion resistance and enhanced toughness, ductility and weldability. The favorable fraction of austenitic and ferritic phases is regulated by appropriate addition of different alloying elements (e.g., Cr, Ni, Mo, and N), while the carbon content is in the range of 0.02–0.03%. Because of the high quantity of alloying elements, components made from DSS can be exposed to various mechanical and environmental effects during their lifetime what can induce different types of deterioration processes. When a component’s temperature is between 300 and 1000 °C it can induce the precipitation of different deleterious secondary phases (e.g., α’/alpha prime, σ/sigma, and χ/chi phases) [
3,
4,
5].
Formation of the α’-phase is resulted by the spinodal decomposition of the ferritic phase into Fe-rich (or Cr-depleted) α-ferrite and Cr-rich α’-phase (also called alpha prime), what takes place between 300 and 525 °C and causes the so called “475 °C embrittlement”. During this spinodal decomposition zones with different Cr-concentrations are formed by uphill diffusion. The spinodal decomposition of the ferritic phase increases hardness because stress fields are formed between Cr-rich α’ and Fe-rich α zones and are increasing with aging time what hinder the movement of dislocations [
6].The σ-phase forms during a eutectoid-type decomposition of the ferritic phase (δ) into secondary austenite (γ
2) and σ-phase according to the next equation: δ→γ
2 + σ between 650–1000 °C after some isothermal annealing [
7,
8,
9].
The presence of these secondary phases can lead to premature deterioration of DSS components in two different ways. On the one hand, these are hard and brittle precipitations which have a damaging effect on ductility and toughness of duplex steels. On the other hand, they have usually relatively high concentration of Cr and/or Mo, decrease the concentration of these elements in the adjacent grains resulting the reduction of corrosion resistance [
10,
11,
12,
13,
14].
As a matter of fact, in cases of traditional stainless steels and some grades of DSSs (e.g., lean DSSs) diffusionless formation of strain-induced martensite (SIM) should be considered due to the high rate of cold working. SIM can be formed from metastable austenite according to the next equations: γ→ε, γ→α’ or γ→ε→α’, where ε is a paramagnetic HCP (hexagonal closed packed) phase and α’ is a ferromagnetic BCC (body centered cubic) phase. However, it seems that highly alloyed DSSs, including 2507 grades, are not prone to formation of SIM, because they have more stable austenite to prevent its formation [
15]. In our case, it will be revealed. Hereafter, the letter α’ denotes usually the Cr-rich α’-phase.
In this paper, the effects of cold working on thermally induced deterioration processes of duplex stainless steels and their activation energies are studied through differential thermal analysis (DTA) measurements in the range of 100 to 1000 °C. Articles can be found in the literature which deal with the decomposition of ferritic phase in austenitic or duplex stainless steels and their hot deformability, but they use different kinds of steels with pre-treatments and testing methods (see them in
Section 3.6 and
Section 4). However, no studies can be found in which the effects of cold working on the phase transformations of duplex stainless steels are studied using DTA. DTA seems to be capable to indicate phase transformations at different temperatures and consequently to quantify their activation energies from the Kissinger plot.
Another purpose and novelty of our work was to investigate the applicability of DTA on the phase transformations of duplex stainless steels. Calculating their activation energies by the Kissinger plot offer numerical and comparable results to judge this.
2. Materials and Methods
The experimental material was a commercially available SAF 2507 type duplex stainless steel (other standards apart from SAF 2507: UNS S32750, EN Number 1.4410). The nominal composition of this steel is given in
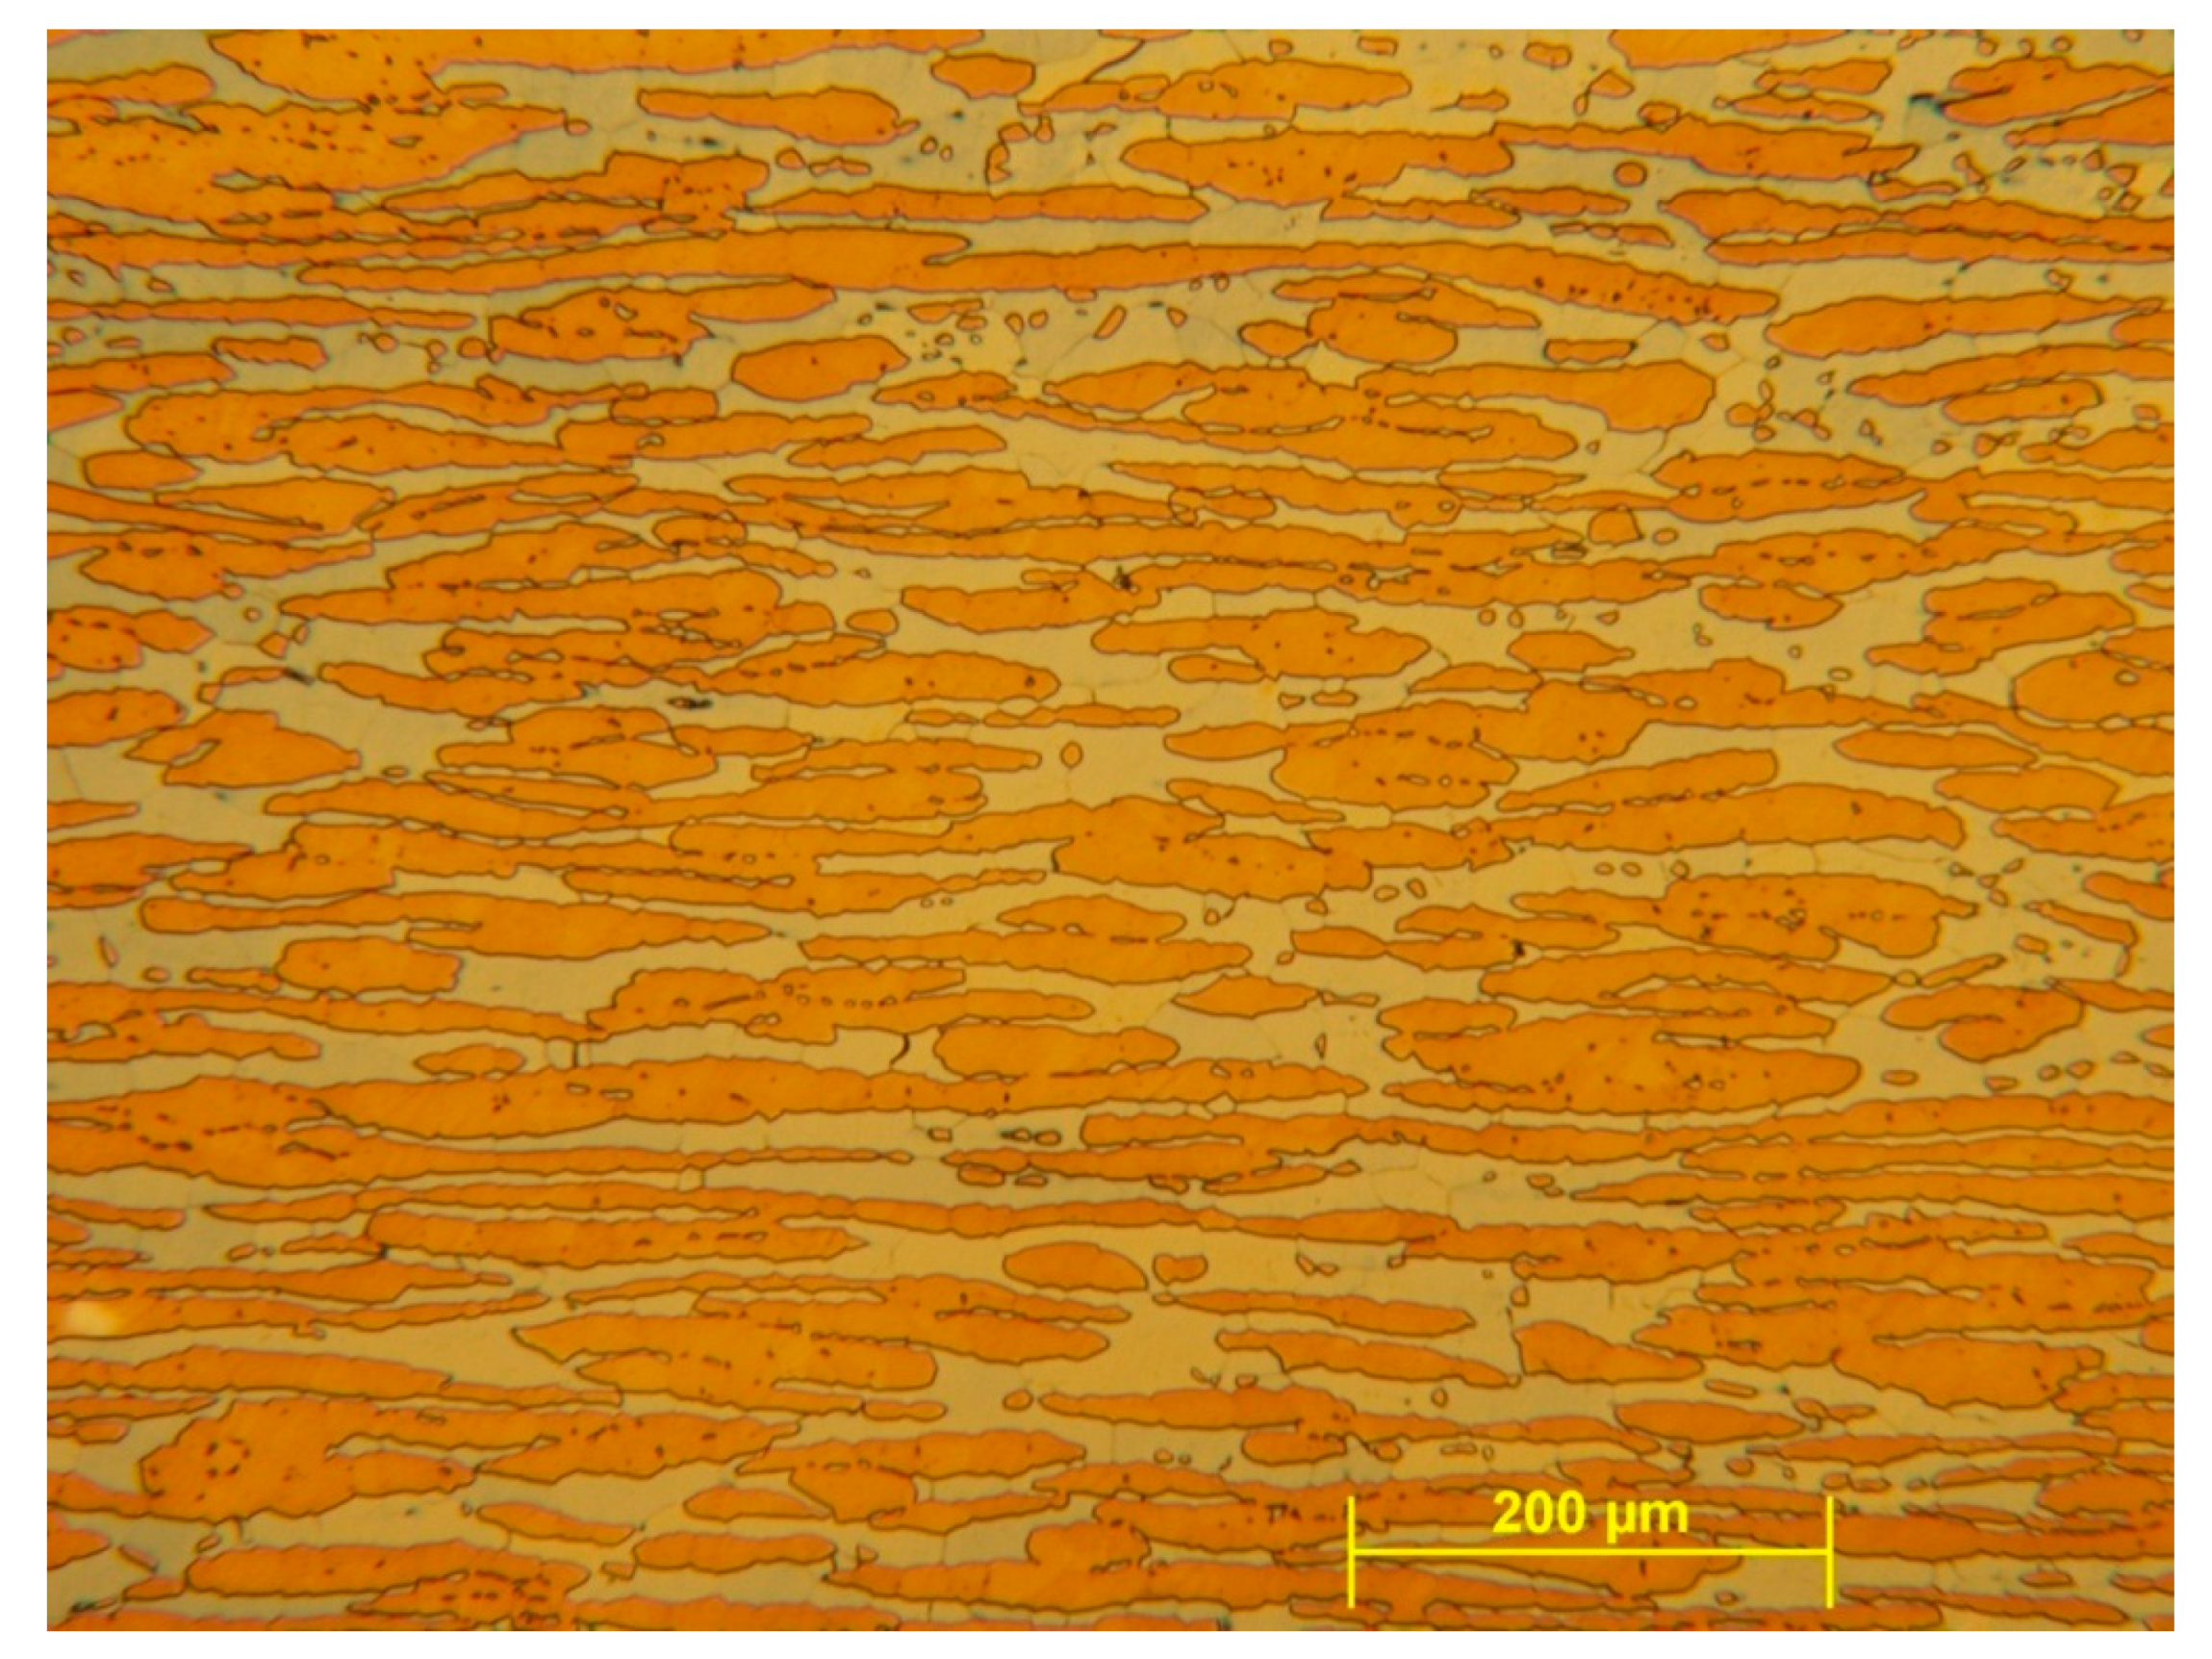
Table 1. A micrograph of the microstructure of the untreated sample can be seen on
Figure 1. For this study a sample made of this type of steel was cold rolled up to 60% deformation, then a piece of it was investigated using DTA. Later on, two pieces of it were isothermally heat treated at different temperatures (500 and 800 °C) for 20 min in order to form different phases.
DTA investigations were carried out by a Setaram Setsys 16/18 device to find phase transformations and determine their activation energies. Samples were heated up from 100 to 1000 °C with different heating rates (5, 10, and 20 °C/min) in argon atmosphere, then they were cooled at a constant 40 °C/min cooling rate.
For optical metallography, the specimens were ground and mechanically polished, and after they were etched by Murakami’s and Beraha II etchant. Murakami’s etchant contains 150 mL distilled water (H2O), 30 g potassium hydroxide (KOH), and 30 g potassium ferricyanide (K3[Fe(CN)6]). Samples were kept in 90–95 °C Murakami’s solution for 15–20 s.
Beraha II etchant contains 85 mL distilled water (H2O), 15 mL hydrochloric acid (HCl) with a concentration of 37.5%, and 1 g potassium metabisulfite (K2S2O5). Samples were kept in room temperature Beraha II solution for 30–45 s.
X-ray diffraction (XRD) measurements were performed on a Rigaku SmartLab diffractometer in the Bragg–Brentano geometry with a 1D D/Tex detector. Diffractograms were evaluated with the PDXL2 program using the ICDD-2018 database.
Hardness measurement is one of the most commonly used method to detect changes in mechanical properties of metals or alloys. Any changes of the mechanical properties or the microstructure that are not resulted by the modifying chemical composition can be revealed by hardness measurement. For these investigations a Vickers indentation hardness tester was applied. The tests were performed on the polished surfaces of the specimens by a Buehler 1105 micro-hardness tester. The applied force was 4.905 N (500 gF, HV 0.5) for macro, and 0.491 N (50 gF, HV0.05) for micro hardness tests.
3. Results
3.1. DTA Results
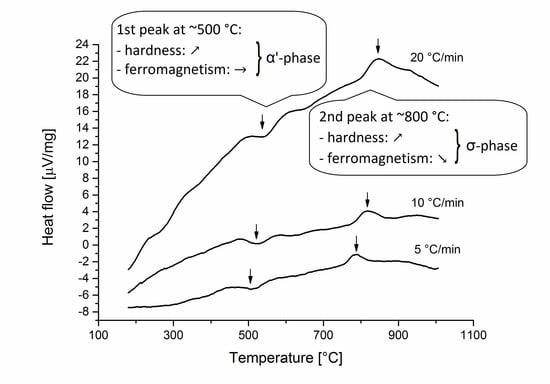
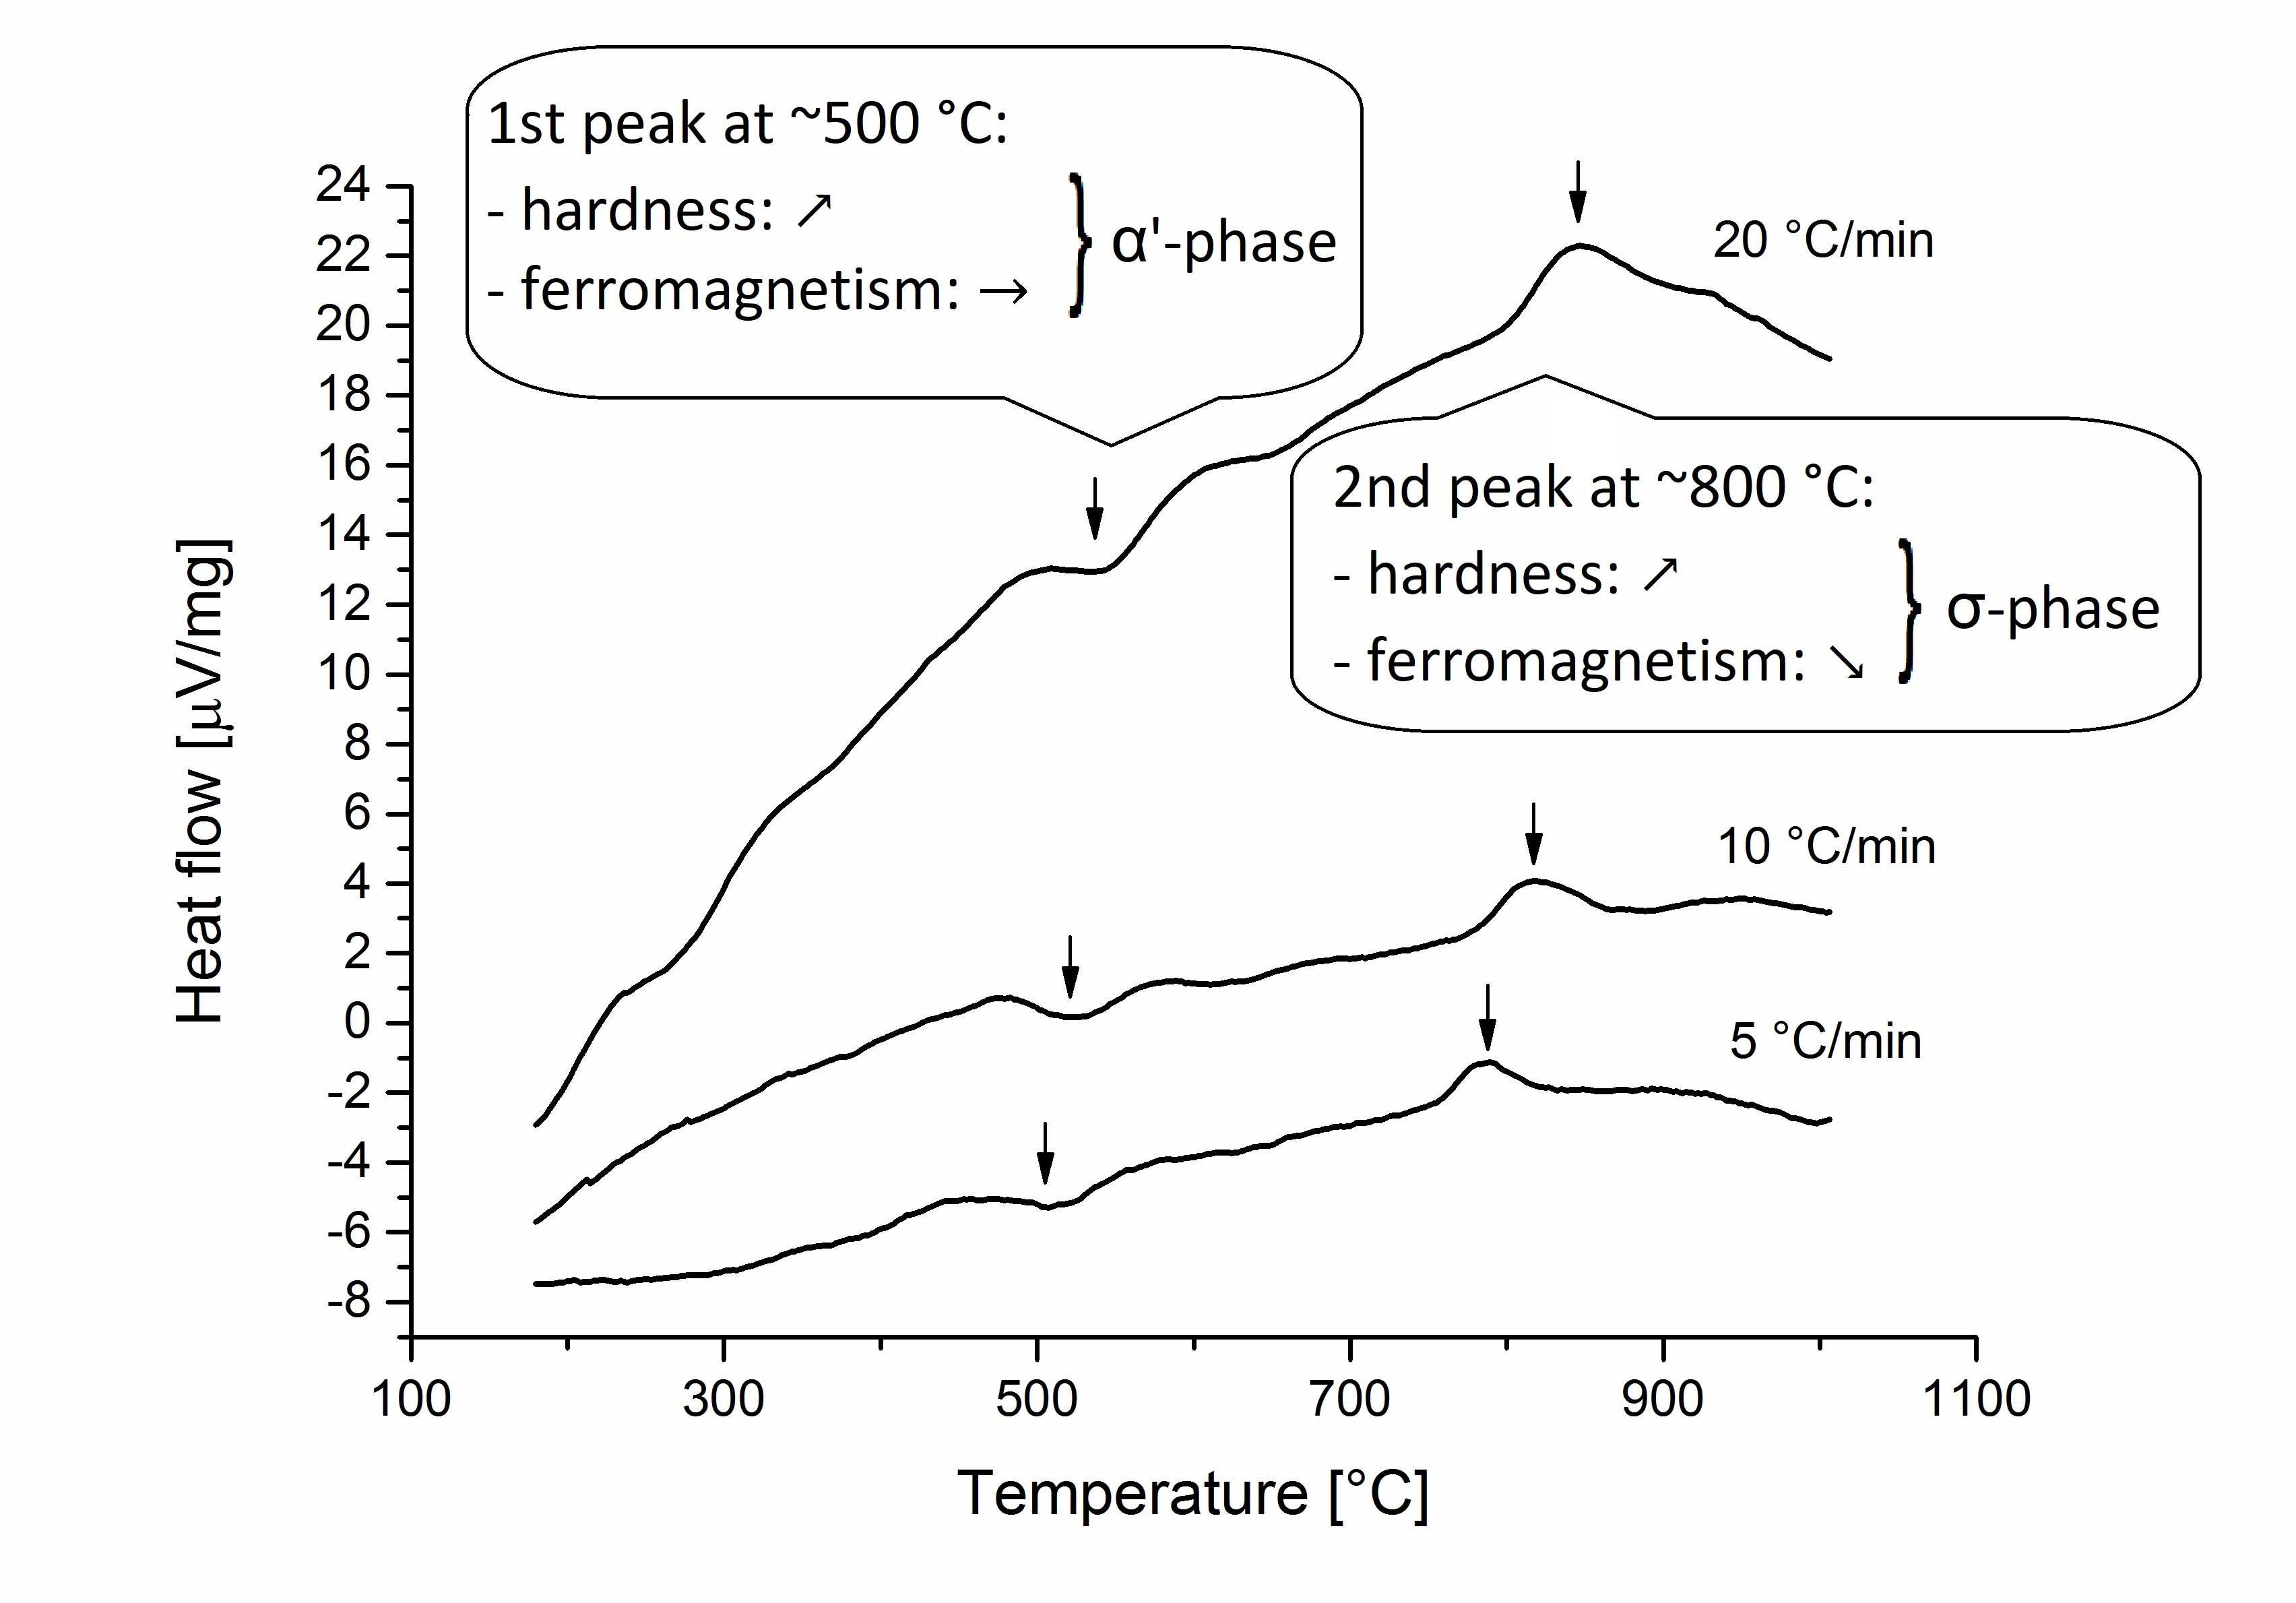
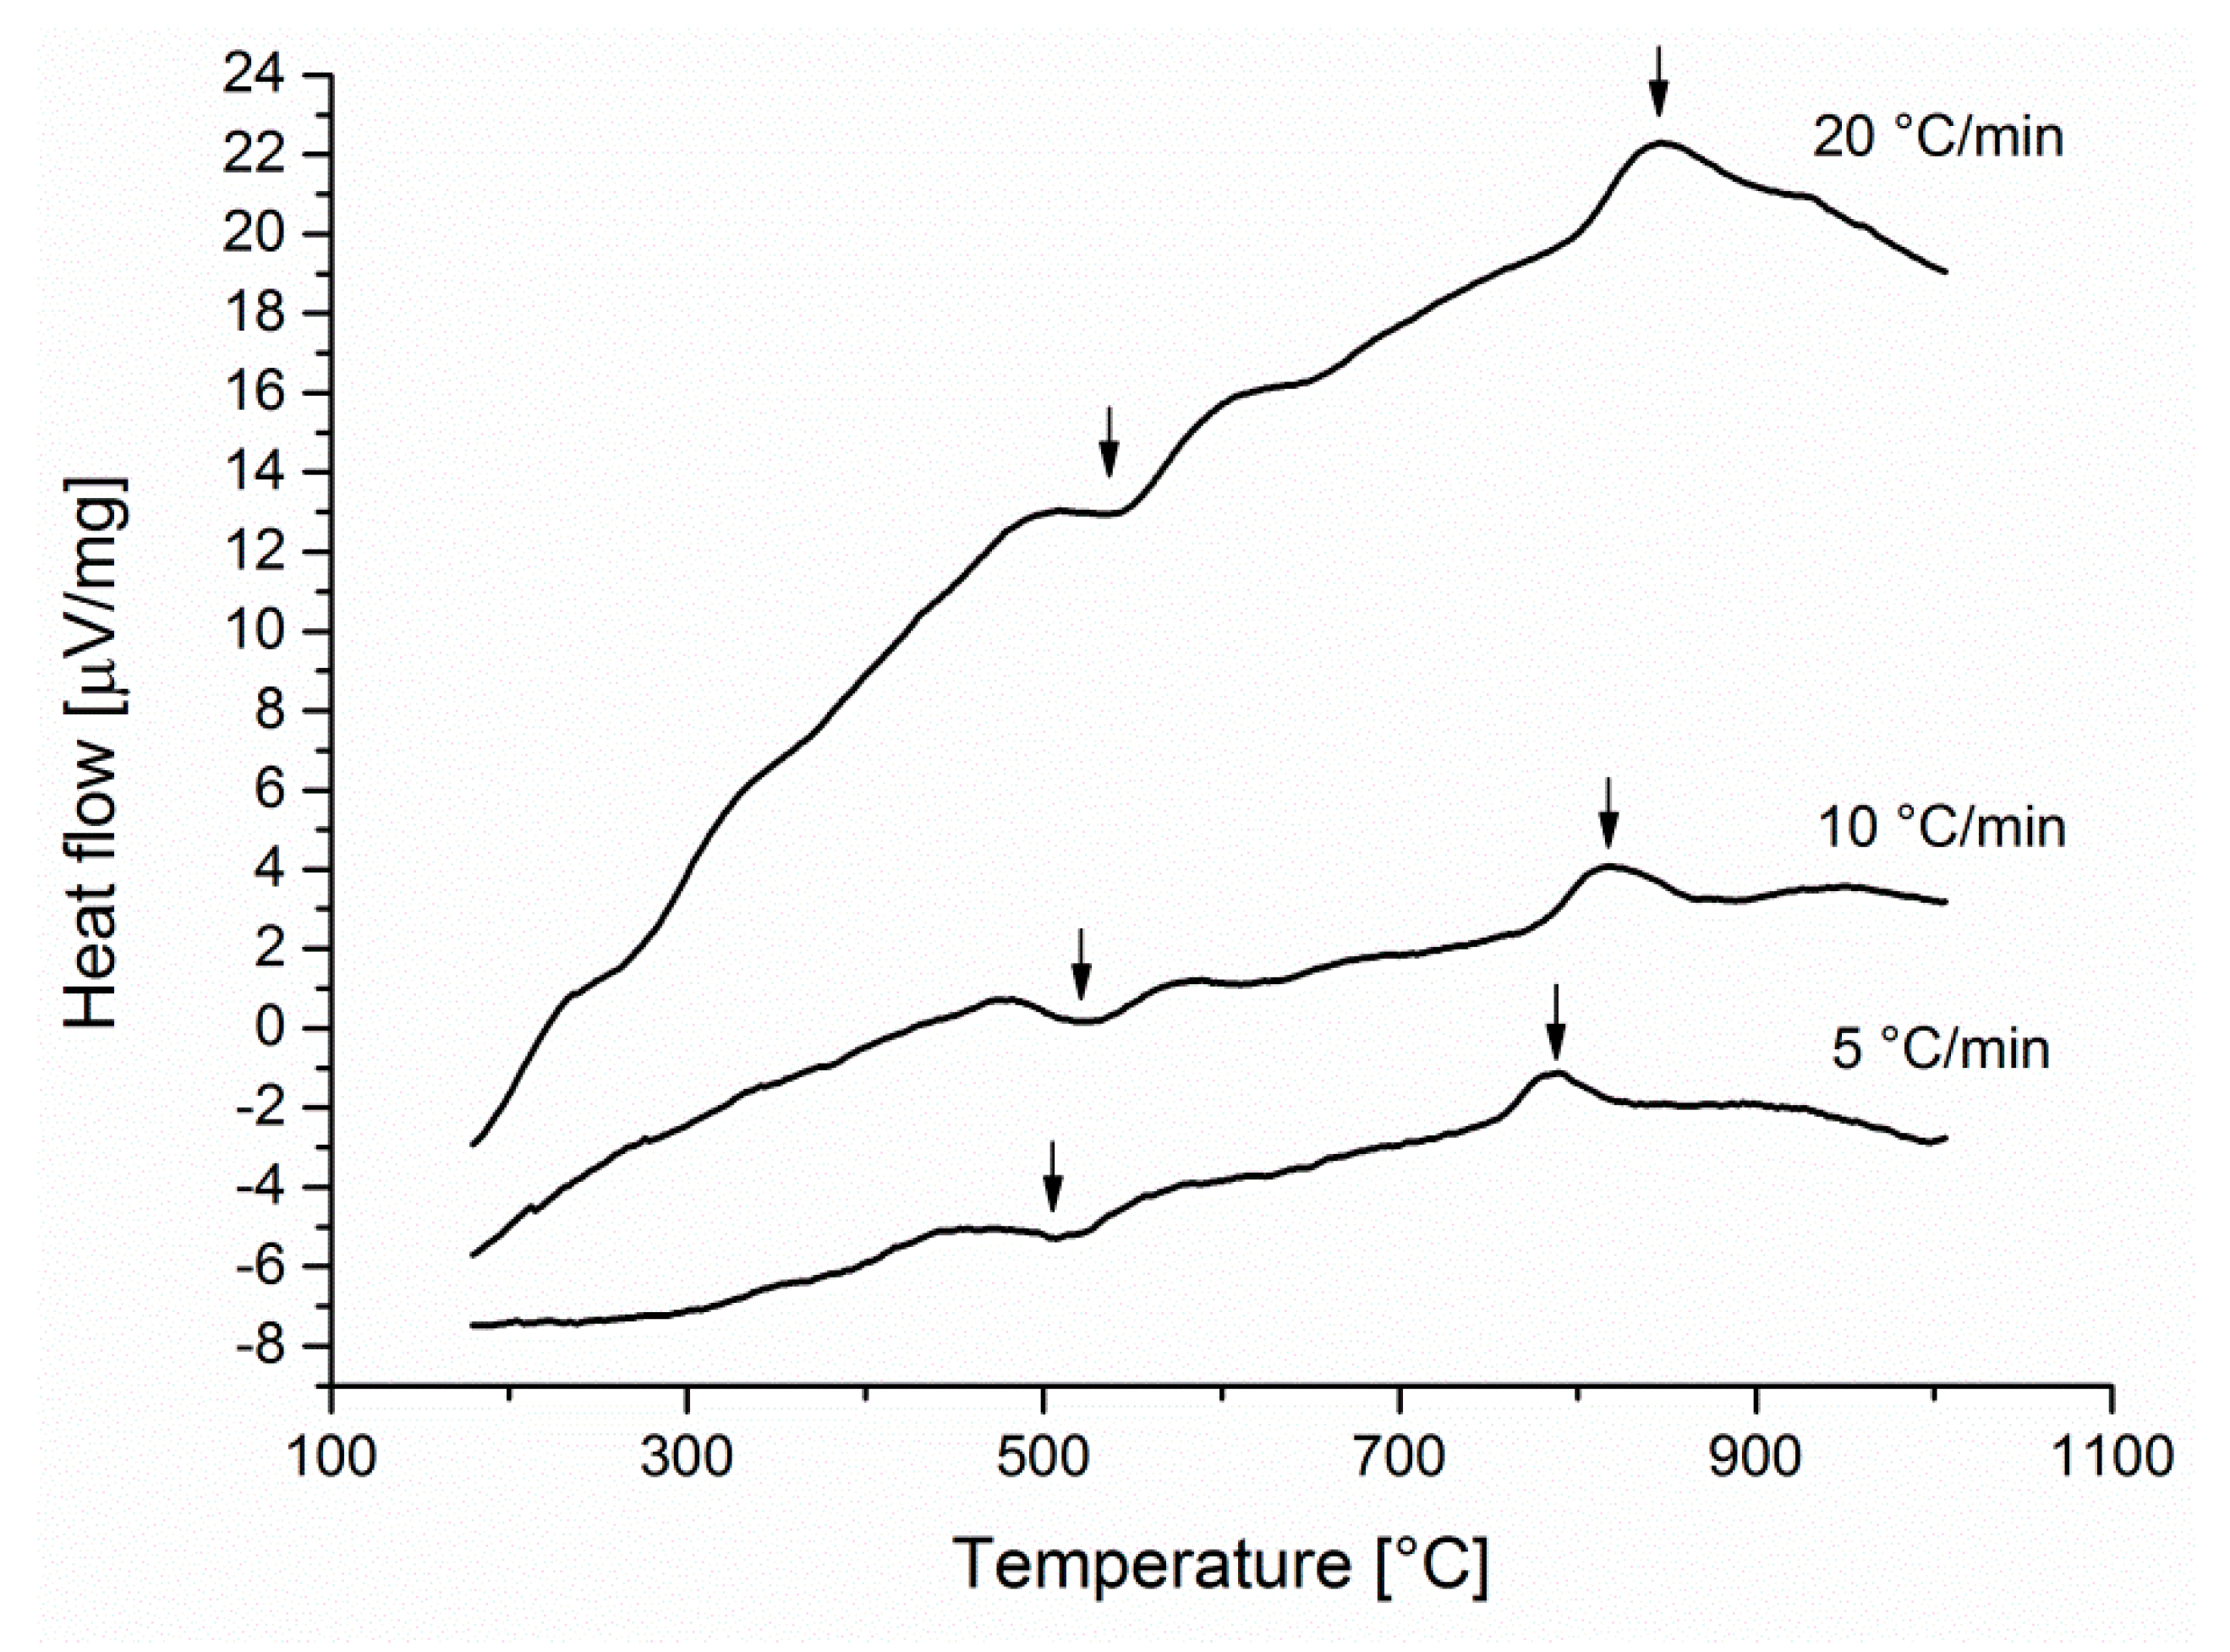
Results of DTA measurements on the cold rolled sample are shown in
Figure 2. Two reactions can be identified by them. One exothermic reaction was revealed at the temperature ~500 °C. An endothermic reaction occurred at the temperature ~800 °C. Since these peak temperatures can be found in the formation temperature ranges of the α’- and σ-phases therefore, it has been supposed that the exothermic peak on the DTA curve indicates the α’-phase formation or recrystallization, while the second peak refer the σ-phase formation.
In order to identify the phase transformations occurred at each DTA-peaks, further studies were performed. Therefore, pieces of the 60% cold worked specimen were isothermally heat treated at 500 and 800 °C, respectively, for 20 min to induce recrystallization or α’-, as well as σ-phase precipitations, then they were cooled in water. These transformations were examined by optical metallography, macro and micro hardness tests, feritscope measurements, and XRD.
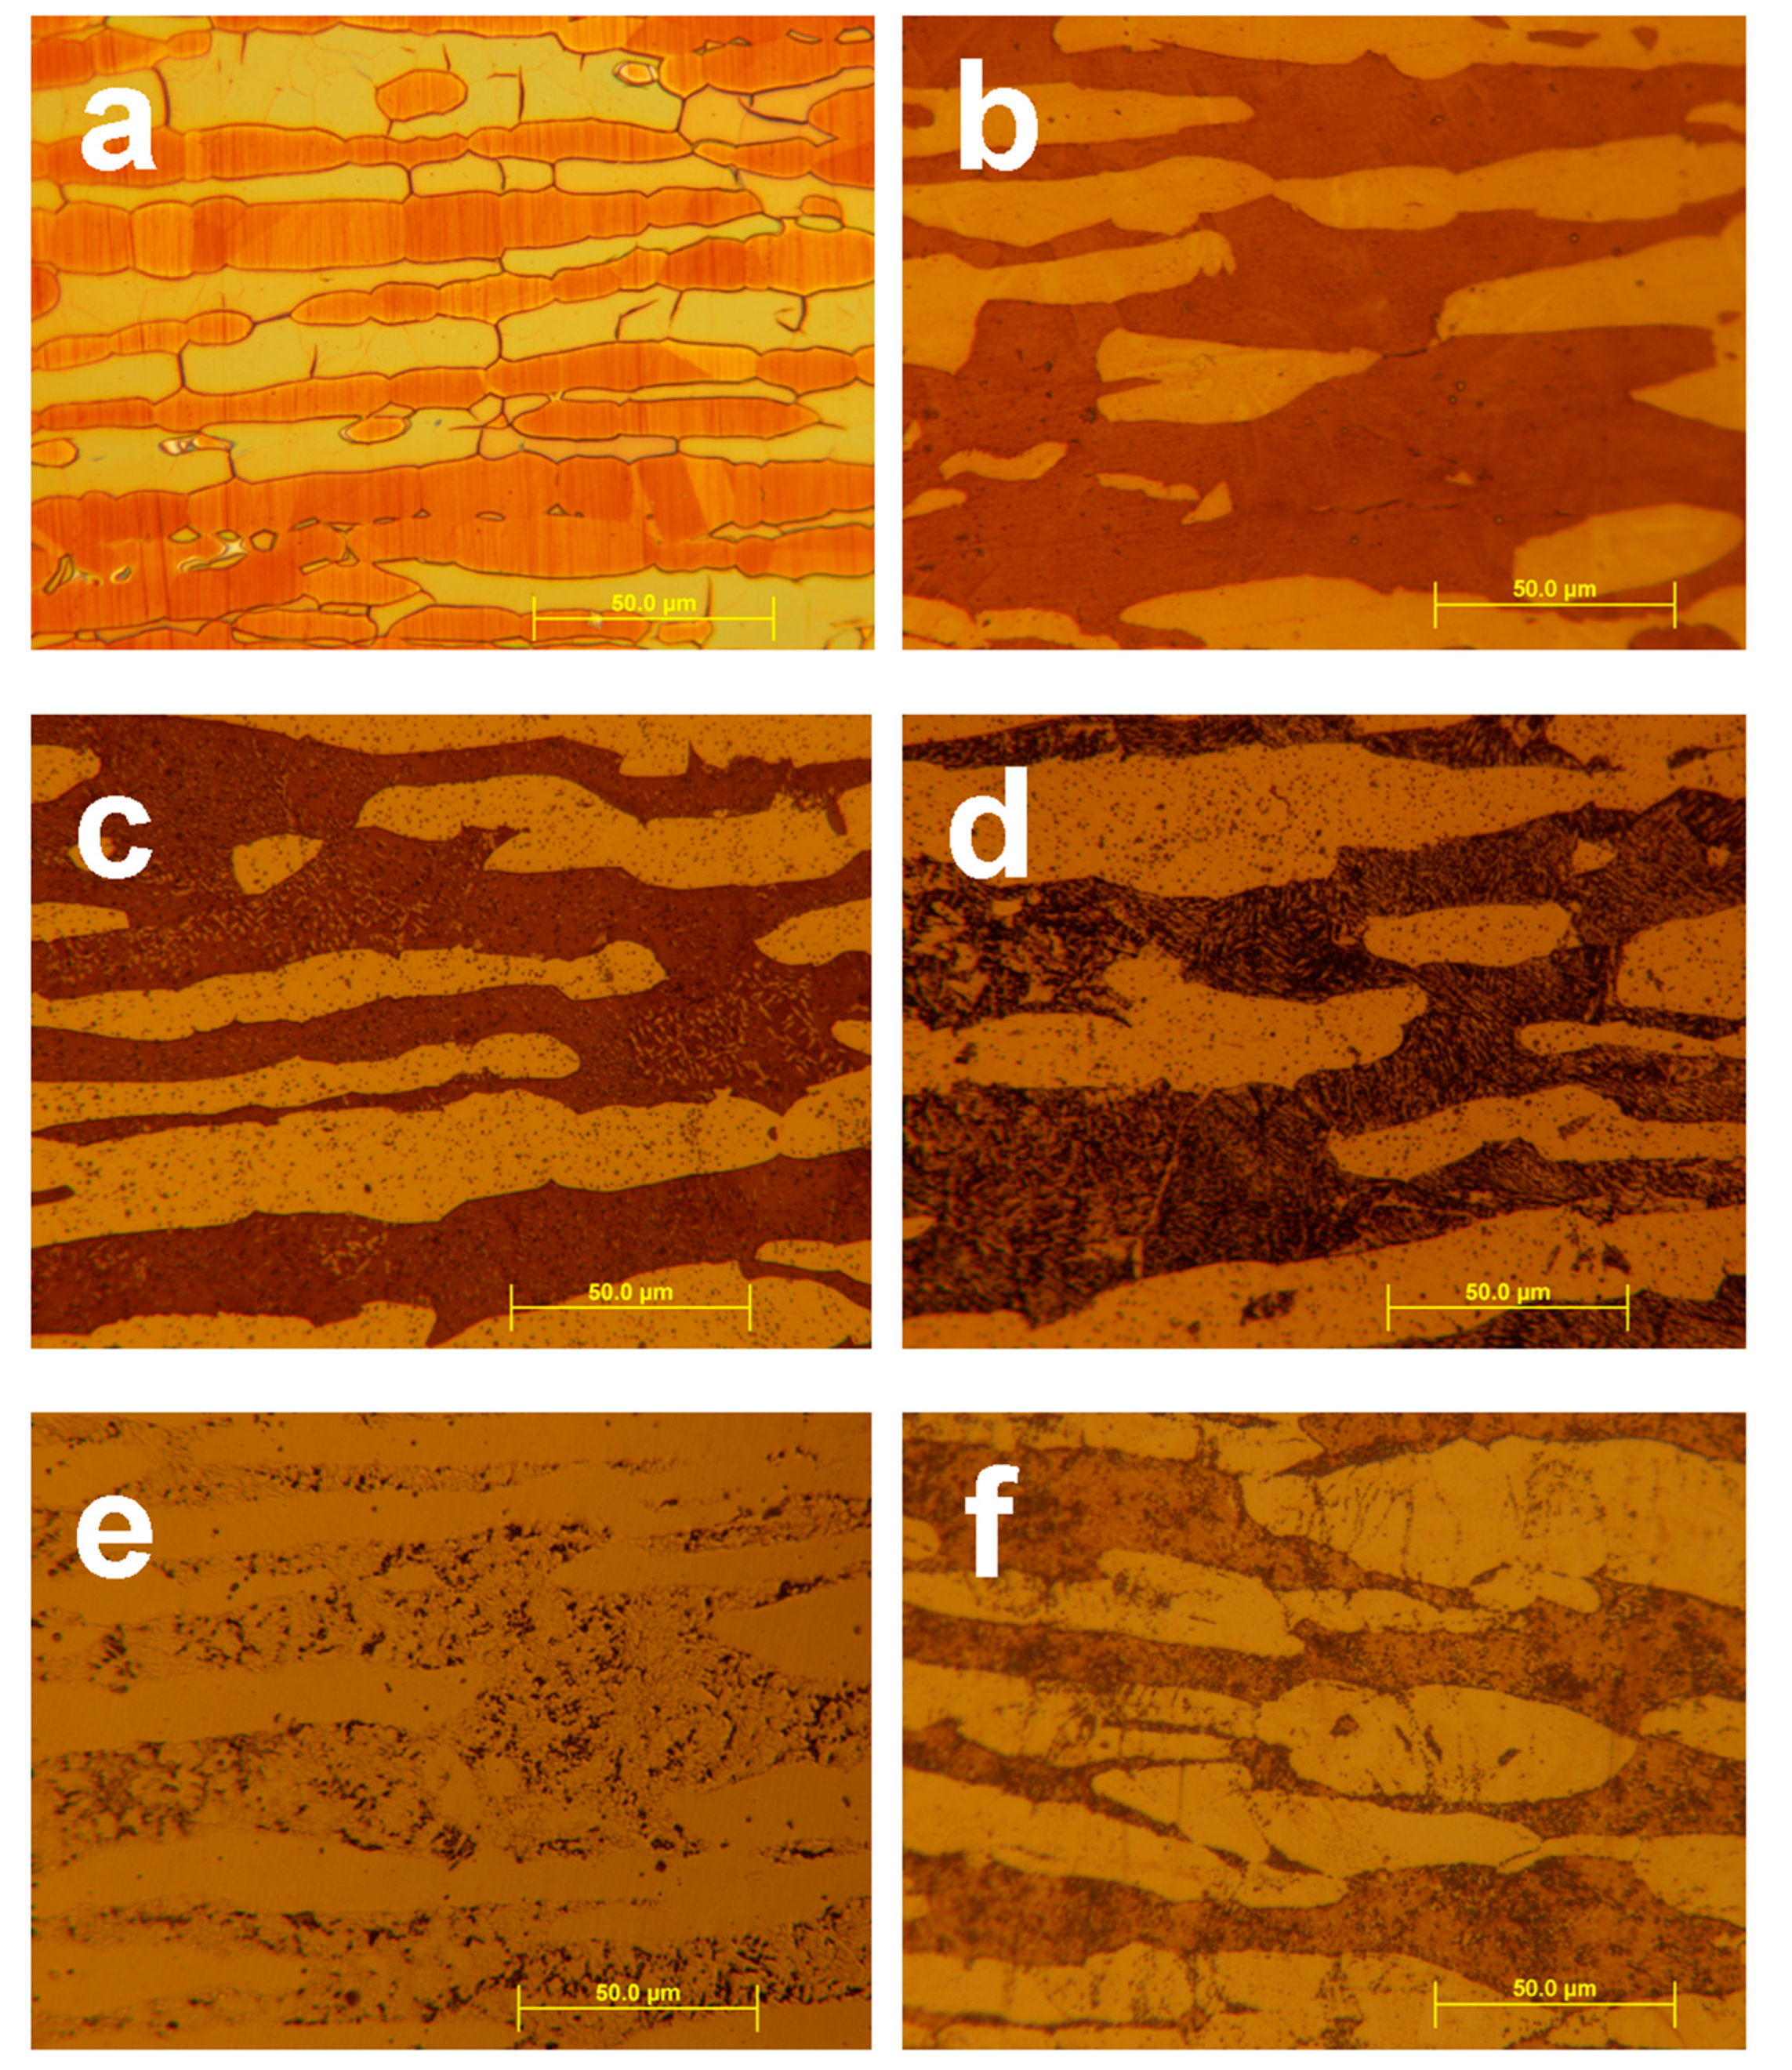
3.2. Optical Metallography
After etching, different phases in the samples can be identified. Beraha II reagent colorizes only the ferritic phase because on its surface a thin sulfide layer forms, which causes interference. Therefore, the austenitic phase remains bright. Murakami’s etchant was applied near its boiling point to reveal the ferritic and σ-phases (austenitic grains also seem to be grey), however, ferritic grains become a light reddish brown and σ-phase grains become deep reddish brown [
16]. Optical micrographs can be seen in
Figure 3.
In
Figure 3, details “a” and “b” show micrographs of the untreated sample with nearly equal (50–50%) ratio between ferrite and austenite. In the main phases of the sample cold worked at 60% then heat treated at 500°C (
Figure 3c,d) tiny black spots can be seen what seem to be other secondary phases. These spots were revealed stronger by Murakami’s than Beraha II reagent. In the sample cold worked at 60% then heat treated at 800 °C (
Figure 3e,f) ferritic phase was bitten unevenly, while the σ-phase was done evenly by Murakami’s reagent. These phases appear in similar colors. In this sample, the eutectoid-type decomposition of the ferritic phase into secondary austenite can be seen very well by etching Beraha II reagent.
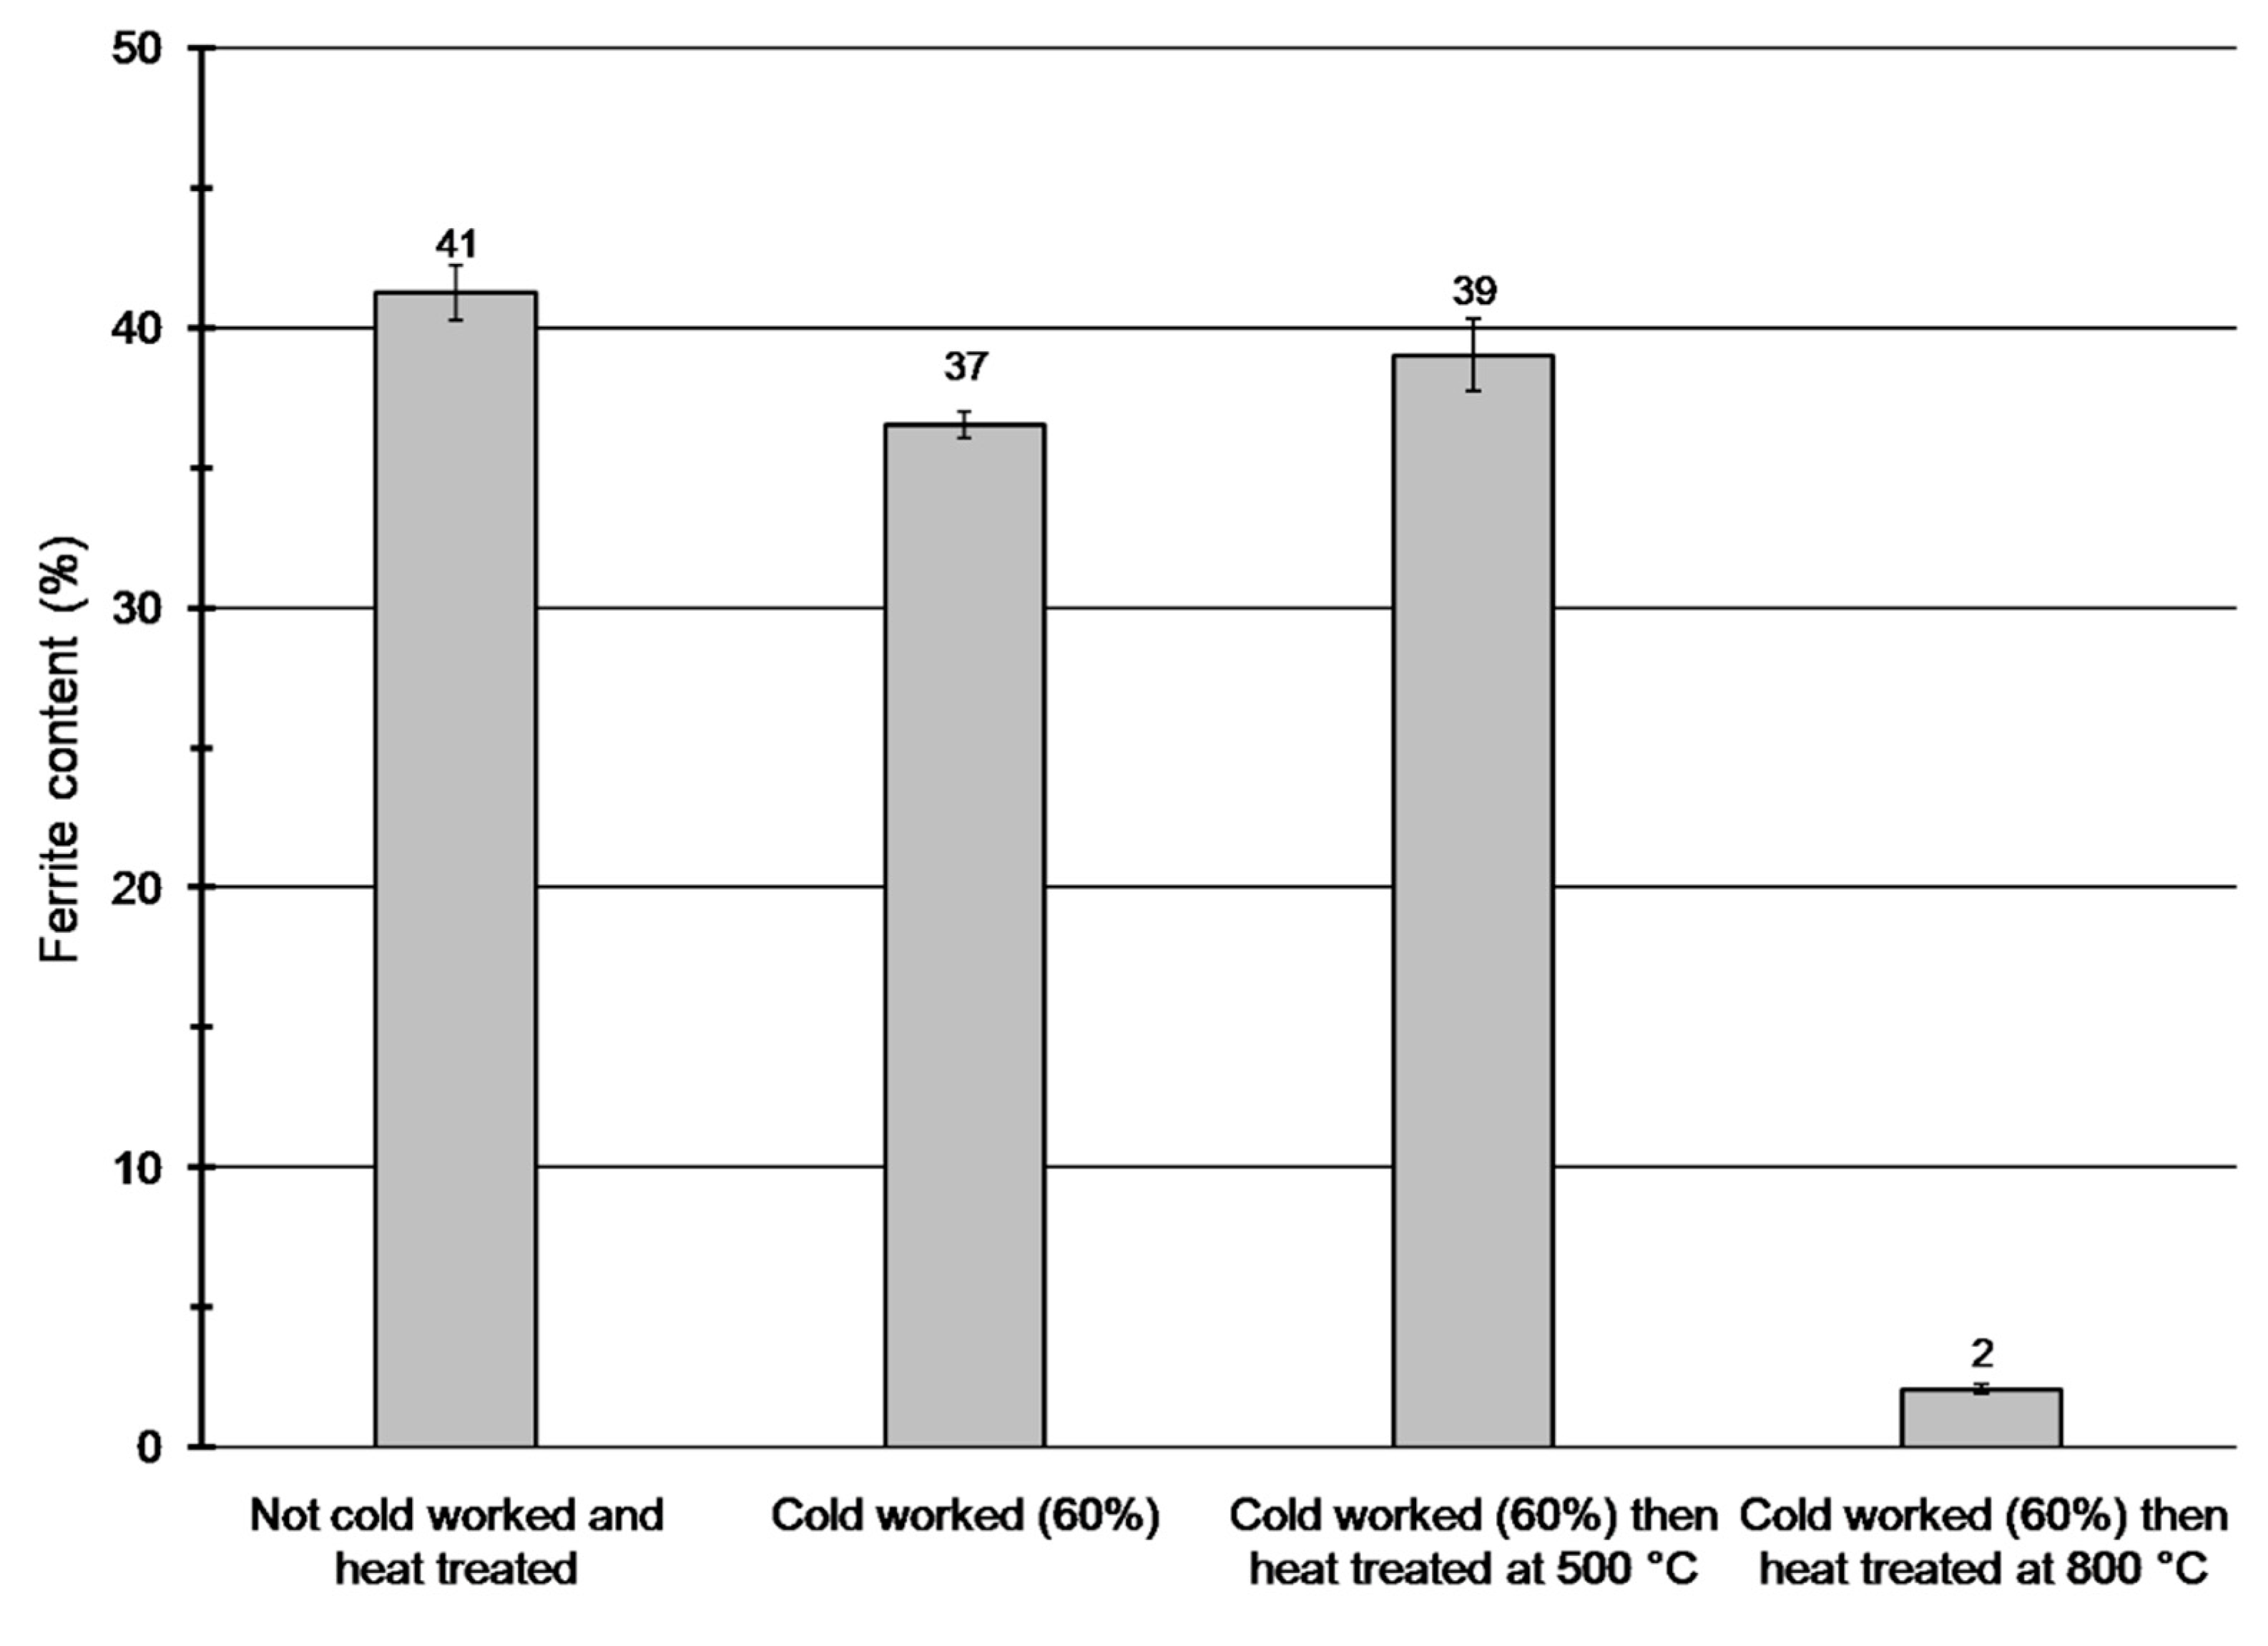
3.3. Ferrite Content Measurements
Ferrite contents of the specimens were determined by a Fischer FMP30 type feritscope. Feritscopes are useful tools for fast and non-destructive measurement of ferrite content based on magnetic induction. The samples contain significant amount of both paramagnetic (such as austenite, σ-phase) and ferromagnetic (ferrite) phases [
17,
18]. Due to the cold working and heat treatment (decomposition of the ferritic phase) their proportions can change.
Figure 4 shows the results of the feritscope measurements. These results reveal that ferrite content decreased only in the specimen heat treated at 800 °C, what is caused by the decomposition of the ferritic phase into austenitic and σ-phases. The amount of the ferromagnetic phase did not increase due to cold working, therefore SIM was not formed (at least for the BCC ferromagnetic α’-phase).
3.4. Hardness Tests
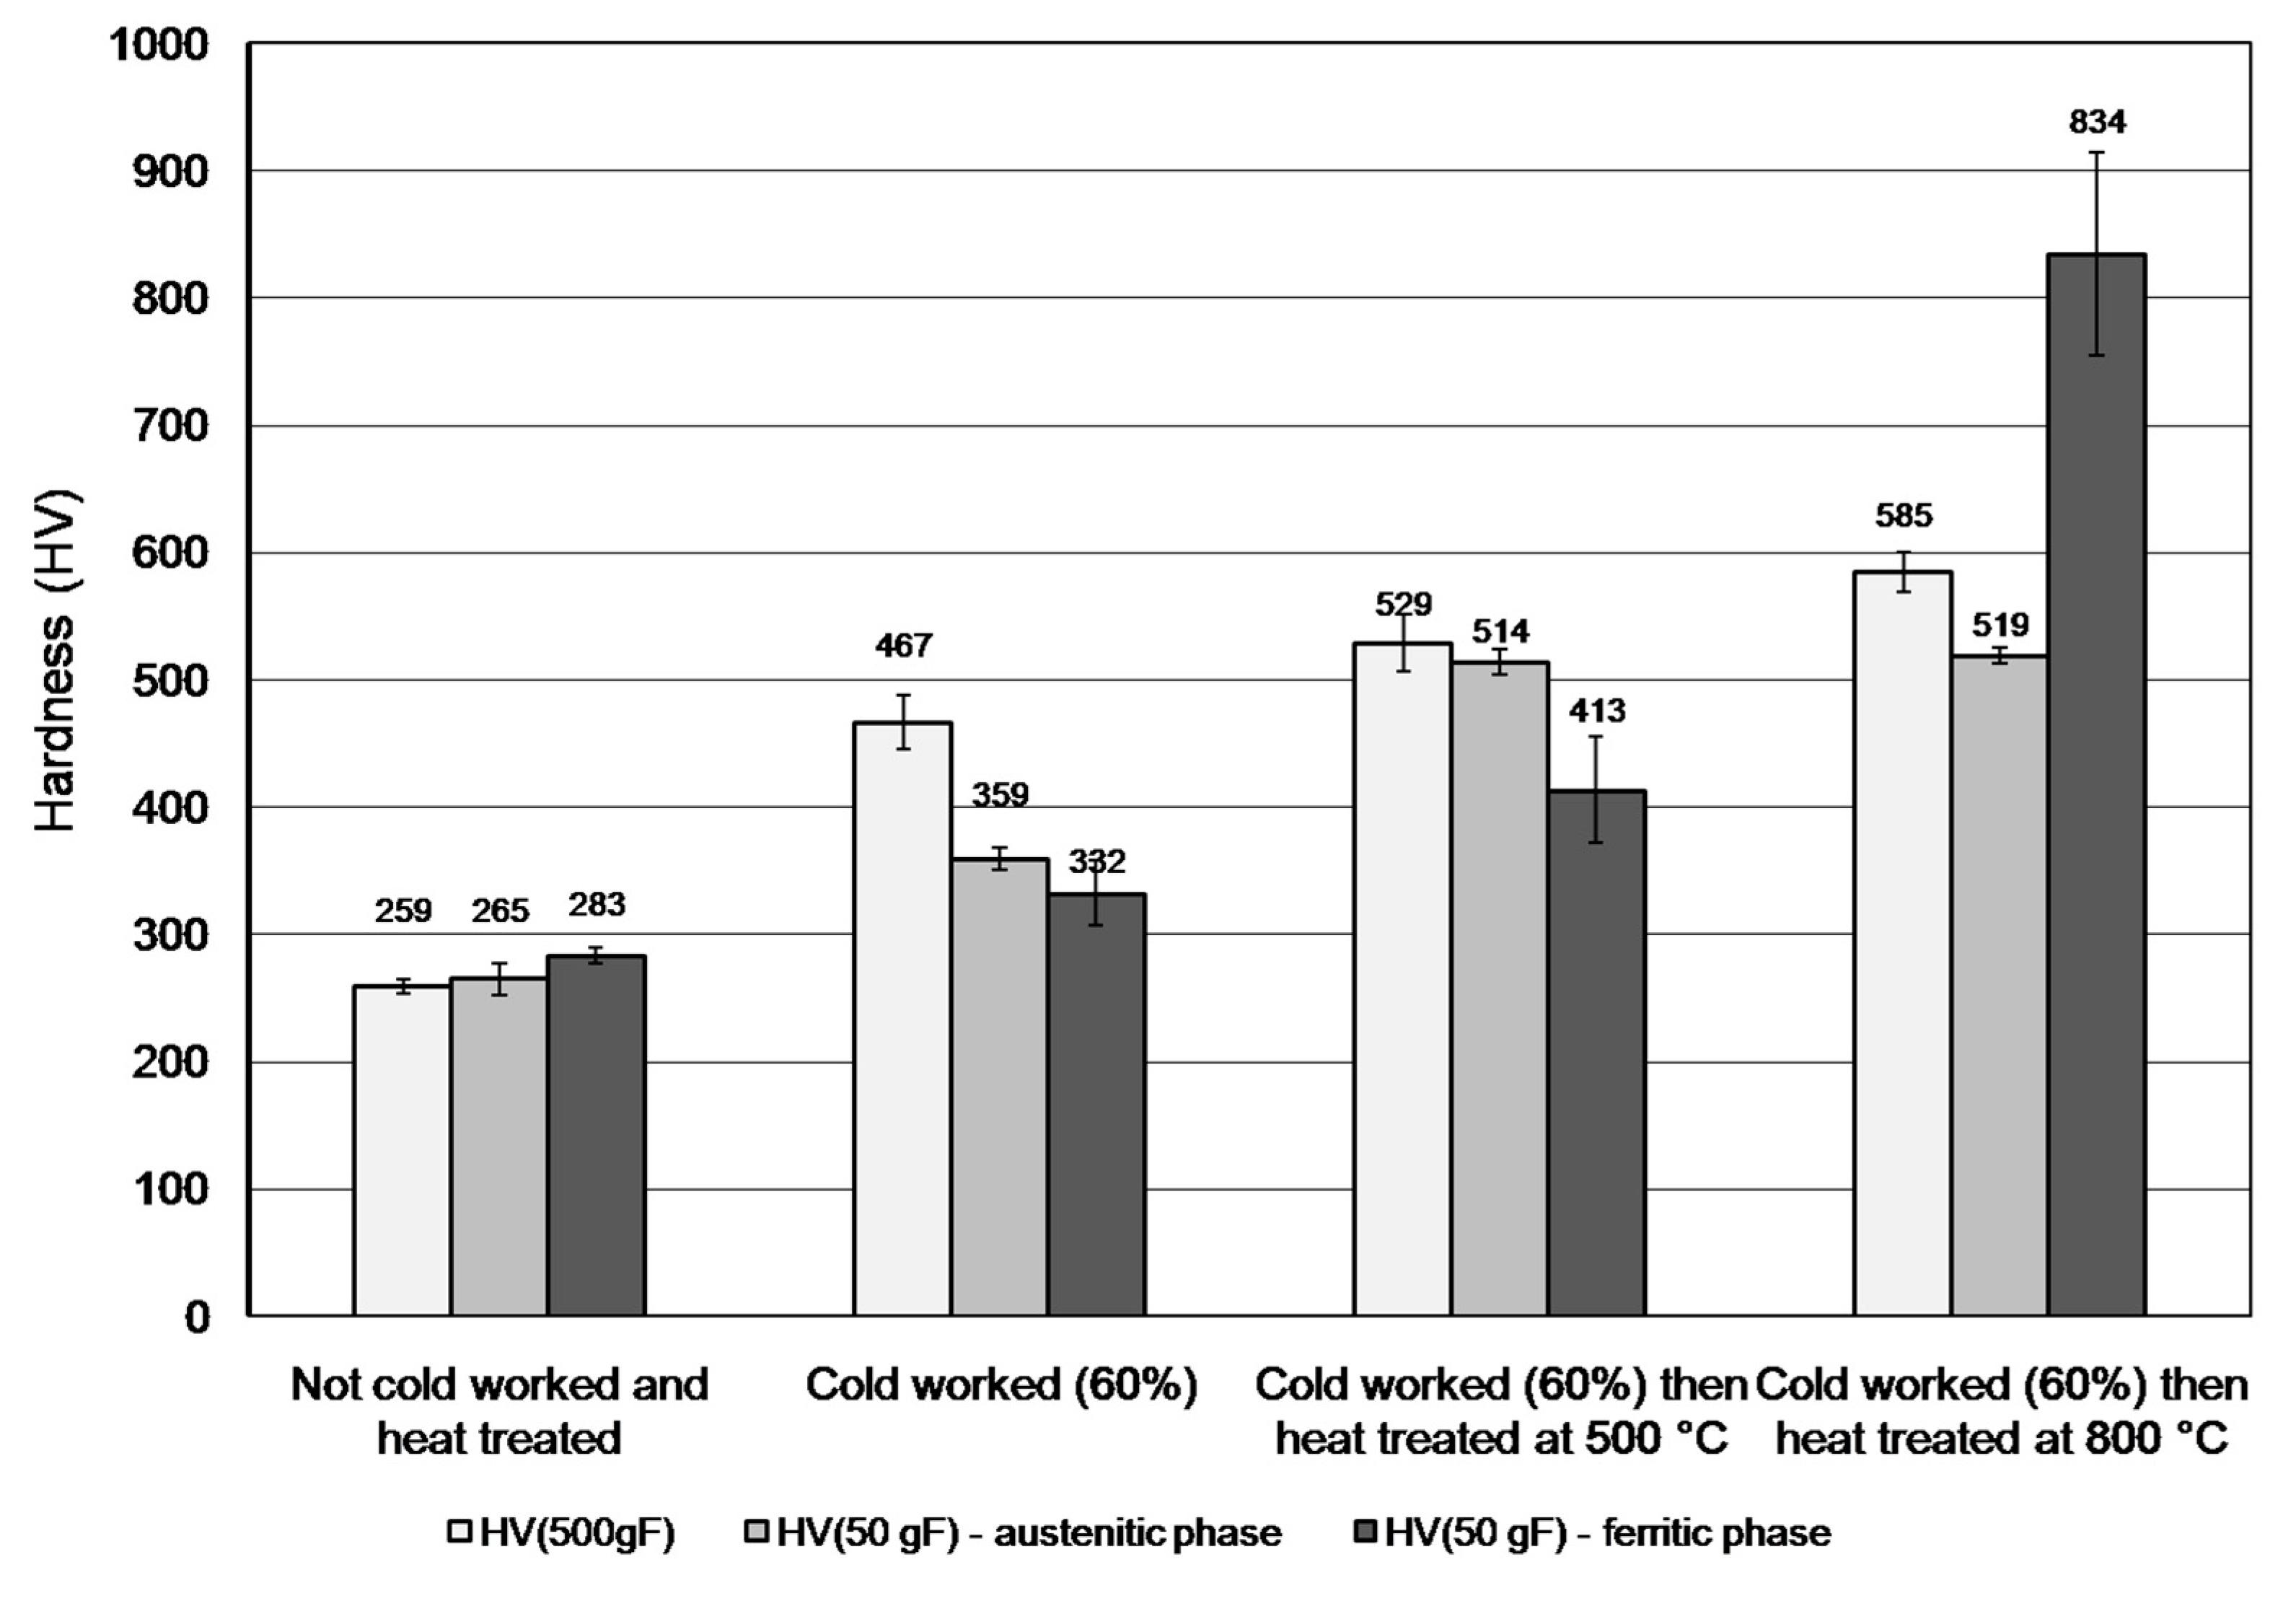
The results of the macro hardness tests (
Figure 5) show that hardness of the cold rolled sample increased due to the work hardening. The macro hardness results also show that the hardness increases with increasing temperature of the heat treatment. These results imply that these kinds of hardenings are due to the α’- and σ-phase precipitations in the specimen heat treated at 500 and 800 °C, respectively.
The micro hardness tests show nearly equal hardness in the material without cold work and heat treatment, because there is not so much deviation between the hardness of ferritic and austenitic phases. In the specimen with 60% cold deformation the hardness of austenite is slightly higher than that of the ferrite. In the specimen with 60% cold work and subjected to heat treatment at 500 °C, the hardness of austenite is much higher than the hardness of ferrite. Optical micrographs do not infer the reason of this growth in hardness, even though those tiny black spots observed both in ferrite and austenite seem to be nucleation of other phases (
Figure 3c,d). However, hardness of the ferritic phase is higher than that in the specimen with 60% cold deformation. This is due to the α’-phase formation (so called “475 °C embrittlement”), which phase cannot be seen through optical micrographs.
In the specimen with 60% cold work, then heat treated at 800 °C, the hardness of ferrite is much higher than that of austenite. This is obviously caused by formation of σ-phase islands into the ferritic-austenitic matrix, because the σ-phase is a hard and brittle precipitation with a hardness of 68 HRC(~940 HV) [
12]. However, the hardness of the austenitic phase does not change in the specimen heat to be treated at 500 °C.
3.5. X-ray Diffraction Measurements
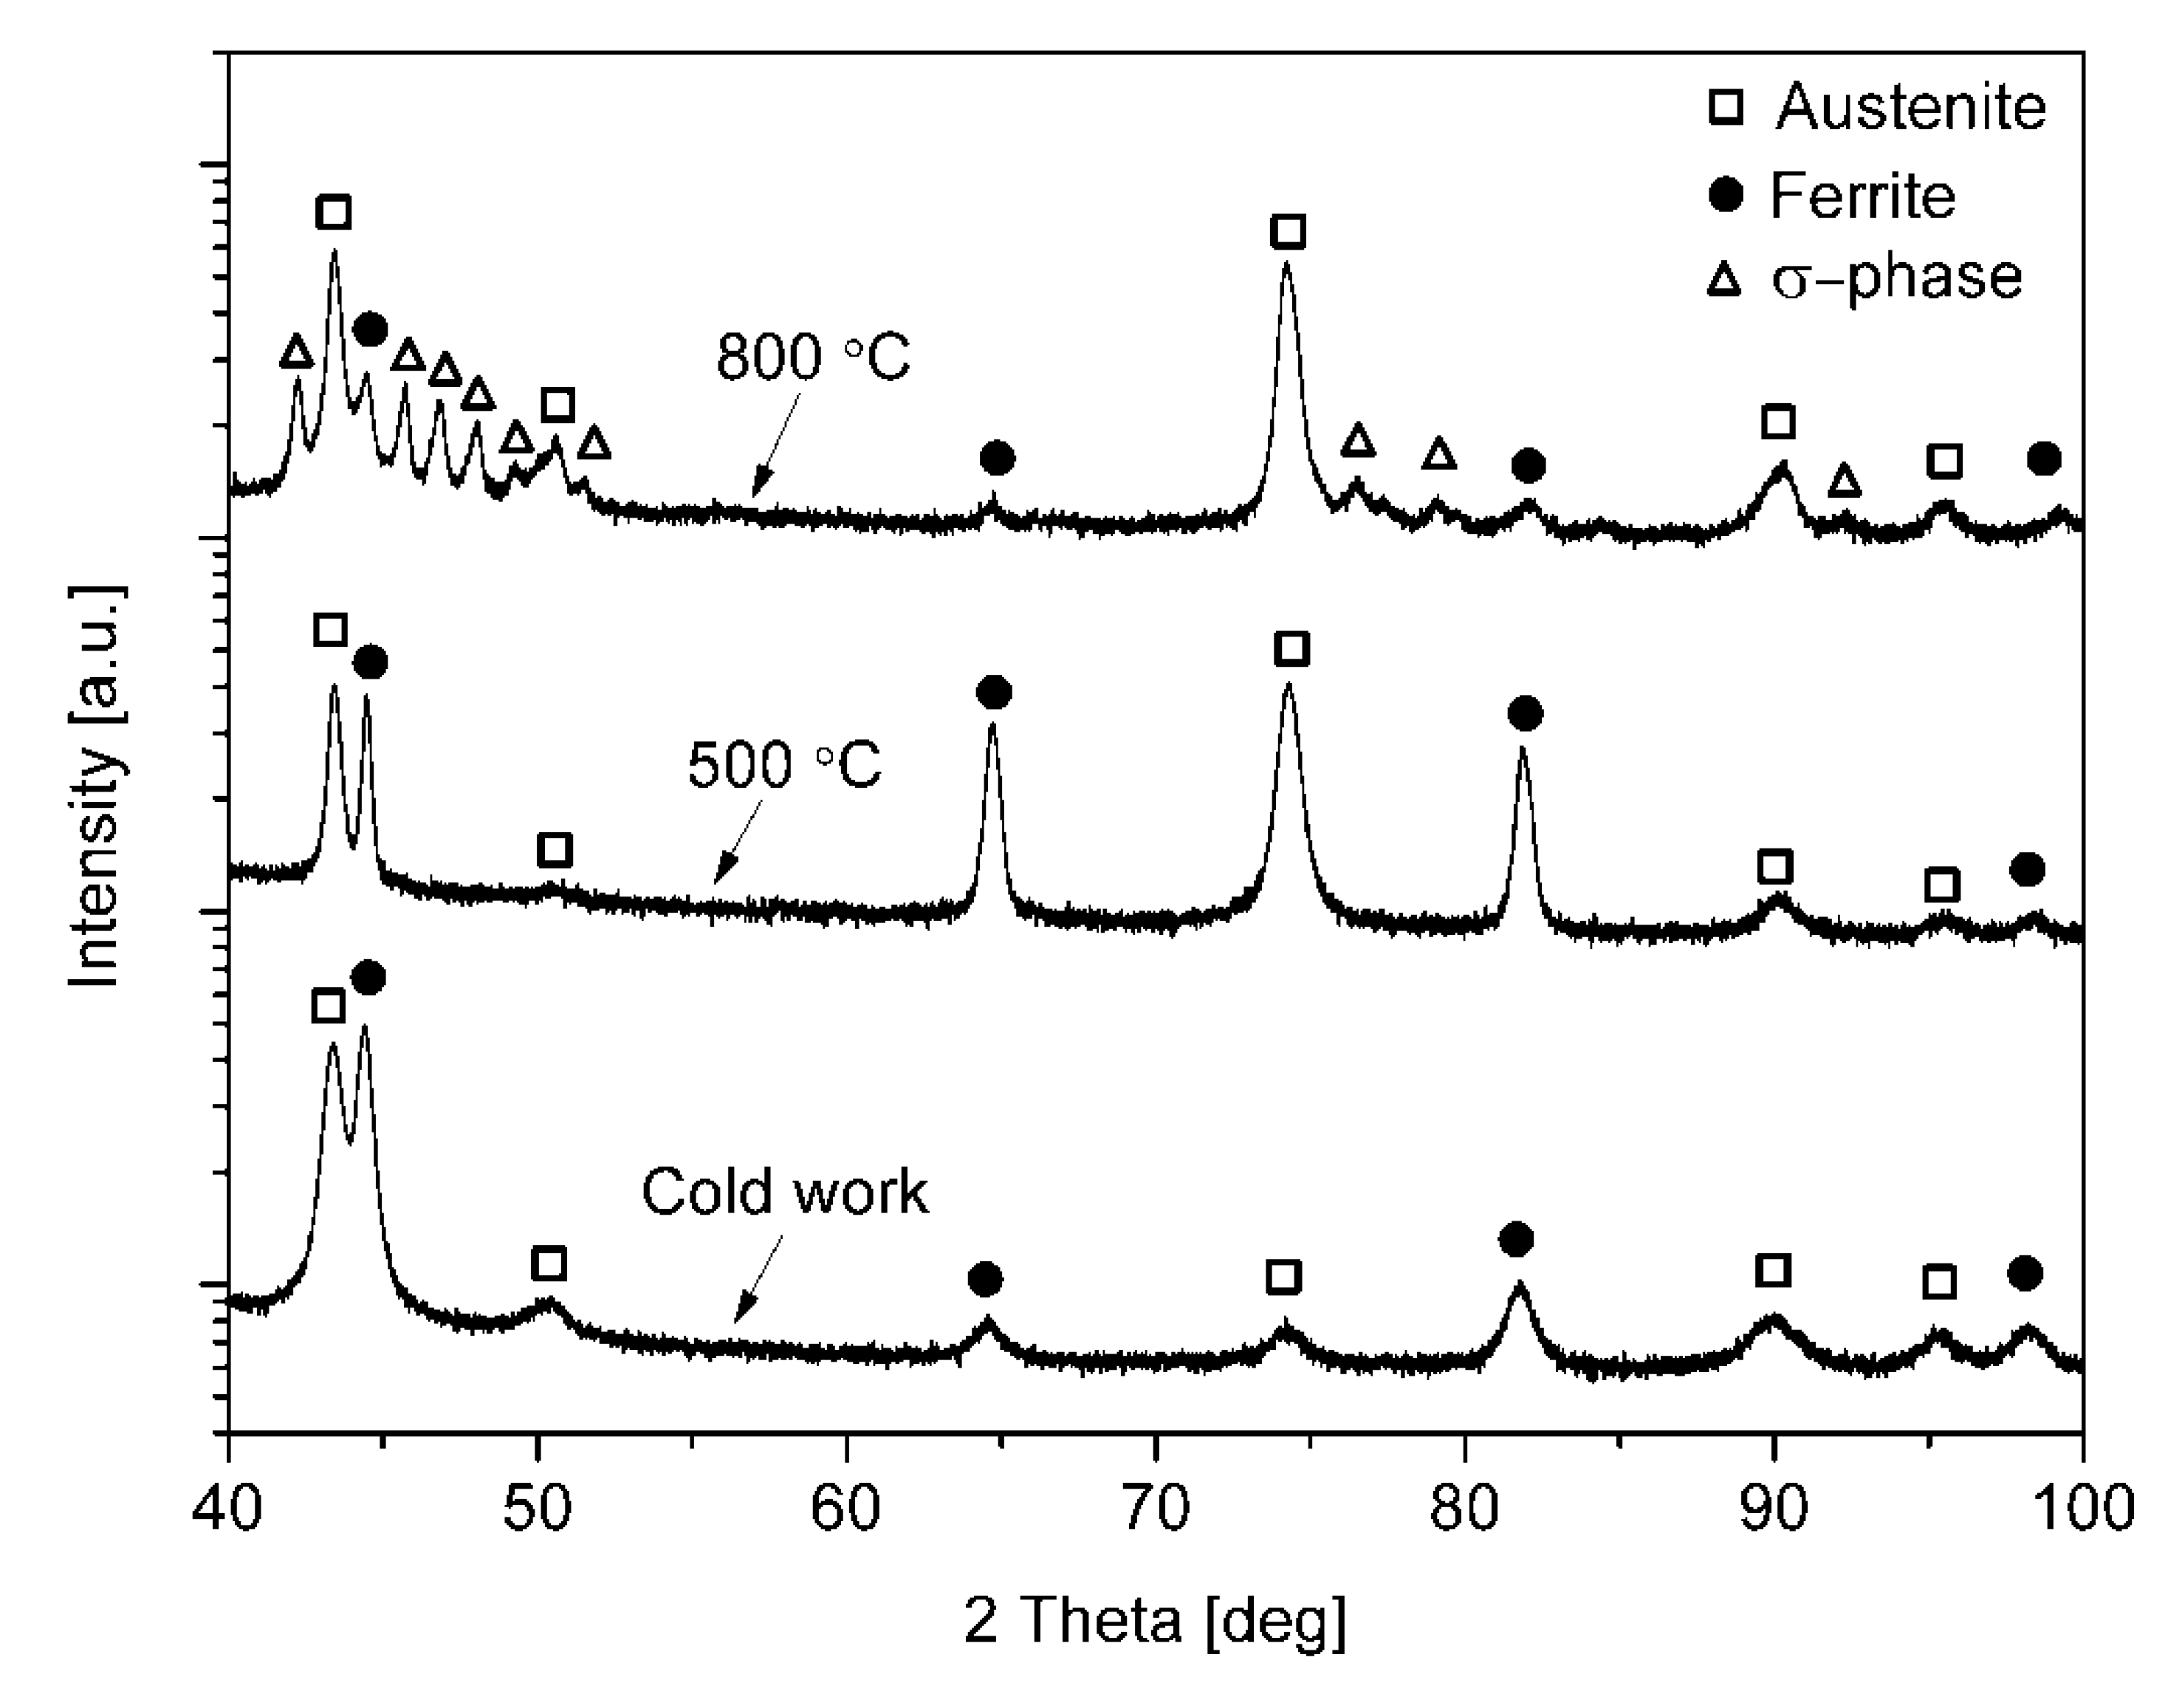
As the XRD results (
Figure 6) reveal, the specimens cold worked and heat treated at 500 °C contain only ferritic and austenitic phases. However, it should be noted that XRD cannot distinguish ferritic and α’-phases, because they have the same crystalline structures, with very similar lattice parameter [
2]. It should also be noted that heat treating at 500°C did not result in any more new phases but the intensity ratio of the peaks has changed. The intensity ratio of the 220 peak was increased most probably as a result of a weak 220 texture formation. As a consequence, this can influence the growth in the hardness of austenite in the sample heat treated at 500 °C.
In order to evaluate the intensity fraction of the different phases, the background was first subtracted, and then the areas under the diffraction peaks of the different phases were summarized in the diffraction angle range of 30°–100° (
Table 2). The changing in intensity fractions shows the changing in phase content. XRD results also reveal that the sample heat treated at 800 °C contains significant amount of σ-phase beside the ferritic and austenitic phases. The proportion of the ferritic phase is similar to the results of feritscope measurements. It can be seen that formation of the HCP SIM (ε-) phase was not detected.
3.6. Activation Energies by Kissinger Plot
Activation energies of phase transformations (primarily σ-phase formation) in stainless and other highly alloyed steels have been presented only in a few numbers of research papers in the last decades. DTA was not applied in any of them. Only one article was found in which activation energies are determined from a Kissinger plot and Kolmogorov–Johnson–Mehl–Avrami (KJMA) model based on differential scanning calorimetry (DSC) measurements [
19]. In this work, Hajra et al. obtained activation energies for σ- to α-phase transformation using the KJMA and Kissinger models in a Fe55–Cr45 alloy, they are 240–260 kJ/mol and 369 kJ/mol, respectively.
Błachowski et al. determined activation energies for σ-phase formation in a Fe53.8–Cr46.2 alloy, and found them between 197 and 260 kJ/mol with different methods [
20]. In 2205 duplex stainless steel, Ferro obtained 202 kJ/mol activation energy for σ-phase formation using his semi-empirical model [
21]. Costa et al. determined 189 kJ/mol activation energy for σ-phase formation in a strongly deformed equiatomic Fe–V alloy [
22]. These results unambiguously show that activation energies are crucially influenced by the chemical composition of alloys.
In duplex stainless steels activation energies of σ- and α’-phases have been determined in the last years. Mészáros et al. calculated activation energy for σ-phase formation in SAF 2507 type duplex stainless steel with several cold-worked conditions through the KJMA model [
23]. Results for activation energy of σ-phase formation were given between 296 and 302 kJ/mol (they decrease with increasing rate of cold working) and it was revealed that this activation energy hardly depends on the rate of cold working. Using the Kissinger method [
24] Berecz et al. obtained 261 kJ/mol activation energy for α’-phase formation and 243 kJ/mol for σ-phase formation for a SAF 2507 type duplex stainless steel which was not cold-worked. These results show that activation energies practically do not depend on the rate of cold working.
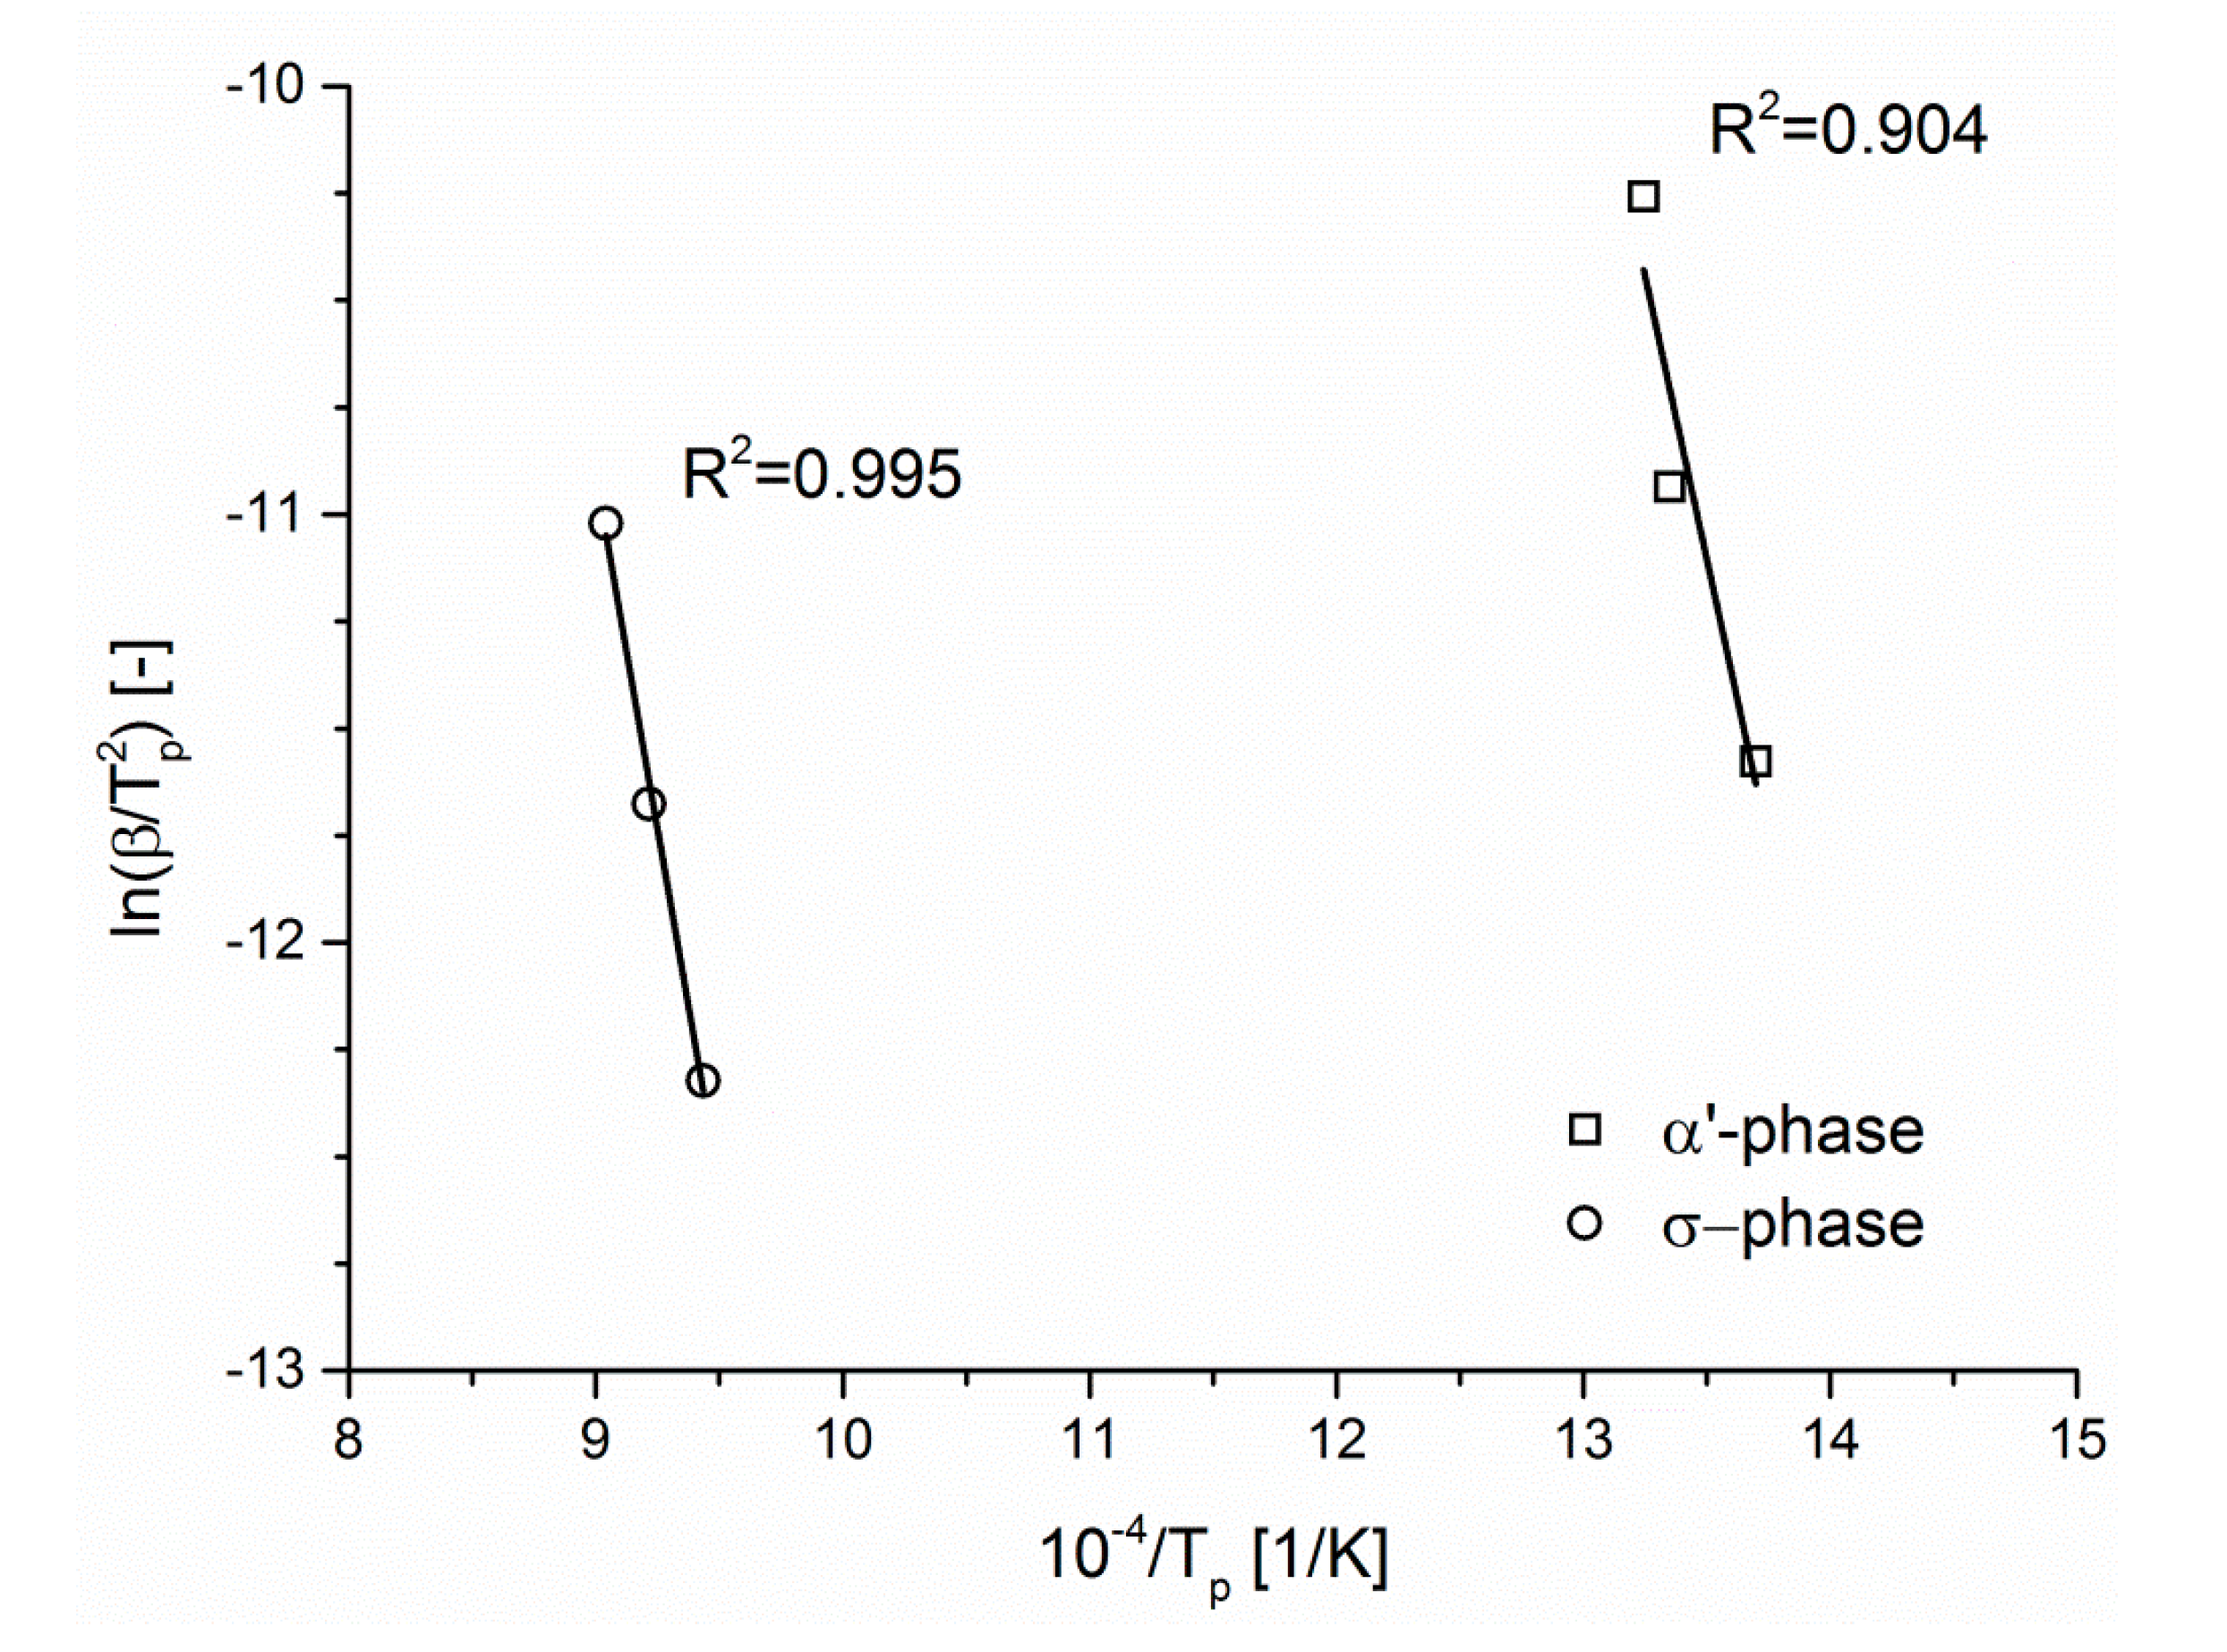
DTA measurements with different heating rates allow to calculate the activation energies of solid state phase transformations from the Kissinger plot [
25,
26], because the higher the heating rate is, the greater the peak temperatures are shifting away (as it can be seen very well on
Figure 2). According to the well-known Kissinger equation:
where β is the heating rate (dT/dt), T
p is the temperature of peaks, E
a is the activation energy, R is the gas constant (8.31 J/mol K), and A is a constant. Activation energy is obtained from the slope of the plot ln(β/T
p2) versus 1/T
p. It can be seen that results of DTA measurements depend on the applied heating rates through the shift of peak temperatures mentioned above.
The slopes of these plotted lines (
Figure 7) allow us to estimate that the activation energies for transformations of the ferritic phases into α’- and σ-phases are 220 and 275 kJ/mol, respectively. This value for activation energy of σ-phase formation is in good agreement with other outcomes found in the literature.
4. Discussion
Formation of α’- and σ-phases were revealed by DTA measurements: the presence of both would cause failure problems in DSS components through deterioration of corrosion resistance and toughness after a certain amount of thermal exposure. Activation energies obtained for the formation of σ- and α’-phases are close to the activation energy of Cr diffusion in ferrite for lattice diffusion (241 kJ/mol) [
27] and for grain boundary diffusion (218 kJ/mol) [
28,
29], respectively. However, the activation energy for α’-phase formation is lower than the activation energy of Cr diffusion in the austenitic phase (~293 kJ/mol) [
29]. Therefore, it can be established that the formation of the α’-phase is mostly affected by the Cr diffusion within the ferritic phase forming Cr-rich and Cr-depleted zones through spinodal decomposition. The activation energy of Mo diffusion in the ferritic phase is higher than that of Cr diffusion (282.6 kJ/mol) [
30,
31]. It can imply that diffusion of Mo—beside diffusion of Cr—can be assumed as the other thermally activated process what occurs during σ-formation, as a eutectoid-type decomposition. The processes of formation of the α’-phase, and nucleation and growth of the σ-phase are driven by diffusion and these are based mainly on the diffusion of Cr and Mo atoms in the ferritic phase. The effect of cold working on the activation energies of σ- and α’-phases cannot be revealed by comparing the activation energies obtained in not cold worked SAF 2507 type duplex stainless steel [
24]. This is also confirmed by results of Mészáros et al. [
23], therefore it can be stated that cold working has negligible effect on the activation energies of both deleterious secondary phases. However, previous cold working has influence on the δ-ferrite decomposition process according to Mészáros et al. [
23], and thereby the α-ferrite decomposition process also can be affected by it.
5. Conclusions
Thermally induced deterioration processes were studied in previously cold worked SAF 2507 type duplex stainless steel using DTA, optical microscopy, hardness tests, XRD, and feritscope measurements.
- (1)
DTA analysis of 60% cold worked duplex stainless steel sample revealed two phase transformations at ~500 °C and at ~800 °C. They were identified by hardness tests and XRD measurements as α’-phase formation (at ~500 °C) and σ-phase formation (at ~800 °C). Formation of SIM and recrystallization were not experienced until 1000 °C.
- (2)
Activation energies of these transformations were determined by using the Kissinger plot. They are 220 kJ/mol for α’-phase formation and 275 kJ/mol for σ-phase formation, in good agreement with the values found in the literature.
- (3)
These activation energies indicate that diffusions of Cr and Mo are probably the major thermally activated processes concerning these phase transformations.
- (4)
The effect of cold working on the activation energies and formation of σ- and α’-phases cannot be revealed.
Author Contributions
Conceptualization, T.B., É.F. and E.R.F.; methodology, É.F. and T.B.; software, P.J.; validation, P.J.; investigation, J.E.M.; writing—original draft preparation, J.E.M.; writing—review and editing, T.B.; supervision, P.J. All authors have read and agreed to the published version of the manuscript.
Funding
The research reported in this paper was supported by the BME Nanotechnology and Materials Science TKP2020 IE grant (BME IE-NAT TKP2020), by the BME NC TKP2020 grant, OTKA grant number K 124926 funded by National Research, Development and Innovation Office—NKFIH. This research was also supported by the JánosBolyai Research Scholarship of the Hungarian Academy of Sciences, grant number: BO/00821/20/6 and BO/00292/19/11. This work was partially completed in the ELTE Institutional Excellence Program (1783-3/2018/FEKUTSRAT) supported by the Hungarian Ministry of Human Capacities.
Acknowledgments
The authors express their thanks to András Éva, Miklós Prodán for their useful remarks, and to Nikolett Pálfi BSc student for her work in laboratory.
Conflicts of Interest
The authors declare no conflict of interest.
References
- Alvarez-Armas, I. Duplex stainless steels: Brief history and some recent alloys. Recent Pat. Mech. Eng. 2008, 1, 51–57. [Google Scholar] [CrossRef]
- Gunn, R.N. Duplex Stainless Steels; Abington Publishing: Cambridge, UK, 1997. [Google Scholar]
- Kashiwar, A.; PhaniVennela, N.; Kamath, S.L.; Khatirkar, R.K. Effect of solution annealing temperature on precipitation in 2205 duplex stainless steel. Mater. Charact. 2012, 74, 55–63. [Google Scholar] [CrossRef]
- Akisanya, A.R.; Obi, U.; Renton, N.C. Effect of ageing on phase evolution and mechanical properties of a high tungsten super-duplex stainless steel. Mat. Sci. Eng. A-Struct. 2012, 535, 281–289. [Google Scholar] [CrossRef] [Green Version]
- Yang, Y.H.; Yan, B.; Wang, J.; Yin, J.L. The influence of solution treatment temperature on microstructure and corrosion behavior of high temperature ageing in 25% Cr duplex stainless steel. J. Alloys Compd. 2011, 509, 8870–8879. [Google Scholar] [CrossRef]
- Danoix, F.; Auger, P.; Blavette, D. Hardening of aged duplex stainless steels by spinodal decomposition. Microsc. Microanal. 2004, 10, 349–354. [Google Scholar] [CrossRef]
- Dobránszky, J.; Szabó, P.J. EDS-analysis of intermetallic precipitation in thermally aged SAF 2507 type superduplex stainless steel. Mater. Sci. Forum 2003, 414, 189–194. [Google Scholar]
- Dobránszky, J.; Ginsztler, J. Microstructural stability of duplex stainless steel weldments. Mater. Sci. Forum 2007, 561, 2119–2122. [Google Scholar]
- Varbai, B.; Pickle, T.; Májlinger, K. Development and comparison of quantitative phase analysis for duplex stainless steel weld. Period. Polytech. Mech. 2018, 62, 247–253. [Google Scholar] [CrossRef]
- de Farias Azevedo, C.R.; Boschetti Pereira, H.; Wolyneca, S.; Padilha, A.F. An overview of the recurrent failures of duplex stainless steels. Eng. Fail. Anal. 2019, 97, 161–188. [Google Scholar] [CrossRef]
- Badji, R.; Bouabdallah, M.; Bacroix, B.; Kahloun, C.; Belkessa, B.; Maza, H. Phase transformation and mechanical behavior in annealed 2205 duplex stainless steel welds. Mater. Charact. 2008, 59, 447–453. [Google Scholar] [CrossRef]
- Hall, E.O.; Algie, S.H. The sigma phase. Metall. Rev. 1966, 11, 61–88. [Google Scholar] [CrossRef]
- Calliari, I.; Bassani, P.; Brunelli, K.; Breda, M.; Ramous, E. Effect of continuous cooling on secondary phase precipitation in the super duplex stainless steel ZERON-100. J. Mater. Eng. Perform. 2013, 22, 3860–3866. [Google Scholar] [CrossRef]
- Calliari, I.; Zanesco, M.; Ramous, E.; Bassani, P. Effects of isothermal ageing and continuous cooling after solubilization in a duplex stainless steel. J. Mater. Eng. Perform. 2007, 16, 109–112. [Google Scholar] [CrossRef]
- Breda, M.; Ramous, E.; Almanza, E.; Calliari, I. Strain-induced martensite detection methods in cold-rolled duplex stainless steels. Mater. Perform. Charact. 2017, 3, 437–455. [Google Scholar] [CrossRef]
- Vander Voor, G.F. Metallography: Principles and Practice; McGraw-Hill Book Co.: New York, NY, USA, 1984; pp. 641–651. [Google Scholar]
- Mészáros, I.; Prohászka, J. Magnetic investigation of the effect of martensite on the properties of austenitic stainless steel. J. Mater. Process. Tech. 2005, 161, 162–168. [Google Scholar] [CrossRef]
- Mészáros, I. Magnetic characterisation of duplex stainless steel. Physica B 2006, 372, 181–184. [Google Scholar] [CrossRef]
- Hajra, R.N.; Tripathy, H.P.; Rai, A.K.; Vijayashanthi, N.; Raju, S.; Saroja, S. Study of high temperature phase stability and phase transformation kinetics of sigma and parent alpha phase in Fe55Cr45 (wt. %) alloy. J. Alloys Compd. 2017, 727, 940–947. [Google Scholar] [CrossRef]
- Błachowski, A.; Dubiel, S.M.; Żukrowski, J. On the activation energy of the σ-phase formation in a pure and Ti-doped Fe–Cr alloy. Intermetallics 2001, 9, 493–498. [Google Scholar] [CrossRef]
- Ferro, P. A dissolution kinetics model and its application to duplex stainless steels. Acta. Mater. 2013, 61, 3141–3147. [Google Scholar] [CrossRef]
- Costa BF, O.; Cieslak, J.; Dubiel, S.M. Kinetics of σ-phase formation in equiatomic cold-rolled Fe-V alloys. Mater. Chem. Phys. 2013, 143, 19–25. [Google Scholar] [CrossRef]
- Mészáros, I.; Bögre, B. Complex Study of Eutectoidal Phase Transformation of 2507-Type Super-Duplex Stainless Steel. Materials 2019, 12, 2205. [Google Scholar] [CrossRef] [Green Version]
- Berecz, T.; Fazakas, É.; Mészáros, I.; Sajó, I. Decomposition kinetics of ferrite in isothermally aged SAF 2507 type duplex stainless steel. J. Mater. Eng. Perform. 2015, 24, 4777–4788. [Google Scholar] [CrossRef]
- Kissinger, H.E. Reaction kinetics in differential thermal analysis. Anal. Chem. 1957, 29, 1702–1706. [Google Scholar] [CrossRef]
- Augis, J.A.; Bennett, J.E. Calculation of the Avrami parameters for heterogeneous solid state reactions using a modified the Kissinger method. J. Therm. Anal. 1978, 13, 283–292. [Google Scholar] [CrossRef]
- Wang, Z.B.; Tao, N.R.; Tong, W.P.; Lu, J.; Lu, K. Diffusion of chromium in nanocrystalline iron produced by means of surface mechanical attrition treatment. Acta. Mater. 2003, 51, 4319–4329. [Google Scholar] [CrossRef]
- Bowen, W.; Leak, G.M. Diffusion in BCC iron base alloys. Metall. Trans. 1970, 1, 2767–2773. [Google Scholar]
- Bowen, W.; Leak, G.M. Solute diffusion in Alpha- and Gamma-Iron. Metall. Trans. 1970, 1, 1695–1700. [Google Scholar] [CrossRef]
- Nitta, H.; Miura, K.; Iijima, Y. Self-diffusion in iron-based Fe–Mo alloys. Acta. Mater. 2006, 54, 2833–2847. [Google Scholar] [CrossRef]
- Nitta, H.; Yamamoto, T.; Kanno, R.; Takasawa, K.; Iida, T.; Yamazaki, Y.; Ogu, S.; Iijima, Y. Diffusion of molybdenum in α-iron. Acta. Mater. 2002, 50, 4117–4125. [Google Scholar] [CrossRef]
| Publisher’s Note: MDPI stays neutral with regard to jurisdictional claims in published maps and institutional affiliations. |
© 2020 by the authors. Licensee MDPI, Basel, Switzerland. This article is an open access article distributed under the terms and conditions of the Creative Commons Attribution (CC BY) license (http://creativecommons.org/licenses/by/4.0/).


