Article

Fatigue Crack Initiation of Metals Fabricated by Additive Manufacturing—A Crystal Plasticity Energy-Based Approach to IN718 Life Prediction

1
School of Industrial Engineering, Purdue University, West Lafayette, IN 47907, USA
2
The Timken Company, North Canton, OH 44720, USA
3
Birck Nanotechnology Center, Purdue University, West Lafayette, IN 47907, USA
*
Authors to whom correspondence should be addressed.
Crystals 2020, 10(10), 905; https://doi.org/10.3390/cryst10100905
Submission received: 31 August 2020 / Revised: 25 September 2020 / Accepted: 4 October 2020 / Published: 6 October 2020
(This article belongs to the Special Issue Crystal Plasticity)

Abstract

:
There has been a long-standing need in the marketplace for the economic production of small lots of components that have complex geometry. A potential solution is additive manufacturing (AM). AM is a manufacturing process that adds material from the bottom up. It has the distinct advantages of low preparation costs and a high geometric creation capability. However, the wide range of industrial processing conditions results in large variations in the fatigue lives of metal components fabricated using AM. One of the main reasons for this variation of fatigue lives is differences in microstructure. Our methodology incorporated a crystal plasticity finite element model (CPFEM) that was able to simulate a stress–strain response based on a set of randomly generated representative volume elements. The main advantage of this approach was that the model determined the elastic constants ( C 11 , C 12 , and C 44 ), the critical resolved shear stress ( g 0 ), and the strain hardening modulus ( h 0 ) as a function of microstructure. These coefficients were determined based on the stress–strain relationships derived from the tensile test results. By incorporating the effect of microstructure on the elastic constants ( C ), the shear stress amplitude ( Δ τ 2 ) can be computed more accurately. In addition, by considering the effect of microstructure on the critical resolved shear stress ( g 0 ) and the strain hardening modulus ( h 0 ), the localized dislocation slip and plastic slip per cycle ( Δ γ p 2 ) can be precisely calculated by CPFEM. This study represents a major advance in fatigue research by modeling the crack initiation life of materials fabricated by AM with different microstructures. It is also a tool for designing laser AM processes that can fabricate components that meet the fatigue requirements of specific applications.

1. Introduction

Additive manufacturing (AM) is a manufacturing process that adds material from the bottom up. Components fabricated via AM are now being used in motor vehicles, consumer products, medical products, aerospace devices, and even some military projects. General Electric employs AM technologies for the production of fuel nozzles, brackets, and sensor housings for jet engine turbines, and has recently planned to produce more than 100,000 parts this way [1]. NASA uses AM to produce components for rocket engine propulsion systems [2]. According to Wohler’s report 2017 [3], approximately 49% of the materials used in AM are metals. The ability to predict the fatigue resistance of components fabricated with AM has become ever more critical with the increasing number of vital components that require high strength.
In the literature that addresses the fatigue data of AM [4], metal parts are shown to have a fatigue performance that displays a great deal of variation; some parts displayed a performance similar to parts that are wrought and cast, whereas others performed far worse than wrought and cast parts, as indicated by Edwards [5] and Kobryn [6]. One of the main reasons for this variation is flexibility in processing conditions, so it is of interest to develop a prediction model that allows one to design a component fabrication process that can meet fatigue resistance requirements.
Recent studies have emphasized experiments on fatigue crack propagation for AM materials. Walker et al. [7] observed that fatigue life has a high variation range from 104 to 107 cycles. Zhai et al. [8] investigated fatigue crack growth mechanisms in Ti-6Al-4V and concluded that the components fabricated with AM had a lower fatigue crack growth threshold and higher fracture toughness than wrought Ti-6Al-4V. The fatigue crack growth rate resistance was higher for materials made by AM in [9,10]. However, research into a model for predicting fatigue crack initiation in AM materials is still in its early stages.
Fatigue crack initiation is a critical property of components in industrial applications since it accounts for 50% to 90% of fatigue life, especially for low-stress and high-cycle fatigue conditions [11,12,13]. We often specify a lower stress condition to obtain a higher safety factor. Under these circumstances, fatigue crack initiation becomes more important. However, this major part of fatigue life prediction is mostly ignored by mainstream researchers working on fatigue modeling. As a result, a fundamental study of crack initiation is essential.
In this study, we present a fatigue crack initiation model that can predict the life of metals fabricated by AM. A crystal plasticity finite element model (CPFEM) was developed to compute the stress and stress–strain response. The model was validated using published fatigue testing results. This approach represents a major advance in fatigue research on AM materials.

2. Materials and Methods

The primary objective of this study is to present a methodology to estimate fatigue crack initiation life by means of a crystal plasticity finite element model. Our main focus is on presenting a simulation approach that can include the microstructure variations for metals fabricated by AM. The fatigue initiation model is based on the assumption that cracks are initiated when energy reaches a critical value, which is discussed in Section 2.1. In Section 2.2, mechanical energy is computed with a CPFEM in which the coefficients were determined based on the microstructure of the potential crack initiation zone. We used the experimental results conducted by Yang et al. [14] as a case study to validate the model by nickel-based superalloy samples that were fabricated by laser AM. The experimental setup is summarized in Section 2.3.

2.1. Fatigue Crack Initiation Model

During fatigue tests, most of the energy is absorbed by the material as mechanical energy, which causes elastic deformation ( E e l a s t i c ) and plastic deformation ( E p l a s t i c ). The remaining energy is transformed into heat ( E t h e r m a l ) and diffused. The energy equation can be formulated as in Equation (1):
Δ E ( N i ) = E e l a s t i c E p l a s t i c + E r e l e a s e E t h e r m a l
The elastic energy can be modeled as in Equation (2), assuming a virtual crack is defined as being penny-shaped [15].
E e l a s t i c = 4 ( 1 v 2 ) 3 E σ 3 a 3
where a is the crack radius, ν is Poisson’s ratio, σ is the normal load applied, and E is the elastic modulus. The cracks tend to be initiated from stress-concentrated areas such as gas pores [14], slip bands [16], and areas lacking diffusion [14,17,18] for AM-fabricated materials. The plastic energy stored at the potential crack-initiated areas can be modeled based on Fine [19] as in Equation (3):
E p l a s t i c = π t 2 N δ 2
where t is the virtual defect size, N is the cycle number, and δ is the energy increase per cycle. The energy released ( E r e l e a s e ) during crack initiation is formulated in Equation (4) based on Bhat and Fine [20]:
E r e l e a s e = π a 2 γ s
where γ s is the surface energy. According to the assumptions of Tanaka and Mura [21], the total energy absorbed can be cumulative. Cracks are initiated when the energy reaches a critical value. The Bhat and Fine [14,20] model assumes that the total energy is released when the energy change Δ E reaches its maximum value and a crack is spontaneously initiated. As the crack begins to form, the internal energy is reduced due to the release of energy ( E r e l e a s e ) as the crack develops. To find the maximum Δ E for crack initiation, Equation (5) is derived:
Δ E a = 0
We plug in the elastic energy change and plastic energy change per cycle, as shown in Equation (6), with the assumption that the temperature change is low enough during the fatigue test to neglect the thermal energy.
( Δ E a ) N = a ( 4 ( 1 v 2 ) 3 E σ 2 a 3 π t 2 N δ 2 + π a 2 γ s ) = 0
Since the plastic portion of the energy change is assumed to be caused purely by mechanical loading, the plastic dissipation energy is the product of the shear stress and plastic slip accumulation amplitudes. The crack initiation life is then derived as Equation (7):
N i = π E γ s 4 σ 2 a 2 ( 1 v 2 ) π E ρ t ( Δ τ 2 ) ( Δ γ p 2 )
where ρ is the energy efficiency coefficient [22,23], ( Δ τ 2 ) is the shear stress amplitude, and ( Δ γ p 2 ) is the plastic slip rate per cycle. The elastic part 4 σ 2 a 2 ( 1 v 2 ) can be neglected since it is on the order of A 2 . The final fatigue crack initiation can be summarized as shown in Equation (8):
N i = γ s ρ t ( Δ τ 2 ) ( Δ γ p 2 )

2.2. Crystal Plasticity Finite Element Model

The CPFEM model was developed based on the computational framework presented by Voothaluru and Liu [22,24,25]. The model applies small deformation kinematical theory [26,27] to the computation of the shear stress amplitude and plastic slip per cycle. The shear stress ( τ s ) is calculated by the Cauchy stress tensor ( σ ), slip direction ( s ), and Schmid factor ( m ) as shown in Equation (9).
τ s = σ : ( s s m s )
The plastic slip rate is calculated with Equation (10) as presented by Hutchinson [28].
γ s ˙ = γ 0 ˙ | τ s x s g s | n s g n ( τ s )
where g s is the slip resistance and x s is the back stress. We assumed that the slip resistance and back stress obey the hardening law presented by Brown [29] as shown in Equations (11) and (12):
g s = s H d i r | γ s ˙ | q s s s H d y n | γ s ˙ |
x s = A d i r s γ s ˙ x s A d y n | γ s ˙ |
where H d i r and A d i r are the isotropic hardening coefficients and H d y n and A d y n are dynamic recovery coefficients. These constitutive equations were coded in ABAQUS software [30,31] to compute the energy during reversible fatigue.
The representative volume element (RVE) was defined as the volume of heterogeneous material that is sufficiently large to be statistically representative of the real component’s microstructure. A set of randomly generated RVEs was developed for the microstructure at the potential crack initiation area. The RVE was generated within ABAQUS to have 64,000 C3D8 elements with a random orientation assigned to each element. This allows the development of a 40 × 40 × 40 model which has been generated with 50 different instantiations for orientation inputs that were randomly generated from a Gaussian normal distribution. This approach has been validated for other polycrystalline materials owing to the size independence of the models [32]. The boundary conditions were those followed by Smit [33], Kumar et al. [34], and Zhang [35]. A displacement boundary condition ( U x ) was applied to the top face (1—2—3—4). A fixed boundary condition ( U x = 0 ) was applied to the bottom face (5—6—7—8). Periodic boundary conditions were applied to the faces on the sides, (1—2—5—6), (1—4—5—8), (3—4—7—8), and (2—3—6—7), as shown in Figure 1.
To include the variation of microstructure, the coefficients were determined as a function of microstructure. The elastic constants ( C 11 , C 12 , and C 44 ), critical resolved shear stress ( g 0 ), and strain hardening modulus ( h 0 ) were determined from the stress–strain relationships, based on the tensile test results, as in Verma and Biswas’s method [36]. This approach estimated the coefficients by trial and error until it achieved an appreciable fit with the experimental data. The shear stress amplitude ( Δ τ 2 ) and plastic slip per cycle ( Δ γ p 2 ) in Equation (8) can be computed more accurately by the crystal plasticity finite element model if we have precise values for the elastic constants ( C 11 , C 12 , and C 44 ), the critical resolved shear stress ( g 0 ), and the strain hardening modulus ( h 0 ) as a function of microstructure.

2.3. Experiments

In this study, we took the results from the fatigue crack initiation experiments carried out by Yang et al. [14] to validate the fatigue model’s life estimate. Nickel-based superalloy IN718 samples were fabricated by selective laser melting. The processing conditions were adjusted so that the density was around 99.9%. The round bar specimens were 53.6 mm long with a smooth dog-bone shape of 3 mm in diameter. The gauge regions were machined and polished to remove surface defects for the as-built components. Then, the samples were tested with an ultrasonic fatigue testing machine (Shimadzu 2000). Symmetrical push-pull loading was applied using the stress ratio R = 1 and a frequency of about 20 kHz.
During fatigue loading, the samples were periodically observed by a scanning electron microscope (SEM). The crack initiation was defined as the smallest cracks that could be observed by the SEM, with a maximum micro-crack size of approximately 30 μm. In this experiment, Yang et al. found that the surface cracks began before the interior cracks. This led us to focus on surface crack initiations for validation of the fatigue model. The formulas for surface crack initiation life based on the experiments were incorporated in Equation (13).
σ a = 1280.9 × N i 0.0618
where σ a is the applied stress amplitude and N i is the fatigue crack initiation life.
The tensile test specimen and SLM processing parameters were designed to be identical to the samples of fatigue. The dog-bone design forced the weakest region to be at the gauge area in the middle of the specimen. Thus, the elastic constants ( C 11 , C 12 , and C 44 ), the critical resolved shear stress ( g 0 ), and the strain hardening modulus ( h 0 ) could be determined based on the microstructure of the weakest crack initiation area.

3. Results

3.1. Fatigue Parameter Estimation

The elastic constants ( C 11 , C 12 , and C 44 ) and hardening coefficients ( g 0 , h 0 ) were determined based on the stress–strain relationship derived from the tensile test results. The elastic constant C i j k l correlated the elastic behaviors with the applied stress, as shown in Equation (14).
σ i j = C i j k l ε k l
where σ i j is the stress in the i direction in the plane perpendicular to the j direction, and ε i j is the elastic strain response. The model assumes symmetric crystal properties, so only C 11 , C 12 , and C 44 were considered. The critical resolved shear stress ( g 0 ) is the stress required to initiate slip. This parameter determines the stress condition for which the material starts yielding. The strain hardening modulus ( h 0 ) is the parameter that determines the slope of hardening after the point of yield of the material.
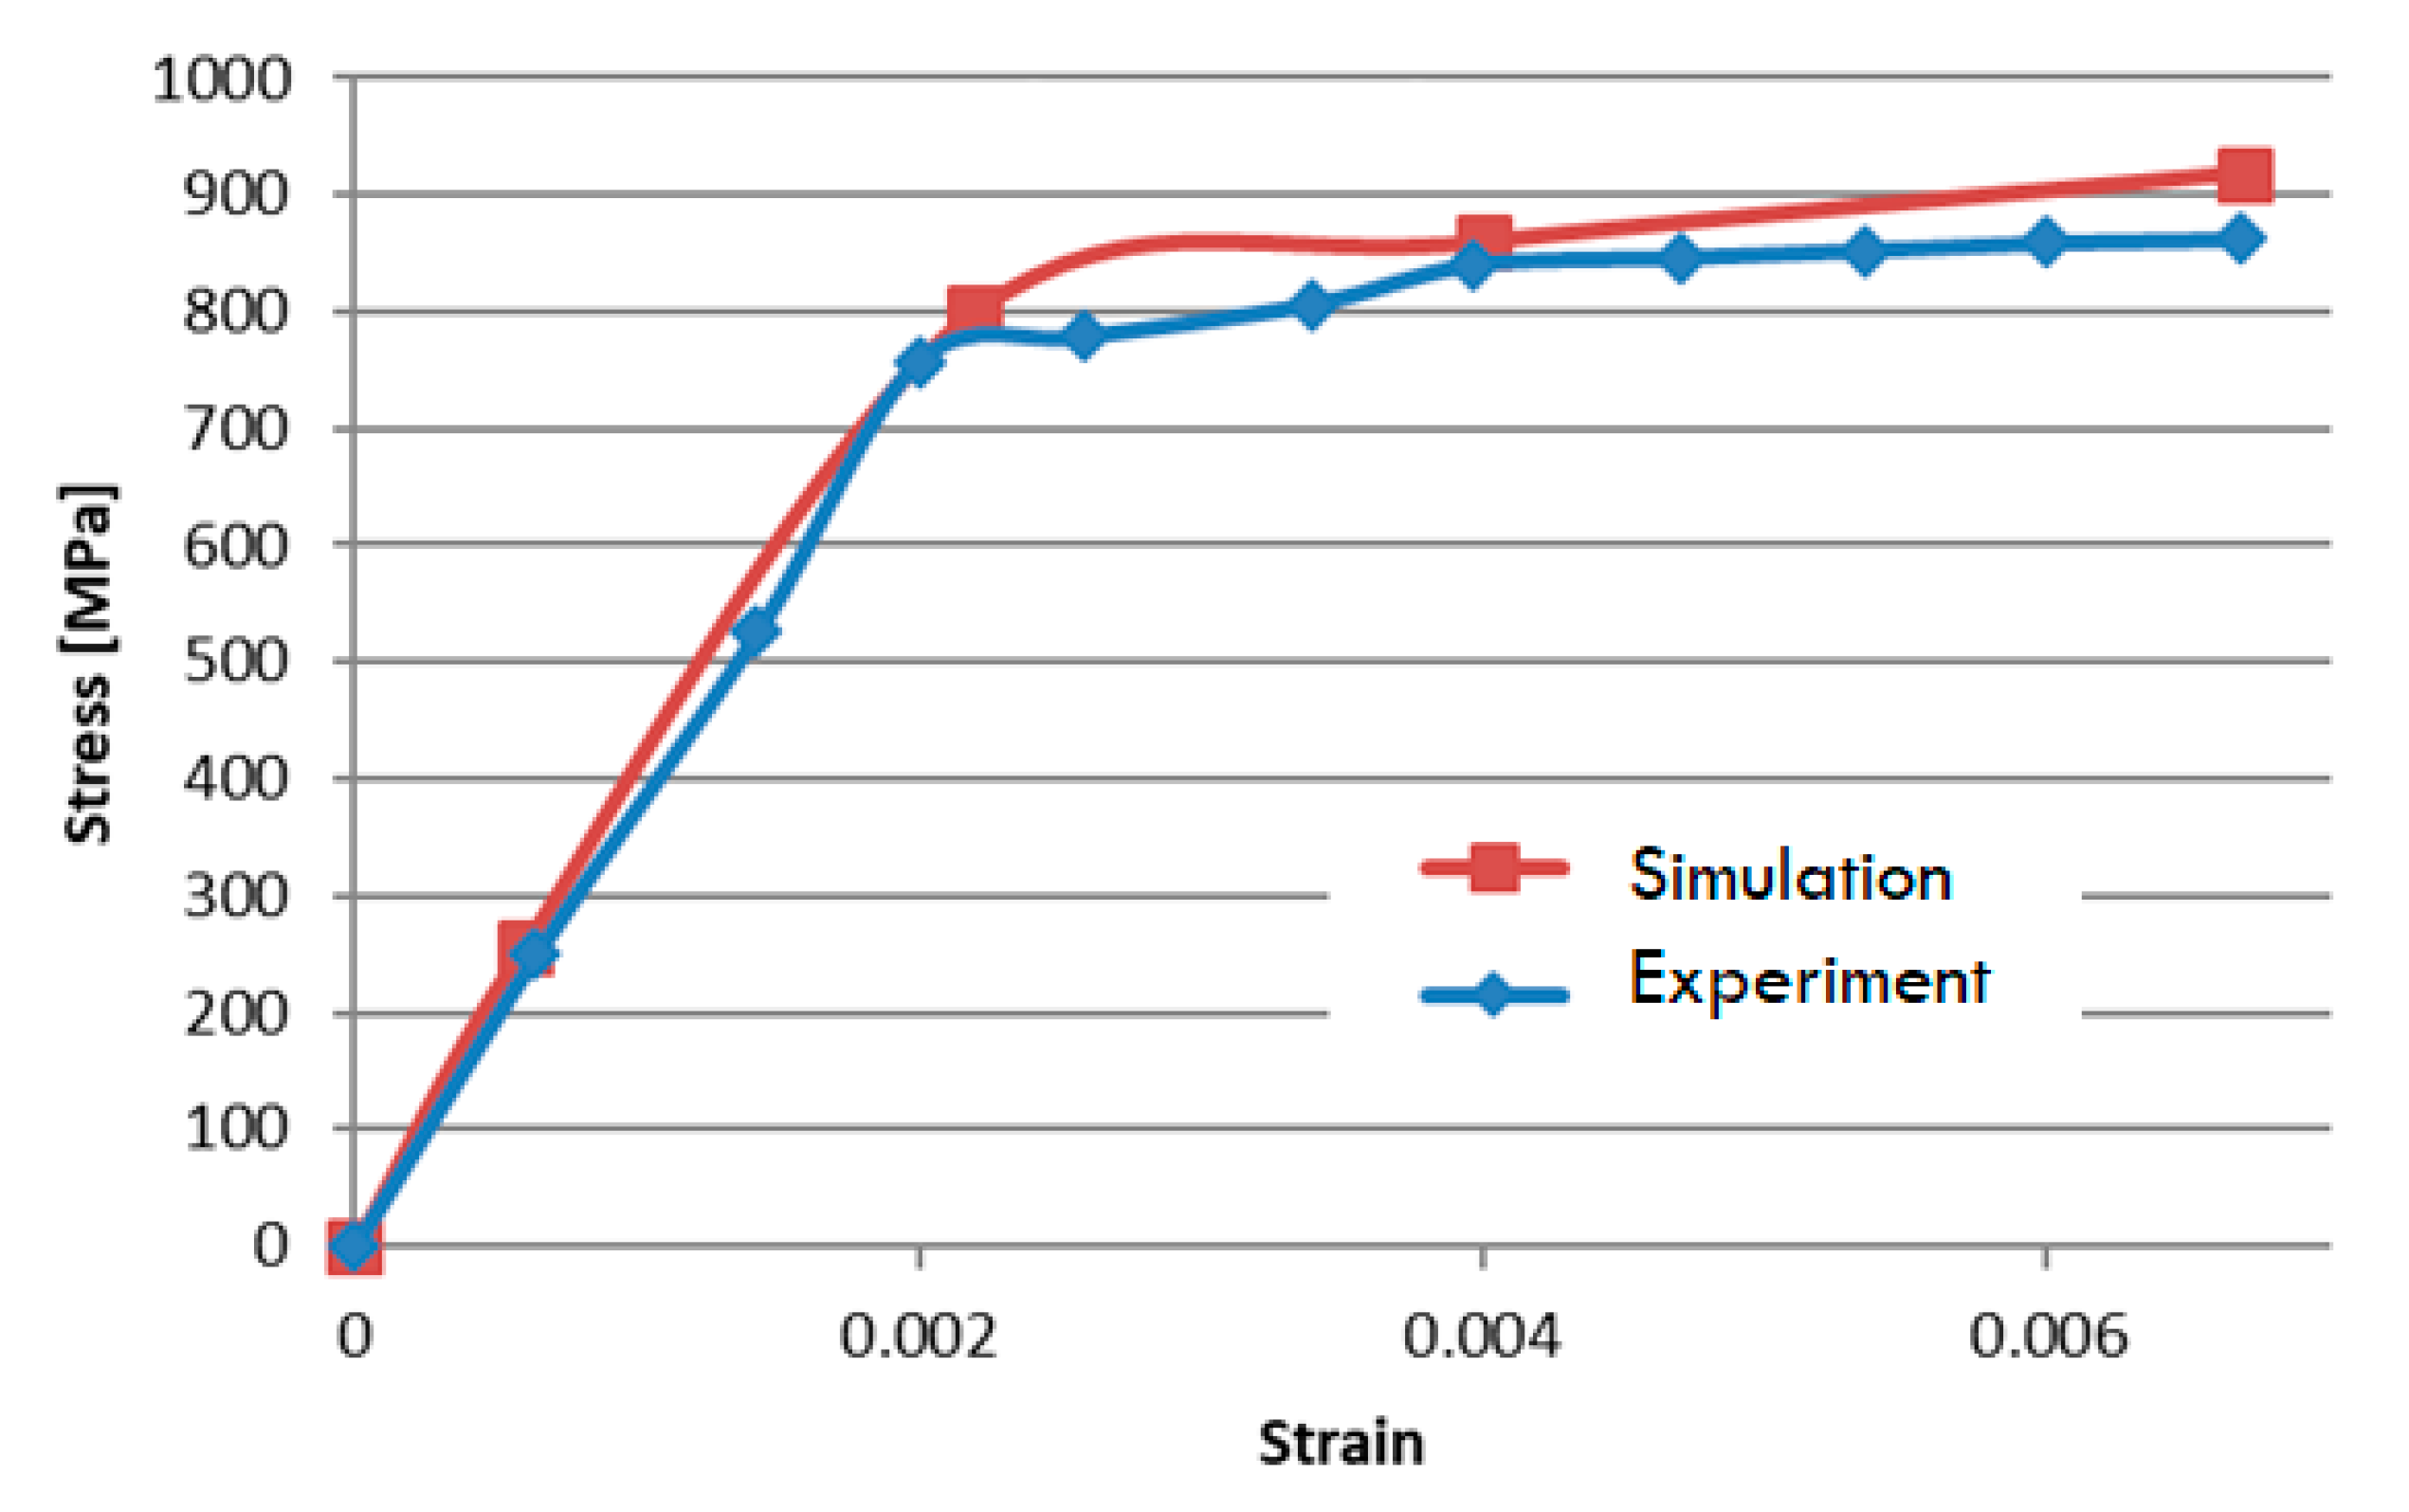
As in Verma and Biswas’s method [35], the elastic constants, critical resolved shear stress, and strain hardening modulus were determined by the best fit of a small deformation region of the tensile testing measurements, as shown in Table 1. The model’s simulation results were a reasonable enough fit to be calibrated by the empirical data, as shown in Figure 2.
Since the specimens were designed in a round dog-bone shape, we were able to ensure that the stress-concentrated area during the tensile test and the potential fatigue crack initiation region were identical, at the gauge area in the middle of specimen. The comparison of experimental data and the simulation demonstrated that this approach was able to calibrate the coefficients for the microstructure of the weakest region of the samples. The accuracy of this simulation was around 95%, which can improve if needed.

3.2. Fatigue Crack Initiation Life Estimation

After the elastic constants, critical resolved shear stress, and strain hardening modulus were calibrated for the microstructure of the weakest region, we were able to use these coefficients as the inputs for the CPFEM.
In this study, the finite element model was used to compute the shear stress amplitude ( Δ τ 2 ) and plastic slip per cycle ( Δ γ p 2 ) during fatigue testing with applied stress values ( σ a ) of 500, 600, and 700 MPa, as shown in Table 2. The fatigue crack initiation life can be computed by Equation (8). We used the 700 MPa case as a benchmark and estimated the fatigue crack initiation life with the energy ratio, as shown in Equation (15). We assumed that the surface energy ( γ s ), energy efficiency coefficient ( ρ ), and defect size ( t ) were constant for the different samples, a reasonable assumption since the samples were fabricated under identical processing conditions and their microstructures were similar.
( N i ) c o m p u t e ( N i ) 700 = ( Δ τ 2 ) 700 ( Δ γ p 2 ) 700 ( Δ τ 2 ) c o m p u t e ( Δ γ p 2 ) c o m p u t e
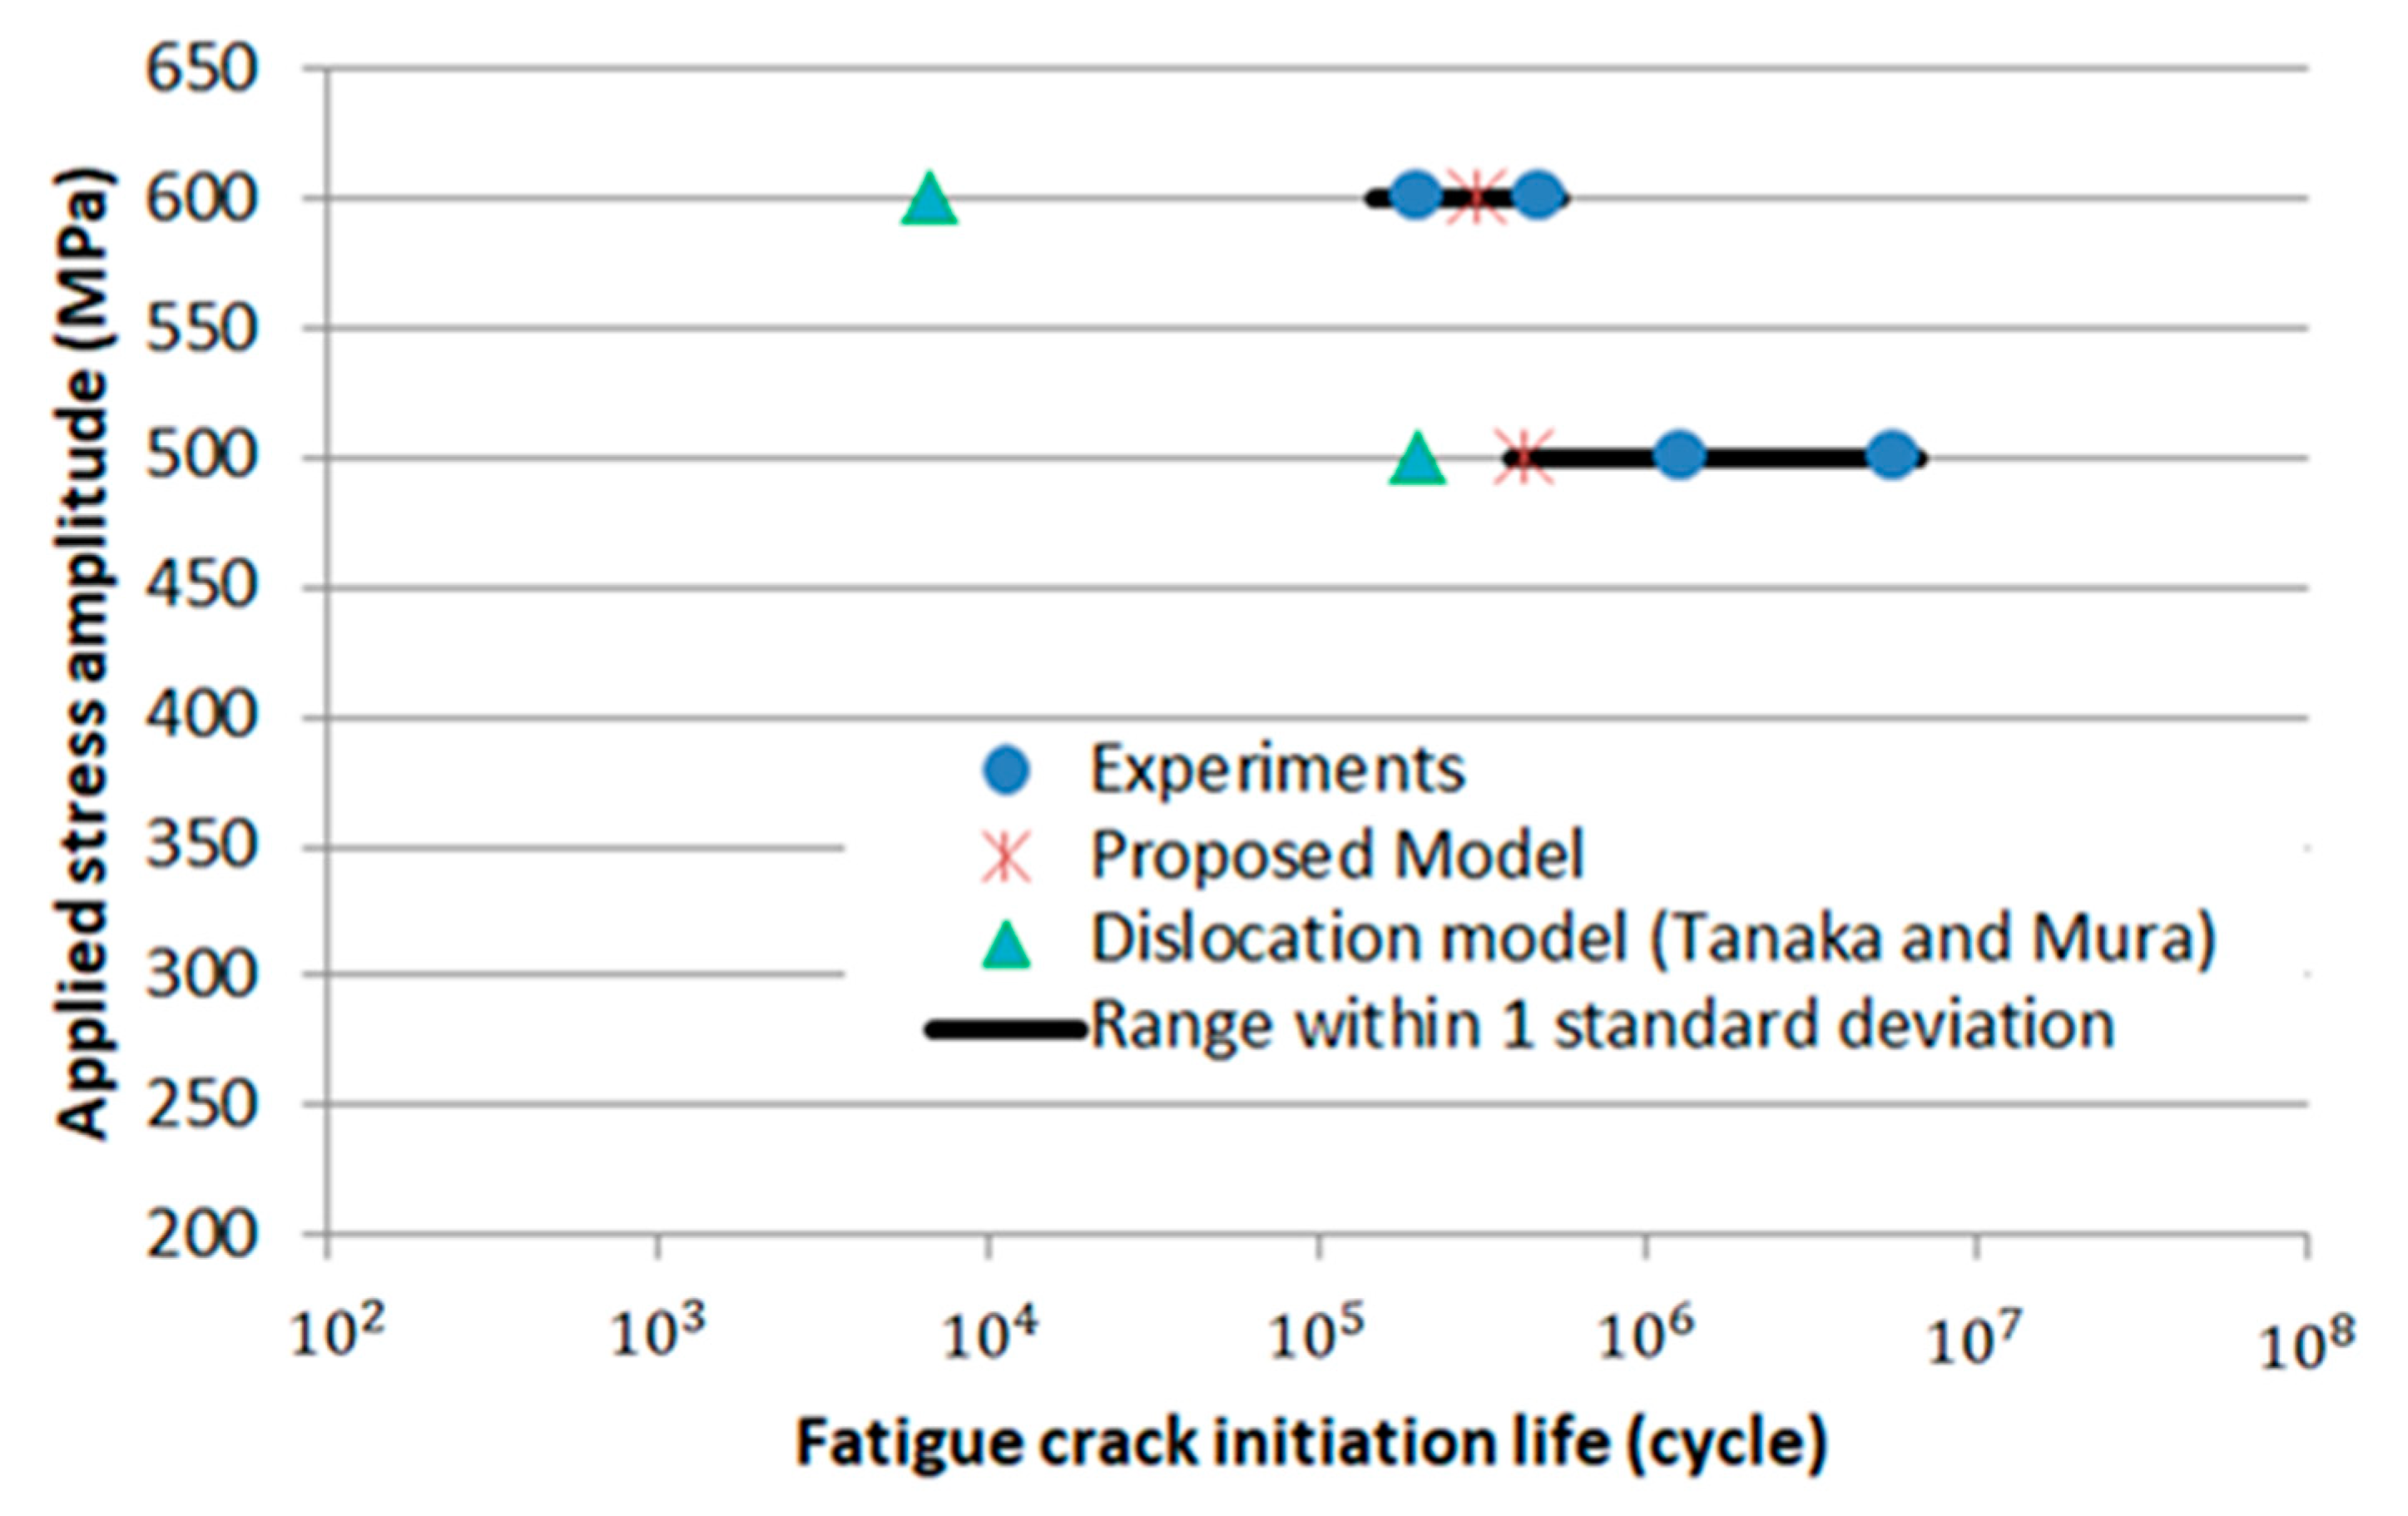
The fatigue crack initiation life prediction results were compared with the empirical data, as shown in Table 3. We assumed that the crack initiation life could be treated as a normal distribution. The empirical average crack initiation life cycle was estimated by Equation (13) from Yang et al. [14]. The standard deviation (SD) was estimated from the actual empirical data. The computation results were within the range of one standard deviation (SD) from the average crack initiation life. As indicated in Figure 3, our CPFEM model was able to reasonably predict the fatigue crack initiation life of materials fabricated by AM.
The proposed model can predict the crack initiation life of materials fabricated by AM with reasonable accuracy within the range of one standard deviation (SD). On the contrary, if we applied the dislocation model [21] to AM materials, the predicted initiation life was outside of one standard deviation, as shown in Figure 3. The main reason for this improvement in accuracy was that the proposed model considered the microstructure effect at the weakest region of the components. The stress and strain response at the potential crack initiation area can be accurately computed by the crystal plasticity finite element model.
In contrast, the dislocation model [21] did not consider the anisotropic nature of the microstructure, which led to poor accuracy. The dislocation model is as shown in Equation (16):
N i = A W c ( Δ τ 2 τ k ) 2
where A is a function of crack mechanism, W c is the fracture energy per unit area, Δ τ is the shear stress, and τ k is the friction stress. These coefficients are related to the microstructure and slip system at the localized potential crack initiation area. However, Tanaka and Mura neglected the effect of microstructure and assumed that these coefficients were material constants.
The presented fatigue crack initiation model determined the elastic constants ( C 11 , C 12 , and C 44 ), the critical resolved shear stress ( g 0 ), and the strain hardening modulus ( h 0 ) as a function of microstructure. These coefficients were determined based on the stress–strain relationships derived from tensile test results. By incorporating the effect of microstructure on the elastic constants ( C ), the shear stress amplitude ( Δ τ 2 ), as shown in Equation (16), can be computed more accurately. In addition, by considering the effect of microstructure on the critical resolved shear stress ( g 0 ) and the strain hardening modulus ( h 0 ), the localized dislocation slip and plastic slip per cycle ( Δ γ p 2 ), as shown in Equation (17), can be precisely calculated. As discussed in previous papers [16,22,23,24,25], the energy efficiency coefficient ( ρ ), and the maximum persistent slip band width ( t m ) are also coefficients related to microstructure. However, due to limited experimental data, we assumed they were a constant value in this study. These coefficients, as a function of microstructure, can be further studied in future work. This approach can improve the estimation of crack initiation life by fundamentally studying the way in which each coefficient is affected by the microstructure at the potential crack initiation area.
Another advantage of the fatigue crack initiation model presented here is that only a few empirical data are needed to get a reasonable prediction of initiation life. The material properties can be determined from the stress–strain relationship, based on the tensile test results. A set of randomly generated RVEs can reasonably simulate the material’s microstructure at the weakest region. Although the fatigue crack initiation life variation is large for materials fabricated by AM, the presented model was able to predict the life to within one standard deviation in this case study. For future work, the model can be applied to different crack mechanisms initiated from gas pores, lack of diffusion, and slip band. In addition, actual components’ potential crack initiation zones can be scanned using electron backscatter diffraction to develop more representative RVEs for CPFEM models.
In summary, a methodology for predicting the fatigue crack initiation life of metals fabricated by AM was presented. A set of RVEs was randomly generated for the potential crack initiation zone. The elastic constants ( C 11 , C 12 , and C 44 ), critical resolved shear stress ( g 0 ), and strain hardening modulus ( h 0 ) were determined from the stress–strain relationships based on the tensile test results. The shear stress amplitude ( Δ τ 2 ) and plastic slip per cycle ( Δ γ p 2 ), as shown in Equation (8), can be computed more accurately by the crystal plasticity finite element model if we have precise values of elastic constants ( C 11 , C 12 , and C 44 ), critical resolved shear stress ( g 0 ), and strain hardening modulus ( h 0 ) as a function of microstructure. The energy efficiency coefficient ( ρ ), and maximum persistent slip band width ( t m ) are also coefficients related to microstructure. However, due to limited experimental data, we assumed that they were a constant value in this study. These coefficients, as a function of microstructure, can be further studied in future works to improve the model’s accuracy.

4. Conclusions

A methodology for predicting the fatigue crack initiation life of metals fabricated by AM was presented. The fatigue crack initiation model determined the elastic constants ( C 11 , C 12 , and C 44 ), critical resolved shear stress ( g 0 ), and strain hardening modulus ( h 0 ) as a function of microstructure. These coefficients were determined based on the stress–strain relationships, derived from the tensile test results. By incorporating the effect of microstructure on the elastic constants ( C ), the shear stress amplitude ( Δ τ 2 ) can be computed more accurately. In addition, by considering the effect of microstructure on the critical resolved shear stress ( g 0 ) and the strain hardening modulus ( h 0 ), the localized dislocation slip and plastic slip per cycle ( Δ γ p 2 ) can be precisely calculated. This study has enabled a major advance in fatigue research by modeling the crack initiation life of materials fabricated by AM through considering these coefficients as a function of microstructure. Using this model, the large variations in the fatigue lives of metal components fabricated using AM can be incorporated into prediction models.

Author Contributions

Conceptualization, C.R.L. and C.-Y.O.; methodology, C.-Y.O., C.R.L., and R.V.; software, R.V.; validation, C.-Y.O.; writing—original draft preparation, C.-Y.O.; writing—review and editing, R.V. and C.R.L.; supervision, C.R.L.; project initiation and administration, C.R.L.; funding acquisition, C.R.L. All authors have read and agreed to the published version of the manuscript.

Funding

This work was supported by the National Science Foundation (CMMI), through grant No. 1562960. Some ideas and materials are patent pending, owned by Purdue University.

Conflicts of Interest

The authors declare no conflict of interest.

References

  1. Seifi, M.; Salem, A.A.; Beuth, J.; Harrysson, O.; Lewandowski, J.J. Overview of Materials Qualification Needs for Metal Additive Manufacturing. JOM 2016, 68, 747–764. [Google Scholar] [CrossRef] [Green Version]
  2. Draper, S.; Locci, I.; Lerch, B.; Ellis, D.; Senick, P.; Meyer, M.; Free, J.; Cooper, K.; Jones, Z. Materials Characterization of Additively Manufactured Components for Rocket Propulsion. In Proceedings of the 66th International Astronautical Congress, Jerusalem, Israel, 12–16 October 2015; pp. 1–9. [Google Scholar]
  3. Wohler’s Report, Additive Manufacturing and 3D Printing State of the Industry Annual Worldwide Progress Report. 2017. Available online: https://wohlersassociates.com/press72.html (accessed on 3 April 2017).
  4. Li, P.; Warner, D.; Fatemi, A.; Phan, N. Critical assessment of the fatigue performance of additively manufactured Ti–6Al–4V and perspective for future research. Int. J. Fatigue 2016, 85, 130–143. [Google Scholar] [CrossRef]
  5. Edwards, P.; Ramulu, M. Fatigue performance evaluation of selective laser melted Ti–6Al–4V. Mater. Sci. Eng. A 2014, 598, 327–337. [Google Scholar] [CrossRef]
  6. Kobryn, P.A.; Semiatin, S.L. Mechanical properties of laser-deposited Ti–6Al–4V. In Proceedings of the Solid Freeform Fabrication Proceedings, Austin, TX, USA, 6–8 August 2001. [Google Scholar]
  7. Walker, K.; Liu, Q.; Brandt, M. Evaluation of fatigue crack propagation behaviour in Ti-6Al-4V manufactured by selective laser melting. Int. J. Fatigue 2017, 104, 302–308. [Google Scholar] [CrossRef]
  8. Zhai, Y.; Galarraga, H.; Lados, D.A. Microstructure, static properties, and fatigue crack growth mechanisms in Ti-6Al-4V fabricated by additive manufacturing: LENS and EBM. Eng. Fail. Anal. 2016, 69, 3–14. [Google Scholar] [CrossRef]
  9. Gordon, J.; Haden, C.; Nied, H.; Vinci, R.P.; Harlow, D. Fatigue crack growth anisotropy, texture and residual stress in austenitic steel made by wire and arc additive manufacturing. Mater. Sci. Eng. A 2018, 724, 431–438. [Google Scholar] [CrossRef]
  10. Yadollahi, A.; Shamsaei, N. Additive manufacturing of fatigue resistant materials: Challenges and opportunities. Int. J. Fatigue 2017, 98, 14–31. [Google Scholar] [CrossRef] [Green Version]
  11. Choi, Y.; Liu, C.R. Rolling contact fatigue life of finish hard machined surfaces. Wear 2006, 261, 485–491. [Google Scholar] [CrossRef]
  12. Mughrabi, H. Microstructural mechanisms of cyclic deformation, fatigue crack initiation and early crack growth. Philos. Trans. R. Soc. A Math. Phys. Eng. Sci. 2015, 373, 20140132. [Google Scholar] [CrossRef] [Green Version]
  13. Kazymyrovych, V.; Bergström, J.; Burman, C. The Significance of Crack Initiation Stage in Very High Cycle Fatigue of Steels. Steel Res. Int. 2010, 81, 308–314. [Google Scholar] [CrossRef]
  14. Yang, K.; Huang, Q.; Wang, Q.; Chen, Q. Competing crack initiation behaviors of a laser additively manufactured nickel-based superalloy in high and very high cycle fatigue regimes. Int. J. Fatigue 2020, 136, 105580. [Google Scholar] [CrossRef]
  15. Fine, M.E.; Bhat, S.P. A model of fatigue crack nucleation in single crystal iron and copper. Mater. Sci. Eng. A 2007, 468, 64–69. [Google Scholar] [CrossRef]
  16. Ou, C.-Y.; Liu, C.R. The Effects of Grain Size and Strain Amplitude on Persistent Slip Band Formation and Fatigue Crack Initiation. Met. Mater. Trans. A 2019, 50, 5056–5065. [Google Scholar] [CrossRef]
  17. Kruth, J.; Mercelis, P.; Van Vaerenbergh, J.; Froyen, L.; Rombouts, M. Binding mechanisms in selective laser sintering and selective laser melting. Rapid Prototyp. J. 2005, 11, 26–36. [Google Scholar] [CrossRef] [Green Version]
  18. Gu, D.; Shen, Y. Balling phenomena in direct laser sintering of stainless steel powder: Metallurgical mechanisms and control methods. Mater. Des. 2009, 30, 2903–2910. [Google Scholar] [CrossRef]
  19. Fine, M. Phase transformation theory applied to elevated temperature fatigue. Scr. Mater. 2000, 42, 1007–1012. [Google Scholar] [CrossRef]
  20. Bhat, S.P.; Fine, M.E. Fatigue crack nucleation in iron and a high strength low alloy steel. Mater. Sci. Eng. A 2001, 314, 90–96. [Google Scholar] [CrossRef]
  21. Tanaka, K.; Mura, T. A Dislocation Model for Fatigue Crack Initiation. J. Appl. Mech. 1981, 48, 97–103. [Google Scholar] [CrossRef]
  22. Voothaluru, R.; Liu, C.R. Determination of lattice level energy efficiency for fatigue crack initiation. Fatigue Fract. Eng. Mater. Struct. 2013, 36, 670–678. [Google Scholar] [CrossRef]
  23. Ou, C.-Y.; Voothaluru, R.; Liu, C.R. A Methodology for Incorporating the Effect of Grain Size on the Energy Efficiency Coefficient for Fatigue Crack Initiation Estimation in Polycrystalline Metal. Metals 2020, 10, 355. [Google Scholar] [CrossRef] [Green Version]
  24. Voothaluru, R.; Liu, C.R. A crystal plasticity based methodology for fatigue crack initiation life prediction in polycrystalline copper. Fatigue Fract. Eng. Mater. Struct. 2014, 37, 671–681. [Google Scholar] [CrossRef]
  25. Rohit, V. A Crystal Plasticity Based Methodology for Modeling Fatigue Crack Initiation and Estimating Material Coefficients to Predict Fatigue Crack Initiation Life at Micro, Nano and Macro Scales. Ph.D. Thesis, Purdue University, West Lafayette, IN, USA, 2014. [Google Scholar]
  26. Taylor, G.I. Plastic Strain in Metals. Inst. Met. 1938, 62, 307. [Google Scholar]
  27. Asaro, R.J. Crystal Plasticity. J. Appl. Mech. 1983, 50, 921–934. [Google Scholar] [CrossRef]
  28. Hutchinson, J.W. Bounds and self-consistent estimates for creep of polycrystalline materials. Proc. R. Soc. Lond. Ser. A Math. Phys. Sci. 1976, 348, 101–127. [Google Scholar] [CrossRef]
  29. Brown, S.; Kim, K.; Anand, L. An internal variable constitutive model for hot working of metals. Int. J. Plast. 1989, 5, 95–130. [Google Scholar] [CrossRef] [Green Version]
  30. Huang, Y. A User-Material Subroutine Incorporating Single Crystal Plasticity in the ABAQUS Finite Element Program; Harvard University Research Report; Harvard University: Cambridge, MA, USA, 1991. [Google Scholar]
  31. Liu, B.; Raabe, D.; Roters, F.; Eisenlohr, P.; Lebensohn, R.A. Comparison of Finite Element and Fast Fourier Transform Crystal Plasticity Solvers for Texture Prediction Model. Simul. Mater. Sci. Eng. 2010, 18, 085005. [Google Scholar] [CrossRef]
  32. Bedekar, V.; Voothaluru, R.; Yu, D.; Wong, A.; Galindo-Nava, E.; Gorti, S.B.; An, K.; Hyde, R.S. Effect of nickel on the kinematic stability of retained austenite in carburized bearing steels—In-situ neutron diffraction and crystal plasticity modeling of uniaxial tension tests in AISI 8620, 4320 and 3310 steels. Int. J. Plast. 2020, 131, 102748. [Google Scholar] [CrossRef]
  33. Smit, R.; Brekelmans, W.; Meijer, H. Prediction of the mechanical behavior of nonlinear heterogeneous systems by multi-level finite element modeling. Comput. Methods Appl. Mech. Eng. 1998, 155, 181–192. [Google Scholar] [CrossRef]
  34. Kumar, R.S.; Wang, A.-J.; McDowell, D.L. Effects of Microstructure Variability on Intrinsic Fatigue Resistance of Nickel-base Superalloys—A Computational Micromechanics Approach. Int. J. Fract. 2006, 137, 173–210. [Google Scholar] [CrossRef]
  35. Zhang, J.; Prasannavenkatesan, R.; Shenoy, M.M.; McDowell, D.L. Modeling fatigue crack nucleation at primary inclusions in carburized and shot-peened martensitic steel. Eng. Fract. Mech. 2009, 76, 315–334. [Google Scholar] [CrossRef]
  36. Verma, R.K.; Biswas, P. Crystal plasticity-based modelling of grain size effects in dual phase steel. Mater. Sci. Technol. 2016, 32, 1553–1558. [Google Scholar] [CrossRef]
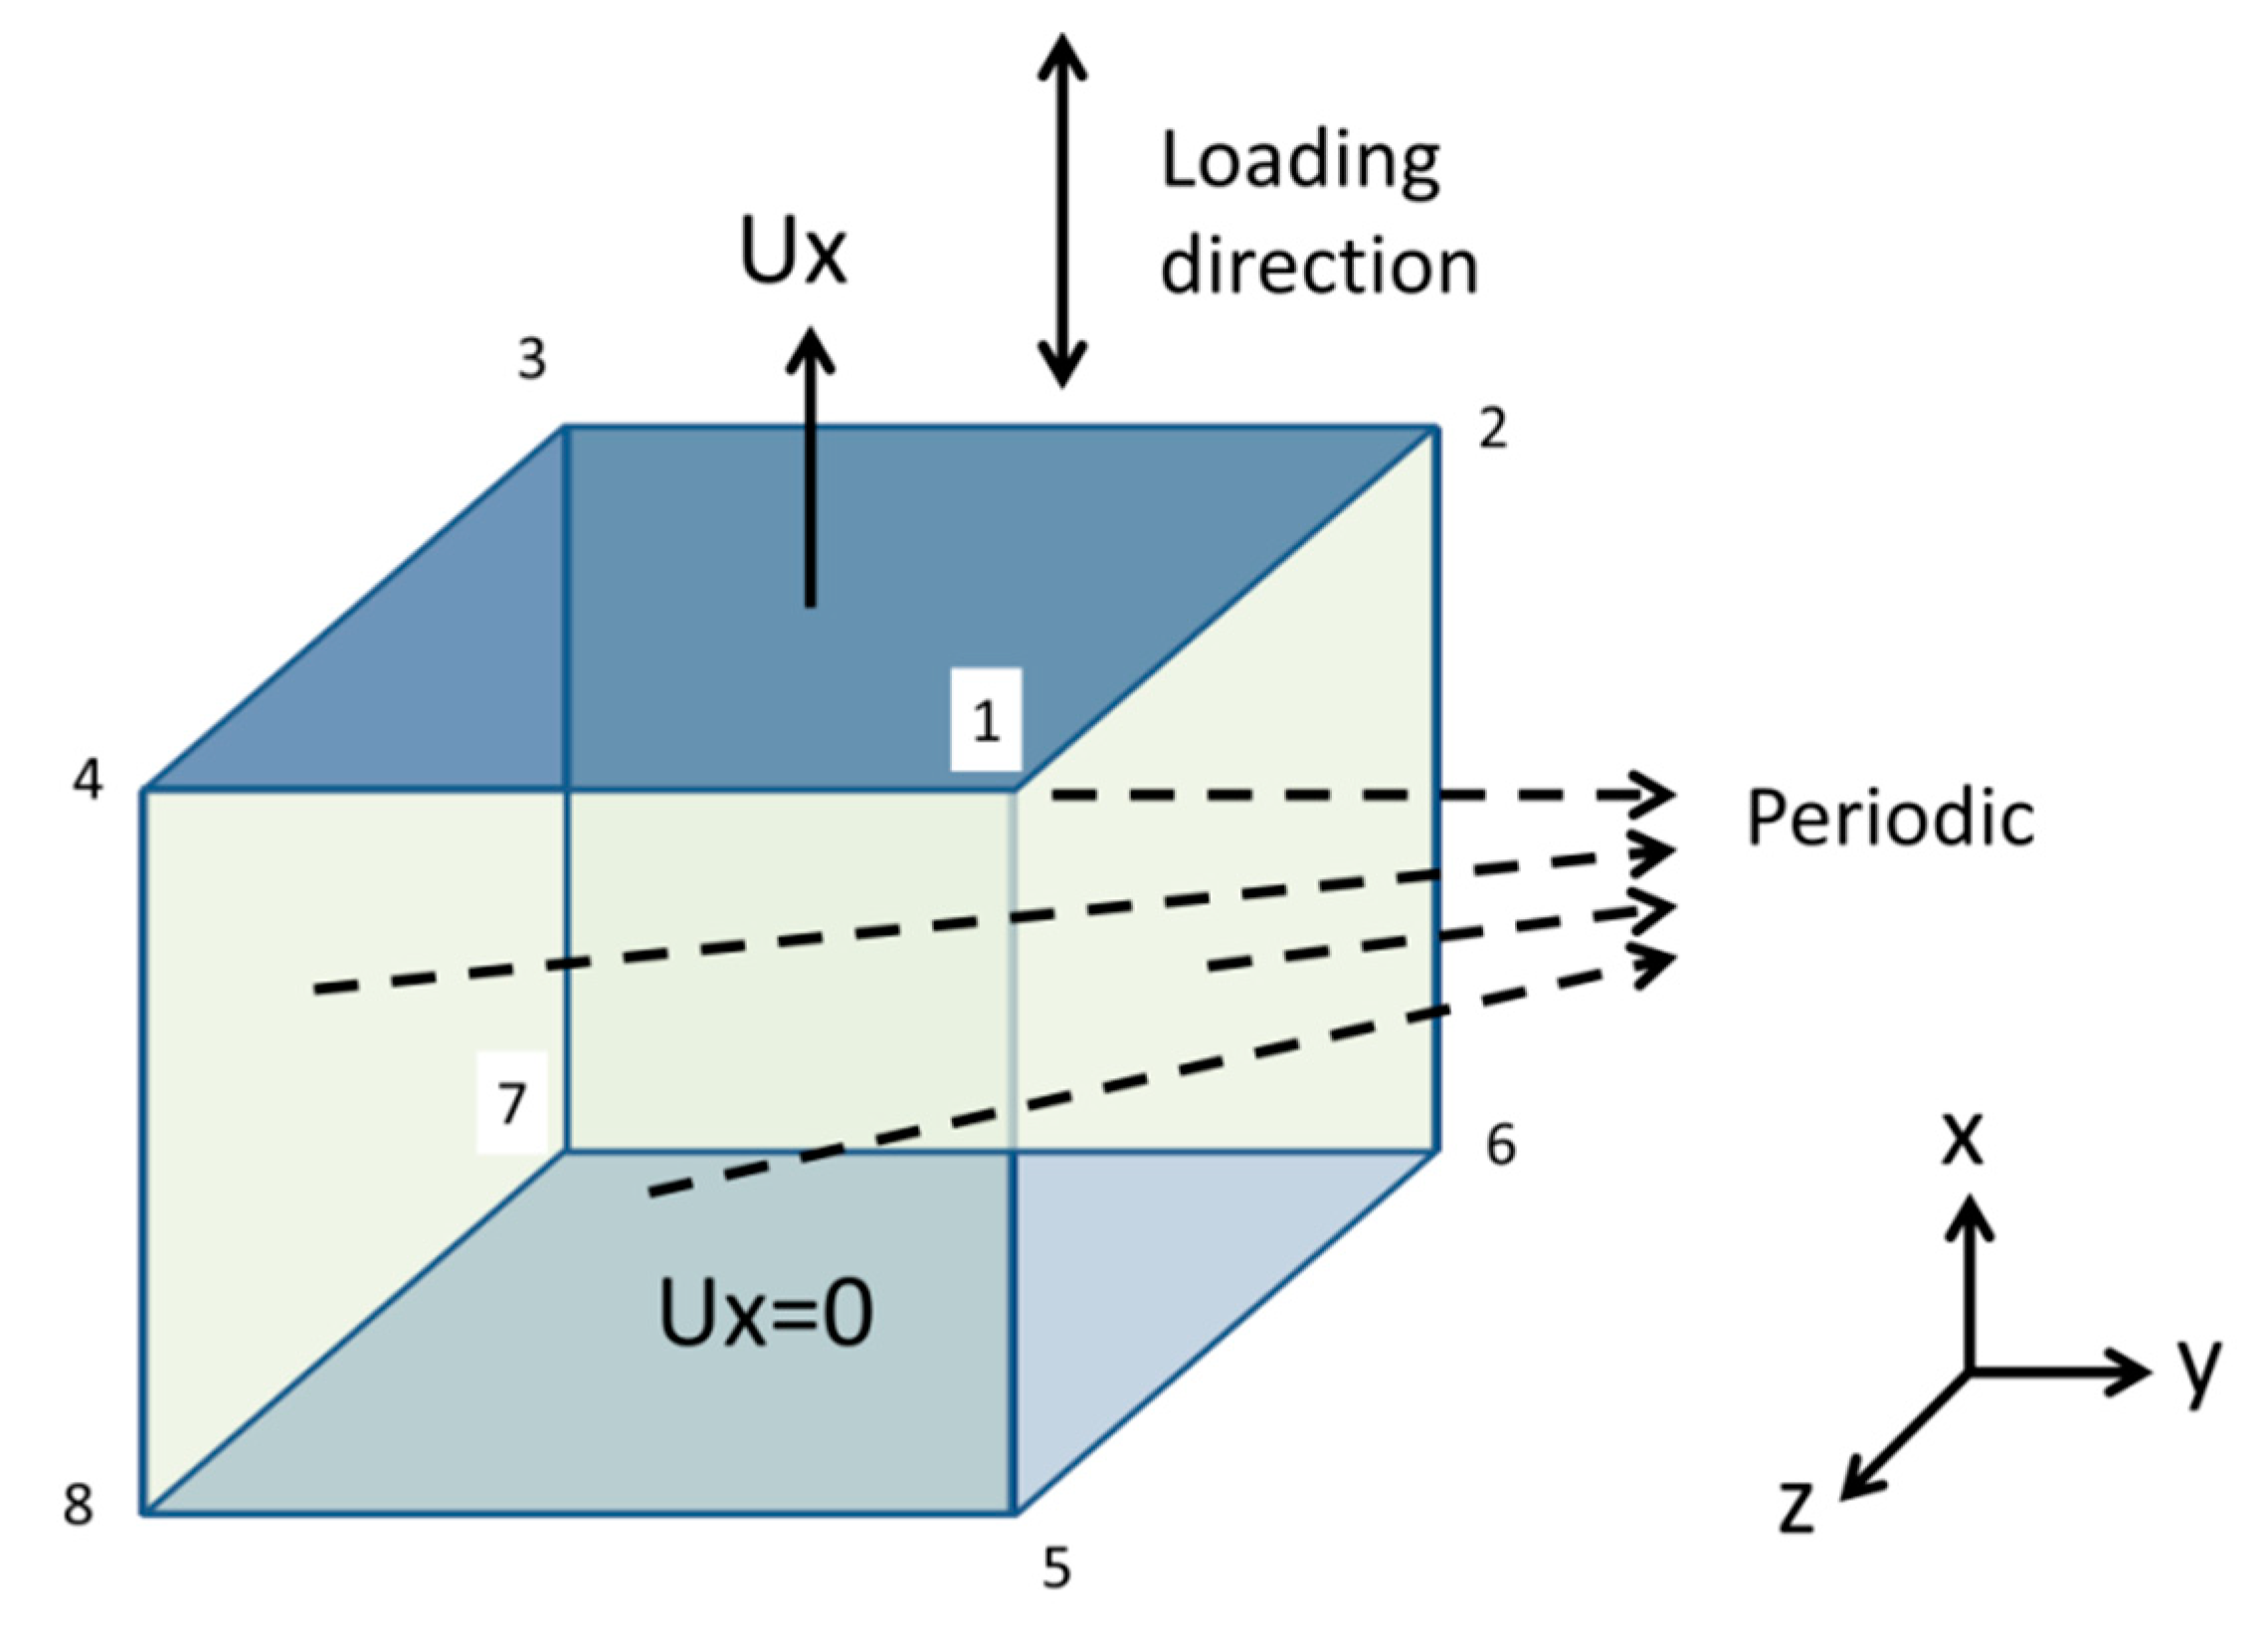
Figure 1. Boundary conditions for the representative volume elements (RVEs) [23].
Crystals 10 00905 g001
Figure 2. Calibration of coefficients by comparison of experimental data and simulation.
Crystals 10 00905 g002
Figure 3. Comparison of fatigue crack initiation life predicted by the proposed model and the Tanaka and Mura model [21].
Crystals 10 00905 g003
Table 1. The elastic constants ( C 11 , C 12 , and C 44 ), critical resolved shear stress ( g 0 ), and strain hardening modulus ( h 0 ) estimates.
C 11 C 12 C 44 g 0 h 0
230 GPa 170 GPa100 GPa0.42 GPa6.4 GPa
Table 2. Computation results of shear stress amplitude ( Δ τ 2 ) and plastic slip per cycle ( Δ γ p 2 ).
σ a Δ τ 2 Δ γ p 2
500 MPa412.4 MPa 1.2 × 10 5 MPa
600 MPa491.7 MPa 1.4 × 10 5 MPa
700 MPa578.6 MPa 2.1 × 10 4 MPa
Table 3. Comparing fatigue crack initiation life estimation with experimental data.
σ a ExperimentsSimulations
Average   ( μ ) Standard Deviation (SD)Upper Bound
( μ + D )
Lower Bound
( μ SD )
500 MPa 4.08 × 10 6 3.08 × 10 6 6.56 × 10 6 3.92 × 10 5 4.32 × 10 5
600 MPa 2.14 × 10 5 1.92 × 10 5 5.33 × 10 5 1.49 × 10 5 3.11 × 10 5
700 MPa 1.76 × 10 4 Benchmark