All-Optically Controllable Photonic Crystals Based on Chiral-Azobenzene-Doped Blue Phase Liquid Crystals
by
 , and
, and
Shun-An Jiang
1 ,
,
Chan-Hong Wu
1,
Ting-Shan Mo
2,
Shuan-Yu Huang
3,4,
Jia-De Lin
5,* and
Chia-Rong Lee
1,* 1
Department of Photonics, National Cheng Kung University, Tainan 70101, Taiwan
2
Department of Materials Engineering, Kun Shan University of Technology, Tainan 710303, Taiwan
3
Department of Optometry, Chung Shan Medical University, Taichung 402, Taiwan
4
Department of Ophthalmology, Chung Shan Medical University Hospital, Taichung 402, Taiwan
5
Department of Opto-Electronic Engineering, National Dong Hwa University, Hualien 97401, Taiwan
*
Authors to whom correspondence should be addressed.
Crystals 2020, 10(10), 906; https://doi.org/10.3390/cryst10100906
Submission received: 15 September 2020
/
Revised: 30 September 2020
/
Accepted: 4 October 2020
/
Published: 6 October 2020
(This article belongs to the Special Issue Photonic Crystals and Their Applications)
Abstract
:In this study, the all-optical control properties of photonic crystals based on self-assembled chiral-azobenzene-doped blue phase liquid crystals (CA-BPLCs) were investigated. The difference in the photothermal characteristics of CA-BPLCs with and without homogeneous surface alignment was discussed. Results revealed that surface alignment could induce more uniform and diverse blue phase (BP) structures, including BPII, BPI, and BPS-like phases during cooling. Consequently, the temperature range of BP was wider than that of the sample without surface alignment. All-optical control experiments with light illumination were then performed on the aligned or nonaligned CA-BPLC samples. During continuous irradiation with light beams at wavelengths of 405 and 450 nm, CA dopants underwent trans→cis and cis→trans back photoisomerizations, respectively. These processes promoted isothermal phase transition and wavelength shifting, which further enabled the all-optical control of the CA-BPLC samples. Various optical control modes of BPLC could be achieved through phase change and wavelength shifting by appropriately selecting the working temperature and surface treatment of BPLC. This study could be further used as a basis for developing photoswitchable and tunable BPLC photonic devices, such as light-controllable gratings, filters, mirrors, and lasers.

1. Introduction
Liquid crystals (LCs) have been widely applied to various fields, such as flat panel displays [1,2], electro-optical devices [3,4,5], biological [6,7] or environmental sensors [8,9], and topological defects [10,11] in a micrometer scale. Blue phase LCs (BPLCs) are among the most promising materials for advanced applications because of their superior characteristics, such as self-assembled three-dimensional (3D) photonic structure and fast response time [12,13,14,15]. Blue phases (BPs) are mesophases existing in a specific temperature range between a chiral nematic phase and an isotropic phase in a chiral LC system. Three different types of BPLC structures, namely BPIII, BPII, and BPI, can be observed when a chiral LC system is cooled from the isotropic phase. BPIII is amorphous, and BPI and BPII have cubic structures, corresponding to body-centered and simple cubic symmetries, respectively. The self-assembly 3D cubic structures of BPI and BPII are composed of orderly stacked double-twisted cylinders; thus, cubic BPLCs can be regarded as photonic crystals (PhCs) that possess a unique photonic bandgap (PBG) and show colorful reflection characteristics [16].
In general, the reflection color and phase transition of a BPLC can be easily controlled via temperature modulation, so a BPLC can be regarded as a thermally tunable 3D PhC [10]. However, the response time of temperature-controlled methods is limited by the relatively slow growth rate of the BP lattice. With the increasing electric field, BPLCs can be modulated by applying an electric field, resulting in the Kerr effect, electrostriction effect, and electric-field-induced phase change [17,18,19,20]. Although BP can be rapidly regulated by applying an external electric field, the applied voltage needed to drive BP is still high, and conductive layers with electrodes should be prepared on substrates. For electrically driven BP with complex patterns, complicated and designed electrodes are required [21]. Optically driven BPLCs are ideal candidates that can be prepared by doping optically sensitive azobenzene materials into BPLC to overcome these limitations and achieve wireless remote control. Only a few studies have involved the optical control of BPLC systems. Chanishvili et al. [22] first qualitatively studied the relation between the optothermal features of BPLCs and the photoisomerization effect through reflective spectral analyses based on the mixtures of a large number of photoactive nematic host materials (52 wt%–76.5 wt%) and photo-inertia chiral dopants. Liu et al. [23] demonstrated a binary cholesteric LC(CLC)/BPLC texture fabricated using phototunable chirality in an azo-chiral-doped CLC system. Lin et al. [24] reported the optical tuning of PBG of BPLCs by doping a few azo-chiral materials into BPLCs. They successfully tuned the PBG of BPLCs reversibly in the visible region with light illuminations by inducing the isomerization of the dopants, which finally change the lattice size of BP [24]. Lin et al. [25] further demonstrated an all-optically fast-controllable photonic bandgap (PBG) device and laser based on a dye-doped BPLC with low-concentration azobenzene LCs. This system should be more comprehensively studied and further discussed to explore the multiple effects of more parameters on the optical functions of BPLCs and their available operating modes of light control and to enhance their potential applications.
In this study, the basic optical properties of chiral azobenzene (CA)-doped BPLCs (CA-BPLCs) with and without homogeneous surface alignment and their optical control functions were investigated through reflective spectral analyses and polarizing optical microscope (POM) image observation. Experimental results indicated that surface alignment is critical in determining the basic optical properties of CA-BPLCs and their optical control behavior. The surface alignment in BPLCs is beneficial to the growth of diverse and uniform BPLC lattices and a wide temperature range to sustain in BP compared with the sample without surface alignment. Four operation modes depending on the conditions of working temperature and surface alignment are available for optically controlling the PBG feature of the present CA-BPLC samples. The mechanism of the reversible and repeatable optical control of CA-BPLCs is isothermal phase transition based on the photoisomerization of CA dopants.
2. Materials and Methods
The materials used in this study are nematic host (65 wt% HTW11420-100; Fusol Material), left-handed chiral dopant (32.5 wt% S811; Merck), and left-handed CA dopant (2.5 wt% Chad-2-S; BEAM). The chemical structure and variation in the absorption spectra of the CA dopant (0.1 wt% in THF) under UV irradiation (300 μW/cm2 for 2 minutes) are shown in Figure S1a,b in the Supplementary Materials. Generally, CA molecules are all stably in the rod-like trans state with two absorption transition peaks of π–π* and n–π* located at about 355 and 442 nm, respectively [26]. After UV irradiation, the trans isomers effectively transit to cis ones such that the former peak decreases while the latter peak increases. Upon UV irradiation for 2 min, the absorption spectrum becomes less changed because of the dynamic equilibrium between the concentrations of the trans and cis isomers. The mixtures are injected into home-made 12 μm-thick empty cells to prepare CA-BPLC samples. Each empty cell is composed of two pieces of a glass substrate with Mylar spacers in between. Two types of samples with and without homogeneous alignment are fabricated. For the sample with surface alignment, the glass substrates are precoated with polyvinyl alcohol and anti-parallelly rubbed with fabric before an empty cell is assembled. For the sample without surface alignment, only bare glass substrates without coating and rubbing are assembled as the empty cell. One POM (IX-71; Olympus) with a hot stage (LTS-120; Linkem) is used to observe the LC structure with a controllable temperature in each sample. Each CA-BPLC sample is first heated to an isotropic state and then cooled at a cooling rate of 0.1 °C/min to observe the variation in the POM images of the sample. The reflection spectra of each sample at various temperatures are also obtained.
Two light sources with different wavelengths are employed to induce the reversible photoisomerization of the CA dopants and carry out the light-controlled changes in each CA-BPLC sample. As shown in Figure S2, one laser diode with a wavelength of 405 nm and one LED with a central wavelength of 450 nm are installed in the reflection setup as trigger sources for inducing the trans-cis and cis-trans back photoisomerizations of CA dopants, respectively. The intensities of the 450 nm LED and the 405 nm laser diode are fixed at 180 and 100 μW/cm−2, respectively. A halogen light source (LS-1, from Ocean) and a fiber-based spectrometer (Jaz-Combo-2, from Ocean) are set to obtain the reflection spectra of the samples.
3. Results and Discussion
3.1. Basic Optical Properties of CA-BPLC Samples with and without Surface Alignment
Before the all-optical control capability of the CA-BPLC samples is studied, their basic optical properties should be understood in advance. During the experiment, the sample is first heated to an isotropic state, and the temperature is slowly lowered at a rate of 0.1 °C/min. After the temperature decreases by 0.1 °C, the sample is allowed to stand for 1 min to stabilize its overall temperature before the POM image and the reflection spectrum of the sample are recorded. Figure 1a shows the reflective-type polarizing optical microscopic (R-POM) images of the CA-BPLC sample with surface alignment during the cooling process. As shown in Figure 1a, the sample is preheated to the isotropic phase when the temperature is higher than 51.5 °C. When the temperature decreases to 49.2 °C, a uniformly blue color appears and remains until 48.4 °C. When the temperature decreases from 48.4 °C to 48.1 °C and from 48.1 °C to 45.8 °C, the color abruptly turns into green and then gradually red -shifts, respectively. The abrupt color change indicates that the sample undergoes a phase transition from BPII to BPI. This result suggests that the phase at 49.2–48.4 °C prior to the phase change is BPII. When the temperature further decreases, BP gradually vanishes as the planar chiral nematic phase with oily streaks gradually appears. Figure S3a and Figure 1c show the reflection spectra at various temperatures and the corresponding variation in the wavelength of the reflection peak during the cooling process, respectively, based on the aligned CA-BPLC sample. When the temperature slowly cools down to 51.3 °C from 51.5 °C, a low reflection peak of BPII can be measured at around 485 nm. As temperature further decreases to 48.2 °C, another reflection peak forms at 540 nm, which implies that a part of the region in the CA-BPLC transforms into BPI. As the temperature continuously decreases, BPII disappears and completely transforms into BPI. The reflection peak of BPI continues to red-shift to 583 nm until 46.3 °C is reached. The red shifting of the reflection wavelength during cooling at this stage (48.2 °C to 46.3 °C) corresponds to the thermally dependent pitch variation in the chiral material in most chiral nematic systems, including the present system, that is, dP/dt < 0. Then, a turning point occurs, that is, the reflection peak of the BPI blue-shifts gradually as the CLC texture gradually appears at lower than 46.3 °C (see the curve at 46.3 °C). The anomalous blue shifting of the reflection peak with the decreasing temperature (dP/dt > 0) at this stage (the temperature range in which BPI and CLC coexist) is similar to the trend occurring in the BPS of a BP system [27]. However, the wavelength jump that usually occurs when the phase changes from BPI to BPS is not obvious in the BPS-like phenomenon. However, this unusual phenomenon should be further explored.
A similar cooling process is carried out on the CA-BPLC sample without surface alignment, as shown in the variation in the R-POM image of the nonaligned sample in Figure 2b. The dark image indicates that the sample is in the isotropic state at 51.5 °C. When the temperature is below 51.5 °C, a few small blue fragments appear until 48.8 °C is reached. This easily ignored phase is BPII. Once the temperature is below 48.8 °C, the phase begins to transform to BPI in which numerous large green fragments appear in the nonaligned cell. As temperature decreases to 45.8 °C, BPI sustains its fragmented texture and continues to red-shift to the red region. When the temperature is lower than 45.6 °C, the red BPI phase locally changes into the green BPS-like phase and then into a focal-conic texture as the temperature continues to decrease. At 45.1 °C, almost all the BPI phases disappear, leaving only a few BPS-like fragments. When 44.9 °C is reached, BP fully disappears. Figure S3b and Figure 1d show the reflection spectra at various temperatures and the corresponding variation in the wavelength of the reflection peak during the cooling process, respectively, based on the nonaligned CA-BPLC sample. Apparently, no valid reflection spectrum can be obtained in the ignorable BPII and the transient BPS-like phenomenon. Therefore, the workable phase for the nonaligned sample is BPI. The valid reflection spectra of BPI can be obtained from 48.6 °C to 45.8 °C, at which the reflection peak red-shifts from 550 nm to 629 nm. Here, the strong anisotropic anchoring force from the surface alignment can result in a more uniform formation of the BP crystal structure in the aligned BP cell, which can also be found in previous studies [28,29,30,31,32,33,34,35]. In addition to BPI, the complete BPII and BPS-like phase can be effectively induced by the anisotropic anchoring force from the surface alignment [32,36], thereby extending the entire BP temperature range of the aligned sample. However, this result does not occur in the nonaligned CA-BPLC sample; that is, the isotropic anchoring force from the nonaligned surface of the cell cannot provide the stabilizing effect for generating the uniformly ordered simple cubic crystalline structures of BPII and BPS-like phase.
The associated Kossel diagrams of the samples are measured to identify the phase and the lattice planes of the BPs in the samples. The insets in Figure 1c,d illustrate the measured Kossel diagrams of the aligned sample at 51 °C and 47.9 °C and the nonaligned sample at 47.5 °C, respectively. Based on the previous literature [37], the Kossel lines shown in the Kossel diagrams of the aligned sample at 51 °C and 47.9 °C (or the nonaligned sample at 47.5 °C) indicate that the miller indices of the crystal planes of BPII and BPI are (100) and (110), respectively. The peak wavelength of the reflection of a cubic BP can be determined using Bragg’s Equation [38]:
where a is the lattice constant of the BP lattice structure, (h k l) are the Miller indices of the lattice planes, and n is the average index of refraction of BP. For example, the peak wavelength of the reflection of the BP of the aligned sample at 51.0 °C is around 470 nm. After 470 nm, (h k l) = (100), and n 1.62 are substituted into Equation (1), the lattice constant of the BP of the aligned sample can be calculated to be approximately 145 nm, which matches well with the half value of the pitch. For this reason, the BP resulting in the reflection at 51.0 °C must be BPII. The BPI occurring in either the aligned or nonaligned sample can also be verified in a similar way.
3.2. Photo-Control of CA-BPLC Samples
In addition to internal conditions, such as surface alignment of the sample that can significantly affect the BP properties, external conditions, including the added CA dopant, can influence the optical responses of BPLC under light irradiation [39]. With this advantage, the samples can be placed in different phases to obtain different photocontrol ways. As shown in Figure 2a, when the aligned CA-BPLC sample is kept at BPII (T = 51.0 °C which is near the BPII-isotropic transition point) and illuminated with a 405 nm laser beam, BPII optically and gradually transforms into the isotropic phase. Therefore, the reflectance decreases as the illumination time becomes prolonged, but the peak wavelength of the reflection only slightly red-shifts (<7 nm), as shown in Figure 2c. When successively irradiated with a 450 nm LED light, the CA-BPLC gradually returns from the isotropic phase to BPII, as shown in Figure 2b. The switchable reflectance here has potential for the applications of a switchable mirror or a filter. The CA-BPLC sample with surface alignment is successively illuminated with a laser diode and LED for several cycles to test the repeatability and response time of the optically controlled phase change. As shown in Figure 2d, the CA-BPLC exhibits good repeatability even after several cycles of optical control. Switching from BPII to the isotropic phase and reversing from the isotropic phase to BPII take about 40 and 60 s, respectively. These switched times can be shortened by increasing the intensities of the light sources or the concentration of the CA dopants. Notably, the reflective wavelength of the aligned sample cannot return to the original one after the first round of the optical control. This phenomenon is described as follows. Initially, all CA molecules in the sample are in the trans state in the dark. After 405 nm laser irradiation, most trans CA isomers in the irradiated region can transform into the cis state. The successive 450 nm LED light irradiation prior to the 405 nm laser irradiation tends to excite the cis isomers to revert to the trans state. However, a dynamic balance between the concentrations of the trans and cis isomers after the first round of the optical control is achieved because of the unignorable absorption of the trans isomers at 450 nm, as shown in Figure S1b; consequently, the reflection wavelength of the aligned sample slightly red-shifts relative to that in the initial state. The performance of all the rounds of optical control except the first round are quite similar, as shown in Figure 2d.
If the optical control of the aligned CA-BPLC sample is carried out at BPI, the sample exhibits different photocontrol phenomena. As shown in Figure 3a, when the aligned CA-BPLC sample is kept at 47.5 °C, which is near the BPI–BPII transition point, and illuminated with the 405 nm laser beam, the color of the R-POM image changes from green to blue. With the aid of the reflection spectra shown in Figure 3c, the central wavelength of the reflection blue shifts abruptly from around 560 nm to 470 nm. The abrupt color change is attributed to the phase transition from BPI to BPII. If the sample is consecutively illuminated with the 450 nm LED, the sample can be optically transformed back to BPI, as shown in Figure 3b. The all-optically controlled phase transitions of the aligned CA-BPLC sample is repeatable, as demonstrated in Figure 3d. This operation mode is suitable for various applications, such as controllable dichroic mirrors or filters.
When the aligned CA-BPLC sample is kept at 46.5 °C at which the sample is still in BPI but far from the BPI–BPII transition point and illuminated with the 405 nm laser, the color of the R-POM image of the sample transforms from yellow to green, blue, and black, as shown in Figure 4a–e. The variation in the reflection wavelength with illumination time is plotted in Figure 4f. Notably, the trends of the successive wavelength-shifting and phase transition at different working temperatures shown in Figure 2, Figure 3 and Figure 4 are different from that described in a previous literature based on a similar BP system with a different type of CA dopant [24]. However, the trend is similar to that of a general BP sample during heating. Additional experimental results also confirm that the increase in the temperature of the sample can be ignored during excitation with the 405 nm laser. Therefore, the optically controlled wavelength shifting and phase transition of the aligned CA-BPLC sample with surface alignment is attributed to the mechanism of isothermal phase transition [40]. Normally, rod-like trans AC dopants can be aligned with their adjacent LC molecules because of guest–host effect [41,42,43]. As such, the orientations of the LC molecules in the CA-BPLC can be retained. As the 405 nm laser photons are absorbed by massive trans CA molecules, they are excited to the curve cis form. On the contrary, the bent structure of the massive cis molecules may significantly disturb the arrangement of LC molecules and reduce the order parameter. A cis molecule in the system can be considered an impurity. When numerous impurities are present, the phase transition temperature of the system relatively decreases, as shown in the schematic in Figure 5. Thus, the irradiation of the 405 nm laser-induced mechanism of isothermal phase transition leads to the occurrence of the successive wavelength shifting and phase transition illustrated in Figure 2, Figure 3 and Figure 4.
Figure S4 shows the phototuning behavior of the nonaligned CA-BPLC samples with three different concentrations of CA dopants (1.0 wt%, 2.5 wt%, and 5.0 wt%) during the continuous illumination of 405 nm laser for 45, 38, and 26 s, respectively (T = 45.8 °C). The corresponding concentrations of S811 in the three samples are 34 wt%, 32.5 wt%, and 30 wt%, respectively, and the concentration of NLC is fixed at 65 wt%. Apparently, the tuning speed is faster, but the diversity of the tuning range becomes reduced as the doping concentration of CA increases. The nonaligned sample with 1.0 wt% CA dopant is selected to obtain the widest tuning range of reflection. Figure 6a–e shows the R-POM images of the 1.0 wt% CA-BPLC sample without surface alignment during the illumination of 405 nm laser. The initial reflection peak of the BPI is at about 640 nm before light irradiation. The reflection color gradually blue shifts as the irradiation time is prolonged. At 45 s, it blue-shifts to the peak at about 540 nm. The tuning range of reflection of the nonaligned sample is much wider than that the CA-BPLC sample with surface alignment because of the much weaker anchor from the nonaligned substrate surfaces. For example, the tunable range of the reflection of the aligned CA-BPLC sample is only 40 nm at BPI (46.5 °C), as illustrated in Figure 4f. Conversely, the tunable range of the reflection of the nonaligned sample is as wide as 100 nm, as described in Figure 6f. Therefore, the nonaligned CA-BPLC is better than the aligned CA-BPLC for developing optically broadband-tunable photonic devices.
4. Conclusions
This study investigated the variations in the LC textures and optical properties of CA-BPLCs by changing the surface alignment treatment of the sample and adding photosensitive CA dopants. Experimental results confirm that the anisotropic anchoring force from the inner surfaces of the sample can stabilize the effective formation of the diverse crystalline structures of BP, including BPII, BPI, and BPS-like phase. This force can also expand the temperature range of BP. For this reason, the temperature range of the BP with a strong reflection property in a homogeneously aligned sample is significantly wider than that of a nonaligned sample. The homogeneously aligned CA-BPLC can be all-optically controlled among BPI, BPII, and isotropic phase via the reversible trans–cis and cis–trans back isomerizations of the CA dopants under the successive illumination of light sources with short and long wavelengths. The optically reversible control of the aligned CA-BPLC is repeatable. On the contrary, the nonaligned CA-BPLC cell shows a wider wavelength tunability in reflection because of the weak surface anchor. This study also provides a basis for designing various applications of controllable photonic devices, such as optically switchable and tunable BPLC gratings, lasers, filters, and mirrors.
Supplementary Materials
The following are available online at https://www.mdpi.com/2073-4352/10/10/906/s1, Figure S1: (a) Chemical structure of the chiral azobenzene Chad-2-S and (b) variation of its absorption spectrum (solved in THF with 0.1 wt%) measured during the UV irradiation of 300 μW/cm2 for 2 minutes. Figure S2: Experimental setup for optically controlling the CA-BPLC samples. P1 and P2 both are polarizers, which are set crossed. BS and M represent beam splitter and mirror, respectively. Figure S3: Reflection spectra of (a) aligned and (b) non-aligned CA-BPLC samples measured at various temperatures in cooling. Figure S4: R-POM images of non-aligned CA-BPLC samples with various concentrations of CA dopants (1, 2.5, and 5 wt%) during the illumination of 405 nm laser.
Author Contributions
S.-A.J. conceived the idea; S.-A.J. and C.-H.W. performed the experiments; J.-D.L., T.-S.M., and C.-R.L. analyzed the data through detailed discussion; S.-A.J., J.-D.L., and C.-R.L. wrote the draft; C.-R.L. supervised the project. S.-Y.H. provided resources and useful ideas for this research. All authors have read and agreed to the published version of the manuscript.
Funding
This research was funded by Ministry of Science and Technology, Taiwan (Contract numbers: MOST 109-2221-E-006-208-MY3 and MOST 109-2112-M-006-014-MY3).
Acknowledgments
The authors would like to thank the Ministry of Science and Technology, Taiwan (Contract numbers: MOST 109-2221-E-006-208-MY3 and MOST 109-2112-M-006-014-MY3) for financially supporting this research.
Conflicts of Interest
The authors declare no conflict of interest. The founding sponsors had no role in the design of the study; in the collection, analyses, or interpretation of data; in the writing of the manuscript, or in the decision to publish the results.
References
- Huang, Y.; Hsiang, E.L.; Deng, M.Y.; Wu, S.T. Mini-LED, Micro-LED and OLED displays: Present status and future perspectives. Light Sci. Appl. 2020, 9, 105. [Google Scholar] [CrossRef] [PubMed]
- Chen, H.W.; Lee, J.H.; Lin, B.Y.; Chen, S.; Wu, S.T. Liquid crystal display and organic light-emitting diode display: Present status and future perspectives. Light Sci. Appl. 2018, 7, 17168. [Google Scholar] [CrossRef] [PubMed]
- Lin, J.D.; Wang, T.Y.; Mo, T.S.; Huang, S.Y.; Lee, C.R. Wide-band spatially tunable photonic bandgap in visible spectral range and laser based on a polymer stabilized blue phase. Sci. Rep. 2016, 6, 30407. [Google Scholar] [CrossRef] [PubMed] [Green Version]
- Lin, J.-D.; Huang, S.-Y.; Wang, H.-S.; Lin, S.-H.; Mo, T.-S.; Horng, C.-T.; Yeh, H.-C.; Chen, L.-J.; Lin, H.-L.; Lee, C.-R. Spatially tunable photonic bandgap of wide spectral range and lasing emission based on a blue phase wedge cell. Opt. Express 2014, 22, 29479–29492. [Google Scholar] [CrossRef]
- Lee, C.-R.; Lin, S.-H.; Guo, J.-W.; Lin, J.-D.; Lin, H.-L.; Zheng, Y.-C.; Ma, C.-L.; Horng, C.-T.; Sun, H.-Y.; Huang, S.-Y. Electrically and thermally controllable nanoparticle random laser in a well-aligned dye-doped liquid crystal cell. Opt. Mater. Express 2015, 5, 1469–1481. [Google Scholar] [CrossRef]
- Beeckman, J.; Neyts, K.; Vanbrabant, P.J.M. Liquid-crystal photonic applications. Opt. Eng. 2011, 50, 081202. [Google Scholar] [CrossRef] [Green Version]
- Chuang, C.H.; Lin, Y.C.; Chen, W.L.; Chen, Y.H.; Chen, Y.X.; Chen, C.M.; Shiu, H.W.; Chang, L.Y.; Chen, C.H.; Chen, C.H. Detecting trypsin at liquid crystal/aqueous interface by using surface-immobilized bovine serum albumin. Biosens. Bioelectron. 2016, 78, 213–220. [Google Scholar] [CrossRef]
- Chen, C.-H.; Lin, Y.-C.; Chang, H.-H.; Lee, A.S.-Y. Ligand-doped liquid crystal sensor system for detecting mercuric ion in aqueous solutions. Anal. Chem. 2015, 87, 4546–4551. [Google Scholar] [CrossRef]
- Ho, T.Y.; Lan, Y.H.; Huang, J.W.; Chang, J.J.; Chen, C.H. Using Diazotization reaction to develop portable liquid-crystal-based sensors for nitrite detection. ACS Omega 2020, 5, 11809–11816. [Google Scholar] [CrossRef]
- Kim, M.; Serra, F. Topological defect arrays in nematic liquid crystals assisted by polymeric pillar arrays: Effect of the geometry of pillars. Crystals 2020, 10, 314. [Google Scholar]
- Lavrentovich, O.D. Topological defects in dispersed words and worlds around liquid crystals, or liquid crystal drops. Liq. Cryst. 1998, 24, 117–126. [Google Scholar] [CrossRef]
- Etchegoin, P. Blue phases of cholesteric liquid crystals as thermotropic photonic crystals. Phys. Rev. E 2000, 62, 1435–1437. [Google Scholar] [CrossRef] [PubMed] [Green Version]
- Martínez-González, J.A.; Zhou, Y.; Rahimi, M.; Bukusoglu, E.; Abbott, N.L.; de Pablo, J.J. Blue-phase liquid crystal droplets. Proc. Natl. Acad. Sci. USA 2015, 112, 13195–13200. [Google Scholar] [CrossRef] [PubMed] [Green Version]
- Shamid, S.M.; Allender, D.W.; Selinger, J.V. Predicting a polar analog of chiral blue phases in liquid crystals. Phys. Rev. Lett. 2014, 113, 237801. [Google Scholar] [CrossRef]
- Huang, Y.; Chen, H.; Tan, G.; Tobata, H.; Yamamoto, S.-I.; Okabe, E.; Lan, Y.-F.; Tsai, C.-Y.; Wu, S.-T. Optimized blue-phase liquid crystal for field-sequential-color displays. Opt. Mater. Express 2017, 7, 641–650. [Google Scholar] [CrossRef]
- Lin, T.-H.; Chen, C.-W.; Li, Q. Self-organized 3D photonic superstructure: Blue phase liquid crystal. In Anisotropic Nanomaterials: Preparation, Properties, and Applications; Li, Q., Ed.; Springer International Publishing: Cham, Switzerland, 2015; pp. 337–378. [Google Scholar]
- Crooker, P.P. Plenary Lecture. The blue phases. A review of experiments. Liq. Cryst. 1989, 5, 751–775. [Google Scholar] [CrossRef]
- Guo, D.-Y.; Chen, C.-W.; Li, C.-C.; Jau, H.-C.; Lin, K.-H.; Feng, T.-M.; Wang, C.-T.; Bunning, T.J.; Khoo, I.C.; Lin, T.-H. Reconfiguration of three-dimensional liquid-crystalline photonic crystals by electrostriction. Nat. Mater. 2020, 19, 94–101. [Google Scholar] [CrossRef]
- Hisakado, Y.; Kikuchi, H.; Nagamura, T.; Kajiyama, T. Large Electro-optic kerr effect in polymer-stabilized liquid-crystalline blue phases. Adv. Mater. 2005, 17, 96–98. [Google Scholar] [CrossRef]
- Lu, S.-Y.; Chien, L.-C. Electrically switched color with polymer-stabilized blue-phase liquid crystals. Opt. Lett. 2010, 35, 562–564. [Google Scholar] [CrossRef]
- Rao, L.; Ge, Z.; Wu, S.-T.; Lee, S.H. Low voltage blue-phase liquid crystal displays. Appl. Phys. Lett. 2009, 95, 231101. [Google Scholar]
- Chanishvili, A.; Chilaya, G.; Petriashvili, G.; Collings, P.J. Trans-cis isomerization and the blue phases. Phys. Rev. E 2005, 71, 051705. [Google Scholar] [CrossRef] [PubMed] [Green Version]
- Liu, C.-K.; Huang, W.-L.; Fuh, A.Y.-G.; Cheng, K.-T. Binary cholesteric/blue-phase liquid crystal textures fabricated using phototunable chirality in azo chiral-doped cholesteric liquid crystals. J. Appl. Phys. 2012, 111, 103114. [Google Scholar] [CrossRef]
- Lin, T.H.; Li, Y.; Wang, C.T.; Jau, H.C.; Chen, C.W.; Li, C.C.; Bisoyi, H.K.; Bunning, T.J.; Li, Q. Red, green and blue reflections enabled in an optically tunable self-organized 3D cubic nanostructured thin film. Adv. Mater. 2013, 25, 5050–5054. [Google Scholar] [CrossRef] [PubMed]
- Lin, J.-D.; Lin, Y.-M.; Mo, T.-S.; Lee, C.-R. Photosensitive and all-optically fast-controllable photonic bandgap device and laser in a dye-doped blue phase with a low-concentration azobenzene liquid crystal. Opt. Express 2014, 22, 9171–9181. [Google Scholar] [CrossRef] [PubMed]
- Chen, L.-J.; Lin, J.-D.; Lee, C.-R. An optically stable and tunable quantum dot nanocrystal-embedded cholesteric liquid crystal composite laser. J. Mater. Chem. C 2014, 2, 4388–4394. [Google Scholar] [CrossRef]
- Demikhov, E.; Stegemeyer, H. Observation of a new metastable liquid-crystalline phase in supercooled blue phase systems. Liq. Cryst. 1991, 10, 869–873. [Google Scholar] [CrossRef]
- Jiang, S.-A.; Sun, W.-J.; Lin, S.-H.; Lin, J.-D.; Huang, C.-Y. Optical and electro-optic properties of polymer-stabilized blue phase liquid crystal cells with photoalignment layers. Opt. Express 2017, 25, 28179–28191. [Google Scholar] [CrossRef]
- Chen, P.-J.; Chen, M.; Ni, S.-Y.; Chen, H.-S.; Lin, Y.-H. Influence of alignment layers on crystal growth of polymer-stabilized blue phase liquid crystals. Opt. Mater. Express 2016, 6, 1003–1010. [Google Scholar] [CrossRef]
- Joshi, P.; Shang, X.; De Smet, J.; Islamai, E.; Cuypers, D.; Van Steenberge, G.; Van Vlierberghe, S.; Dubruel, P.; De Smet, H. On the effect of alignment layers on blue phase liquid crystals. Appl. Phys. Lett. 2015, 106, 101105. [Google Scholar] [CrossRef] [Green Version]
- Oton, E.; Netter, E.; Nakano, T.; Katayama, Y.D.; Inoue, F. Monodomain blue phase liquid crystal layers for phase modulation. Sci. Rep. 2017, 7, 44575. [Google Scholar] [CrossRef] [Green Version]
- Martinez-Gonzalez, J.A.; Li, X.; Sadati, M.; Zhou, Y.; Zhang, R.; Nealey, P.F.; de Pablo, J.J. Directed self-assembly of liquid crystalline blue-phases into ideal single-crystals. Nat. Commun. 2017, 8, 15854. [Google Scholar] [CrossRef] [PubMed] [Green Version]
- Manda, R.; Pagidi, S.; Heo, Y.; Lim, Y.J.; Kim, M.; Lee, S.H. Electrically tunable photonic band gap structure in monodomain blue-phase liquid crystals. NPG Asia Mater. 2020, 12, 42. [Google Scholar] [CrossRef]
- Yan, J.; Wu, S.-T.; Cheng, K.-L.; Shiu, J.-W. A full-color reflective display using polymer-stabilized blue phase liquid crystal. Appl. Phys. Lett. 2013, 102, 081102. [Google Scholar] [CrossRef] [Green Version]
- Chen, Y.; Wu, S.-T. Electric field-induced monodomain blue phase liquid crystals. Appl. Phys. Lett. 2013, 102, 171110. [Google Scholar] [CrossRef] [Green Version]
- Bukusoglu, E.; Martinez-Gonzalez, J.A.; Wang, X.; Zhou, Y.; de Pablo, J.J.; Abbott, N.L. Strain-induced alignment and phase behavior of blue phase liquid crystals confined to thin films. Soft Matter 2017, 13, 8999–9006. [Google Scholar] [CrossRef]
- Miller, R.J.; Gleeson, H.F. Lattice parameter measurements from the Kossel diagrams of the cubic liquid crystal blue phases. J. Phys. II France 1996, 6, 909–922. [Google Scholar] [CrossRef]
- Kikuchi, H. Liquid crystalline blue phases. Struct. Bond. 2008, 128, 99–117. [Google Scholar]
- Lin, J.-D.; Hsieh, M.-H.; Wei, G.-J.; Mo, T.-S.; Huang, S.-Y.; Lee, C.-R. Optically tunable/switchable omnidirectionally spherical microlaser based on a dye-doped cholesteric liquid crystal microdroplet with an azo-chiral dopant. Opt. Express 2013, 21, 15765–15776. [Google Scholar] [CrossRef]
- Natansohn, A.; Rochon, P. Photoinduced motions in azo-containing polymers. Chem. Rev. 2002, 102, 4139–4176. [Google Scholar] [CrossRef]
- Ringsdorf, H.; Schmidt, H.-W. Electro-optical effects of azo dye containing liquid crystalline copolymers. Makromol. Chem. 1984, 185, 1327–1334. [Google Scholar] [CrossRef]
- Wang, J.-R.; Lee, C.-R.; Lee, M.-R.; Fuh, A.Y.G. Photorefractive effect induced by polarization gratings in dye-doped liquid crystals. Opt. Lett. 2004, 29, 110–112. [Google Scholar] [CrossRef] [PubMed]
- Hsiao, Y.C.; Huang, K.C.; Lee, W. Photo-switchable chiral liquid crystal with optical tristability enabled by a photoresponsive azo-chiral dopant. Opt. Express 2017, 25, 2687–2693. [Google Scholar] [CrossRef] [PubMed] [Green Version]
Figure 1.
Reflective-type polarizing optical microscopic (R-POM) images of the chiral-azobenzene-doped blue phase liquid crystals (CA-BPLC) samples (a) with and (b) without surface alignment during cooling. The length of the scale bar is 100 μm. Variation in the peak wavelength of the reflection of the CA-BPLC samples (c) with and (d) without surface alignment. The three insets in (c,d) are the Kossel diagrams for the aligned sample measured at 51 °C and 47.9 °C and the nonaligned sample measured at 47.5 °C, respectively.

Figure 2.
R-POM images of the aligned CA-BPLC sample during the successive illumination of (a) 405 nm laser and (b) 450 nm LED light source at BPII (T = 51.0 °C). The length of the scale bar is 100 μm. (c) The corresponding reflection spectra of the images presented in (a). (d) Repeatability test of the optically controlled phase change between BPII and the isotropic phase.
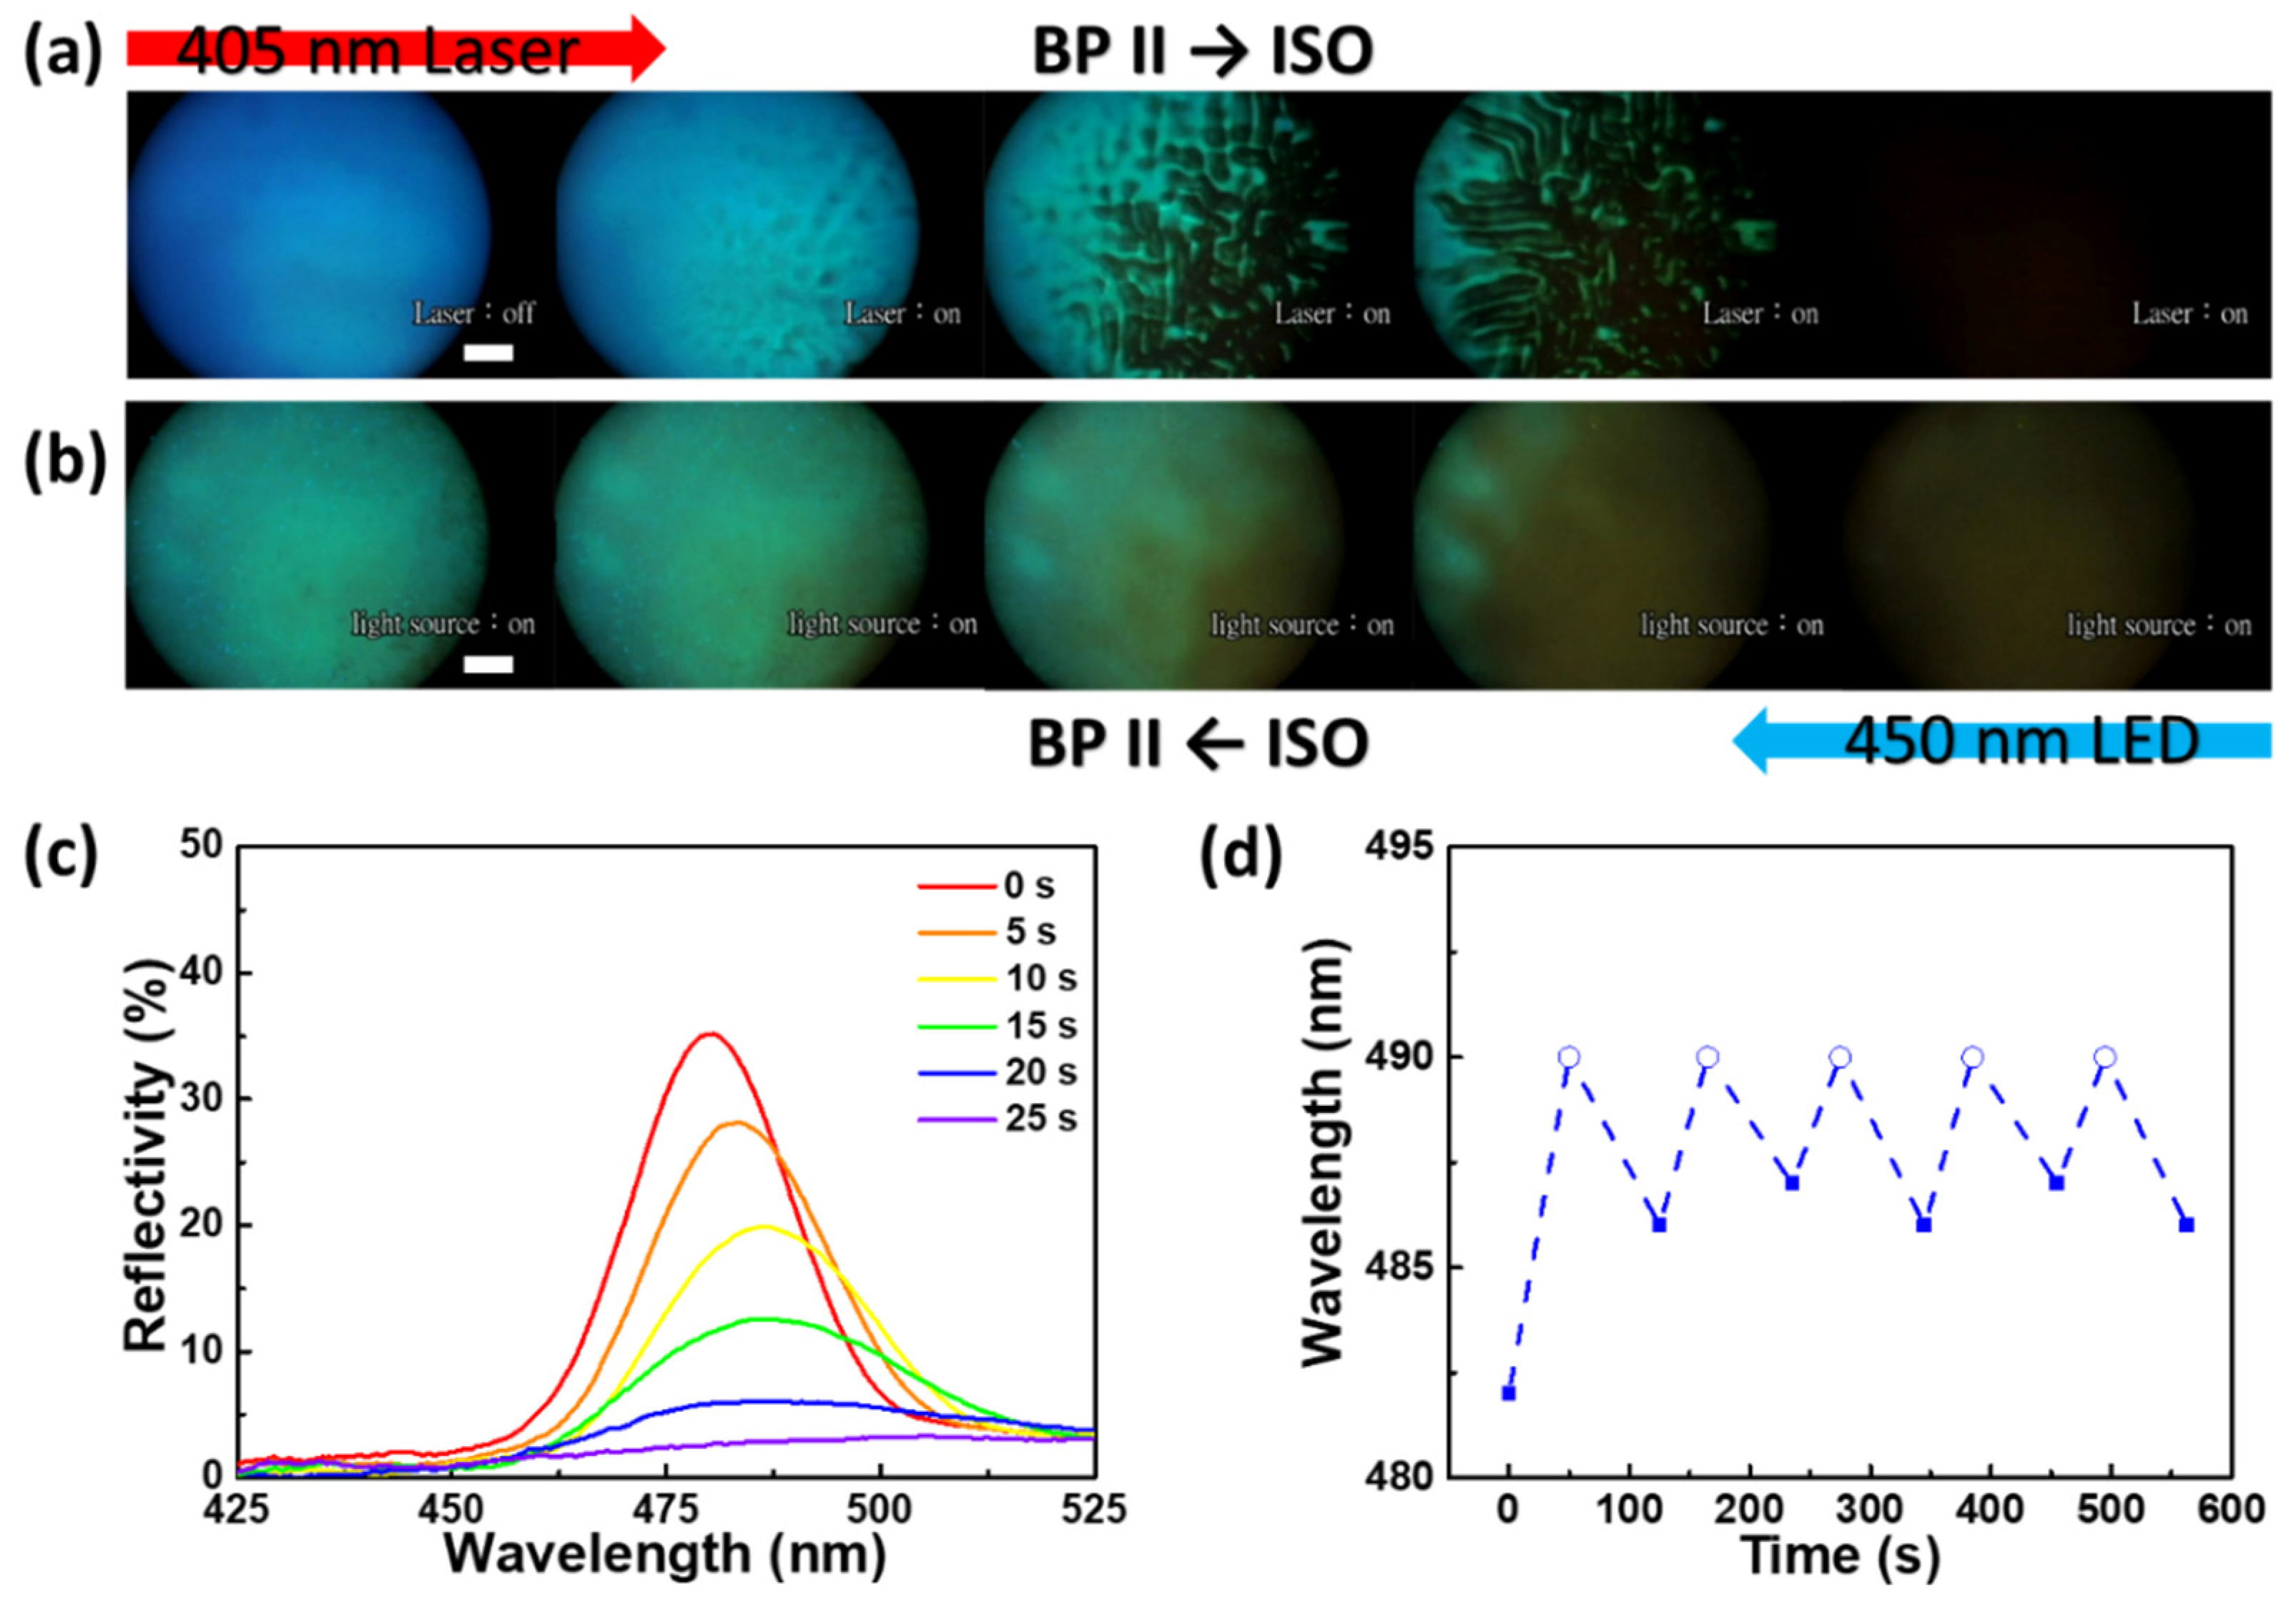
Figure 3.
R-POM images of the aligned CA-BPLC sample with surface alignment during the (a) illumination of 405 nm laser and (b) 450 nm LED light source at BPI. The length of the scale bar is 100 μm. (c) The optically controlled reflection spectra of the CA-BPLC sample at BPI. (d) Repeatability test of the optically controlled reflection between two different color regions. The temperature is fixed at 47.5 °C.
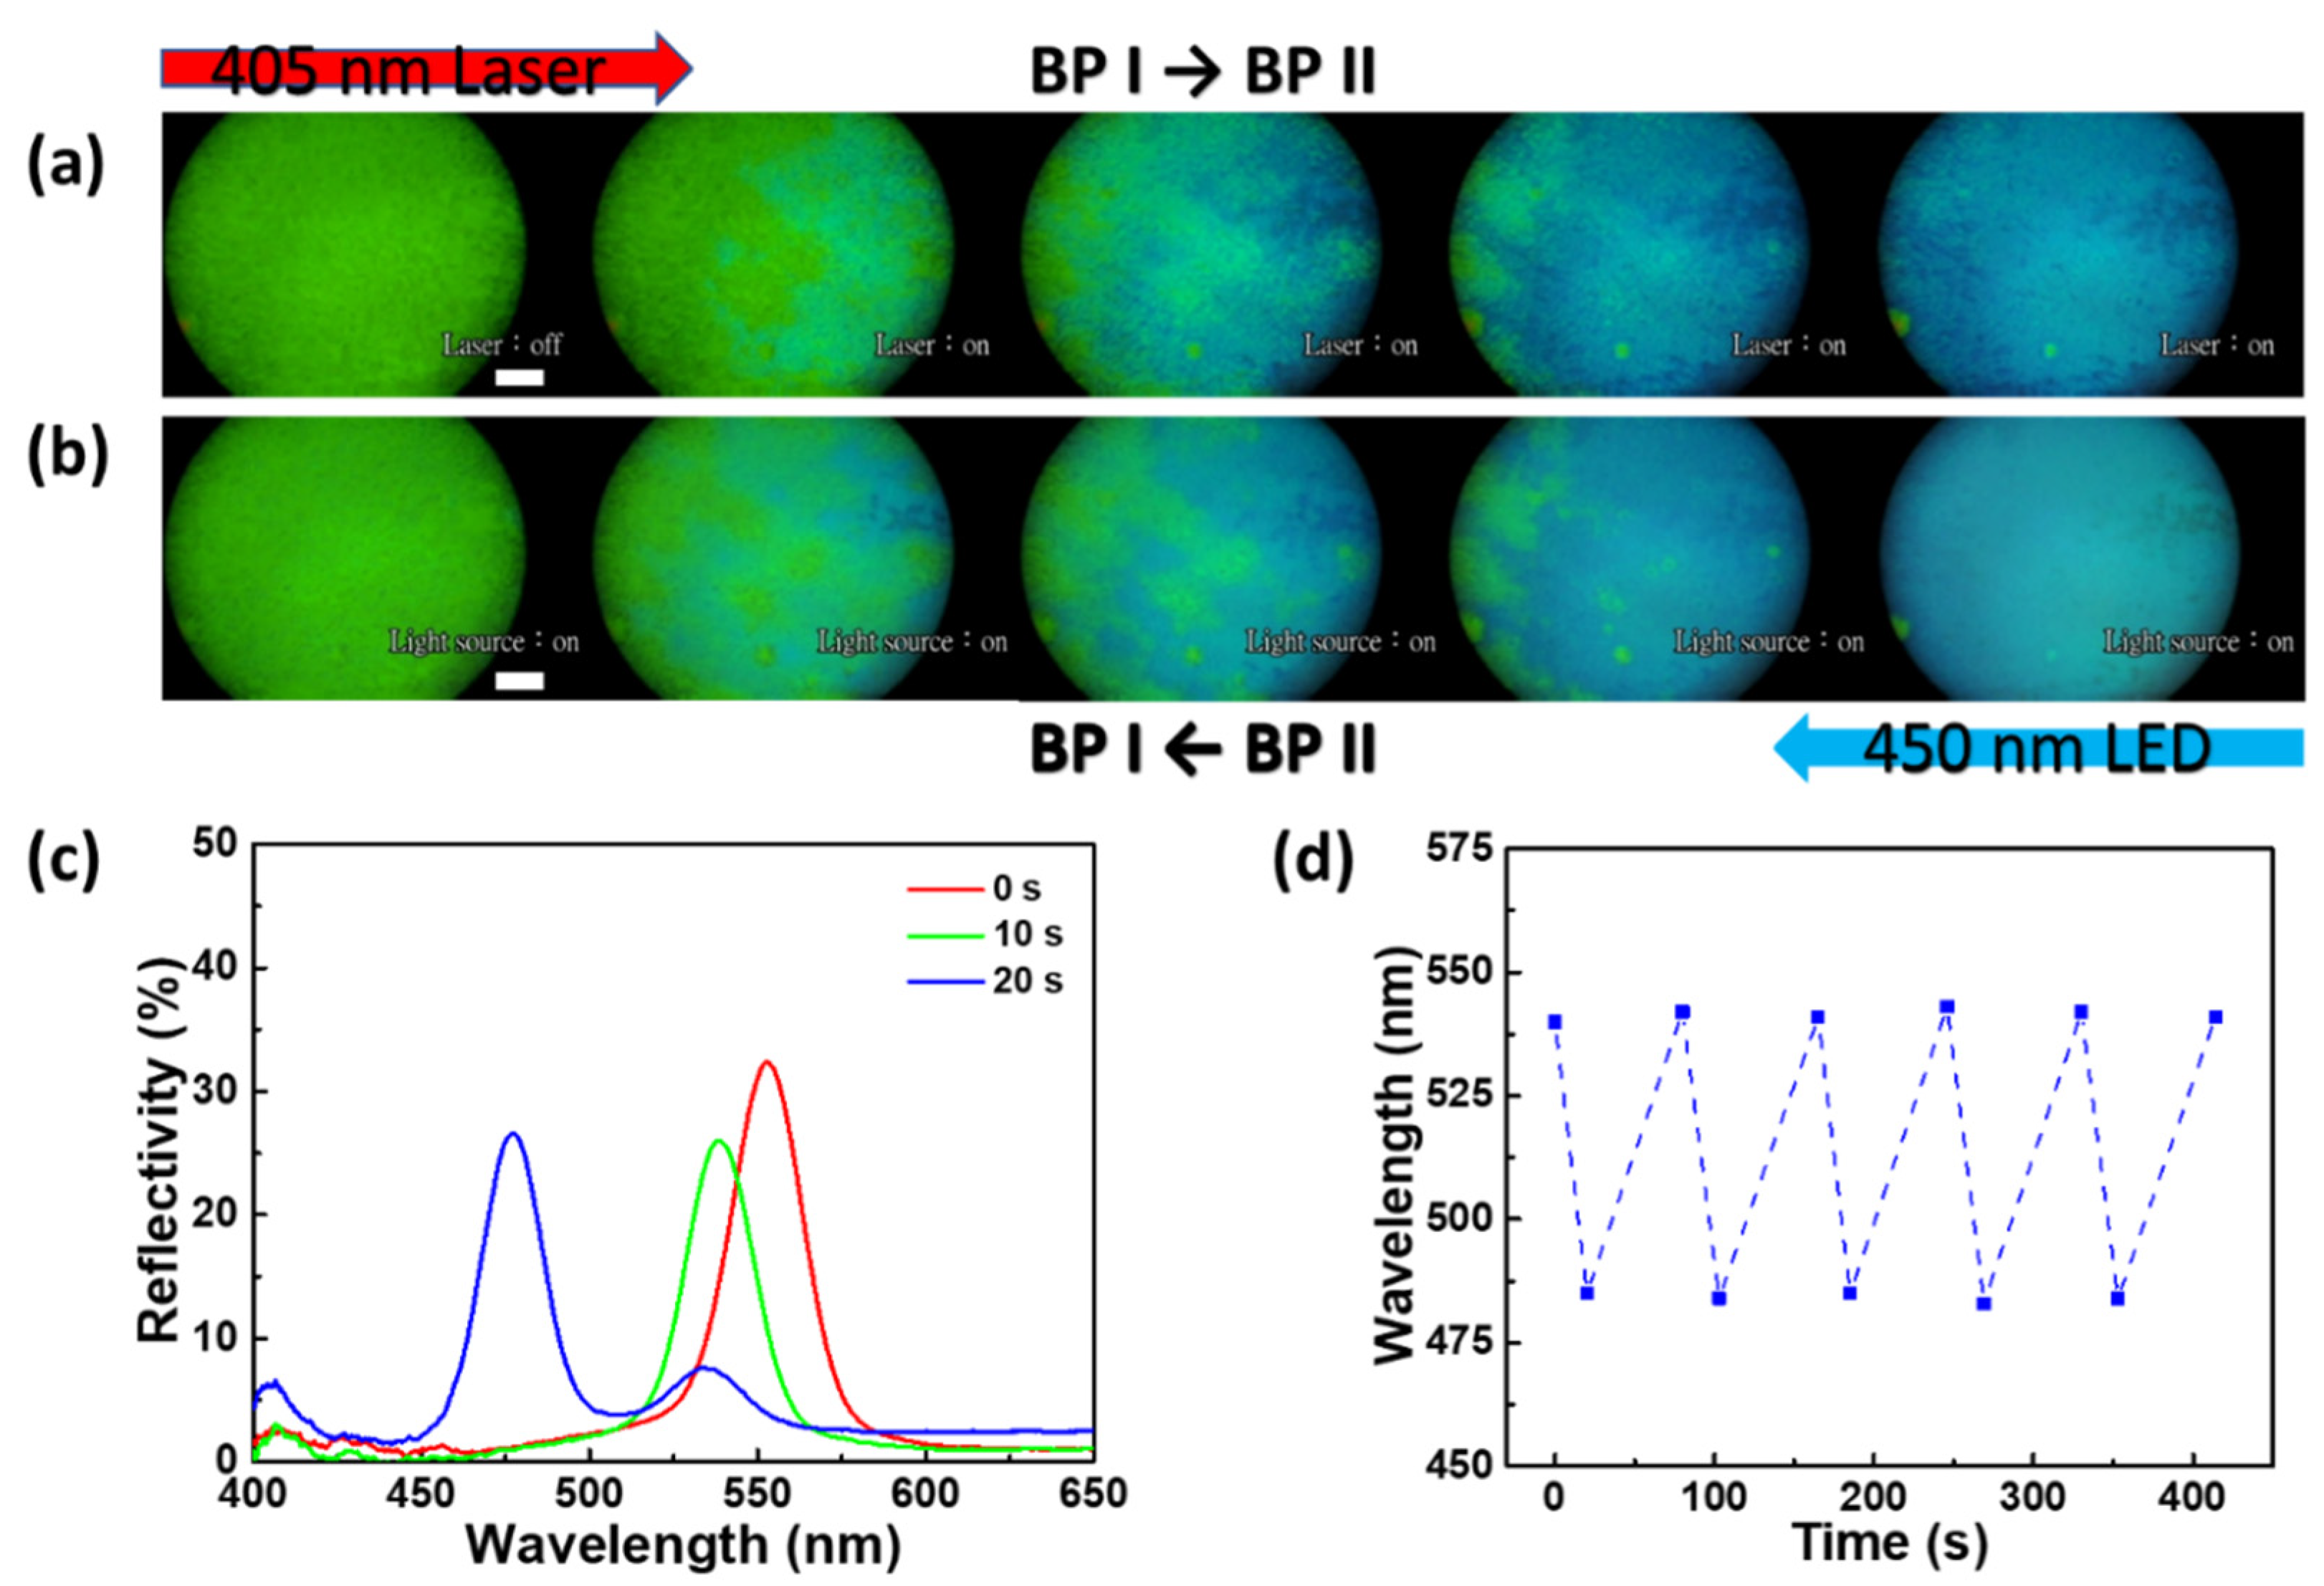
Figure 4.
R-POM images of the aligned CA-BPLC sample during the illumination of 405 nm laser for (a) 0, (b) 28, (c) 40, (d) 82, and (e) 120 s at BPI. The length of the scale bar is 100 μm. (f) The variation in the reflection wavelength of the aligned CA-BPLC sample at BPI with increasing illumination time of 405 nm laser. The temperature is fixed at 46.5 °C.

Figure 5.
Schematic of the isothermal phase transition in the aligned CA-BPLC sample.
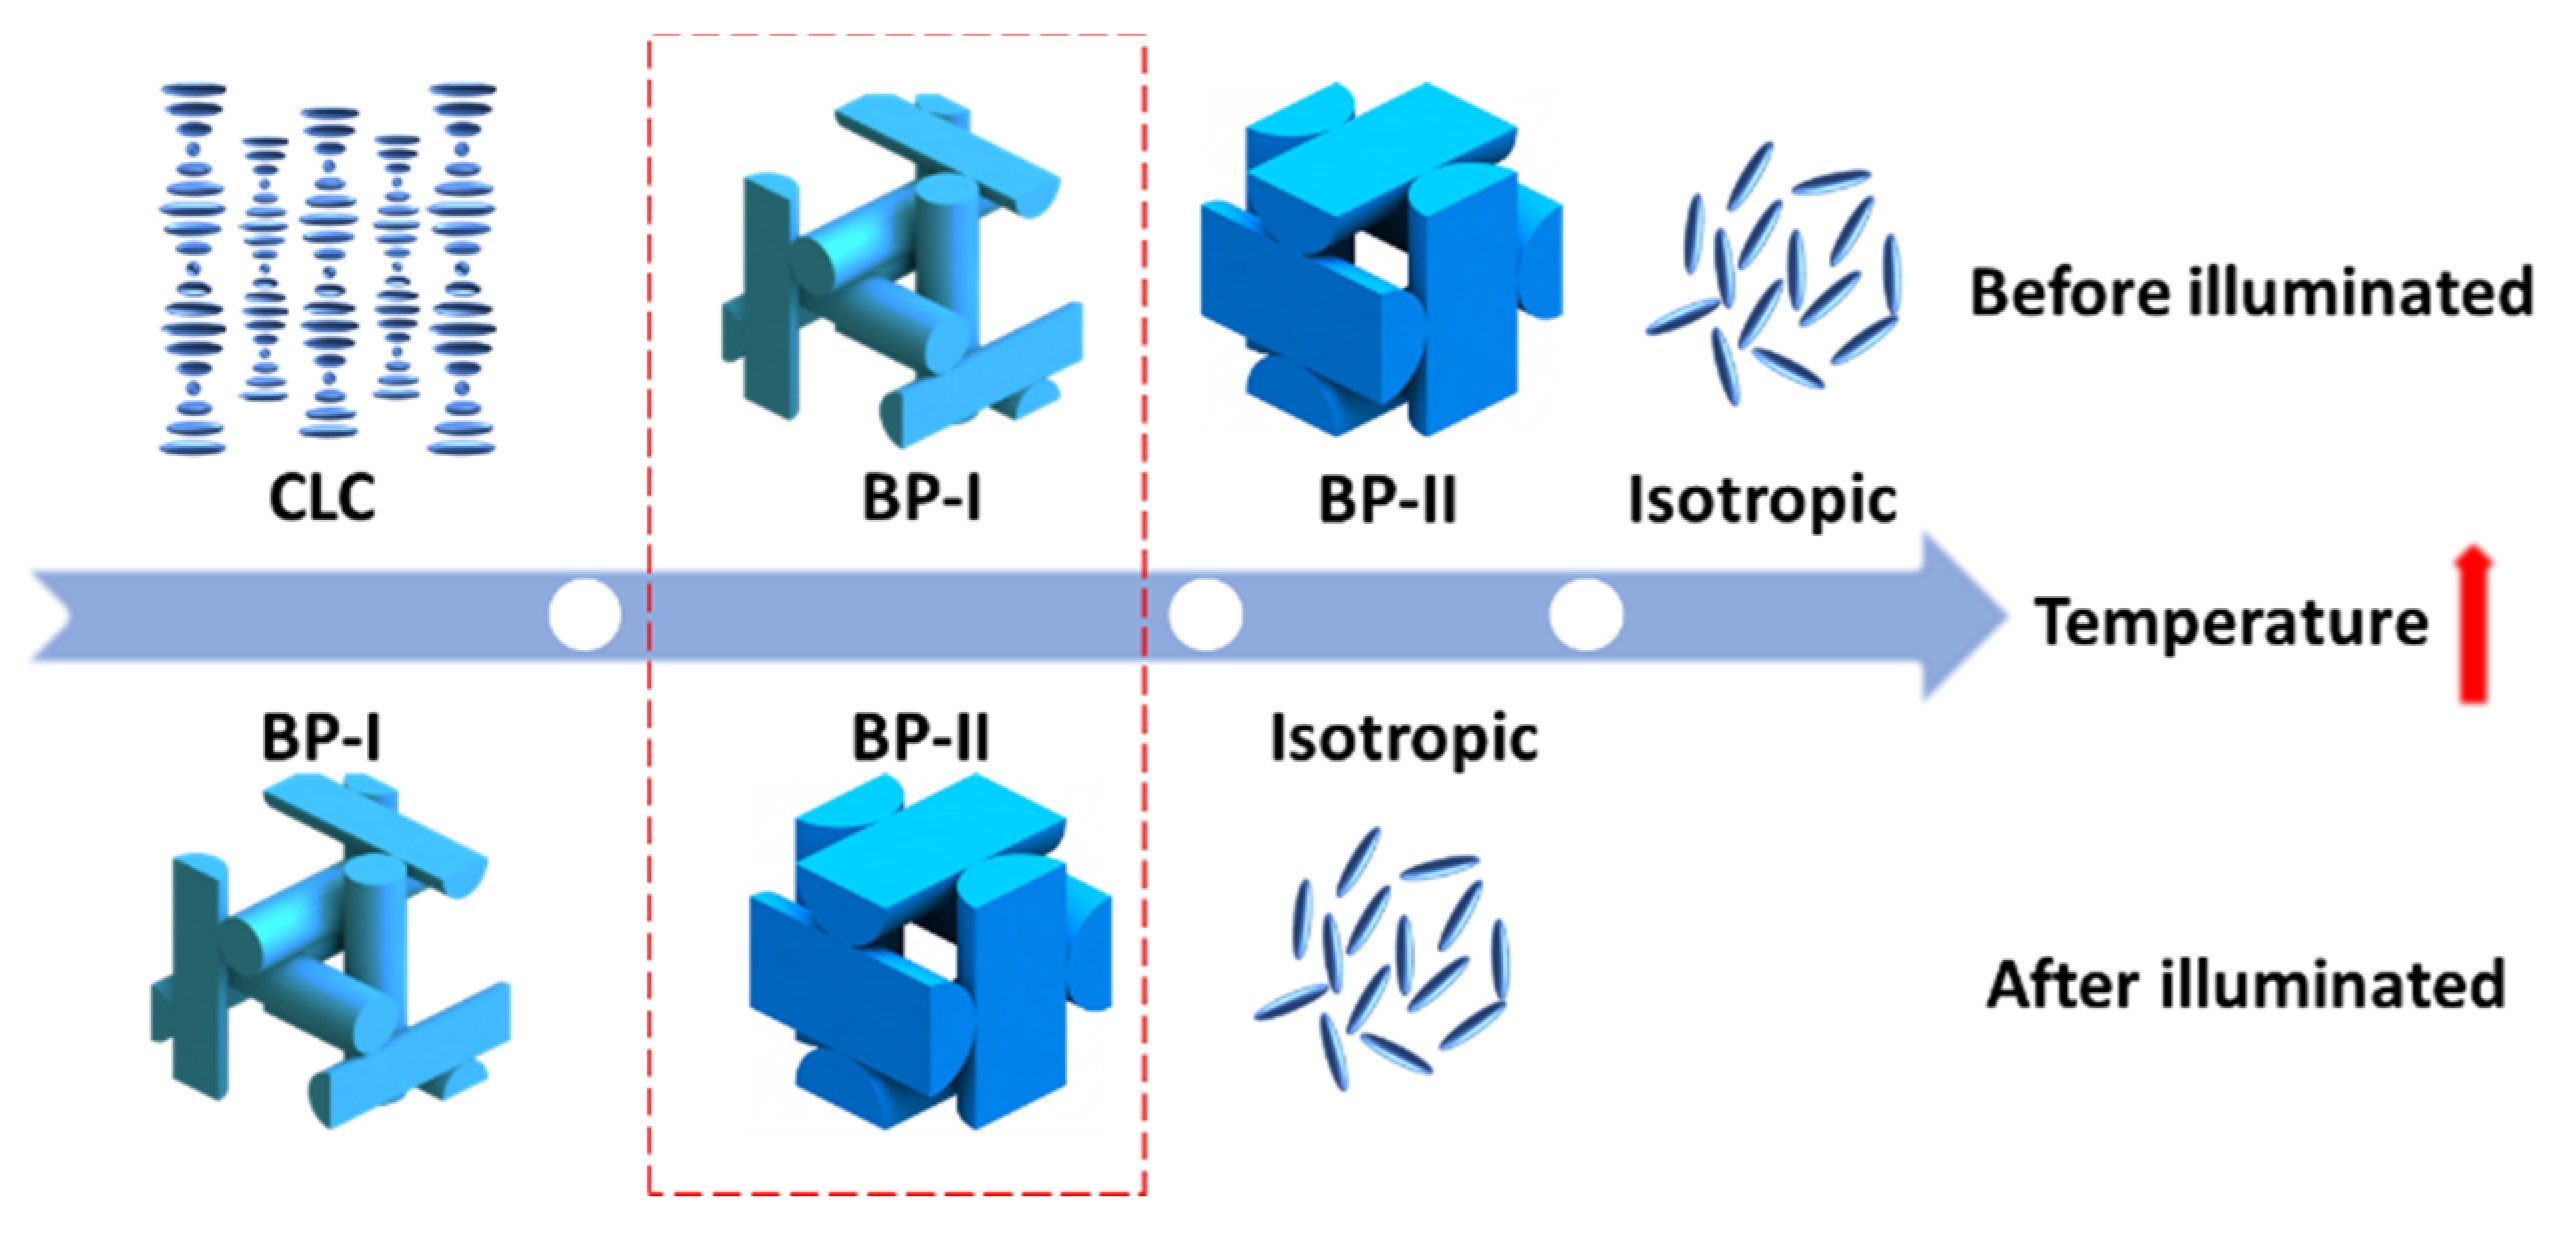
Figure 6.
R-POM images of 1.0 wt%-CA-BPLC sample without surface alignment during the illumination of 405 nm laser for (a) 0, (b) 15, (c) 25, (d) 35, (e) 40, and (f) 45 s at BPI. The length of the scale bar is 100 μm. (g) The measured reflection spectra of the corresponding images in (a–f). The temperature is fixed at 45.8 °C.

© 2020 by the authors. Licensee MDPI, Basel, Switzerland. This article is an open access article distributed under the terms and conditions of the Creative Commons Attribution (CC BY) license (http://creativecommons.org/licenses/by/4.0/).
Share and Cite
MDPI and ACS Style
Jiang, S.-A.; Wu, C.-H.; Mo, T.-S.; Huang, S.-Y.; Lin, J.-D.; Lee, C.-R. All-Optically Controllable Photonic Crystals Based on Chiral-Azobenzene-Doped Blue Phase Liquid Crystals. Crystals 2020, 10, 906. https://doi.org/10.3390/cryst10100906
AMA Style
Jiang S-A, Wu C-H, Mo T-S, Huang S-Y, Lin J-D, Lee C-R. All-Optically Controllable Photonic Crystals Based on Chiral-Azobenzene-Doped Blue Phase Liquid Crystals. Crystals. 2020; 10(10):906. https://doi.org/10.3390/cryst10100906
Chicago/Turabian StyleJiang, Shun-An, Chan-Hong Wu, Ting-Shan Mo, Shuan-Yu Huang, Jia-De Lin, and Chia-Rong Lee. 2020. "All-Optically Controllable Photonic Crystals Based on Chiral-Azobenzene-Doped Blue Phase Liquid Crystals" Crystals 10, no. 10: 906. https://doi.org/10.3390/cryst10100906
Note that from the first issue of 2016, this journal uses article numbers instead of page numbers. See further details here.