Abstract
Microtubules (MTs) are self-assembling, high-aspect-ratio tubular nanostructures formed from the polymerization of tubulin protein. MTs are capable of globally assembling into optically birefringent morphologies, but there is disagreement on the mechanisms driving this behavior. We investigated the temporal evolution of paclitaxel (PTX)-stabilized MT solutions under a range of in vitro conditions. Significant morphological differences were observed in the polymerized PTX-MT solutions as a consequence of varying the orientation of the reaction vessel (vertical vs. horizontal), the type of heating source (hot plate vs. incubator), the incubation time, and the concentration of PTX (high vs. low). The most robust birefringent patterns were found only in vertically oriented cuvettes that were heated asymmetrically on a hot plate, suggesting dependence upon a convective flow, which we confirmed with a combination of optical and thermal imaging. Higher concentrations of PTX led to denser PTX-MT domain formation and brighter birefringence, due to more complete polymerization. Combining our experimental observations, we conclude that birefringent patterns arise principally through a combination of convective and viscoelastic forces, and we identify the sequence of dynamical stages through which they evolve.
Keywords:
microtubules; paclitaxel; liquid crystal; self-assembly; birefringence; thermal anisotropy 1. Introduction
Microtubules (MTs), one of the three polymeric components of the cellular cytoskeleton, form from guanosine -5′-triphosphate- (GTP)-driven polymerization of tubulin dimers that consist of one subunit of α-tubulin and one subunit of β-tubulin. When a molecule of GTP is bound to a tubulin dimer, the β-subunit can bind to the α-subunit of another GTP-bound tubulin dimer, and this gives rise to a tubulin polymer referred to as a protofilament. Multiple protofilaments bundle with one another into a sheet that subsequently rolls into a cylinder, forming an MT [1,2,3,4] with a diameter of approximately 24 nm [5]. A single MT can span the length of a cell [6] and can catalyze the local polymerization of additional tubules that assemble to form larger bundles [7,8].
MTs have attracted a great deal of attention in recent decades, with most efforts leveraged towards elucidating their in vivo role in the processes of cellular growth, division, and transport [9]. MTs, moreover, can be driven to self-assemble in vitro, by heating an appropriately buffered mixture of tubulin protein dimers and GTP [10,11,12,13]. Self-assembled MTs are attractive from a materials synthesis perspective, as MTs themselves are incredibly rigid, exceeding even single-walled carbon nanotubes in terms of their bending rigidity [14]. MTs have been considered for a wide range of applications, including tension sensors [15], lab-on-a-chip components [16], molecular robots, artificial muscles and others [17,18,19,20].
Similar to other biological materials [21,22,23], MT self-assembly proceeds simultaneously on multiple length scales, resulting in the formation of liquid crystalline solutions [24,25]. Their alignment can be macroscopically controlled through the application of an external force field during the initial stages of self-assembly [26]. Biological liquid crystals, much like their synthetic counterparts, exhibit anisotropic elastic and viscous behavior, as well as respond to electromagnetic fields, substrate and interfacial properties, and physiochemical gradients (e.g., temperature, concentration, pH, etc.) [22]. Protein-based biological liquid crystals include structural proteins such as MTs [24], F-actin [27], collagen [28,29], spider and silkworm silk [30,31], as well as functional proteins such as insulin [32], lysozyme [33], and β-lactoglobulin [34]. Most of these proteins, including MTs, [24,26,35,36] can be driven to form nematic liquid crystalline networks under in vitro conditions.
Rapid disassembly is one of the drawbacks of MTs. MT-bound GTP rapidly hydrolyzes to guanosine diphosphate (GDP), inducing mechanical lattice strain that is alleviated by MT depolymerization [37,38]. Addition of new GTP-bound tubulin can “rescue” the shrinking tubule, allowing growth to resume. The stochastic switching between growing and shrinking phases in MTs is referred to as a dynamic instability [39,40]. In nature, MT depolymerization is prevented by Microtubule-Associated Proteins (MAPs) [41], highly purified tubulin, which is commonly used in in vitro studies, lacks these proteins, resulting in unstable MTs.
Stabilization of MTs can be achieved with the addition of artificial Microtubule Stabilizing Agents (MSAs). MSAs include taxanes (paclitaxel, docetaxel) [8,13,42,43], epothilones [44], taccalonolides [45], ceratamines, eleutherobins, sarcodictyins [8], triazolopyrimidines [46], and others [8,47,48,49]. Paclitaxel (PTX) was the first discovered MSA and its nucleating and stabilizing effects were initially reported in an in vitro MT assembly assay [13]. PTX-induced promotion of in vitro MT assembly was evaluated by monitoring the turbidity of solutions as a function of time; increasing PTX concentration lead to faster MT assembly kinetics and higher turbidity [13]. Further, PTX-stabilized MTs were resistant to depolymerization at low temperature (4 °C) and chemicals such as calcium chloride [13]. PTX also affects the nanoscale structure of MTs and increases the formation of MTs with 14 protofilaments [42,50,51,52].
The goal of this study was to probe the mechanisms underlying the formation of birefringent patterns in polymerized PTX-MT solutions and evaluate the influence of thermal anisotropy, direction of thermal gradient, incubation time and PTX concentration on their organization. The ability to control the self-assembly and orientation of MTs is of paramount importance for future envisioned technologies including sensors, molecular motors and actuators, protein-based engineered nanostructures, etc. [14,15,16,17,18,19,20] Previous studies on MT polymerization, with or without PTX, mainly reported turbidity or absorbance as the primary means of evaluating their time-dependent bvpolymerization [42]. These techniques are attractive because they are simple and applicable to cell biology and cancer research, but they do not provide information regarding the micro- or macroscopic organization of MTs. To address this, we utilized polarized optical microscopy and thermal imaging to characterize how in vitro PTX-MT morphology evolves over time. We focus on morphological outcomes and to discern how it is impacted by the presence or absence of gravitational and thermal gradients, as well as by disparate levels of viscoelasticity. Due to the rapid depolymerization of MTs, MSAs are expected to play a very important role in the realization of future devices. For this study, PTX was chosen as a model MSA. The use of alternative MSAs may further expand the use of MTs as a biological material.
We provided a gravitational gradient by orienting the reaction cuvettes vertically or horizontally during PTX-MT polymerization. We tuned the thermal gradient by placing vertically oriented cuvettes either on a hot plate or in an incubator; each set was within the temperature range where tubulin polymerization can occur. Viscoelasticity was manipulated by varying the concentration of PTX in our solutions. We ultimately found that global, birefringent striped patterns tended to emerge only in vertically oriented, asymmetrically heated cuvettes and that they were formed through the interplay of a thermally-driven convective flow and the growing MT network’s viscoelastic resistance to that flow.
2. Results and Discussion
2.1. PTX Influence on MT Fibril Morphology and Solution Rheology
The morphology of the PTX-MTs and PTX-free MTs, in air, was evaluated with Atomic Force Microscopy (AFM). Briefly, after 30 min of incubation, aliquots were extracted from the heated cuvettes and deposited on freshly cleaved mica following the methodology described in [53]. AFM reveals the presence of high-aspect ratio MT in the PTX-MT solutions (Figure 1a). On the contrary, the PTX-free MT solutions have sparse MT formation, and the observed fibrils are generally shorter than the ones observed in the PTX-MT solutions (Figure 1b). Representative AFM height profiles from both systems are shown in Figure 1c,d. The measured fibril height ranges from ~10–16 nm, indicating partial collapse of the MT structure, likely due to drying [53]. From AFM, the full width half-maximum (FWHM) diameter of the fibrils (PTX- and PTX-free) is 43.2 ± 8 nm (sample size n = 22) and 40.9 ± 4.1 nm (sample size n = 2), respectively. These FWHM values are approximately double the expected diameter of individual MTs and can be attributed to sample-tip convolution effects as well as deformation of the MT structure due to drying. For longer incubation (~12 h), AFM reveals the presence of clusters consisting of agglomerated nanoparticles (see Figure S1 in the supplementary materials) in both the PTX-MT and PTX-free MT air-dried solutions. These particles are likely tubulin heterodimers, short oligomers or MT depolymerization fragments [54]. High-aspect ratio MTs are still observed in the air-dried PTX-MT solution (upper-left portion of AFM scan of Figure S1a).
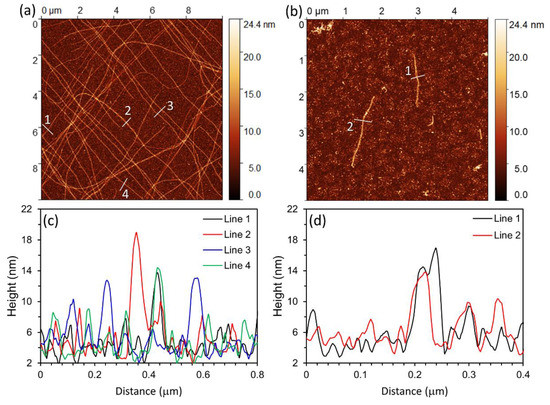
Figure 1.
AFM imaging of (a) PTX-MTs and (b) PTX-free MTs in air on freshly cleaved mica after 30 min incubation. (c,d) AFM height profiles extracted from (a,b), respectively. Scan size is 10 µm × 10 µm for (a) and 5 µm × 5 µm for (b).
Next, the gelation of the PTX- and PTX-free MT solutions, under constant heating at 37 °C, was evaluated by monitoring the storage (G’) and loss (G”) modulus. In viscoelastic materials, G’ and G” relate to a material’s ability to store energy (elastic component) and the energy dissipated as heat (viscous component), respectively. Precursor solutions were carefully dropped on a Peltier heated cone and plate rheometer equipped with a solvent trap. G’ and G” were monitored over time at a constant angular frequency of 10 rad/sec and strain of 0.1%. Figure 2 illustrates the temporal evolution of G’ and G” for the PTX-MT and PTX-free MT solutions. In the presence of PTX, a noticeable increase in G’ at ~6.5 min signals gelation of the PTX-MT network. The temporal evolution of G’ for the PT-MT solution resembles the behavior of self-assembled molecular gels, consisting of high-aspect ratio fibers [55]. The G’ response reached a plateau value of 88 Pa for the PTX-MT solution. On the contrary, G’ of the PTX-free MT solution increases slowly over the course of the experiment, reaching a value of ~5.5 Pa at 80 min. The distinct rheological behaviors of the two solutions indicate differences in their gelation.
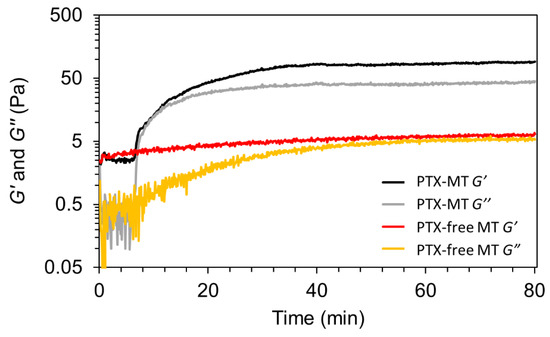
Figure 2.
Evolution of storage modulus (G’) and loss modulus (G”) as a function of time for PTX-MTs and PTX-free MTs.
2.2. Influence of Cuvette Orientation, Heat Source, and PTX on PTX-MT Solution Organization
To gain information on the macroscopic organization of the PTX-MT solutions in glass cuvettes, polarized optical microscopy (POM) images were collected while the solutions were heated. Polymerization trials were carried out at three temperature settings: 36 °C, 41 °C, and 46 °C (see Figure S2). A temperature setting of 41 °C heated solutions close to the optimum MT polymerization temperature (37 °C) and was chosen for all subsequent polymerization experiments. Representative POM images of the PTX-MT solutions are shown in Figure 3. The images were obtained with crossed polarizers (CPs) aligned parallel to the edges of the cuvette (CP1 configuration, top row) and with CPs aligned at 45° (diagonals) to the edges of the cuvette (CP2 configuration, bottom row). Generally, regions of the cuvette exhibiting substantial local MT alignment along a direction that is ±45° from the polarizer axes will be imaged most brightly, whereas regions with tubules principally oriented along the polarizer axes will appear dark.
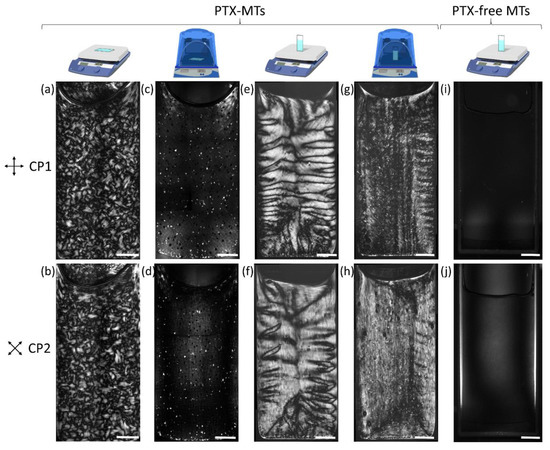
Figure 3.
CP1 and CP2 configuration POM images of MT solutions for hotplate-heated PTX-MT (a,b,e,f), incubator heated PTX-MT (c,d,g,h) and hotplate-heated PTX-free MT (i,j) solutions. Tubulin concentration was 10 mg/mL for (a–h), and 5 mg/mL for (i,j). PTX concentration was 2.5 µM for (a–h) and 0 µM for (i,j). The POM images were collected at 3.5 h for (a–h) and at ~12 h for (i,j). The heat source, cuvette orientation and presence or absence of PTX are schematically shown on the top row. Scale bar is 2.5 mm.
PTX-MT polymerization, obtained when the cuvette lies horizontally on the hotplate, leads to the formation of dense birefringent domains (Figure 3a,b) observable under both CP1 and CP2 configurations and spanning almost the entirety of the solution. The solution near the meniscus lacks optical contrast for both POM configurations, indicating that either the local MT density is lower than the rest of the solution or that MTs are orientated at angles insensitive to the CP1 and CP2 configurations. The observation of birefringent domains is characteristic of local nematic liquid crystalline order in the solution [24]. Optical contrast under both CP1 and CP2 indicates that the MT domains consist of MTs or MT bundles without strong preferential alignment to a particular orientation. However, the MTs do buckle and bend, as evidenced by the dark boundaries between the domains. Trapped bubbles are also present in the solution. When the experiment is repeated inside an incubator (Figure 3c,d), the resulting MT organization is strongly suppressed. The macroscopic organization of PTX-MT solutions obtained when the long axis of the cuvette is perpendicular to the surface of the hotplate (vertical orientation) is shown in Figure 3e,f. Similar to the horizontal configuration, the vertical PTX-MT solution exhibits optical contrast due to birefringence, but the observed MT domains are generally larger than the ones in the horizontal hotplate solution. Under the CP1 configuration, three regions of PTX-MT organization can be roughly discerned: the area around the meniscus, the middle portion of the cuvette, and the bottom of the cuvette. In the middle portion of the cuvette, approximately horizontal dark stripes are observed on opposite sides of the cuvette, which are caused by the long axis of PTX-MT bundles undulating at ~±45° along the vertical direction [26,35,56]. For the same portion of the cuvette, the CP2 configuration verifies that these undulating bundles are aligned approximately in the vertical direction. For CP1, the areas around the meniscus and the bottom portion of the cuvette exhibit approximately horizontal, alternating dark and bright bands, which are indicative of PTX-MT bundles undulating at ~±45° along the horizontal direction. The horizontal PTX-MT bundle alignment is clearly verified by the corresponding CP2 image. As an empirical comparison of PTX-MT domain size and density, the percentage % area of dark domain boundaries over the entire solution area was calculated to be ~40% and ~24%, respectively, for Figure 3a (horizontal hotplate) and Figure 3e (vertical hotplate), respectively. POM images of the same PTX-MT solution at ~12 h are shown in Figure S3. Hotplate-polymerized PTX-MT solution with a lower tubulin concentration (5 mg/mL) yield POM images similar to Figure 3a,b and they are shown in Figure S4.
CP1 and CP2 POM images of the PTX-MTs polymerized inside the incubator, for vertical configuration, are shown in Figure 3g,h, revealing drastically different results from those of the hotplate observations. The diminished optical contrast of Figure 3g suggests that the PTX-MTs are primarily aligned along the vertical or horizontal directions, as confirmed by Figure 3h. Similar to the PTX-MTs formed on the hotplate, the incubator PTX-MTs switch their orientation from predominantly vertical along the vertical edges of the cuvette to horizontal at the bottom and top. The ±45° undulations along the vertical direction that dominated the hotplate assays are largely suppressed; however, they appear faintly on the right side of the cuvette in Figure 3g. This suggests that the MT density alone cannot generate the compressive forces necessary to achieve substantial buckling. Unlike the vertical hotplate polymerization, trapped bubbles are observed throughout the vertical incubator PTX-MT solution.
CP1 and CP2 images from PTX-free MT solutions show no optical contrast (Figure 3i,j). Initially, the PTX-free MT solution is transparent but at ~12 h incubation, it becomes opaque, suggesting isotropic polymerization or formation of structures at length scales that do not induce anisotropic optical propagation to the detection sensitivity of the POM set-up. The POM observations are consistent with the morphological differences observed in the solution polymerization products via AFM; namely the PTX-MT solutions consist of high-aspect ratio MTs or MT bundles, whereas the PTX-free-MT solutions consist of low-density, shorter length MTs with no optical contrast.
Higher magnification POM images from a polymerized horizontal hotplate PTX-MT solution (bottom portion of cuvette) are shown in Figure 4. The CPs were continuously rotated from CP1 to CP2 configuration with an increment of 5°. PTX-MTs are arranged in domains, which are surrounded by dark boundaries, indicating locations where the PTX-MT long axis is aligned at ±45° from the CPs; hence, the dark boundaries shift as the CPs are rotated. Regardless of CP angle, the domains retain optical contrast and never become dark, indicating that the MTs form bundles (white lines) with random orientation, and whose orientation also likely varies along the depth of the cuvette. The presence of bubbles complicated orientational analysis of the images and the results are not included here. Figures S5 and S6 show the same region imaged at 15 min and at ~12 h incubation. Videos S1–S3 show the evolution of the solution birefringence with changing CP orientation.
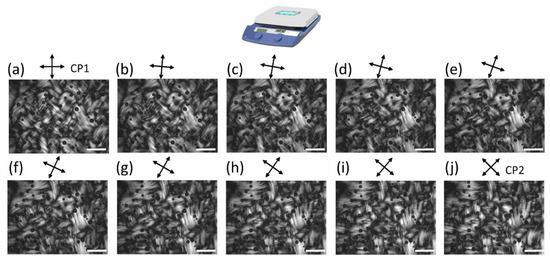
Figure 4.
Higher magnification POM images of PTX-MT polymerization for horizontal hotplate obtained at 3.5 h after the start of heating. CPs are rotating from CP1 (a) to CP2 (j) configuration. Scale bar is 1 mm.
Figure 5 shows POM images obtained with CPs rotated from CP1 to CP2 configurations for a vertical hotplate PTX-MT. The fine structure of the domains could not be resolved at this magnification, but larger undulating PTX-MT fibrils were observed. These fibrils appear as filaments with an approximately vertical orientation and they are superimposed onto the PTX-MT fine structure. The finer PTX-MT domain structure appears to have some correlation to the orientation of the larger fibrils because they exhibit overlapping optical extinction at certain locations (for example, the fibrils become dark at dark domain boundaries, indicating similar bending angles of the finer domains and the larger fibrils). Shown in Figure 5k, is the orientational analysis of a composite image (Figure 5a,j), which verifies that the larger fibrils are primarily aligned along the vertical direction with bending undulations. Figures S7 and S8 are the corresponding POM images, of the same region, collected at 15 min and at ~12 h incubation. Videos S4–S6 show the evolution of the solution birefringence with changing CP orientation for the 15 min, 3.5 and ~12 h incubation. The size and shape of the PTX-MT domains change with increasing incubation time. The morphological evolution of the domains is more striking under CP1 configuration. At 15 min, the PTX-MT domains are separated by dark boundaries that are aligned primarily along the vertical direction (Figure S7a). This suggests that the PTX-MTs are undulating approximately along the horizontal direction. At 3.5 h, the PTX-MT domains look completely different than those observed at 15 min. As mentioned before, the 3.5 h domain structure is indicative of PTX-MTs undulating primarily along the vertical direction. This domain structure persists at least up to ~12 h (see Figure S8a), albeit the 12 h domains are somewhat smaller and are separated by a higher density of dark boundaries. These morphological changes are consistent with shrinkage of the PTX-MT solution due to evaporation.
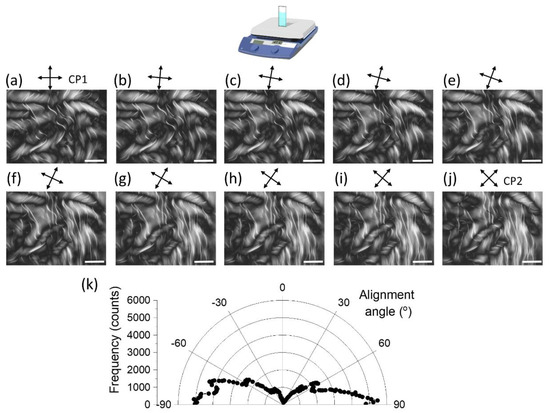
Figure 5.
Higher magnification POM images of PTX-MT polymerization for a vertical hotplate obtained at 3.5 h after the start of heating. CPs are rotating from the CP1 (a) to CP2 (j) configuration. Scale bar is 1 mm. Alignment angles of larger fibrils are shown in (k).
PTX-MTs form dense, birefringent, complex domain structures, similar to the ones observed by Hitt et al., Tabony et al., and Liu et al. [24,26,35,56]. Anisotropic heating and geometric confinement can induce the formation of well-oriented MT bundles [36,57,58]. However, this was not observed in our hotplate incubation studies, likely because the geometric confinement imposed by the cuvette is not as stringent as in these reports. More specifically, in Kakugo et al. and Liu et al., two out of the three rectangular cell dimensions were smaller than the MT persistence length (~5 mm) [36,56]. In addition, the cell thicknesses ranged from 50 to 220 µm [36,56]. Similarly, the diameter of the capillary used in Shikinaka et al. was 0.5 mm [57]. In the present study, only the thickness of the cuvette (1 mm) is smaller than the MT persistence length. Hence, the extended physical dimensions of the cuvette allow for more unrestricted growth and cooperative motions of the PTX-MT bundles.
The organization of the PTX-MTs is sensitive to the orientation of the cuvettes on the hotplate. Tabony et al. observed morphological differences of MT polymerization in vertical and horizontal cuvettes, and attributed the differences to the effect of gravity, but largely dismissed the influence of thermal convection on the macroscopic polymerization of MT solutions due to their high viscosity [26,35]. Hitt et al. suggested that the macroscopic appearance of the solutions was likely the result of multiple factors including thermal convection, and forces acting between microtubules MTs [24]. Liu et al. reported similar striped MT configurations in cuvettes that were initially exposed to a strong magnetic field or convective flow [56]. It was concluded that the emergent undulations were caused by locally aligned MT bundles buckling under the compressive forces exerted on them by other bundles and the walls of the cuvette itself [56]. For both of the hotplate experimental configurations (vertical, horizontal), the PTX-MT solutions form dense, highly birefringent domains, whereas incubator heating yields lower density, orientated PTX-MT domains. As suggested by Liu et al., [56] our observations on PTX-MT solution polymerization on the hotplate and incubator verify that heating anisotropy strongly influences the macroscopic organization of PTX-MTs.
To summarize, anisotropic hotplate heating forms highly birefringent domains in the PTX-MT solutions, whereas isotropic incubator heating forms PTX-MT networks with suppressed optical contrast. In addition, the orientation of the cuvette on the hotplate (direction of gravitational and thermal gradient) strongly influences the morphology of the PTX-MT domains. In more detail, the PTX-MT domains of the horizontal hotplate are significantly smaller than those in the vertical hotplate configuration. Under uniform heating and geometric confinement, PTX-MTs nucleate and elongate in random directions, yielding solutions with no macroscopic organization, which exhibit modest (or no) birefringence [58]. This is the case for the horizontal incubator PTX-MT solution, where the thickness of the cuvette (1 mm) is smaller than the PTX-MT persistence length [36]. Interestingly, the vertical incubator PTX-MT solution exhibits modest birefringence and partial alignment of the PTX-MTs along the edges of the cuvette. Given the exceptional temperature uniformity inside the incubator, this is a rather surprising result. It is hypothesized that some degree of PTX-MT alignment is achieved due to the reduced thickness of the cuvette.
For the anisotropic hotplate polymerization, thermal convection, as well as chemical and thermal anisotropy, play an important role in the formation of birefringent PTX-MT domains. The horizontal hotplate PTX-MT solution exhibits strikingly smaller domains than the vertical hotplate PTX-MT solution. We hypothesize that the morphology of the horizontal hotplate solution is influenced by Rayleigh–Bénard convection, as well as geometric confinement experienced along the thickness of the cuvette, which can lead to buckling of PTX-MTs along the larger dimensions (width, height). In the vertical hotplate cuvette, PTX-MTs nucleate in the warmest part of the cuvette, thereby locally depleting tubulin, and preferentially grow towards regions of higher tubulin concentration (cooler portion of the cuvette) [36,58]. As the concentration of PTX-MTs increases, the fibrils cooperatively buckle and undulate within the solution forming highly birefringent domains [56]. Without a doubt, the local thermal environment, as well as the direction of the temperature gradient, play a very important role in the morphology of in vitro polymerized PTX-MTs.
To test whether and how convective currents are responsible for the formation of the undulating striped domains observed in our vertically oriented, hotplate-heated cuvettes, the temporal evolution of PTX-MT polymerization was monitored under simultaneous POM and thermal imaging. POM and corresponding thermal images, captured at the indicated time after placing the cuvette onto the hot plate, are shown in Figure 6 for 0.5 (a,b) and 2.5 µM (c,d) PTX concentrations, respectively. The PTX-MT polymerization kinetics have a strong dependence on the amount of PTX present in the solutions, with a higher PTX content leading to faster polymerization, consistent with the earlier rheological experiments. Videos S7–S11 show the evolution of the solution organization with POM images collected every 2 min. The onset of polymerization of the PTX-MT solutions was estimated by monitoring the motion of small particles present in the solutions (see Figures S9 and S10). Initially, these particles move rapidly due to convection currents induced by anisotropic heating (see Figure S9), but eventually, the particles slow down and stop moving entirely. Representative particle trajectories and displacement are shown in Figure S10 for low (0.5 µM) and high (2µM) PTX concentration. Thermal imaging during the first 20 min of heating reveals that the cuvettes have not reached thermal equilibrium (see Figure 6b,d and Figure S11, Videos S12 and S13); therefore, the cessation of particle movement indicates increased viscosity in the PTX-MT solutions, which opposes and overcomes thermally induced particle transport. Increased viscosity is likely caused by MT protofilament formation. For 2.5 µM PTX, cessation of particle motion, due to increased solution viscosity, was observed at ~2–4 min after placement of the cuvette on the hotplate, whereas for 0.5 µM PTX, the corresponding time was ~5–8 min. For the 2.5 µM PTX solution, the gelation time, as estimated with POM (~2–4 min), is faster than the onset of gelation observed with rheology (~6.5 min). This difference could be due to differences in temperatures profiles between the rheometer and the hotplate. Also, the rheometer experimental set-up more closely resembles the horizontal hotplate polymerization geometry, which polymerizes faster than the vertical configuration. Regardless of which method was used, rheology or POM, gelation of the solutions is strongly affected by PTX, with higher PTX content leading to faster gelation. At this stage, the PTX-MT solutions still appear largely optically isotropic. Under CP2 configuration, some optical contrast is observed on the bottom and right portion of the cuvette, indicating local polymerization of aligned MTs (see Figure S12).
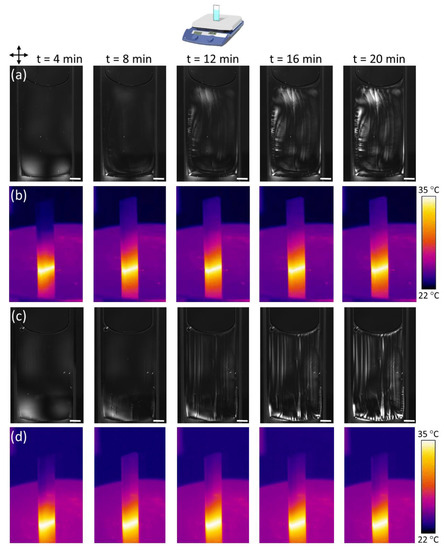
Figure 6.
POM and thermal images of time-dependent PTX-MT solution vertical hotplate polymerization as a function of PTX concentration. PTX was 0.5 µM for (a,b), and 2.5 µM for (c,d). Tubulin concentration was 5 mg/mL. Scale bar is 2 mm.
Next, formation of bubbles is observed. Bubbles generally form on the hotter, lower portion of the cuvette, as shown, for example, in Figure 6c at 8 min (lower-left portion). Upon reaching a critical size, the bubbles depin and move towards the surface, creating vertical streaks of modest birefringence. These streaks likely correspond to perturbed PTX-MTs dragged along by the moving bubbles. A higher concentration of vertical streaks (due to bubble depinning) is observed with increasing PTX concentration (Figure 6 and Figure S12). Outgassing of bubbles in the vertical cuvette configuration is the reason why no bubbles were observed in the POM images of Figure 5. On the contrary, for the horizontal cuvette configuration, bubbles reach the top glass surface and remain trapped (Figure 6). The formation of bubbles in the PTX-MT solutions is not fully understood, but it is hypothesized that the PTX-MTs act as nucleation sites due to oxygen accumulation in their vicinity or within the MTs themselves [59].
Between 12 and 20 min, following outgassing of bubbles, highly birefringent PTX-MT domains begin to form on the perimeter of the cuvette. These are formed due to buckling of horizontal PTX-MTs along the bottom portion of the cuvette and vertical PTX-MTs along the vertical sides of the cuvette. For low PTX concentrations (0.5 µM), these domains are mobile, due to thermal convection currents as well as due to the delayed onset of MT gelation, but eventually, become pinned due to the increased viscosity in the solution (Figure 6a, 20 min). With increasing PTX concentration (> 1 µM), highly birefringent domains form on the bottom of the cuvette, as shown in Figure 6c at 16 and 20 min. In addition to the bubble and streak formation, a subtle change in the optical contrast of the solution signals the potential formation of orientated MTs.
The evolution of the PTX-MT solution polymerization over longer time scales is shown in Figure 7 (Video S8) and 8 (Video S11) for 0.5 µM and 2.5 µM PTX, respectively. For the 0.5 µM PTX concentration, the increased mobility of the PTX-MT domains in the solution is responsible for the formation of somewhat unpredictable PTX-MT birefringent patterns in replicate experiments. In Figure 7, higher density birefringent PTX-MT domains form on the perimeter of the solution due to buckling of MTs. With increasing time on the hotplate, the PTX-MT polymerization pattern becomes more complex. MTs are formed and transported from the bottom right portion of the cuvette towards the top, but the meniscus constrains their motion; therefore, a counterclockwise vortex is formed that pushes MTs from the meniscus towards the left-bottom portion of the cuvette. This motion forces existing MT domains (buckled vertical MTs) on the left portion of the cuvette to move downward (or further buckle) as well as creates new birefringent domains due to buckling of existing MTs. From our experimental data, we cannot conclusively determine whether new MTs are formed when solution is transported towards the bottom of the cuvette or that changes in the optical contrast are exclusively due to buckling of existing PTX-MTs. Given the complexity of the MT-polymerization patterns we have observed in this study, we hypothesize both these mechanisms occur during heating of the solutions. At ~180 min, the PTX-MT solution reaches a stable state: highly birefringent MT domains have formed on the perimeter and left side, whereas the rest of the solution exhibits modest birefringence. The polymerization of the 2.5 µM PTX-MT solution over longer time scales is shown in Figure 8. By 40 min, birefringent PTX-MT domains have formed on the (hotter) lower and right portion of the cuvette. PTX-MT domains formed on the lower portion of the cuvette, expand towards the cooler top portion, and new MT domains form due to heating, buckling and cooperative motions of MTs. With increasing time on the hotplate, the polymerization pattern “freezes” in place and, slowly, the solution becomes more densely packed with PTX-MT domains; at ~200 min, the entire the solution consists of birefringent PTX-MT domains. As shown in Figure S14, over longer time frames, the macroscopic MT polymerization, for PTX concentrations > 1 µM, share similar characteristics, with complex MT domain formation throughout the entire cuvette. From Videos S7–S11, a much slower global counterclockwise rotation of the entire polymerized solution was also observed and persisted up to at least 3.5 h.
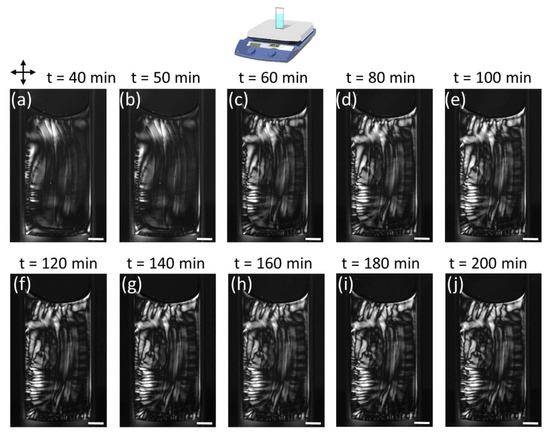
Figure 7.
POM images of time-dependent PTX-MT solution vertical hotplate polymerization for 0.5 µM PTX concentration. Tubulin concentration was 5 mg/mL. Scale bar is 2 mm.
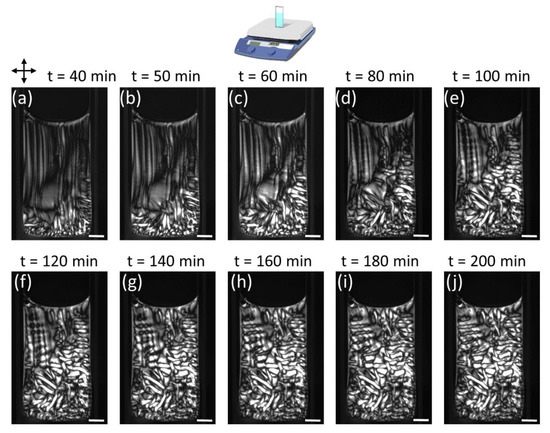
Figure 8.
POM images of time-dependent PTX-MT solution vertical hotplate polymerization for 2.5 µM PTX concentration. Tubulin concentration was 5 mg/mL. Scale bar is 2 mm.
Polymerization of tubulin into MTs or PTX-MTs can only be achieved at an elevated temperature; therefore, the formation of in vitro MTs typically occurs in environments that exhibit some degree of thermal anisotropy. Whereas, incubators offer high-temperature uniformity, the hotplate cuvettes (horizontal or vertical) experience anisotropic heating: the bottom of cuvette is hotter than the top of the cuvette (see Videos S12 and S13). Polymerization of the vertical hotplate PTX-MT solutions proceeds through the following stages: (i) isotropic polymerization (limited or no optical contrast), (ii) initiation of MT polymerization, causing formation of bubbles and creation of vertical streaks due to outgassing of said bubbles, (iii) formation of macroscopic birefringent PTX-MT domains, typically on the hottest portion as well as the perimeter of the cuvette (iv) growth of PTX-MT domains, leading to formation of new birefringent domains due to cooperative buckling and rotations and (v) “freezing-in“ of the macroscopic PTX-MT solution organization. A schematic of the proposed evolution of the vertical hotplate PTX-MT polymerization is shown in Scheme 1a. Both viscoelasticity and thermal convection play a role in the pattern evolution. In step (i), PTX-MTs nucleate and begin to elongate, causing an increase in the viscosity of the solution. The formation of air bubbles in step (ii) is likely correlated to the growth of PTX-MTs, as previously discussed. During this step, buckling of the PTX-MTs is either minimal or their density is not sufficient to induce birefringence. In step (iii), birefringent domains appear on the hottest portion of the cuvette. These signify local buckling of the growing PTX-MTs. PTX-MTs continue to grow, causing additional distortions, which form more birefringent domains (step (iv)). The birefringent domains generally grow along thermal convection currents. This occurs because of favorable mass and heat transport. For low PTX concentrations (< 2 µM), the transport of the birefringent domains is strongly suppressed due to increased solution viscosity. For high PTX concentrations (> 2 µM), birefringent domains form throughout the solution. The birefringent pattern eventually stabilizes after reaching temperature equilibration or suppression of thermally induced motions due to increased viscosity.
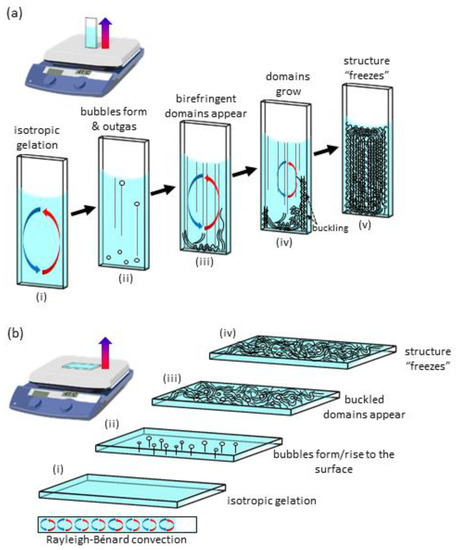
Scheme 1.
Proposed schematic of the morphological evolution for (a) vertical hotplate, and (b) horizontal hotplate PTX-MT solution polymerization.
Due to the lack of real-time observations for the horizontal hotplate PTX-MT experiment, we can only postulate its polymerization pathways. These are shown in Scheme 1b. We assume that the first two steps of polymerization are similar to that of vertical experiment, i.e., isotropic polymerization and formation of bubbles. Next, birefringent domains appear due to buckling of PTX-MTs (step (iii)). How these domains form is unknown, but we do know that they develop quickly, as evidenced by Figure S5. Further, Rayleigh–Bénard convection cells could be responsible for the smaller size of the PTX-MT domains, when compared to the vertical experiment. Future work on horizontal hotplate polymerization can aid in gaining a better understanding of its morphological evolution, and in particular, the transition between steps (ii) and (iii).
3. Conclusions
We have investigated the polymerization of PTX-MT solutions obtained from different heating sources, cuvette orientation, incubation time, and PTX concentration, with significant morphological differences observed for each of these variants. The temporal evolution of PTX-MT polymerization on the hotplate, under vertical cuvette configuration, was further investigated. Analysis of the captured images reveals that the PTX-MT solutions initially undergo largely isotropic polymerization, followed by formation of highly birefringent liquid crystalline PTX-MT domains due to buckling enabled by thermal convection currents. The observed vertical orientation of larger MT fibrils may by driven by a concentration gradient of tubulin at the leading edge of polymerization initiated by the thermal gradient. Our study suggests that thermal convection influences the macroscopic organization of the PTX-MT solutions. In addition, our results demonstrate that, to some degree, PTX-MT liquid crystalline order, can be controlled by thermal gradients, geometric confinement, cuvette orientation, incubation time, and PTX concentration, which can be important in future biomolecular materials. Optimization of these process parameters is necessary for fine tuning the morphology of the liquid crystalline PTX-MT networks and future work could explore their dependency on external stimuli, such as electric or magnetic fields. Additionally, this work helps to bridge the gap in our understanding of how macroscale properties may arise from microscale and nanoscale dynamics in MT-based active nematic liquid crystal systems [60]. Moreover, the MT system examines a complex system where hierarchical order emerges out of competing forces. Our phenomenological observations and identification of critical factors in polymerization reactions open a design space for biophysical mechanisms likely involved in a variety of complex systems.
4. Materials and Methods
4.1. Materials and PTX-MT Polymerization
Tubulin from porcine brain was purchased from Cytoskeleton, Inc. (Denver, CO). Tubulin polymerization was carried out with the following buffer composition: MES buffer (100 mM MES, 1 mM MgCl2, 1 mM EGTA, pH 6.75) in the presence of GTP and PTX. The GTP concentration was fixed at 2 mM, whereas the tubulin and PTX concentrations were varied from 5 mg/mL to 10 mg/mL and from 0 to 2.5 µM, respectively. Tubulin, GTP, PTX and buffer solutions were pipetted into glass cuvettes (Hellma Analytics) and degassed on ice between 10–30 min to minimize bubble formation, after the addition of GTP and PTX. The dimensions of the glass cuvettes were 40 mm (height) × 10 mm (width) × 1 mm (thickness). Polymerization was achieved by heating the cuvettes on a hotplate or in an incubator set to 41 °C. The experimental configurations (horizontal hotplate, horizontal incubator, vertical hotplate and vertical incubator) employed for evaluating the PTX-MT polymerization are shown in Scheme 2.
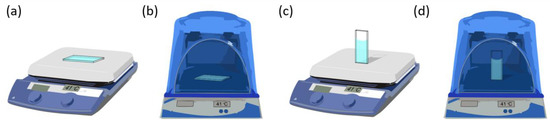
Scheme 2.
Experimental configurations used to evaluate polymerization of PTX-MT solutions: (a) horizontal hotplate, (b) horizontal incubator, (c) vertical hotplate and (d) vertical incubator.
4.2. Atomic Force Microscopy
AFM imaging of PTX-MTs and PTX-free MTs in air was carried out following the preparation method described by Vater et al. [53] Briefly, freshly cleaved mica (Ted Pella, Redding, CA, USA) was pretreated by placing a droplet of poly-l-lysine (0.1% (w/v) in water, Sigma Aldrich, St. Louis, MO, USA) on the surface for 2 min. The excess Poly-l-lysine solution was removed with absorbent paper and then, the treated surface was air dried. A 50 µL drop of the PTX-MT or PTX-free MT solution, treated with diluted glutaraldehyde solution (50 wt.% in water, Sigma Aldrich, St. Louis, MO, USA) for 10 min, was placed on the treated mica surface, and the excess was blotted off after 2 min. The substrate was then blow dried with air. The surface topography was captured with an AFM microscope (Dimension Icon, Bruker, Goleta, CA, USA) operating in ScanAsyst mode using a tip with a 2 nm nominal tip radius (Scanasyst-Air, Bruker, Goleta, CA, USA). The AFM data were processed and plotted with Gwyddion [61].
4.3. Rheology
Rheological measurements on PTX-MT and PTX-free MT solutions were performed with a 20 mm cone and plate (1.98°, 55 µm gap) with solvent trap on a Discovery Hybrid Rheometer 2 (DHR-2, TA Instruments) with Peltier plates at 37 °C. To investigate dynamic MT polymerization, time tests were utilized to monitor storage modulus (G’) and loss modulus (G”) evolution over time at constant angular frequency of 10 rad/sec and strain of 0.1%. Tubulin concentration was 5 mg/mL, and the PTX concentration was 2.5 µM for the PTX-MT solution.
4.4. Optical and Thermal Imaging
The polymerization of the solutions was observed with polarized optical microscopy (POM) at predetermined time intervals after placement of the cuvette onto the hot plate or incubator. The intensity contrast of the POM images obtained with crossed polarizers (CPs) depends on two factors: (i) the angle θ between the CPs and the MT slow axis and (ii) the retardance Δ of the sample. The observed intensity I(θ, Δ) is described by:
In MTs, the slow axis is aligned along the long axis of the tubule. Examination of the above equation, and assuming that Δ is constant and non-zero, reveals that the intensity is maximum when θ = 45° or −45° from the slow axis of the MTs. Hence, by rotating the CPs, the MT slow axis and, hence, their orientation can be revealed. For discrete time interval observations, the glass cuvettes were removed from the heating source and imaged, in transmission, between CPs, with an optical microscope (Axio Imager Z1m, Carl Zeiss). The time intervals were generally 3 h or ~12 h after placement of the cuvettes on the heating source. Comparison of the 3 h and 12 h polymerization patterns revealed that at ~3 h, the solution polymerization reached a semi-stable state with morphology similar to that of the 12 h polymerization. After 12 h, loss of optical contrast and shrinking of the solution due to evaporation were observed. The captured images were then stitched using the Stitching plugin of the Fiji version of ImageJ [62]. Orientational analysis of the MT fibrils was carried out with OrientationJ Distribution of the OrientationJ plugin in ImageJ [63].
Polarized optical and thermal imaging videos captured the dynamic evolution of the PTX-MT solutions heated on the hot plate. For the incubator experiments, the cuvette was shielded from the ambient environment with a plastic cover, which prevented acquisition of optical or thermal videos. For these observations, the hot plate was placed between a white-light, high-brightness, light-emitting diode source and an optical camera (UI-3060P, IDS) equipped with a variable optical zoom assembly (MVL6X12Z, MVL6X05L, Thorlabs). Two crossed polarizers (LPVISE2X2, Thorlabs) were attached to the LED and camera assembly, respectively, and video of the polymerization process was continuously captured after a glass cuvette containing the solutions of interest, was placed onto the heated hot plate. Thermal imaging was carried out with a research-grade thermal camera (A655c, FLIR Systems Inc.) equipped with a 25° field of view (FOV), f = 24.6 mm infrared lens (T197922, FLIR). The emissivity was assumed to be 0.95 and the distance from the cuvette was ~1 m.
Supplementary Materials
The following are available online at https://www.mdpi.com/2073-4352/10/1/43/s1, Figure S1: AFM imaging of (a) PTX-MTs and (b) PTX-free MTs in air on freshly cleaved mica after ~12 h incubation. Tubulin concentration was 5 mg/mL and PTX concentration was 2.5 µM. Figure S2: POM images of PTX-MT solutions for hotplate heated PTX-MTs (a) 36 °C, (b) 41 °C, (c) 46 °C and incubator heated PTX-MTs (d) 36 °C, (e) 41 °C, (f) 46 °C at 3.5 h incubation. Tubulin concentration 10 mg/mL, PTX concentration 2.5 µM. Scale bar is 2.5 mm. Figure S3: POM images of PTX-MT solutions for hotplate heated PTX-MTs (a), (c) at 3.5 h and (b), (d) at ~12 h incubation. Tubulin concentration 10 mg/mL, PTX concentration 2.5 µM. Scale bar is 2.5 mm. Figure S4: POM images of PTX-MT solution for (a) CP1 and (b) CP2 configuration, collected at 3.5 h incubation. Tubulin concentration was 5 mg/mL, and PTX concentration was 2.5 µM. Scale bar is 2.5 mm. Figure S5: Higher magnification POM images of PTX-MT horizontal hotplate polymerization obtained at 15 min incubation. CPs are rotating from CP1 (a) to CP2 (j) configuration. Scale bar is 1 mm. Figure S6: Higher magnification POM images of PTX-MT horizontal hotplate polymerization obtained at ~12 h incubation. CPs are rotating from CP1 (a) to CP2 (j) configuration. Scale bar is 1 mm. Figure S7: Higher magnification POM images of PTX-MT vertical hotplate polymerization obtained at 15 min incubation. CPs are rotating from CP1 (a) to CP2 (j) configuration. Scale bar is 1 mm. Figure S8: Higher magnification POM images of PTX-MT vertical hotplate polymerization obtained at ~12 h incubation. CPs are rotating from CP1 (a) to CP2 (j) configuration. Scale bar is 1 mm. Figure S9: Tracking particle motion in a heated PTX-MT cuvette. Over time particle motion stops due to gelation of solution. Tubulin concentration was 5 mg/mL and PTX concentration was 2.5 µM. Scale bar is 2 mm. Figure S10: Particle tracking in PTX-MT solutions. (a) Particle trajectory and (b) particle displacement for the 0.5 µM and 2.0 µM PTX solutions. Cessation of particle motion is indicated by horizontal leveling of the displacement curves. Figure S11: Thermal images of PTX-MT solutions (tubulin concentration 5 mg/mL) and PTX concentration was (a) 0.5 µM, (b) 1.0 µM, (c), 2.0 µM and (d) 2.5 µM. Figure S12: POM image under CP2 configuration showing formation of PTX-MT bundles along the vertical and bottom portion of a vertical cuvette heated on a hotplate. Scale bar is 2.5 mm. Figure S13: POM images of PTX-MT solutions (tubulin concentration 5 mg/mL) and PTX concentration was (a) 0.5 µM, (b) 1.0 µM, (c), 2.0 µM and (d) 2.5 µM. Scale bar is 2 mm. Figure S14: POM images of PTX-MT solutions under CP1 configuration obtained at 240 min incubation. Tubulin concentration was 5 mg/mL and PTX concentration was (a) 0.5 µM, (b) 1.0 µM, (c), 2.0 µM and (d) 2.5 µM. Scale bar is 2 mm. Figure S15: POM images of PTX-MT solutions (tubulin concentration 5 mg/mL) and 5 nM PTX dissolved in water. (a) CP1 (b) CP2 configuration for a 3.5 h incubation. (c), CP1, (d) CP2 configuration ~12 h incubation. Scale bar is 2.5 mm. Figure S16: POM images of PTX-MT solutions (tubulin concentration 5 mg/mL) and 5 nM PTX dissolved in DMSO. (a) CP1 (b) CP2 configuration for a 3.5 h incubation. (c), CP1, (d) CP2 configuration ~12 h incubation. Scale bar is 2.5 mm. Figure S17: POM images of MT seeded PTX-MT solutions (tubulin concentration 5 mg/mL, 5 nM PTX). PTX dissolved in water (a) CP1 (b) CP2 configuration; PTX dissolved in DMSO (c) CP1 (d) CP2 configuration for a 3.5 h incubation. Scale bar is 2.5 mm. Video S1: PTX-MT polymerization for horizontal hotplate 15 min incubation. CPs rotate from CP1 to CP2 configuration. Tubulin concentration was 10 mg/mL and PTX concentration was 2.5 µM. Video S2: PTX-MT polymerization for horizontal hotplate 3.5 h incubation. CPs rotate from CP1 to CP2 configuration. Tubulin concentration was 10 mg/mL and PTX concentration was 2.5 µM. Video S3: PTX-MT polymerization for horizontal hotplate ~12 h incubation. CPs rotate from CP1 to CP2 configuration. Tubulin concentration was 10 mg/mL and PTX concentration was 2.5 µM. Video S4: PTX-MT polymerization for vertical hotplate 15 min incubation. CPs rotate from CP1 to CP2 configuration. Tubulin concentration was 10 mg/mL and PTX concentration was 2.5 µM. Video S5: PTX-MT polymerization for vertical hotplate 3.5 h incubation. CPs rotate from CP1 to CP2 configuration. Tubulin concentration was 10 mg/mL and PTX concentration was 2.5 µM. Video S6: PTX-MT polymerization for vertical hotplate ~12 h incubation. CPs rotate from CP1 to CP2 configuration. Tubulin concentration was 10 mg/mL and PTX concentration was 2.5 µM. Video S7: Time-dependent POM images of MT solution for vertical hotplate incubation. Tubulin concentration was 5 mg/m. Video S8: Time-dependent POM images of MT-PTX solution for vertical hotplate incubation. Tubulin concentration was 5 mg/m and PTX concentration was 0.5 µM. Video S9: Time-dependent POM images of MT-PTX solution for vertical hotplate incubation. Tubulin concentration was 5 mg/m and PTX concentration was 1.0 µM. Video S10: Time-dependent POM images of MT-PTX solution for vertical hotplate incubation. Tubulin concentration was 5 mg/m and PTX concentration was 2.0 µM. Video S11: Time-dependent POM images of PTX-MT solution for vertical hotplate incubation. Tubulin concentration was 5 mg/m and PTX concentration was 2.5 µM. Video S12: Time-dependent thermal imaging of PTX-MT solution for vertical hotplate incubation. Tubulin concentration was 5 mg/m and PTX concentration was 0.5 µM. Video S13: Time-dependent thermal imaging of PTX-MT solution for vertical hotplate incubation. Tubulin concentration was 5 mg/m and PTX concentration was 2.5 µM.
Author Contributions
Conceptualization, K.R.P.; methodology, E.B., X.G., E.M.A., T.L.T., C.M.W., and K.R.P.; investigation, E.B., X.G., E.M.A., T.L.T., C.M.W., K.R.P.; writing-original draft preparation, E.B.; writing- review and editing, E.B., X.G., E.M.A., T.L.T., C.M.W., and K.R.P.; supervision, K.R.P.; project administration, K.R.P.; funding acquisition: K.R.P. All authors have read and agreed to the published version of the manuscript.
Funding
This research was funded by the U.S. Army Basic Research Program under PE 611102, Project T22, “Probing the morphological and mechanical tunability of microtubules” Task 02 “Material Modeling for Force Protection.” The APC was funded by PE 611102, Project T22, Task 02 “Material Modeling for Force Protection.” The research was managed and executed at the U.S. Army Engineer Research and Development Center at Vicksburg, MS.
Acknowledgments
The authors would like to thank Jay Tang, Brown University for providing samples and insights into MT polymerization in solution.
Conflicts of Interest
The authors declare no conflict of interest.
References
- Pierson, G.B.; Burton, P.R.; Himes, R.H. Alterations in number of protofilaments in microtubules assembled in vitro. J. Cell Biol. 1978, 76, 223–228. [Google Scholar] [CrossRef] [PubMed]
- Desai, A.; Mitchison, T. Microtubule polymerization dynamics. Annu. Rev. Cell Dev. Biol. 1997, 13, 83–117. [Google Scholar] [CrossRef] [PubMed]
- Nogales, E.; Wang, H.-W. Structural intermediates in microtubule assembly and disassembly: How and why? Curr. Opin. Cell Biol. 2006, 18, 179–184. [Google Scholar] [CrossRef]
- Draber, P.; Sulimenko, V.; Draberova, E. Cytoskeleton in mast cell signaling. Front. Immunol. 2012, 3, 130. [Google Scholar] [CrossRef] [PubMed]
- Herzog, W.; Weber, K. In vitro assembly of pure tubulin into microtubules in the absence of microtubule-associated proteins and glycerol. Proc. Natl. Acad. Sci. USA 1977, 74, 1860–1864. [Google Scholar] [CrossRef] [PubMed]
- Pampaloni, F.; Lattanzi, G.; Jonas, A.; Surrey, T.; Frey, E.; Florin, E.L. Thermal fluctuations of grafted microtubules provide evidence of a length-dependent persistence length. Proc. Natl. Acad. Sci. USA 2006, 103, 10248–10253. [Google Scholar] [CrossRef]
- Lodish, H.; Berk, A.; Zipursky, S.L.; Matsudaira, P.; Baltimore, D.; Darnell, J. Molecular Cell Biology, 4th ed.; W. H. Freeman: New York, NY, USA, 2000. [Google Scholar]
- Rohena, C.C.; Mooberry, S.L. Recent progress with microtubule stabilizers: New compounds, binding modes and cellular activities. Nat. Prod. Rep. 2014, 31, 335–355. [Google Scholar] [CrossRef]
- Fletcher, D.A.; Mullins, R.D. Cell mechanics and the cytoskeleton. Nature 2010, 463, 485–492. [Google Scholar] [CrossRef]
- Kirschner, M.W.; Williams, R.C. The mechanism of microtubule assembly in vitro. J. Supramol. Struct. 1974, 2, 412–428. [Google Scholar] [CrossRef]
- Dentler, W.L.; Granett, S.; Witman, G.B.; Rosenbaum, J.L. Directionality of brain microtubule assembly in vitro. Proc. Natl. Acad. Sci. USA 1974, 71, 1710–1714. [Google Scholar] [CrossRef]
- Margolis, R.L.; Wilson, L. Opposite end assembly and disassembly of microtubules at steady state in vitro. Cell 1978, 13, 1–8. [Google Scholar] [CrossRef]
- Schiff, P.B.; Fant, J.; Horwitz, S.B. Promotion of microtubule assembly in vitro by taxol. Nature 1979, 277, 665–667. [Google Scholar] [CrossRef] [PubMed]
- Pampaloni, F.; Flori, E.-L. Microtubule architecture: Inspiration for novel carbon nanotube-based biomimetic materials. Trends Biotechnol. 2008, 26, 302–310. [Google Scholar] [CrossRef] [PubMed]
- Hamant, O.; Inoue, D.; Bouchez, D.; Dumais, J.; Mjolsness, E. Are microtubules tension sensors? Nat. Commun. 2019, 10, 2360. [Google Scholar] [CrossRef]
- Subramaniyan Parimalam, S.; Tarhan, M.C.; Karsten, S.L.; Fujita, H.; Shintaku, H.; Kotera, H.; Yokokawa, R. On-chip microtubule gliding assay for parallel measurement of tau protein species. Lab Chip 2016, 16, 1691–1697. [Google Scholar] [CrossRef]
- Hess, H.; Bachand, G.D.; Vogel, V. Powering nanodevices with biomolecular motors. Chem. Eur. J. 2004, 10, 2110–2116. [Google Scholar] [CrossRef]
- Inoue, D.; Nitta, T.; Kabir, A.M.R.; Sada, K.; Gong, J.P.; Konagaya, A.; Kakugo, A. Sensing surface mechanical deformation using active probes driven by motor proteins. Nat. Commun. 2016, 7, 12557. [Google Scholar] [CrossRef]
- Keya, J.J.; Suzuki, R.; Kabir, A.M.R.; Inoue, D.; Asanuma, H.; Sada, K.; Hess, H.; Kuzuya, A.; Kakugo, A. DNA-assisted swarm control in a biomolecular motor system. Nat. Commun. 2018, 9, 453. [Google Scholar] [CrossRef]
- Matsuda, K.; Kabir, A.M.R.; Akamatsu, N.; Saito, A.; Ishikawa, S.; Matsuyama, T.; Ditzer, O.; Islam, M.S.; Ohya, Y.; Sada, K.; et al. Artificial smooth muscle model composed of hierarchically ordered microtubule asters mediated by DNA origami nanostructures. Nano Lett. 2019, 19, 3933–3938. [Google Scholar] [CrossRef]
- Mitov, M. Cholesteric liquid crystals in living matter. Soft Matter 2017, 13, 4176–4209. [Google Scholar] [CrossRef]
- Rey, A.D. Liquid crystal models of biological materials and processes. Soft Matter 2010, 6, 3402–3429. [Google Scholar] [CrossRef]
- DeCamp, S.J.; Redner, G.S.; Baskaran, A.; Hagan, M.F.; Dogic, Z. Orientational order of motile defects in active nematics. Nat. Mater. 2015, 14, 1110–1115. [Google Scholar] [CrossRef]
- Hitt, A.L.; Cross, A.R.; Williams, R.C., Jr. Microtubule solutions display nematic liquid crystalline structure. J. Biol. Chem. 1990, 265, 1639–1647. [Google Scholar] [PubMed]
- Glade, N.; Demongeot, J.; Tabony, J. Microtubule self-organisation by reaction-diffusion processes causes collective transport and organisation of cellular particles. BMC Cell Biol. 2004, 5, 23. [Google Scholar] [CrossRef] [PubMed][Green Version]
- Tabony, J.; Glade, N.; Demongeot, J.; Papaseit, C. Biological self-organization by way of microtubule reaction-diffusion processes. Langmuir 2002, 18, 7196–7207. [Google Scholar] [CrossRef]
- Coppin, C.M.; Leavis, P.C. Quantitation of liquid-crystalline ordering in F-actin solutions. Biophys. J. 1992, 63, 794–807. [Google Scholar] [CrossRef]
- Giraud-Guille, M.M. Liquid crystallinity in condensed type-I collagen solutions—A clue to the packing of collagen in extracellular matrices. J. Mol. Biol. 1992, 224, 861–873. [Google Scholar] [CrossRef]
- Murthy, N.S. Liquid crystallinity in collagen solutions and magnetic orientation of collagen fibrils. Biopolymers 1984, 23, 1261–1267. [Google Scholar] [CrossRef]
- Knight, D.P.; Vollrath, F. Liquid crystals and flow elongation in a spider’s silk production line. Proc. R. Soc. B Biol. Sci. 1999, 266, 519–523. [Google Scholar] [CrossRef]
- Kerkam, K.; Viney, C.; Kaplan, D.; Lombardi, S. Liquid crystallinity of natural silk secretions. Nature 1991, 349, 596–598. [Google Scholar] [CrossRef]
- Krebs, M.R.H.; MacPhee, C.E.; Miller, A.F.; Dunlop, I.E.; Dobson, C.M.; Donald, A.M. The formation of spherulites by amyloid fibrils of bovine insulin. Proc. Natl. Acad. Sci. USA 2004, 101, 14420–14424. [Google Scholar] [CrossRef] [PubMed]
- Corrigan, A.M.; Muller, C.; Krebs, M.R.H. The formation of nematic liquid crystal phases by hen lysozyme amyloid fibrils. J. Am. Chem. Soc. 2006, 128, 14740–14741. [Google Scholar] [CrossRef] [PubMed]
- Sagis, L.M.C.; Veerman, C.; van der Linden, E. Mesoscopic properties of semiflexible amyloid fibrils. Langmuir 2004, 20, 924–927. [Google Scholar] [CrossRef] [PubMed]
- Tabony, J. Morphological bifurcations involving reaction-diffusion processes during microtubule formation. Science 1994, 264, 245–248. [Google Scholar] [CrossRef] [PubMed]
- Kakugo, A.; Tamura, Y.; Shikinaka, K.; Yoshida, M.; Kawamura, R.; Furukawa, H.; Osada, Y.; Gong, J.P. Formation of well-oriented microtubules with preferential polarity in a confined space under a temperature gradient. J. Am. Chem. Soc. 2009, 131, 18089–18095. [Google Scholar] [CrossRef] [PubMed]
- Hyman, A.A.; Chretien, D.; Arnal, I.; Wade, R.H. Structural changes accompanying GTP hydrolysis in microtubules: Information from a slowly hydrolyzable analogue guanylyl-(alpha,beta)-methylene-diphosphonate. J. Cell Biol. 1995, 117–125. [Google Scholar] [CrossRef] [PubMed]
- Antal, T.; Krapivsky, P.L.; Redner, S.; Mailman, M.; Chakraborty, B. Dynamics of an idealized model of microtubule growth and catastrophe. Phys. Rev. E 2007, 76, 041907. [Google Scholar] [CrossRef]
- Mitchison, Y.; Kirschner, M. Dynamic instability of microtubule growth. Nature 1984, 312, 237–242. [Google Scholar] [CrossRef]
- Erickson, H.P.; O’Brien, E.T. Microtubule dynamic instability and GTP hydrolysis. Annu. Rev. Biophys. Biomol. Struct. 1992, 21, 145–166. [Google Scholar] [CrossRef]
- Mandelkow, E.; Mandelkow, E.M. Microtubules and microtubule-associated proteins. Curr. Opin. Cell Biol. 1995, 72–81. [Google Scholar] [CrossRef]
- Kumar, N. Taxol-induced polymerization of purified tubulin. Mechanism of action. J. Biol. Chem. 1981, 256, 10435–10441. [Google Scholar] [PubMed]
- Arnal, I.; Wade, R.H. How does taxol stabilize microtubules? Curr. Biol. 1995, 5, 900–908. [Google Scholar] [CrossRef]
- Bollag, D.M.; McQueney, P.A.; Zhu, J.; Hensens, O.; Koupal, L.; Liesch, J.; Goetz, M.; Lazarides, E.; Woods, C.M. Epothilones, a new class of microtubule-stabilizing agents with a taxol-like mechanism of action. Cancer Res. 1995, 55, 2325–2333. [Google Scholar] [PubMed]
- Li, J.; Risinger, A.L.; Mooberry, S.L. Taccalonolide microtubule stabilizers. Bioorg. Med. Chem. 2014, 22, 5091–5096. [Google Scholar] [CrossRef] [PubMed]
- Sáez-Calvo, G.; Sharma, A.; Balaguer, F.A.; Barasoain, I.; Rodríguez-Salarichs, J.; Olieric, N.; Muñoz-Hernández, H.; Berbís, M.A.; Wendeborn, S.; Peñalva, M.A.; et al. Triazolopyrimidines are Microtubule-stabilizing agents that bind the Vinca inhibitor site of tubulin. Cell Chem. Biol. 2017, 24, 737–750. [Google Scholar] [CrossRef] [PubMed]
- Wang, Y.; Mandelkow, E. Tau in physiology and pathology. Nat. Rev. Neurosci. 2016, 17, 22–35. [Google Scholar] [CrossRef]
- Fanale, D.; Bronte, G.; Passiglia, F.; Calo, V.; Castiglia, M.; Di Piazza, F.; Barraco, N.; Cangemi, A.; Catarella, M.T.; Insalaco, L.; et al. Stabilizing versus destabilizing the microtubules: A double-edge sword for an effective cancer treatment option? Anal. Cell Pathol. 2015, 690916. [Google Scholar] [CrossRef]
- Nasrin, S.R.; Kabir, A.M.R.; Konagaya, A.; Ishihara, T.; Sada, K.; Kakugo, A. Stabilization of microtubules by cevipabulin. Biochem. Biophys. Res. Commun. 2019, 3, 760–764. [Google Scholar] [CrossRef]
- Amos, L.A.; Lowe, J. How Taxol stabilises microtubule structure. Chem. Biol. 1999, 6, R65–R69. [Google Scholar] [CrossRef]
- Xiao, H.; Verdier-Pinard, P.; Fernandez-Fuentes, N.; Burd, B.; Angeletti, R.; Fiser, A.; Horwitz, S.B.; Orr, G.A. Insights into the mechanism of microtubule stabilization by Taxol. Proc. Natl. Acad. Sci. USA 2006, 103, 10166–10173. [Google Scholar] [CrossRef]
- Ginsburg, A.; Shemesh, A.; Millgram, A.; Dharan, R.; Levi-Kalisman, Y.; Ringel, I.; Raviv, U. Structure of dynamic, Taxol-stabilized, and GMPPCP-stabilized microtubule. J. Phys. Chem. B 2017, 121, 8427–8436. [Google Scholar] [CrossRef] [PubMed]
- Vater, W.; Fritzsche, W.; Schaper, A.; Bohm, K.J.; Unger, E.; Jovin, T.M. Scanning force microscopy of microtubules and polymorphic tubulin assemblies in air and in liquid. J. Cell Sci. 1995, 108, 1063–1069. [Google Scholar]
- Hamon, L.; Savarin, P.; Curmi, P.A.; Pastre, D. Rapid assembly and collective behavior of microtubule bundles in the presence of polyamines. Biophys. J. 2011, 101, 205–216. [Google Scholar] [CrossRef] [PubMed]
- Hashemnejad, S.M.; Kundu, S. Probing gelation and rheological behavior of a self-assembled molecular gel. Langmuir 2017, 33, 7769–7779. [Google Scholar] [CrossRef] [PubMed]
- Liu, Y.; Guo, Y.; Valles, J.M., Jr.; Tang, J.X. Microtubule bundling and nested buckling drive stripe formation in polymerizing tubulin solutions. Proc. Natl. Acad. Sci. USA 2006, 103, 10654–10659. [Google Scholar] [CrossRef] [PubMed]
- Shikinaka, K.; Mori, S.; Shigehara, K.; Masunaga, H. Helical alignment inversion of microtubules in accordance with a structural change in their lattice. Soft Matter 2015, 11, 3869–3874. [Google Scholar] [CrossRef]
- Liu, J.H.; Hsia, K.C.; Yokokawa, R.; Lu, Y.W. Microtubule polymerization in alignment by an on-chip temperature gradient platform. Sens. Actuators B Chem. 2019, 298, 126813. [Google Scholar] [CrossRef]
- Denis, P.A. Heuristic consequences of a load of oxygen in microtubules. BioSystems 2014, 118, 17–30. [Google Scholar] [CrossRef]
- Majumdar, A.; Cristina, M.M.; Virga, E.G. Perspectives in active liquid crystals. Philos. Trans. A Math. Phys. Eng. Sci. 2014, 372, 20130373. [Google Scholar] [CrossRef]
- Necas, D.; Klapetek, P. Gwyddion: An open-source software for SPM data analysis. Open Phys. 2012, 10, 181–188. [Google Scholar] [CrossRef]
- Schindelin, J.; Arganda-Carreras, I.; Frise, E.; Kaynig, V.; Longair, M.; Pietzsch, T.; Preibisch, S.; Rueden, C.; Saalfeld, S.; Schmid, B.; et al. Fiji: An open-source platform for biological-image analysis. Nat. Methods 2012, 9, 676–682. [Google Scholar] [CrossRef] [PubMed]
- Rezakhaniha, R.; Agianniotis, A.; Schrauwen, J.T.C.; Griffa, A.; Sage, D.; Bouten, C.V.C.; van de Vosse, F.N.; Unser, M.; Stergiopulos, N. Experimental investigation of collagen waviness and orientation in the arterial adventitia using confocal laser scanning microscopy. Biomech. Model. Mechanobiol. 2012, 11, 461–473. [Google Scholar] [CrossRef] [PubMed]
© 2020 by the authors. Licensee MDPI, Basel, Switzerland. This article is an open access article distributed under the terms and conditions of the Creative Commons Attribution (CC BY) license (http://creativecommons.org/licenses/by/4.0/).