Precipitated K-Promoted Co–Mn–Al Mixed Oxides for Direct NO Decomposition: Preparation and Properties

 ,
,  and
and 
Abstract
:1. Introduction
2. Results
2.1. Properties of the Dried Samples
2.1.1. Phase Composition
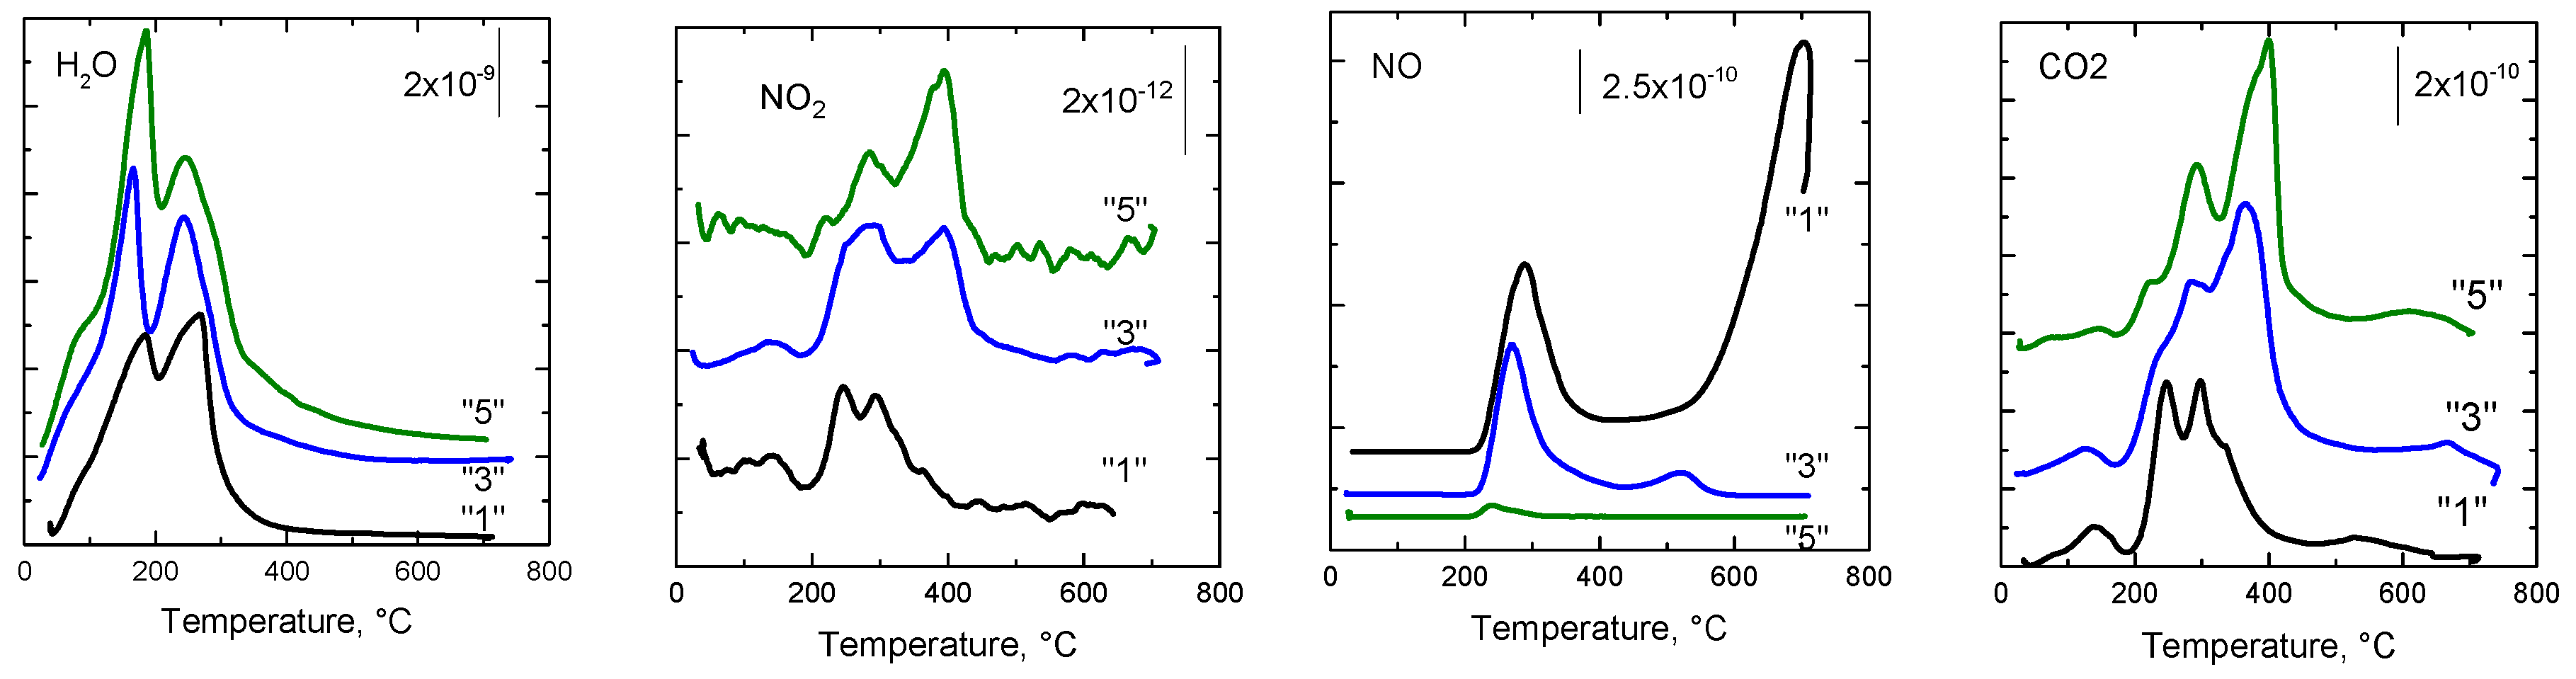
2.1.2. TG and DTG Measurements
2.2. Properties of the Calcined Precursors
2.2.1. Chemical Composition
2.2.2. Phase Composition
2.2.3. Textural Properties
2.2.4. Reducibility
2.2.5. Basicity
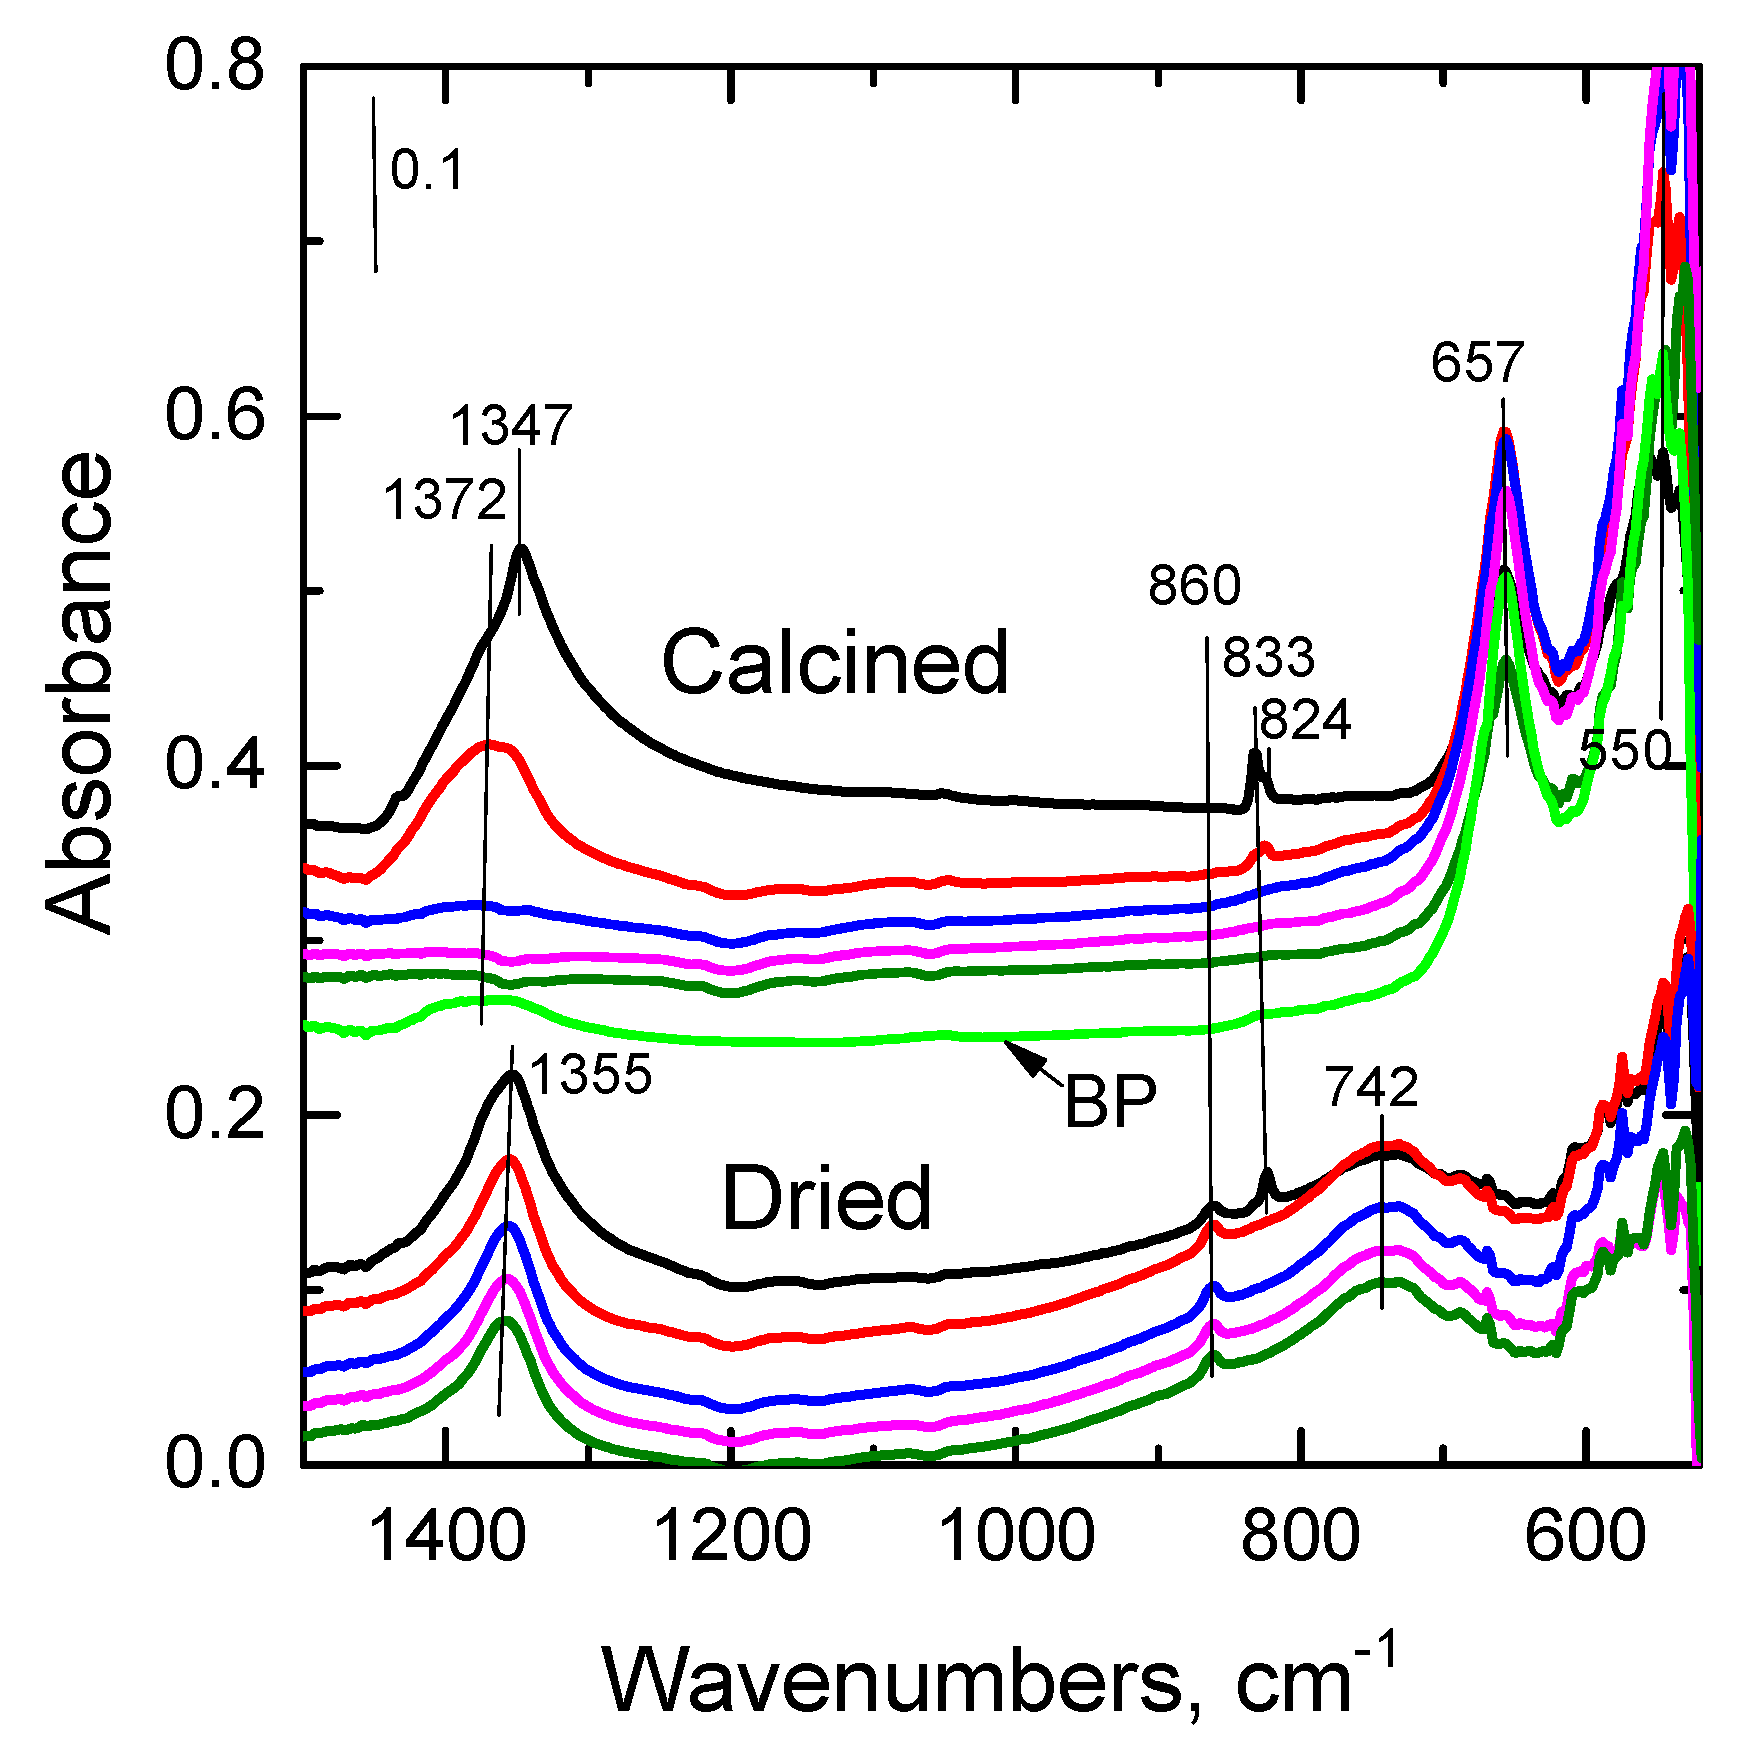
2.2.6. FTIR
2.2.7. Surface Composition
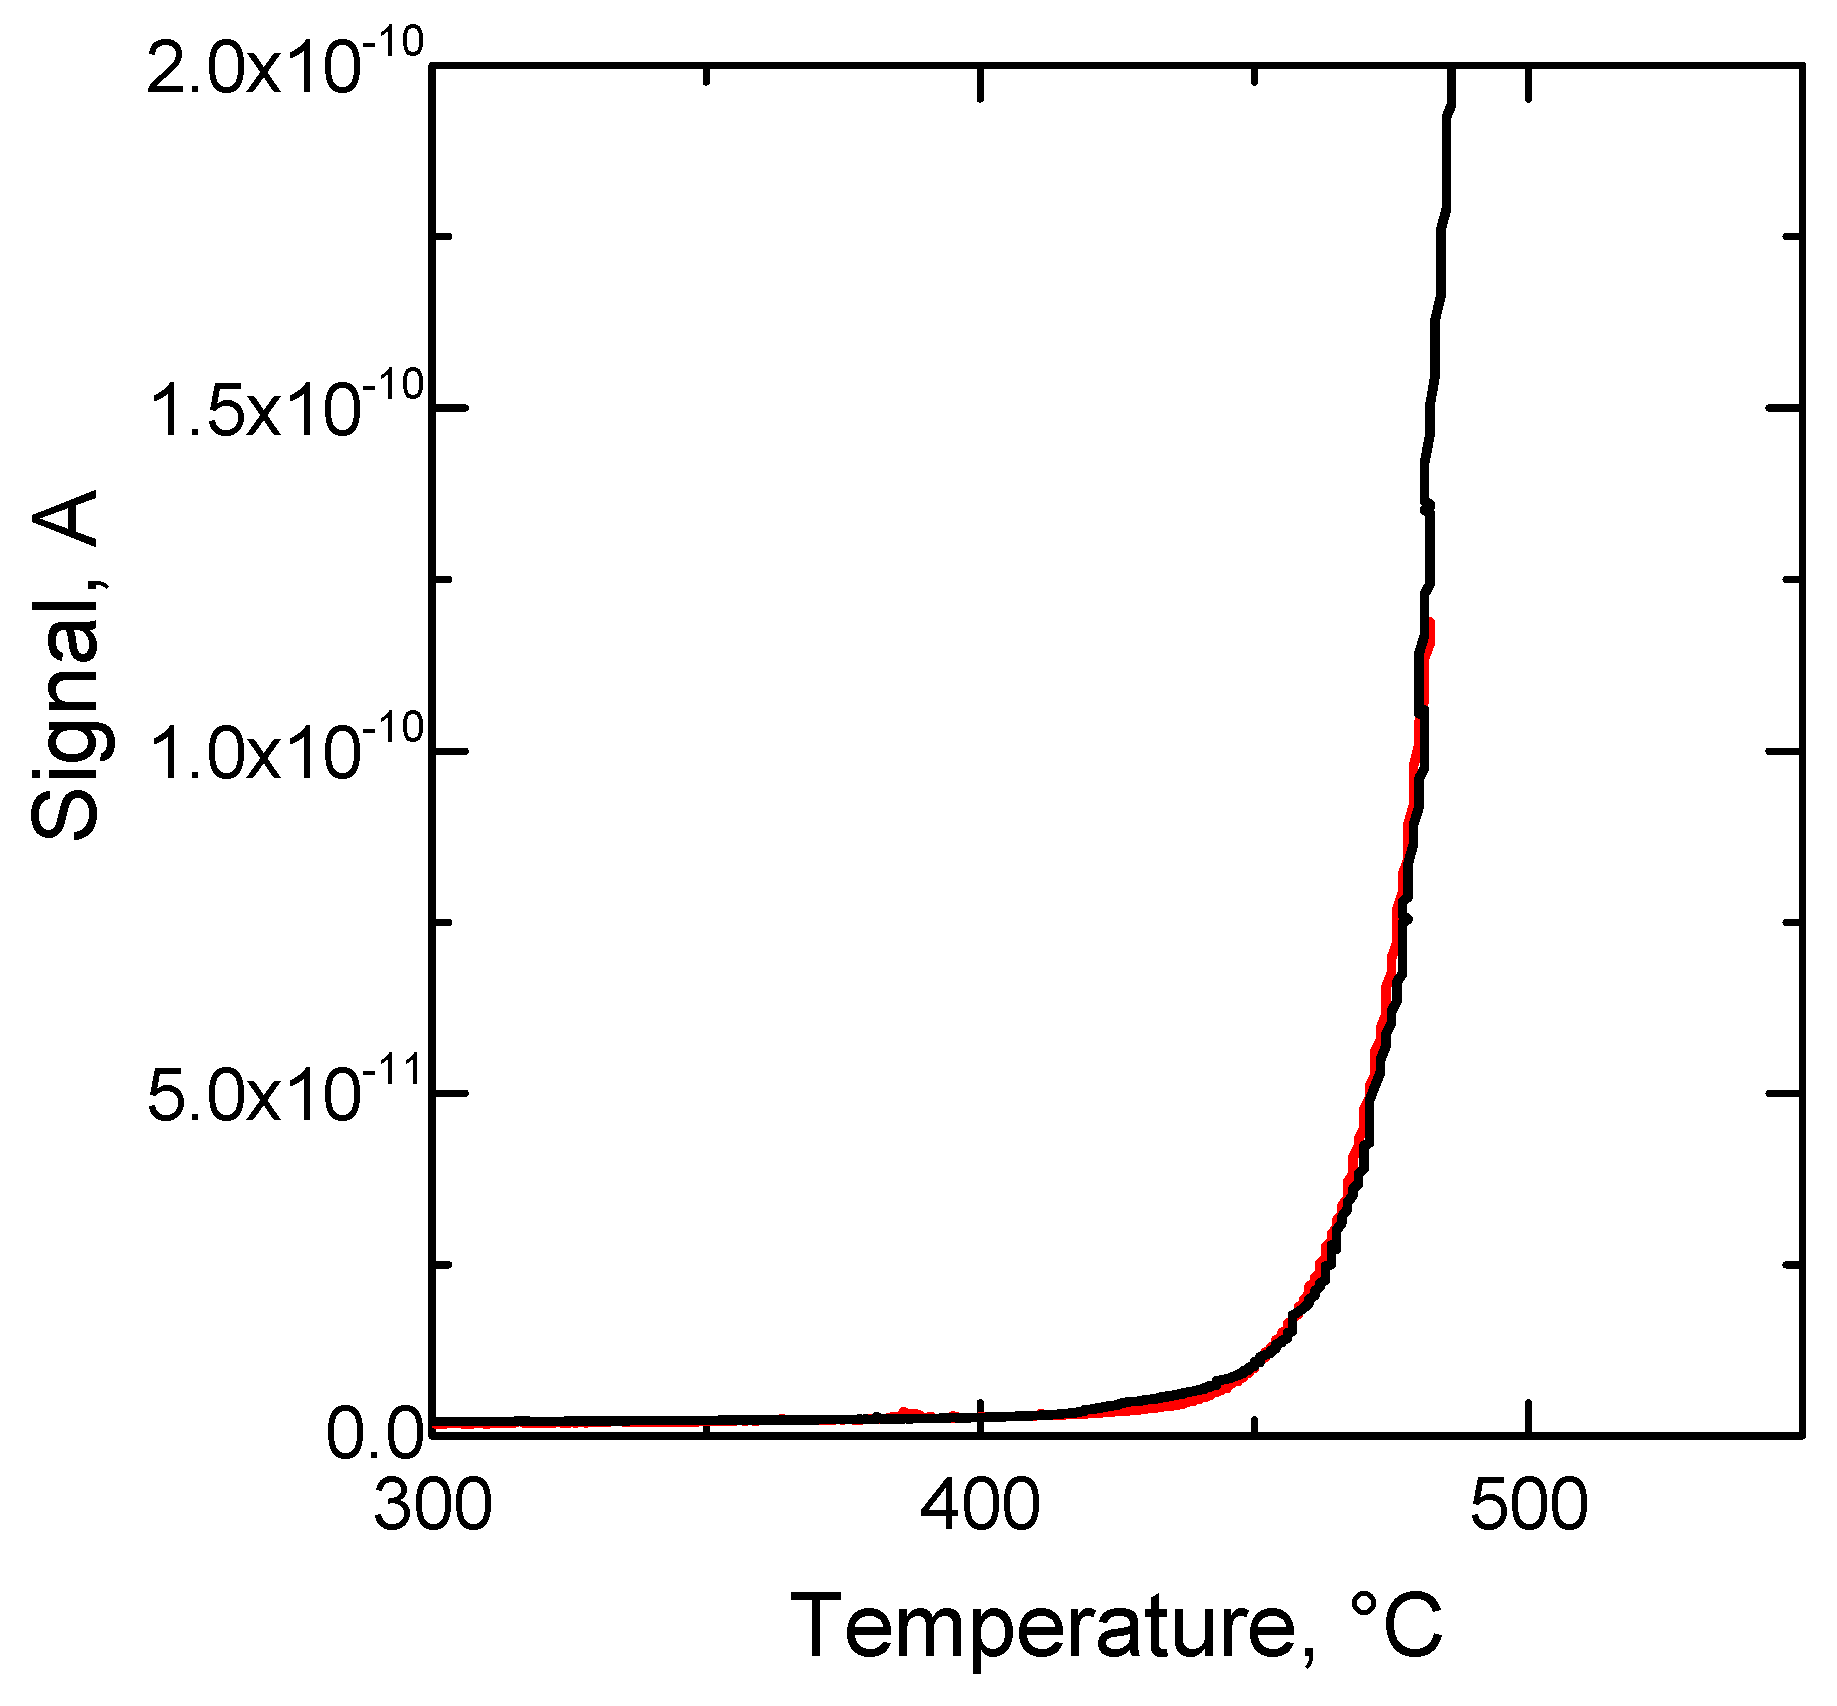
2.2.8. Species-Resolved Thermal Alkali Desorption (SR-TAD)
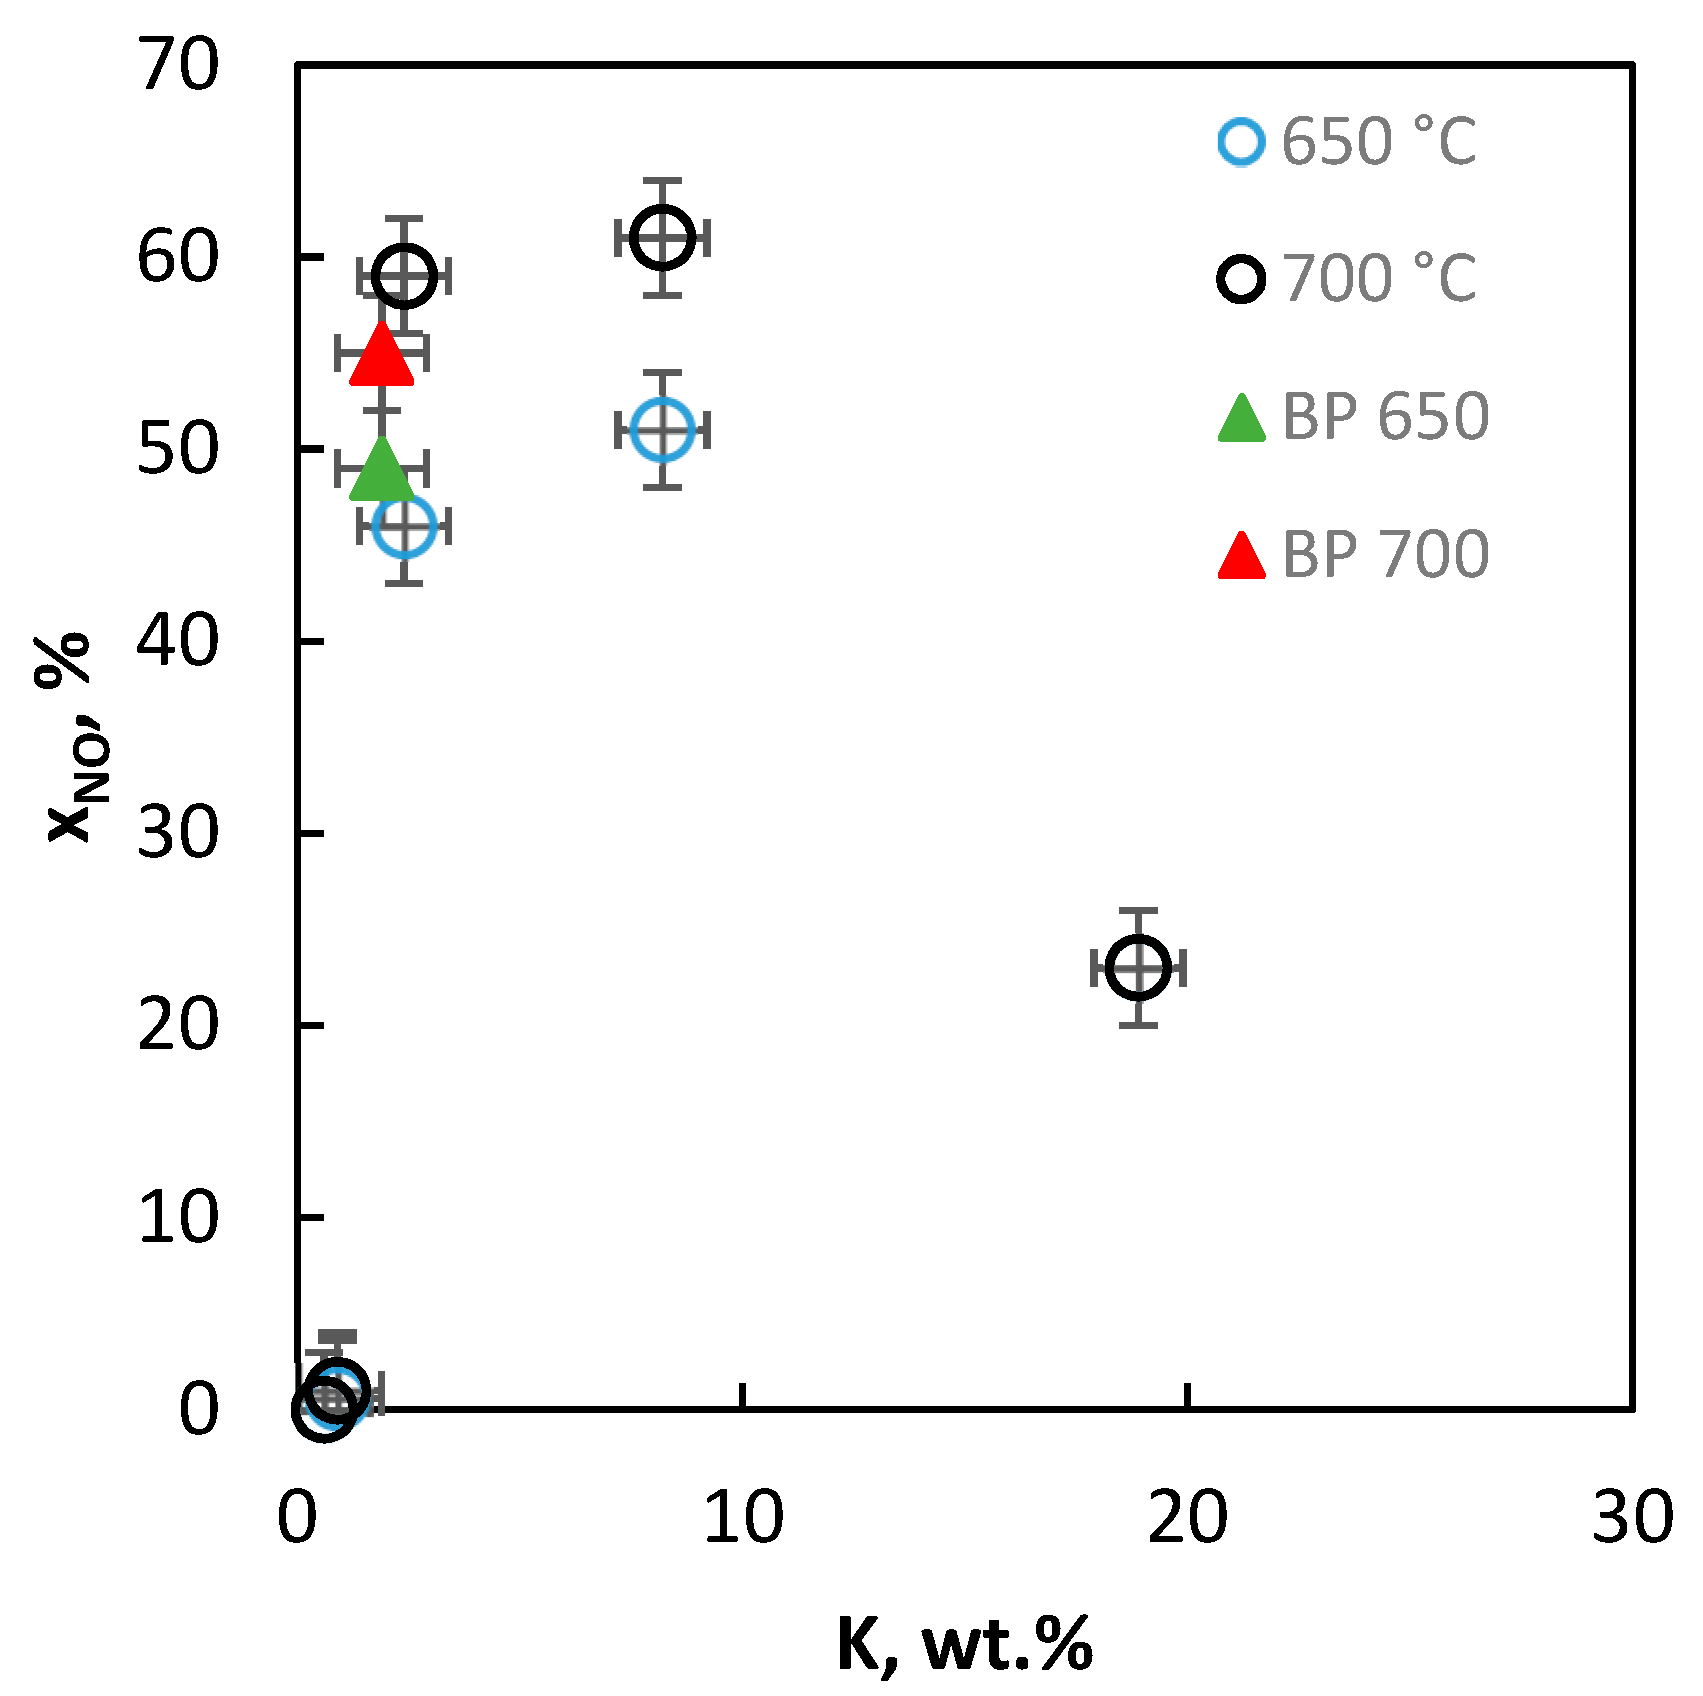
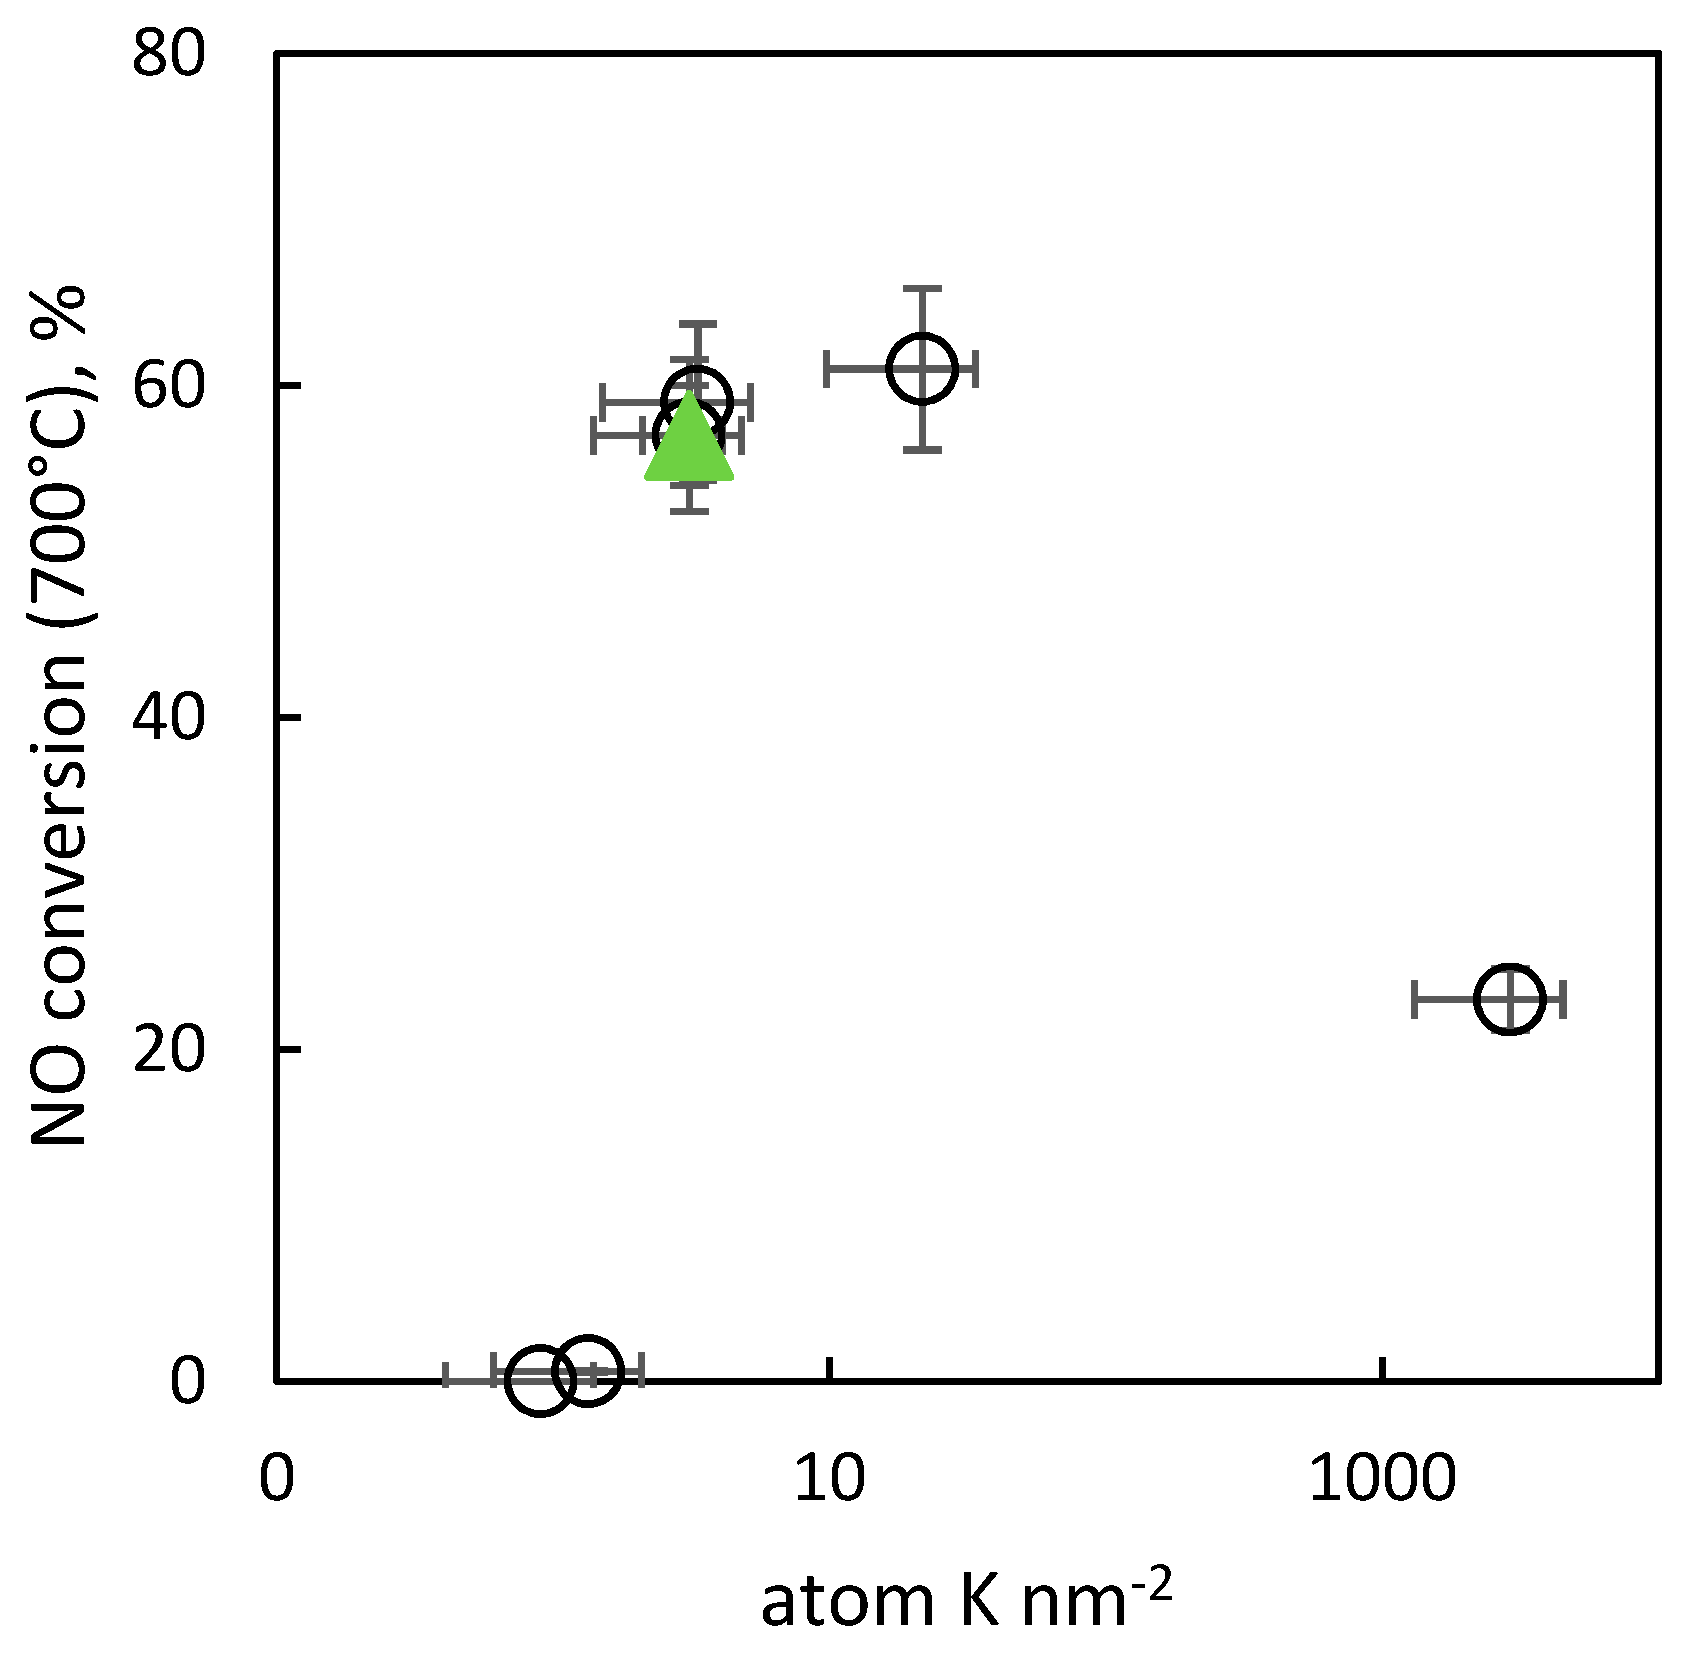
2.2.9. Activity of the Catalysts in Decomposition of NO
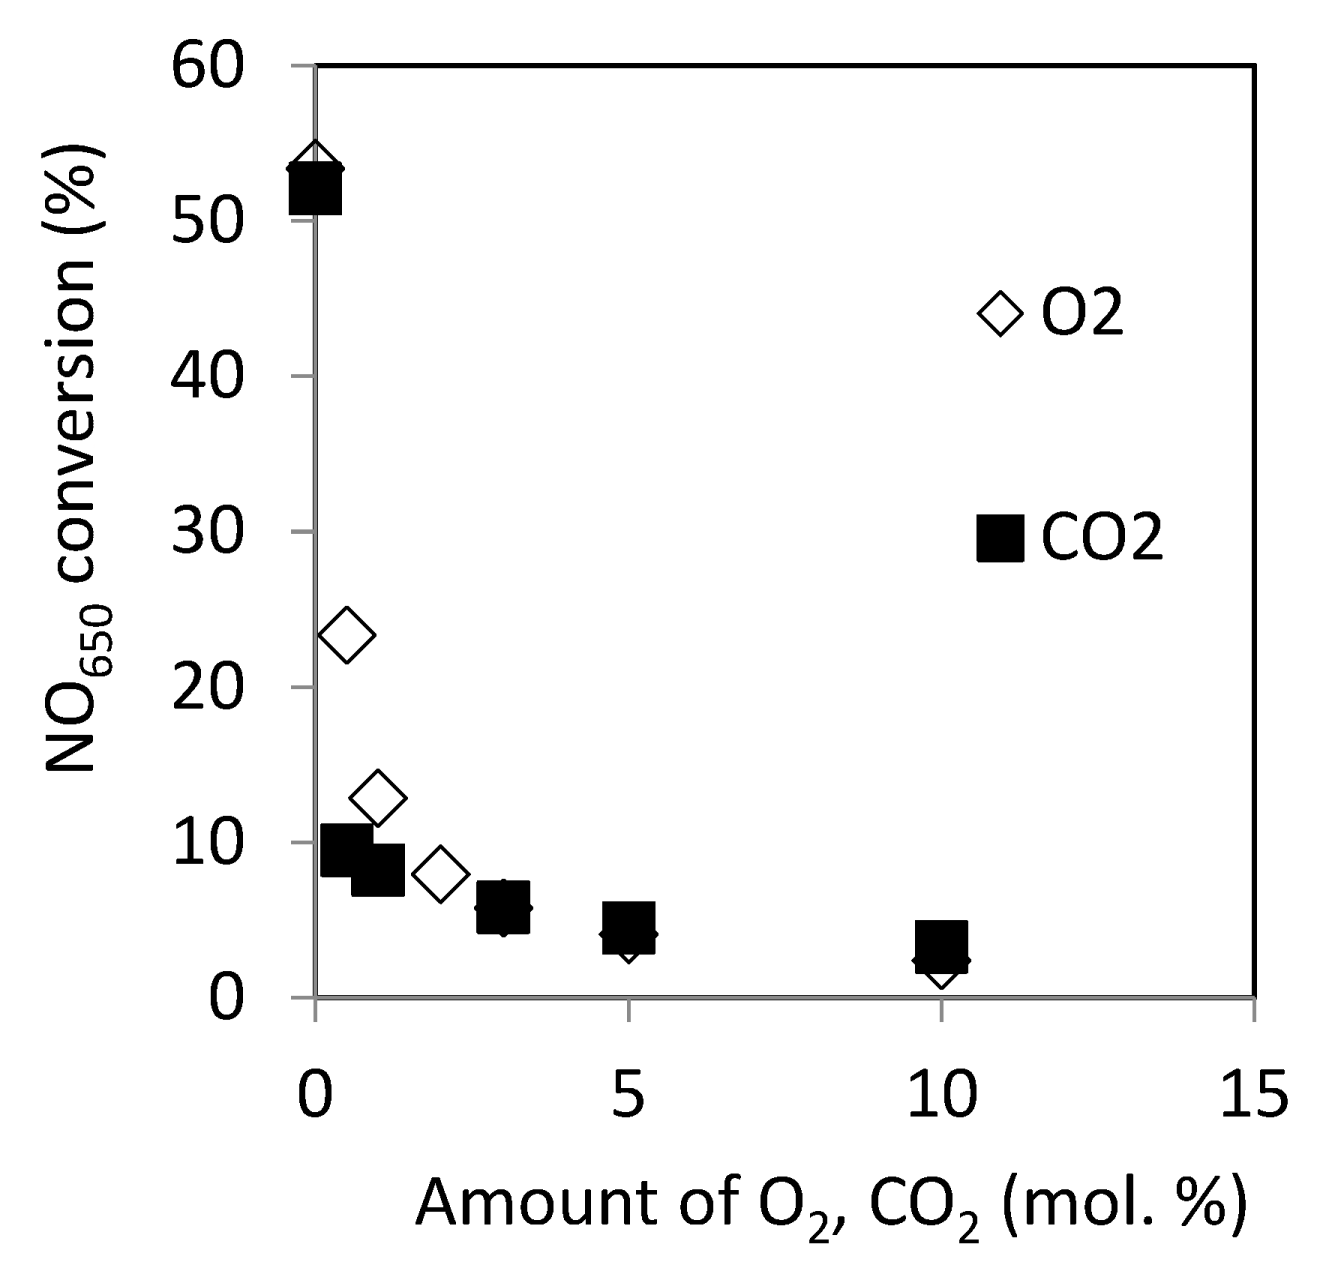
2.2.10. Effect of O2 and CO2 in the Reactant on Catalytic Activity
3. Discussion
4. Materials and Methods
4.1. Preparation of Catalysts
4.2. Characterization of the Samples
5. Conclusions
Supplementary Materials
Author Contributions
Funding
Acknowledgments
Conflicts of Interest
References
- Bu, Y.F.; Ding, D.; Gan, L.; Xiong, X.H.; Cai, W.; Tan, W.T.; Zhong, Q. New insights into intermediate-temperature solid oxide fuel cells with oxygen-ion conducting electrolyte act as a catalyst for NO decomposition. Appl. Catal. B 2014, 418, 158–159. [Google Scholar] [CrossRef]
- Janssen, J. Environmental Catalysis—Stationary Sources, Environmental Catalysis; Wiley-VCH Verlag GmbH: Weinheim, Germany, 2008; pp. 119–179. [Google Scholar]
- Li, J.; Chang, H.; Ma, L.; Hao, J.; Yang, R.T. Low-temperature selective catalytic reduction of NOx with NH3 over metal oxide and zeolite catalysts—A review. Catal. Today 2011, 175, 147–156. [Google Scholar] [CrossRef]
- Javed, M.T.; Irfan, N.; Gibbs, B.M. Control of combustion-generated nitrogen oxides by selective non-catalytic reduction. J. Environ. Manage. 2007, 83, 251–289. [Google Scholar]
- Wu, Y.; Dujardin, C.; Lancelot, C.; Dacquin, J.P.; Parvulescu, C.M.; Henry, C.R.; Neisius, T. Catalytic abatement of NO and N2O from nitric acid plants: A novel approach using noble metal-modified perovskites. J. Catal. 2015, 328, 236–247. [Google Scholar] [CrossRef]
- Haneda, M.; Hamada, H. Recent progress in catalytic NO decomposition. C. R. Chim. 2016, 19, 1254–1265. [Google Scholar] [CrossRef]
- Falsig, H.; Bligaard, T. Trends in catalytic NO decomposition over transition metal surfaces. Top. Catal. 2007, 45, 117–120. [Google Scholar] [CrossRef]
- Brown, W.A.; King, D.A. NO Chemisorption and Reactions on Metal Surfaces: A New Perspective. J. Phys. Chem. B 2000, 104, 2578–2595. [Google Scholar] [CrossRef]
- Falsig, H.; Bligaard, T.; Christensen, C.H.; Nørskov, J.K. Direct NO decomposition over stepped transition-metal surfaces. Pure Appl. Chem. 2007, 79, 1895–1903. [Google Scholar] [CrossRef]
- Wu, Z.; Xu, L.; Zhang, W.; Ma, Y.; Yuan, Q.; Jin, Y.; Yang, J.; Huang, W. Structure sensitivity of low-temperature NO decomposition on Au surfaces. J. Catal. 2013, 304, 112–122. [Google Scholar] [CrossRef]
- Haneda, M.; Kintaichi, Y.; Hamada, H. Catalytic active site for NO decomposition elucidated by surface science and real catalyst. Appl. Catal. B 2005, 55, 169–175. [Google Scholar] [CrossRef]
- Bonzel, H.P.; Bradshaw, A.M.; Ertl, G. Physics and Chemistry of Alkali Metal Adsorption; Elsevier: Amsterdam, The Netherlands, 1989. [Google Scholar]
- Mross, W.D. Alkali doping in heterogeneous catalysis. Catal. Rev. 1983, 25, 591–637. [Google Scholar]
- Niemantsverdriet, J.W. Spectroscopy in Catalysis; Wiley-VCH Verlag GmbH & Co.: Weinheim, Germany, 2007; p. 271. [Google Scholar]
- Pacultová, K.; Draštíková, V.; Chromčáková, Ž.; Bílková, T.; Mamulová-Kutláková, K.; Kotarba, A.; Obalová, L. On the stability of alkali metal promoters in Co mixed oxides during direct NO catalytic decomposition. Mol. Catal. 2017, 428, 33–40. [Google Scholar] [CrossRef]
- Wang, Y.; Hu, X.; Zheng, K.; Zhang, H. Effect of precipitants on the catalytic activity of Co–Ce composite oxide for N2O catalytic decomposition. Reac. Kinet. Mech. Cat. 2018, 123, 707–721. [Google Scholar] [CrossRef]
- Zhang, Q.; Luo, J.; Vileno, E.; Steven, L.; Suib, S.L. Synthesis of cryptomelane-type manganese oxides by microwave heating. Chem. Mater. 1997, 9, 2090–2095. [Google Scholar] [CrossRef]
- Kovanda, K.; Rojka, T.; Dobešová, J.; Machovič, V.; Bezdička, P.; Obalová, L.; Jirátová, K.; Grygar, T. Mixed oxides obtained from Co and Mn containing layered double hydroxides: Preparation, characterization, and catalytic properties. J. Solid State Chem. 2006, 179, 812–823. [Google Scholar] [CrossRef]
- Pacultová, K.; Bílková, T.; Klegová, A.; Karásková, K.; Fridrichová, D.; Martaus, A.; Jirátová, K.; Kiška, T.; Balabánová, J.; Koštejn, M.; et al. Direct NO decomposition over K-promoted Co-Mn-Al mixed oxides. Catalysts 2019, 9. (submitted). [Google Scholar]
- Klyushina, A.; Pacultová, K.; Karásková, K.; Jirátová, K.; Ritz, M.; Fridrichová, D.; Volodarskaja, A.; Obalová, L. Effect of preparation method on catalytic properties of Co-Mn-Al mixed oxides for N2O decomposition. J. Mol. Catal. A Chemical. 2016, 425, 237–247. [Google Scholar] [CrossRef]
- Santos, V.P.; Soares, O.S.G.P.; Bakker, J.J.W.; Pereira, M.F.R.; Órfão, J.J.M.; Gascon, J.; Kapteijn, F.; Figueiredo, J.L. Structural and chemical disorder of cryptomelane promoted by alkali doping: Influence on catalytic properties. J. Catal. 2012, 293, 165–174. [Google Scholar] [CrossRef]
- Becerra, M.E.; Arias, N.P.; Giraldo, O.H.; López Suárez, F.E.; Illán Gómez, M.J.; Bueno López, A. Soot combustion manganese catalysts prepared by thermal decomposition of KMnO4. App. Catal. B Environ. 2011, 102, 260–266. [Google Scholar] [CrossRef]
- Da Costa-Serra, J.F.; Chica, A. Catalysts based on Co-Birnessite and Co-Todorokite for the efficient production of hydrogen by ethanol steam reforming. Intern. J. Hydrog. Energy 2018, 43, 16859–16865. [Google Scholar] [CrossRef]
- Obalová, L.; Karásková, K.; Wach, A.; Kustrowski, P.; Mamulová-Kutláková, K.; Michalik, S.; Jirátová, K. Alkali metals as promoters in Co–Mn–Al mixed oxide for N2O decomposition. Appl. Catal. A Gen. 2013, 462–463, 227–235. [Google Scholar] [CrossRef]
- Imanaka, N.; Masui, T. Advances in direct NOx decomposition catalysts. Appl. Catal. A Gen. 2012, 431–432, 1–8. [Google Scholar] [CrossRef]
- Smoláková, L.; Frolich, K.; Troppová, I.; Kutálek, P.; Kroft, E.; Čapek, L. Determination of basic sites in Mg–Al mixed oxides by combination of TPD-CO2 and CO2 adsorption calorimetry. J. Therm. Anal. Calorim. 2017, 127, 1921–1929. [Google Scholar] [CrossRef]
- Nyquist, R.A.; Nagel, R.O. Infrared Spectra of Inorganic Compounds; Academic Press: New York, NY, USA, 1971. [Google Scholar]
- Bentley, F.F.; Smithson, L.D.; Rozek, A.L. Infrared Spectra and Characteristic Frequencies 700–300 cm-1: A Collection of Spectra, Interpretation, and Bibliography; Interscience: New York, NY, USA, 1986. [Google Scholar]
- Potter, R.M.; Rossman, G.R. The tetravalent manganese oxides: Identification, hydration, and structural relationships by infrared spectroscopy. Am. Mineral. 1979, 64, 1199–1218. [Google Scholar]
- Horák, M.; Papoušek, D. Infračervená spektra a struktura molekul: použití vibrační spektrokopie při určování struktury molekul, 1st ed.; Academia: Praha, Czech Republic, 1976; 836p. [Google Scholar]
- Scofield, J.H. Hartree-Slater subshell photoionization cross-sections at 1254 and 1487 eV. J. Electron Spectrosc. Relat. Phenom. 1976, 8, 129–137. [Google Scholar] [CrossRef]
- Borowiecki, T.; Denis, A.; Rawski, M.; Gołębiowski, A.; Stołecki, K.; Dmytrzyk, J.; Kotarba, A. Studies of potassium-promoted nickel catalysts for methane steam reforming: Effect of surface potassium location. Appl. Surf. Sci. 2014, 300, 191–200. [Google Scholar] [CrossRef]
- Kaspera, W.; Wojas, J.; Molenda, M.; Kotarba, A. Parallel migration of potassium and oxygen ions in hexagonal tungsten bronze—Bulk diffusion, surface segregation and desorption. Solid State Ionics 2016, 297, 1–6. [Google Scholar] [CrossRef]
- Obalová, L.; Maniak, G.; Karásková, K.; Kovanda, F.; Kotarba, A. Electronic nature of potassium promotion effect in Co-Mn-Al layered double hydroxide on the catalytic decomposition of N2O. Catal. Commun. 2011, 12, 1055–1058. [Google Scholar] [CrossRef]
- Brunauer, S.; Emmett, P.H.; Teller, E. Adsorption of gases in multimolecular layers. J. Am. Chem. Soc. 1938, 60, 309–319. [Google Scholar] [CrossRef]
- Deboer, J.H.; Lippens, B.C.; Linsen, B.G.; Broekhof, J.C.; Vandenhe, A.; Osinga, T.J. The t-curve of multimolecular N2-adsorption. J. Colloid Interface Sci. 1966, 21, 405–414. [Google Scholar] [CrossRef]
- Barrett, E.P.; Joyner, L.G.; Halenda, P.P. The Determination of Pore Volume and Area Distributions in Porous Substances. I. Computations from Nitrogen Isotherms. J. Am. Chem. Soc. 1951, 73, 373–380. [Google Scholar]
- Lecloux, A.; Pirard, J.P. The importance of standard isotherms in the analysis of adsorption isotherms for determining the porous texture of solids. J. Colloid Interface Sci. 1979, 70, 265–281. [Google Scholar] [CrossRef]


| Sample | DTG_1 Tmax, °C | DTG_2 Tmax, °C | DTG_3 Tmax, °C | ∆TG_1 % | ∆TG_2 % | ∆TG_3 % |
|---|---|---|---|---|---|---|
| “1” | 113 | 201 | 558 | −9.5 | −17.4 | −3.7 |
| “2” | 131 | 206 | Nd a | −11.9 | −14.8 | −2.7 |
| “3” | 132 | 201 | 438 | −11.6 | −14.0 | −3.2 |
| “4” | 136 | 213 | 445 | −13.9 | −18.4 | −1.5 |
| “5” | 136 | 193 | 448 | −13.7 | −13.5 | −3.6 |
| Sample | H2O | NO2 | NO | CO2 |
|---|---|---|---|---|
| “1” | 184; 269 | 126; 242; 293 | 287; 702 | 144; 249; 297; 535 |
| “3” | 164; 245 | 139; 274; 400 | 272; 520 | 136; 289; 366; 668 |
| “5” | 95; 187; 245 | 106; 281; 400 | 242 | 148; 229; 290; 400; 628 |
| Sample | Wt.% | Molar Ratio | |||
|---|---|---|---|---|---|
| K | Co | Mn | Al | Co:Mn:Al:K | |
| “1” | 18.90 | 28.2 | 6.0 | 3.0 | 4:0.9:0.9:4.0 |
| “2” | 8.20 | 40.0 | 8.8 | 4.0 | 4:1.3:1.2:1.7 |
| “3” | 2.39 | 45.4 | 10.2 | 4.7 | 4:1.5:1.5:0.5 |
| “4” | 0.92 | 46.8 | 10.2 | 4.7 | 4:1.6:1.5:0.2 |
| “5” | 0.60 | 45.6 | 9.9 | 4.4 | 4:0.9:1.4:0.1 |
| BP | 2.10 | 48.9 | 11.2 | 5.1 | 4:0.9:1.5:0.4 |
| Sample | SBET (m2/g) | Smeso (m2/g) | Vtot (mm3liq/g) | Vmicro (mm3liq/g) | Ld (nm) | a (nm) |
|---|---|---|---|---|---|---|
| “1” | <1 | – | – | – | 9 | 0.81056 ± 7 × 10⁻⁵ |
| “2” | 58 | 32 | 266 | 13 | 8 | 0.81187 ± 17 × 10−5 |
| “3” | 110 | 69 | 401 | 22 | 7 | 0.81109 ± 5 × 10⁻⁵ |
| “4” | 105 | 66 | 435 | 21 | 8 | 0.81209 ± 4 × 10⁻⁵ |
| “5” | 102 | 66 | 435 | 21 | 9 | 0.81153 ± 4 × 10⁻⁵ |
| BP | 94 | Nd. * | 460 | 64 | 9 | 0.81015 ± 4 × 10⁻⁵ |
| Sample | H2-TPR Tmax, °C | H2-TPR a mmol g−1 | CO2-TPD Tmax, °C | CO2-TPD a mmol g−1 |
|---|---|---|---|---|
| “1” | 376; 438 b | 18.24 | - | 0.03 |
| “2” | 290; 614 | 12.62 | 120; 275; 444 | 0.18 |
| “3” | 362; 709 | 6.61 | 101; 203; 350 | 0.16 |
| “4” | 368; 726 | 6.29 | 101; 202 | 0.09 |
| “5” | 371; 756 | 5.67 | 101; 202 | 0.10 |
| BP | 375; 755 | 6.82 | 105; 277; 630 | 0.16 |
| Sample | Co 2p At. % | Mn 2p At. % | Al 2p At. % | C 1s At. % | K 2p At. % | O 1s At. % | O 1s eV (rel. %) | O 1s eV (rel. %) |
|---|---|---|---|---|---|---|---|---|
| “1” | 6.8 | 2.4 | 5.1 | 28.7 | 10.1 | 46.9 | 529.7 (45.8) | 531.5 (54.2) |
| “2” | 9.5 | 2.9 | 6.2 | 34.8 | 3.6 | 43.1 | 529.7 (63.5) | 531.5 (36.5) |
| “3” | 9.1 | 4.0 | 7.0 | 34.1 | 2.4 | 43.5 | 529.7 (67.8) | 531.5 (32.2) |
| “4” | 9.0 | 3.5 | 8.6 | 35.9 | 0.5 | 42.7 | 529.8 (56.7) | 531.4 (43.3) |
| “5” | 9.1 | 3.7 | 9.2 | 32.5 | 0.1 | 45.3 | 529.9 (59.1) | 531.5 (40.8) |
| BP | 13.7 | 6.1 | 8.1 | 12.5 | 5.2 | 54.4 | 530.0 (84.5) | 531.7 (15.5) |
| Sample | K | Co | Mn | Al | O |
|---|---|---|---|---|---|
| “1” | 22.1 (18.9) | 21.8 (28.2) | 7.2 (6.0) | 7.6 (3.0) | 41.3 (43.9) |
| “2” | 8.2 (8.2) | 32.6 (40.0) | 9.2 (8.8) | 9.7 (4.0) | 40.2 (39.0) |
| “3” | 5.5 (2.4) | 30.8 (45.4) | 12.8 (10.2) | 10.9 (4.7) | 40.1 (37.3) |
| “4” | 1.1 (0.9) | 32.1 (46.8) | 11.6 (10.2) | 14.0 (4.7) | 41.3 (37.4) |
| “5” | 0.3 (0.6) | 31.2 (45.6) | 11.9 (9.9) | 14.4 (4.4) | 42.1 (39.5) |
| BP | 8.3 (2.1) | 33.1 (48.9) | 13.9 (11.2) | 9.0 (5.1) | 35.7 (32.7) |
© 2019 by the authors. Licensee MDPI, Basel, Switzerland. This article is an open access article distributed under the terms and conditions of the Creative Commons Attribution (CC BY) license (http://creativecommons.org/licenses/by/4.0/).
Share and Cite
Jirátová, K.; Pacultová, K.; Balabánová, J.; Karásková, K.; Klegová, A.; Bílková, T.; Jandová, V.; Koštejn, M.; Martaus, A.; Kotarba, A.; et al. Precipitated K-Promoted Co–Mn–Al Mixed Oxides for Direct NO Decomposition: Preparation and Properties. Catalysts 2019, 9, 592. https://doi.org/10.3390/catal9070592
Jirátová K, Pacultová K, Balabánová J, Karásková K, Klegová A, Bílková T, Jandová V, Koštejn M, Martaus A, Kotarba A, et al. Precipitated K-Promoted Co–Mn–Al Mixed Oxides for Direct NO Decomposition: Preparation and Properties. Catalysts. 2019; 9(7):592. https://doi.org/10.3390/catal9070592
Chicago/Turabian StyleJirátová, Květa, Kateřina Pacultová, Jana Balabánová, Kateřina Karásková, Anna Klegová, Tereza Bílková, Věra Jandová, Martin Koštejn, Alexandr Martaus, Andrzej Kotarba, and et al. 2019. "Precipitated K-Promoted Co–Mn–Al Mixed Oxides for Direct NO Decomposition: Preparation and Properties" Catalysts 9, no. 7: 592. https://doi.org/10.3390/catal9070592
APA StyleJirátová, K., Pacultová, K., Balabánová, J., Karásková, K., Klegová, A., Bílková, T., Jandová, V., Koštejn, M., Martaus, A., Kotarba, A., & Obalová, L. (2019). Precipitated K-Promoted Co–Mn–Al Mixed Oxides for Direct NO Decomposition: Preparation and Properties. Catalysts, 9(7), 592. https://doi.org/10.3390/catal9070592