Removal of Organic Micropollutants from a Municipal Wastewater Secondary Effluent by UVA-LED Photocatalytic Ozonation

 ,
, 
 ,
,  ,
,
Abstract
:
1. Introduction
2. Results
2.1. CECs Detected in Secondary Effluent Samples
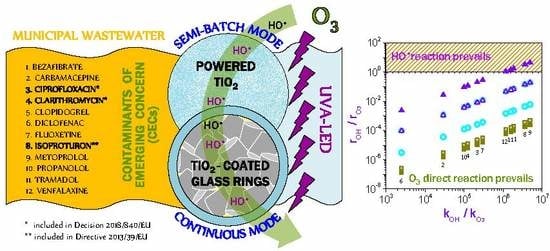
2.2. Removal of CECs in Semi-Batch Experiments
2.3. Continuous Flow Experiments
2.3.1. Characterization of the Immobilized Photocatalyst
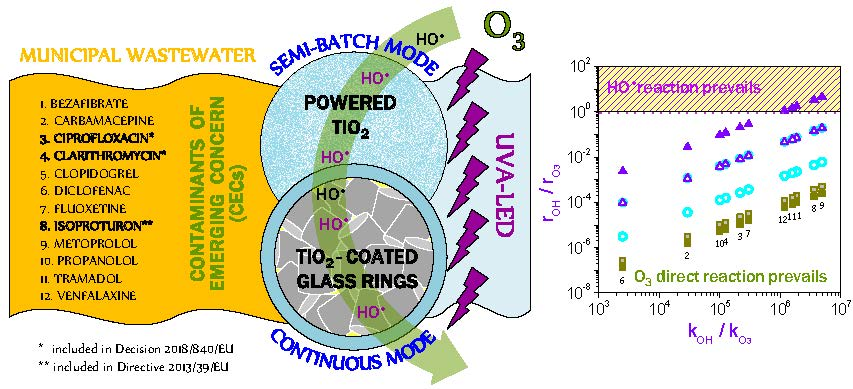
2.3.2. Removal of CECs
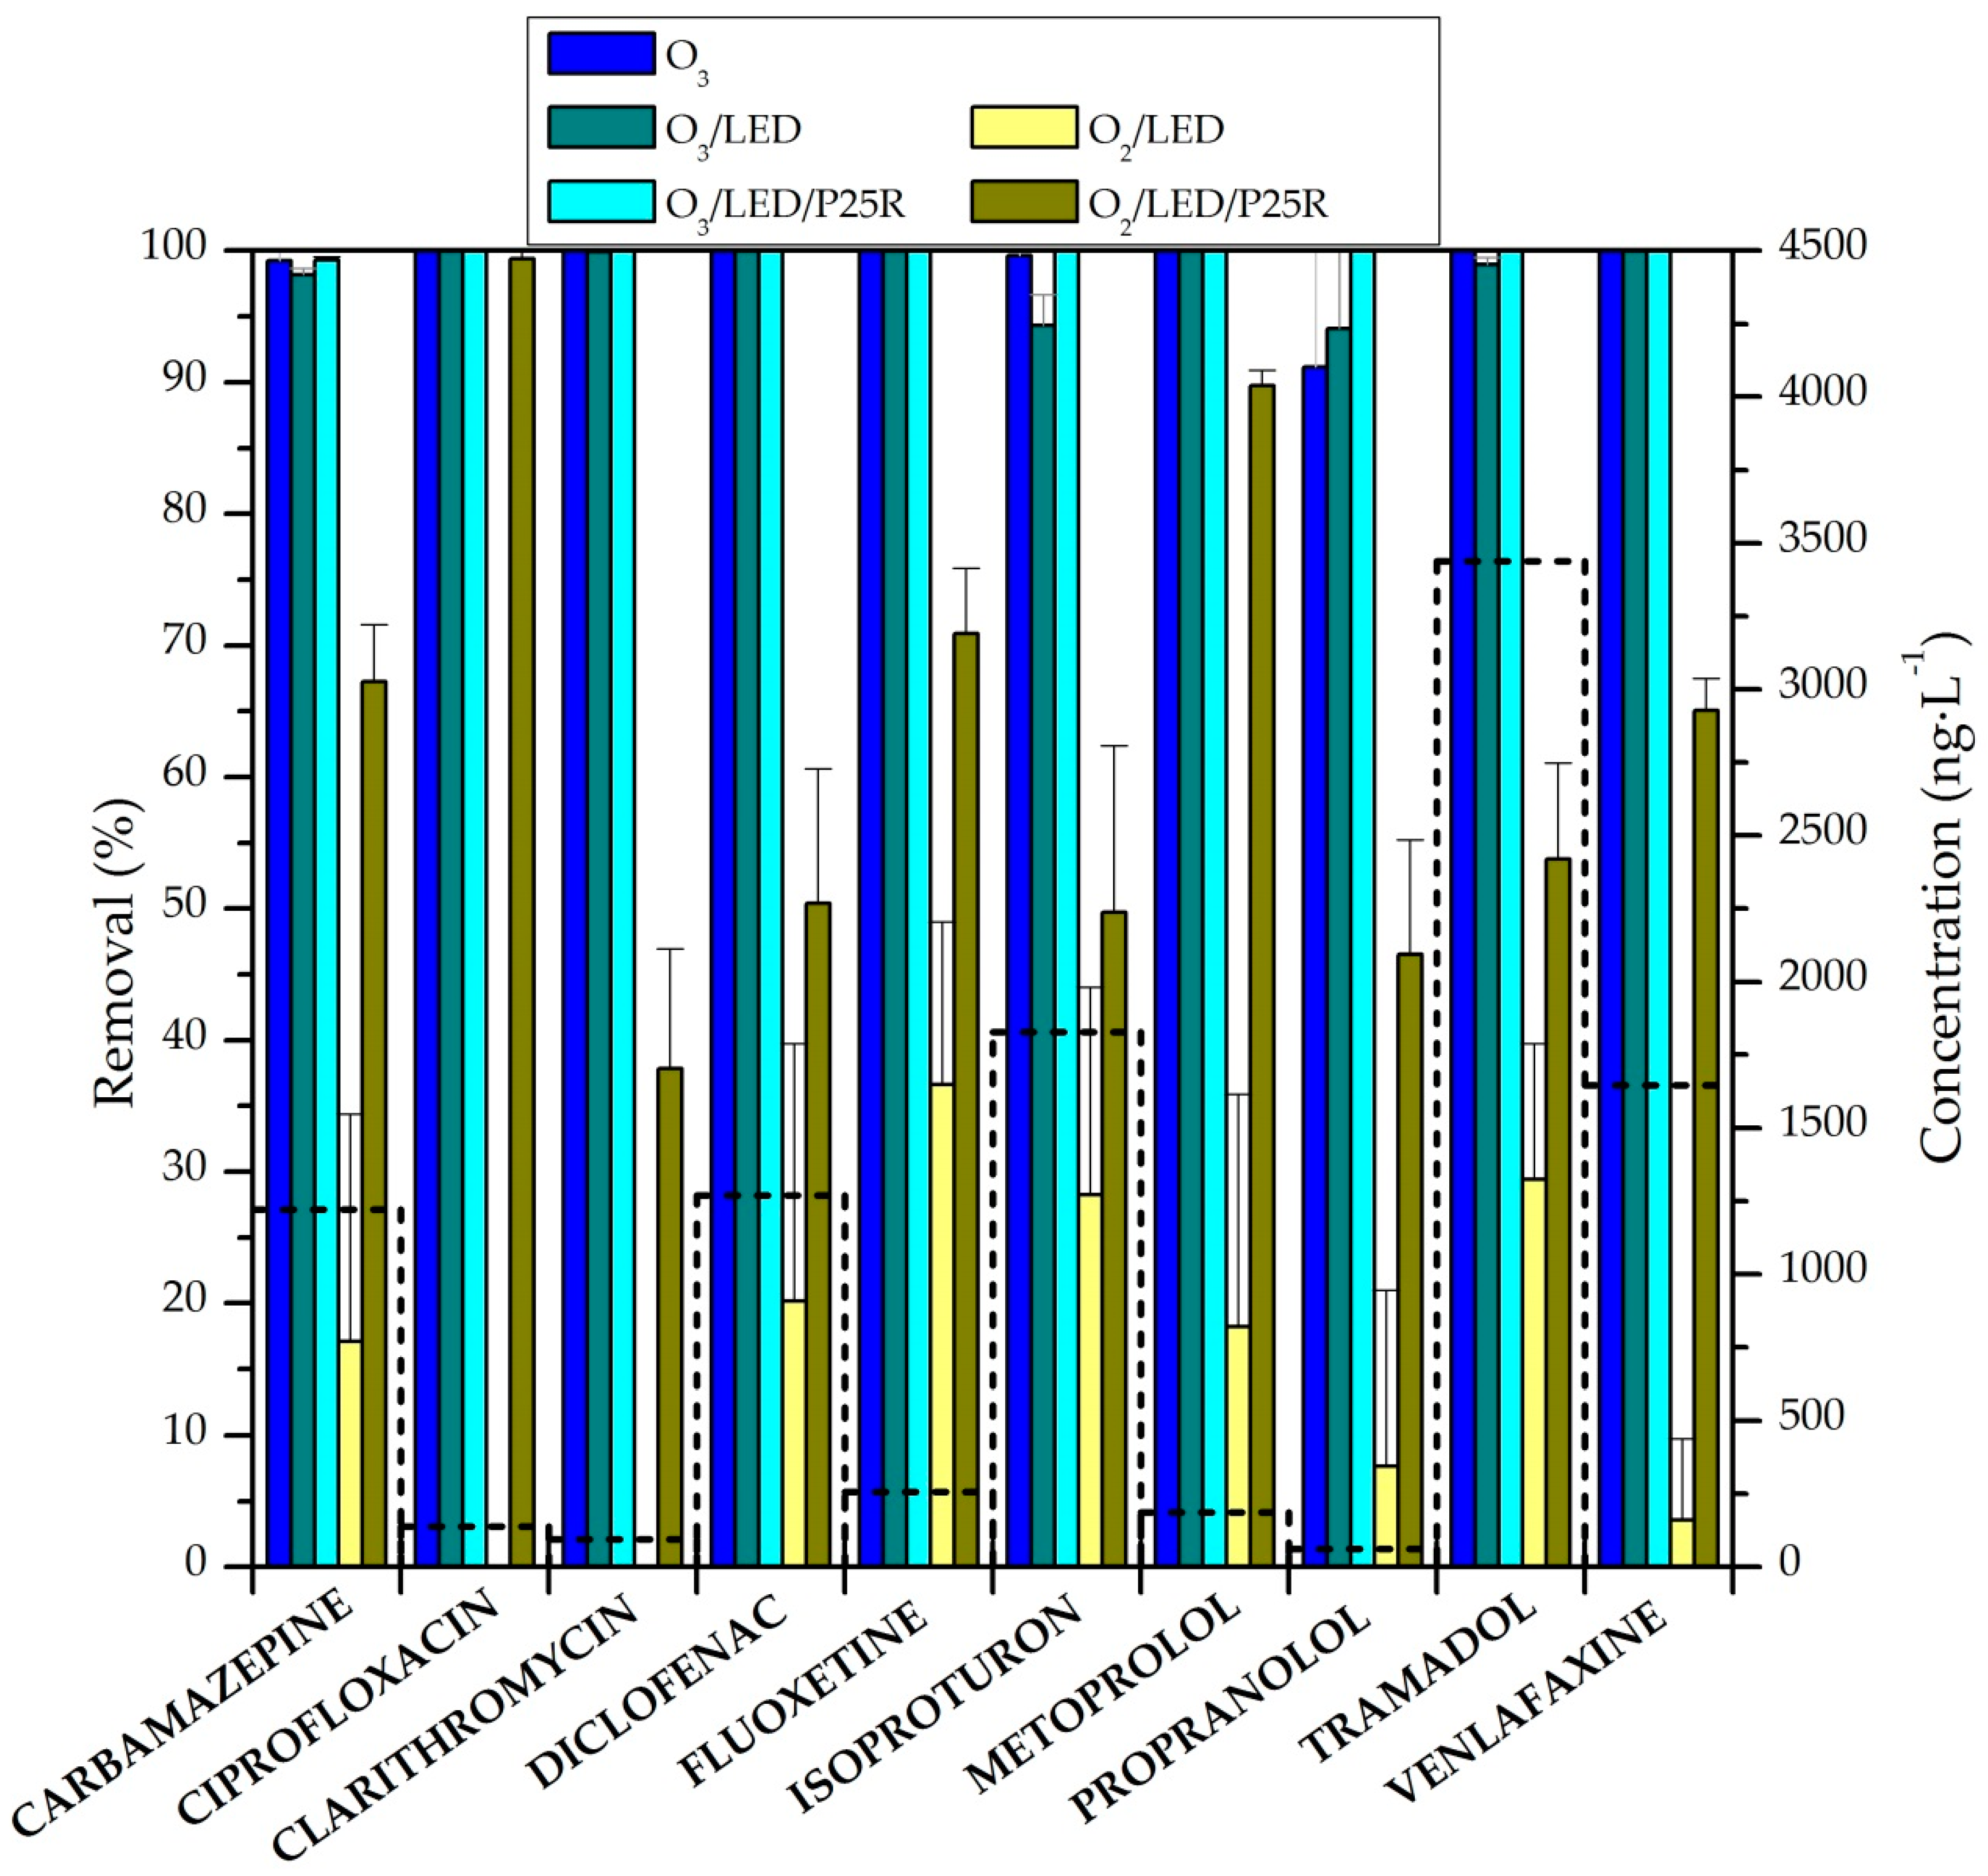
2.4. Kinetic Modelling Aspects
Direct Ozonation as the Main Oxidation Pathway of CEC
3. Materials and Methods
3.1. Wastewater Effluents
3.2. Photocatalysts
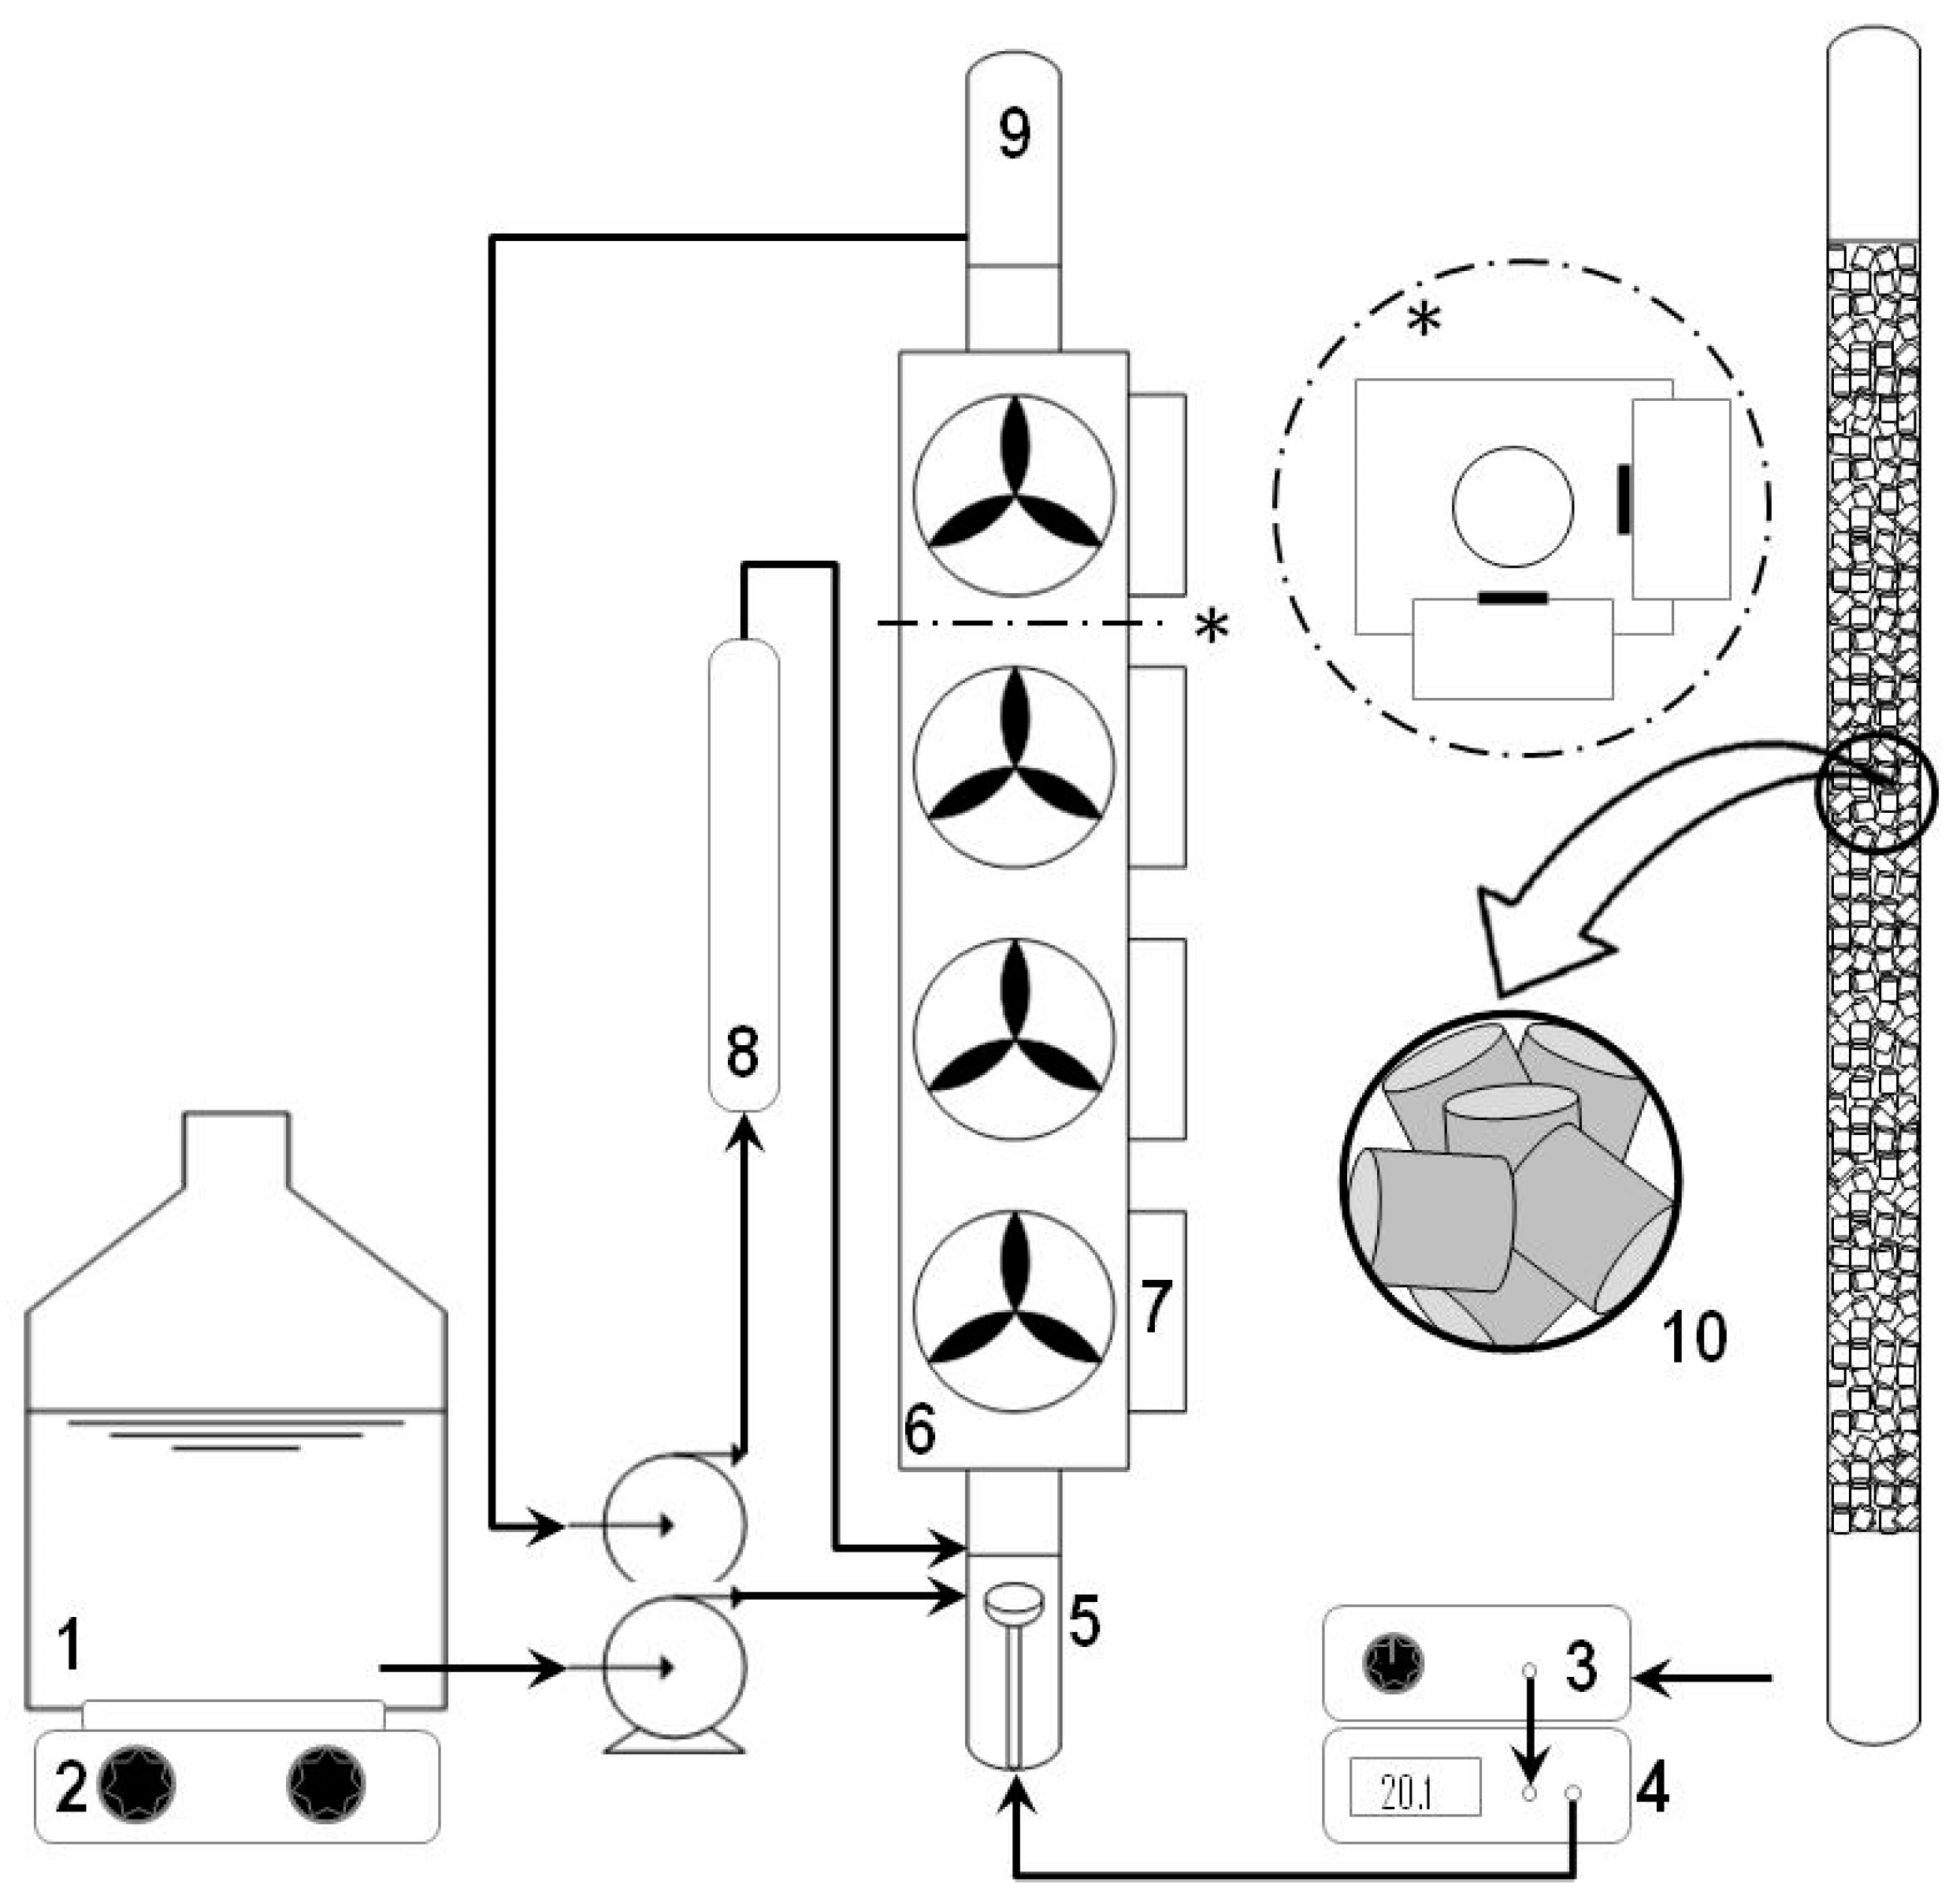
3.3. Experimental Set-Up and Procedures
3.4. Analytical Methods
4. Conclusions
Supplementary Materials
Author Contributions
Funding
Acknowledgments
Conflicts of Interest
References
- Ratola, N.; Cincinelli, A.; Alves, A.; Katsoyiannis, A. Occurrence of organic microcontaminants in the wastewater treatment process. A mini review. J. Hazard. Mater. 2012, 239–240, 1–18. [Google Scholar] [CrossRef]
- Robles-Molina, J.; Lara-Ortega, F.J.; Gilbert-López, B.; García-Reyes, J.F.; Molina-Díaz, A. Multi-residue method for the determination of over 400 priority and emerging pollutants in water and wastewater by solid-phase extraction and liquid chromatography-time-of-flight mass spectro. metry. J. Chromatogr. A 2014, 1350, 30–43. [Google Scholar] [CrossRef] [PubMed]
- Lapworth, D.J.; Baran, N.; Stuart, M.E.; Ward, R.S. Emerging organic contaminants in groundwater: A review of sources, fate and occurrence. Environ. Pollut. 2012, 163, 287–303. [Google Scholar] [CrossRef] [PubMed] [Green Version]
- González, S.; López-Roldán, R.; Cortina, J.L. Presence and biological effects of emerging contaminants in Llobregat River basin: A review. Environ. Pollut. 2012, 161, 83–92. [Google Scholar] [CrossRef]
- Pal, A.; Gin, K.Y.H.; Lin, A.Y.C.; Reinhard, M. Impacts of emerging organic contaminants on freshwater resources: Review of recent occurrences, sources, fate and effects. Sci. Total Environ. 2010, 408, 6062–6069. [Google Scholar] [CrossRef] [PubMed]
- Directive 2013/39/EU. Directive 2013/39/EU of the European Parliament and of the Council of 12 August 2013 amending Directives 2000/60/EC and 2008/105/EC as regards priority substances in the field of water policy. Off. J. Eur. Union. 2013, L226, 1–17. [Google Scholar]
- Decision 2015/495/EU. Commission implementing decision (EU) 2015/495 of 20 March 2015 establishing a watch list of substances for Union-wide monitoring in the field of water policy pursuant to Directive 2008/105/EC of the European Parliament and of the Council. Off. J. Eur. Union. 2015, L78, 40–42. [Google Scholar]
- Decision 2018/840/EU. Commission implementing decision (EU) 2018/840 of 5 June 2018 establishing a watch list of substances for Union-wide monitoring in the field of water policy pursuant to Directive 2008/105/EC of the European Parliament and of the Council. Off. J. Eur. Union. 2018, L141, 9–12. [Google Scholar]
- Liu, Z.; Kanjo, Y.; Mizutani, S. Removal mechanisms for endocrine disrupting compounds (EDCs) in wastewater treatment—Physical means, biodegradation, and chemical advanced oxidation: A review. Sci. Total Environ. 2008, 407, 731–748. [Google Scholar] [CrossRef]
- Gogate, P.R.; Pandit, A.B. A review of imperative technologies for wastewater treatment II: Hybrid methods. Adv. Environ. Res. 2004, 8, 553–597. [Google Scholar] [CrossRef]
- Von Gunten, U. Ozonation of drinking water: Part I. Oxidation kinetics and product formation. Water Res. 2003, 37, 1443–1467. [Google Scholar] [CrossRef]
- Legrini, O.; Oliveros, E.; Braun, A.M. Photochemical Processes for Water Treatment. Chem. Rev. 1993, 93, 671–698. [Google Scholar] [CrossRef]
- Beltrán, F.J. Ozone Reaction Kinetics for Water and Wastewater Systems; Lewis Publishers: Boca Raton, FL, USA, 2004; pp. 1–358. [Google Scholar]
- Moreira, N.F.F.; Sousa, J.M.; Macedo, G.; Ribeiro, A.R.; Barreiros, L.; Pedrosa, M.; Faria, J.L.; Pereira, M.F.R.; Castro-Silva, S.; Segundo, M.A.; et al. Photocatalytic ozonation of urban wastewater and surface water using immobilized TiO2 with LEDs: Micropollutants, antibiotic resistance genes and estrogenic activity. Water Res. 2016, 94, 10–22. [Google Scholar] [CrossRef] [Green Version]
- Lee, Y.; Gerrity, D.; Lee, M.; Encinas Bogeat, A.; Salhi, E.; Gamage, S.; Trenholm, R.A.; Wert, E.C.; Snyder, S.A.; von Gunten, U. Prediction of micropollutant elimination during ozonation of municipal wastewater effluents: Use of kinetic and water specific information. Environ. Sci. Technol. 2013, 47, 5872–5881. [Google Scholar] [CrossRef]
- Bahr, C.; Schumacher, J.; Ernst, M.; Luck, F.; Heinzmann, B.; Jekel, M. SUVA as control parameter for the effective ozonation of organic pollutants in secondary effluent. Water Sci. Technol. 2007, 55, 267–274. [Google Scholar] [CrossRef]
- Encinas, A.; Rivas, F.J.; Beltrán, F.J.; Oropesa, A. Combination of black-light photocatalysis and ozonation for emerging contaminants degradation in secondary effluents. Chem. Eng. Technol. 2013, 36, 492–499. [Google Scholar] [CrossRef]
- Marquez, G.; Rodríguez, E.M.; Beltrán, F.J.; Alvarez, P.M. Solar photocatalytic ozonation of a mixture of pharmaceutical compounds in water. Chemosphere 2014, 113, 71–78. [Google Scholar] [CrossRef]
- Espejo, A.; Aguinaco, A.; Amat, A.M.; Beltrán, F.J. Some ozone advanced oxidation processes to improve the biological removal of selected pharmaceutical contaminants from urban wastewater. J. Environ. Sci. Health A 2014, 49, 410–421. [Google Scholar] [CrossRef]
- Gimeno, O.; García-Araya, J.F.; Beltrán, F.J.; Rivas, F.J.; Espejo, A. Removal of emerging contaminants from a primary effluent of municipal wastewater by means of sequential biological degradation-solar photocatalytic oxidation processes. Chem. Eng. J. 2016, 290, 12–16. [Google Scholar] [CrossRef]
- Dantas, R.F.; Canterino, M.; Marotta, R.; Sans, C.; Esplugas, S.; Andreozzi, R. Bezafibrate removal by means of ozonation: Primary intermediates, kinetics, and toxicity assessment. Water Res. 2007, 41, 2525–2532. [Google Scholar] [CrossRef]
- Elovitz, M.S.; Von Gunten, U. Hydroxyl radical/ozone ratios during ozonation processes. I. The R(ct) concept. Ozone Sci. Eng. 1999, 21, 239–260. [Google Scholar] [CrossRef]
- Huber, M.M.; Gbel, A.; Joss, A.; Hermann, N.; Lffler, D.S.C.; Ried, A.; Siegrist, H.; Ternes, T.A.; Gunten, U. Oxidation of pharmaceuticals during ozonation of municipal wastewater effluents: A pilot study. Environ. Sci. Technol. 2005, 39, 4290–4299. [Google Scholar] [CrossRef] [PubMed]
- Dodd, M.C.; Buffle, M.O.; Von Gunten, U. Oxidation of antibacterial molecules by aqueous ozone: Moiety-specific reaction kinetics and application to ozone-based wastewater treatment. Environ. Sci. Technol. 2006, 40, 1969–1977. [Google Scholar] [CrossRef]
- Lee, Y.; Kovalova, L.; McArdell, C.S.; von Gunten, U. Prediction of micropollutant elimination during ozonation of a hospital wastewater effluent. Water Res. 2014, 64, 134–148. [Google Scholar] [CrossRef] [PubMed]
- Zhao, Y.; Yu, G.; Chen, S.; Zhang, S.; Wang, B.; Huang, J.; Deng, S.; Wang, Y. Ozonation of antidepressant fluoxetine and its metabolite product norfluoxetine: Kinetics, intermediates and toxicity. Chem. Eng. J. 2017, 316, 951–963. [Google Scholar] [CrossRef]
- Méndez-Arriaga, F.; Otsu, T.; Oyama, T.; Gimenez, J.; Esplugas, S.; Hidaka, H.; Serpone, N. Photooxidation of the antidepressant drug Fluoxetine (Prozac®) in aqueous media by hybrid catalytic/ozonation processes. Water Res. 2011, 45, 2782–2794. [Google Scholar] [CrossRef]
- Benitez, F.J.; Real, F.J.; Acero, J.L.; Garcia, C. Kinetics of the transformation of phenyl-urea herbicides during ozonation of natural waters: Rate constants and model predictions. Water Res. 2007, 41, 4073–4084. [Google Scholar] [CrossRef] [PubMed]
- Benitez, F.J.; Acero, J.L.; Real, F.J.; Roldán, G. Ozonation of pharmaceutical compounds: Rate constants and elimination in various water matrices. Chemosphere 2009, 77, 53–59. [Google Scholar] [CrossRef]
- Benner, J.; Salhi, E.; Ternes, T.; von Gunten, U. Ozonation of reverse osmosis concentrate: Kinetics and efficiency of beta blocker oxidation. Water Res. 2008, 42, 3003–3012. [Google Scholar] [CrossRef]
- Charpentier, J.-C. Mass-transfer rates in gas-liquid absorbers and reactors. In Advances in Chemical Engineering; Academic Press: New York, NY, USA, 1981; pp. 1–133. [Google Scholar]
- Johnson, P.N.; Davis, R.A. Diffusivity of ozone in water. J. Chem. Eng. Data. 1996, 41, 1485–1487. [Google Scholar] [CrossRef]
- Beltrán, F.J.; Rey, A. Free radical and direct ozone reaction competition to remove priority and pharmaceutical water contaminants with single and hydrogen peroxide ozonation systems. Ozone Sci. Eng. 2018, 40, 1–15. [Google Scholar] [CrossRef]
- Nöthe, T.; Fahlenkamp, H.; von Sonntag, C. Ozonation of wastewater: Rate of ozone consumption and hydroxyl radical yield. Environ. Sci. Technol. 2009, 43, 5990–5995. [Google Scholar] [CrossRef]
- Sampaio, M.J.; Silva, C.G.; Silva, A.M.T.; Vilar, V.J.P.; Boaventura, R.A.R.; Faria, J.L. Photocatalytic activity of TiO2-coated glass raschig rings on the degradation of phenolic derivatives under simulated solar light irradiation. Chem. Eng. J. 2013, 224, 32–38. [Google Scholar] [CrossRef]
- Langlais, B.; Reckhow, D.A.; Brink, D.R. (Eds.) Ozone in Water Treatment: Application and Engineering; Lewis Publ.: Chelsea, MI, USA, 1991. [Google Scholar]
- Ribeiro, A.R.; Pedrosa, M.; Moreira, N.F.F.; Pereira, M.F.R.; Silva, A.M.T. Environmental friendly method for urban wastewater monitoring of micropollutants defined in the Directive 2013/39/EU and Decision 2015/495/EU. J. Chromatogr. A. 2015, 1418, 140–149. [Google Scholar] [CrossRef]
- Bader, H.; Hoigné, J. Determination of ozone in water by the indigo method. Water Res. 1981, 15, 449–456. [Google Scholar] [CrossRef]


 and
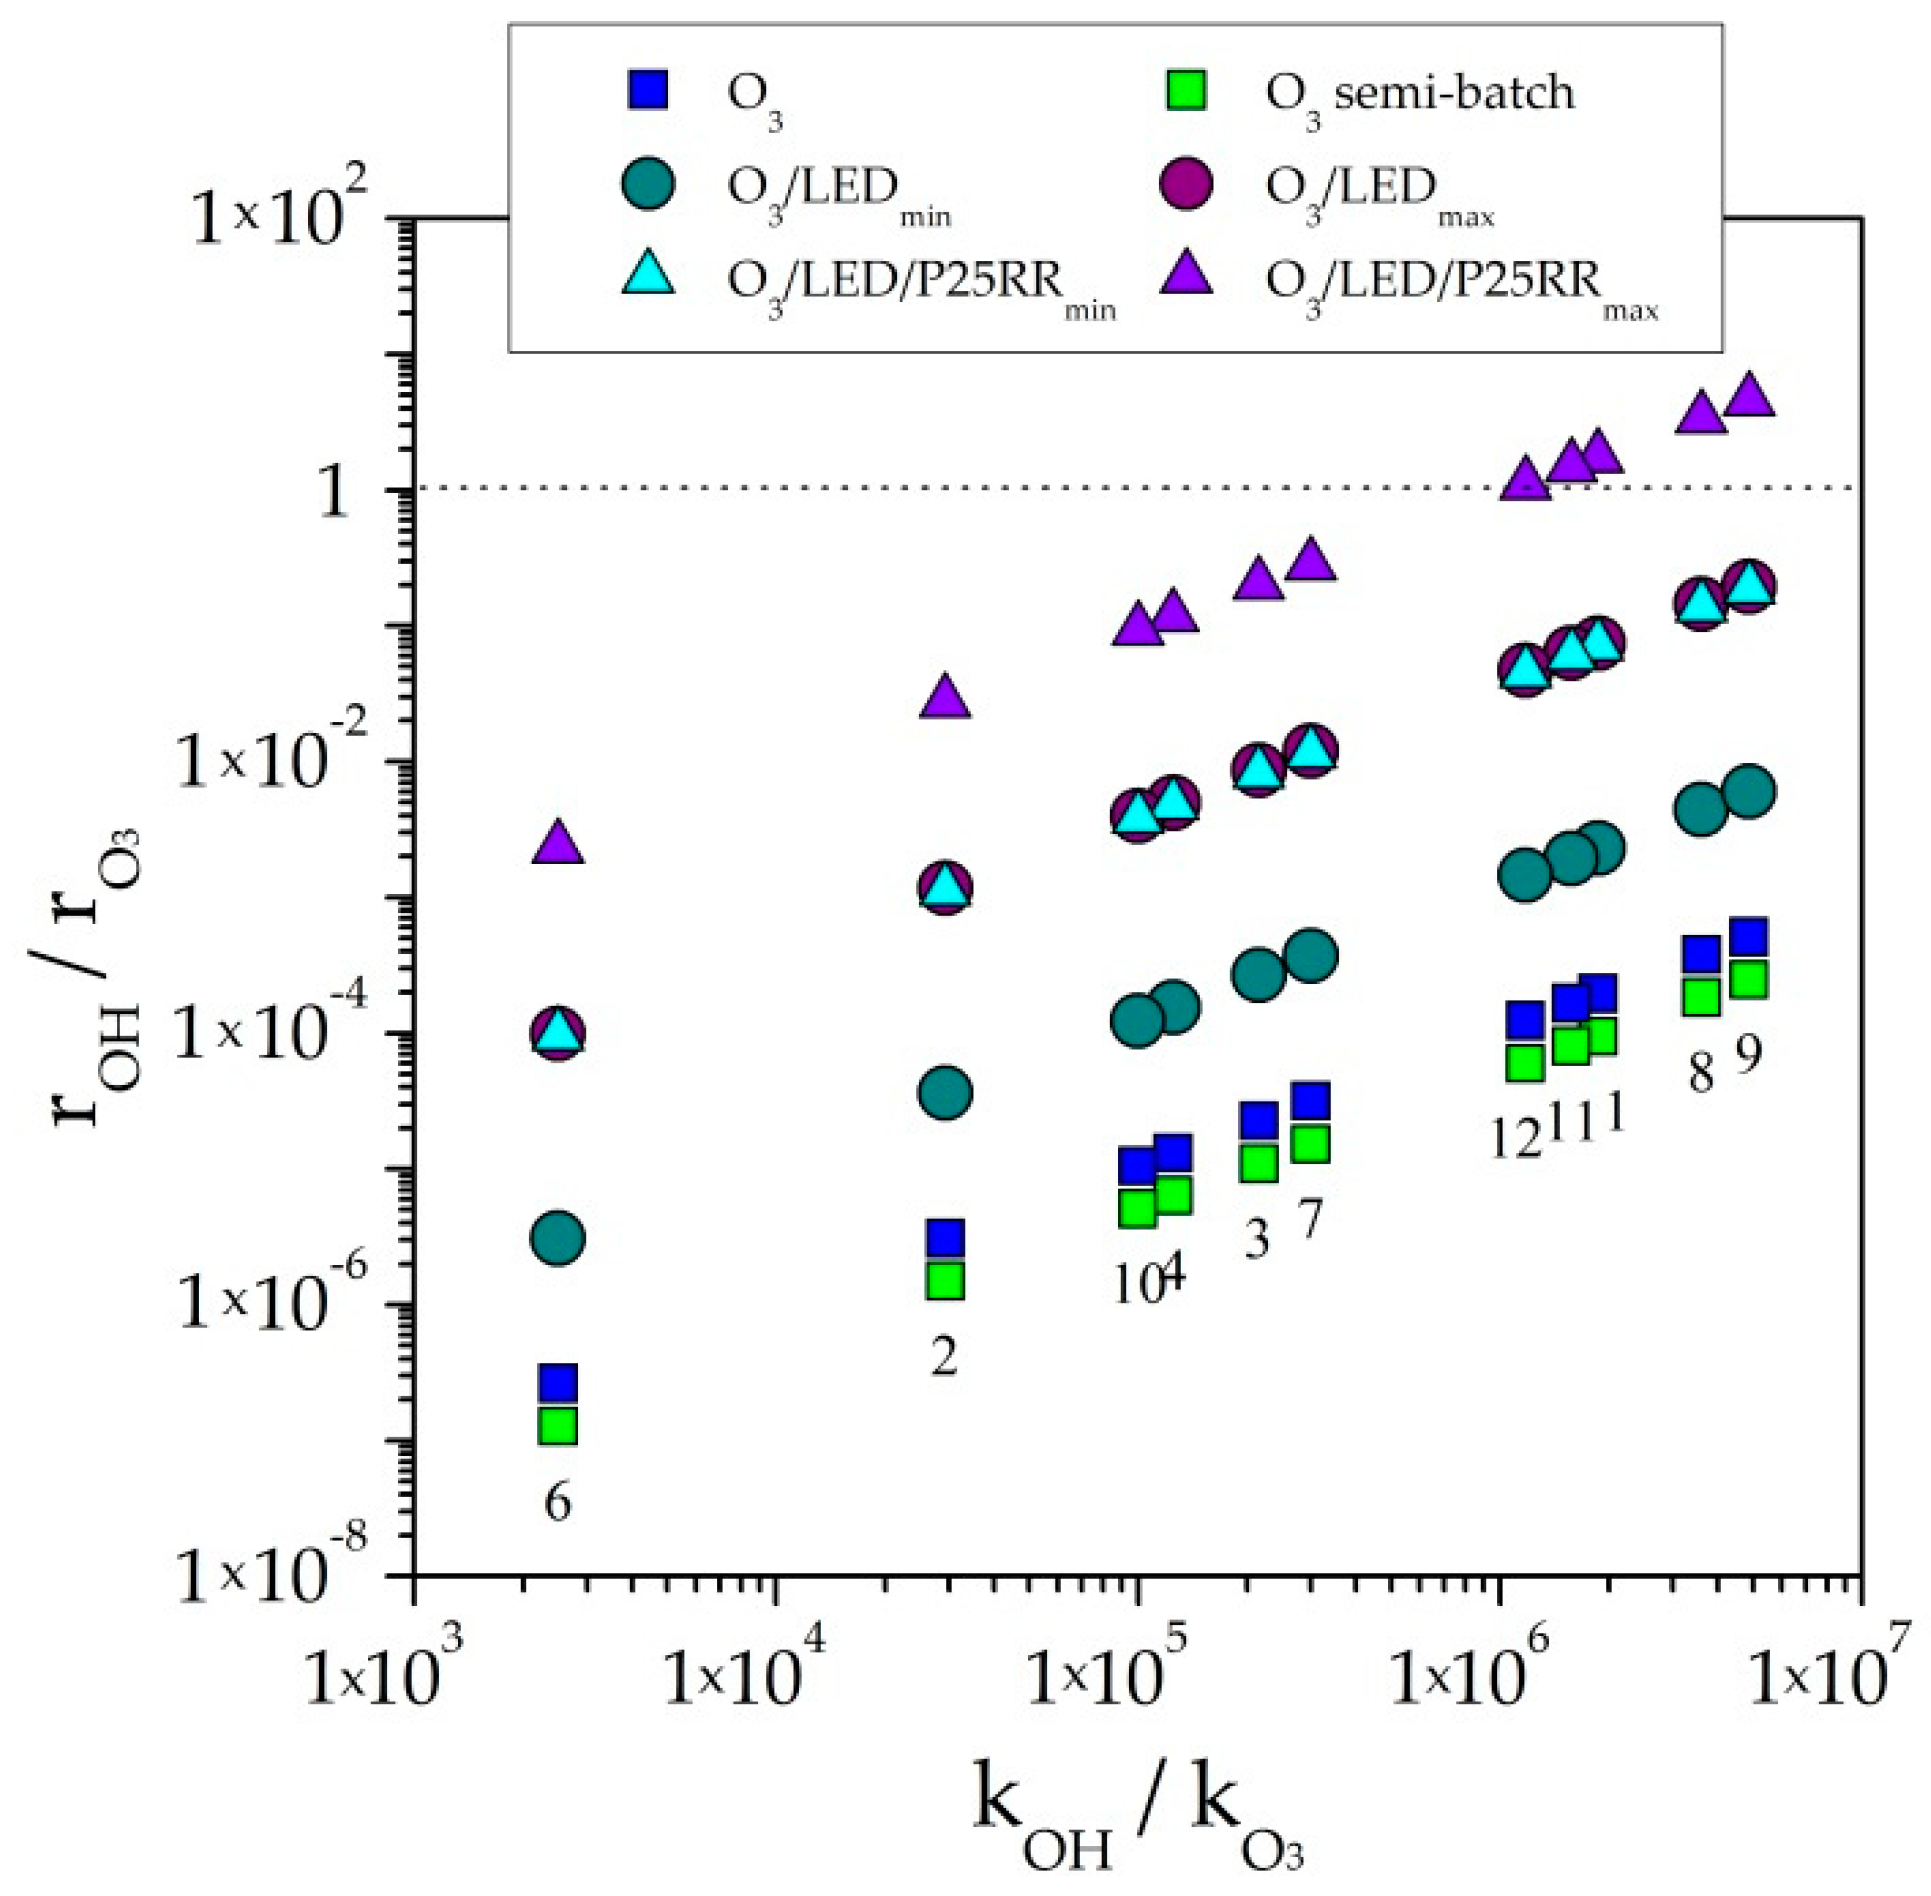
and  ) in comparison with the maximum kLa (● and ▲) and semi-batch mode (O3 □). See Table 1 for meaning of numbers (Plots based on reference [29]).


| No. | COMPOUND | Concentration (ng·L−1) | |
|---|---|---|---|
| WW1 | WW2 | ||
| 1 | Bezafibrate | 61 ± 1 | 7.1 ± 0.4 |
| 2 | Carbamazepine | 1284 ± 225 | 1222 ± 278 |
| 3 | Ciprofloxacin | 4287 ± 1208 | 138 ± 74 |
| 4 | Clarithromycin | 758 ± 31 | 94 ± 4 |
| 5 | Clopidogrel | <MQL | <MQL |
| 6 | Diclofenac | 1528 ± 17 | 1268 ± 67 |
| 7 | Fluoxetine | 62 ± 193 | 257 ± 51 |
| 8 | Isoproturon | 61 ± 7 | 1827 ± 219 |
| 9 | Metoprolol | 209 ± 13 | 187 ± 22 |
| 10 | Propranolol | 173 ± 40 | 61 ± 14 |
| 11 | Tramadol | 1233 ± 40 | 3439 ± 727 |
| 12 | Venlafaxine | 628 ± 555 | 1647 ± 359 |
| No. | COMPOUND | Rate Constants (M−1s−1) | HaD × 104 | ||||
|---|---|---|---|---|---|---|---|
| kD | Ref. | kHO × 10−9 | Ref. | WW1 | WW2 | ||
| 1 | Bezafibrate | 4.2 × 10³ | [21] | 7.9 | [23] | 0.3 | 0.11 |
| 2 | Carbamazepine | 3.0 × 10⁵ | [23] | 8.8 | [23] | 15.6 | 15.2 |
| 3 | Ciprofloxacin | 1.9 × 10⁴ | [24] | 4.1 | [24] | 6.1 | 1.1 |
| 4 | Clarithromycin | 4.0 × 10⁴ | [25] | 5.0 | [25] | 2.5 | 0.9 |
| 5 | Clopidogrel | unknown | unknown | n.d.* | n.d.* | ||
| 6 | Diclofenac | 3.0 × 10⁶ | [23] | 7.5 | [23] | 48.2 | 43.9 |
| 7 | Fluoxetine | 3.2 × 10⁴ | [26] | 9.6 | [27] | 1.0 | 2.0 |
| 8 | Isoproturon | 2.2 × 10³ | [28] | 7.9 | [28] | 0.3 | 1.7 |
| 9 | Metoprolol | 1.4 × 10³ | [29] | 6.8 | [29] | 0.4 | 0.4 |
| 10 | Propranolol | 1.0 × 10⁵ | [30] | 10.0 | [30] | 3.4 | 1.9 |
| 11 | Tramadol | 4.0 × 10³ | [25] | 6.3 | [25] | 1.7 | 2.8 |
| 12 | Venlafaxine | 8.5 × 10³ | [25] | 10.0 | [25] | 1.7 | 2.8 |
| Compounds | kT-O3 (M−1·s−1) | kT-O3/LED (M−1·s−1) | kT-O3/LED/P25 (M−1·s−1) |
|---|---|---|---|
| Ciprofloxacin | 730 | 376 | - |
| Metoprolol | 85 | 119 | 69 |
| Propranolol | 739 | 154 | 226 |
| Venlafaxine | 2173 | 1465 | 1750 |
| kLa Values (s−1) | O3/LED | O3/LED/P25R | ||
|---|---|---|---|---|
| kd (s−1) | HaI × 103 | kd (s−1) | HaI × 102 | |
| 0.005 | 1.0 × 10⁻³ | 1.2 | 3.2 × 10⁻² | 0.7 |
| 0.063 | 1.7 × 10⁻² | 5.0 | 0.40 | 2.5 |
| 0.12 | 3.3 × 10⁻² | 7.0 | 0.77 | 3.4 |
© 2019 by the authors. Licensee MDPI, Basel, Switzerland. This article is an open access article distributed under the terms and conditions of the Creative Commons Attribution (CC BY) license (http://creativecommons.org/licenses/by/4.0/).
Share and Cite
Chávez, A.M.; Ribeiro, A.R.; Moreira, N.F.F.; Silva, A.M.T.; Rey, A.; Álvarez, P.M.; Beltrán, F.J. Removal of Organic Micropollutants from a Municipal Wastewater Secondary Effluent by UVA-LED Photocatalytic Ozonation. Catalysts 2019, 9, 472. https://doi.org/10.3390/catal9050472
Chávez AM, Ribeiro AR, Moreira NFF, Silva AMT, Rey A, Álvarez PM, Beltrán FJ. Removal of Organic Micropollutants from a Municipal Wastewater Secondary Effluent by UVA-LED Photocatalytic Ozonation. Catalysts. 2019; 9(5):472. https://doi.org/10.3390/catal9050472
Chicago/Turabian StyleChávez, Ana M., Ana R. Ribeiro, Nuno F. F. Moreira, Adrián M. T. Silva, Ana Rey, Pedro M. Álvarez, and Fernando J. Beltrán. 2019. "Removal of Organic Micropollutants from a Municipal Wastewater Secondary Effluent by UVA-LED Photocatalytic Ozonation" Catalysts 9, no. 5: 472. https://doi.org/10.3390/catal9050472
APA StyleChávez, A. M., Ribeiro, A. R., Moreira, N. F. F., Silva, A. M. T., Rey, A., Álvarez, P. M., & Beltrán, F. J. (2019). Removal of Organic Micropollutants from a Municipal Wastewater Secondary Effluent by UVA-LED Photocatalytic Ozonation. Catalysts, 9(5), 472. https://doi.org/10.3390/catal9050472