Abstract
To help elucidate the oxychlorination redispersion reaction mechanism, the surface species formed on the surface of γ-Al2O3 was characterized by X-ray absorption spectroscopy (XAS). The efficacy of redispersion was assessed by the Pt–Pt coordination number (CNPt–Pt) of redispersed, and then reduced samples. A nearly fully redispersed complex (Ptrd52) was prepared by treating a sintered model Pt/γ-Al2O3 catalyst at 520 °C, Air/EDC (ethylene dichloride) of 30, and WHSV (Weight Hourly Space Velocity) of 0.07 h−1 for 16 h. For investigating temperature effects, samples treated at 460 (Ptrd46) and 560 °C (Ptrd56) were also prepared for comparison. It was found that, while an octahedral resembling Pt(Os)3–4(O–Cl)2–3 (Os represents support oxygen or hydroxyl oxygen) complex was formed on γ-Al2O3 of Ptrd52, less O–Cl ligands were formed on the redispersed complexes, Ptrd46 and Ptrd56. A negative correlation of CNPt–Pt with CNPt–Cl* (Cl* represents the Cl atom in O–Cl ligand) for these three samples further suggested that the formation of Pt–O–Cl played a key role in the redispersion process. Pt–O–Cl could be formed in the reaction of reactive Cl⋅ and PtO2. At an operation temperature of lower-than-optimal temperatures of 520 °C, less Cl2 dissociation and less O–Cl ligands were formed. On the other hand, higher temperatures may facilitate Cl2 dissociation, but reduce the equilibrium conversion of HCl to Cl2, leading to increased HCl reaction with Pt (PtO2) clusters to form Pt–Cl (Cl is the atom bonded directly to Pt), and decreased formation of Pt–O–Cl.
1. Introduction
Notwithstanding a number of investigations to prevent sintering, supported-metal catalyst deactivation owing to metal sintering is inevitable [1], and redispersion of sintered metal clusters is the key in catalyst rejuvenation. Based on scientific and patent literature surveys, halogen acid gas, oxygen, chlorine, and nitric oxide can be used as agents to redisperse sintered Pt catalysts [1,2,3,4,5,6,7,8,9]. Among them, oxychlorination, which uses oxygen- and chlorine-containing compounds as the dispersion agent, is the most common method employed in the industry to redisperse noble metals on non-reducible metal oxides, such as silica, alumina, zeolite, and cordierite [1,4,10,11].
In petroleum refineries, the oxychlorination technique has been applied to redisperse Pt/Al2O3, Pt–Re/Al2O3, and Pt–Ir/Al2O3 reforming catalysts for decades [1,2,3,4,5,6,7,8,9,10,12]. However, the fundamental understanding of detailed surface chemistry could further the process of evolution and development, and might spark new inventions as well; for instance, through the application of in situ XAS (X-ray Absorption Spectroscopy) and TEM (Transmission Electron Microscopy), a rapid and effective redispersion of Pt particles supported on ceria-based oxide catalysts three-way catalysts (TWCs) has been developed by Nagai et. al [13,14].
With the Pt/alumina catalyst as an example, the redispersion process typically involves four steps: (1) formation of redispersed Pt complexes by the reaction of Pt atoms with dispersion agents; (2) dissociation and liberation of the complexes from sintered Pt clusters; (3) migration and deposition of these species on the support surface; and (4) the reduction of the complexes to Pt clusters [2,3,4,5]. The structure of redispersed complexes will vary with the operation parameters, such as the Air/EDC (ethylene dichloride) mole ratio, residence time, duration of operation, and redispersion temperature. Among them, temperature is the most critical operation parameter because it directly influences the structure, the stability of the redispersed complexes, and thus the redispersion efficacy [10,15,16,17,18].
Lee and Kim have reported that the oxychlorination redispersion capacity for Pt/γ-Al2O3 increases with operation temperature from 400 °C to about 550 °C, and then decreases abruptly [3]. Consistent with Lee and Kim’s results, oxychlorination redispersion of commercial reforming catalysts is typically performed at 510–530 °C for about 4 h [19]. Recently, Decoodt et al., in a patent disclosure, suggested that the inlet temperature of oxychlorination zone should be 510 °C [20].
The goals of this research are to understand the effects of redispersion temperature on the structure of redispersed complexes and the corresponding redispersion efficacy. Commercial catalysts are inherently nonuniform in structure. Redispersed complexes derived from these catalysts are difficult to be characterized. Model Pt/γ-Al2O3 was thus prepared with the goal of preparing nearly fully redispersed (uniform) complexes to facilitate structure identification.
γ-Al2O3 was chosen as a catalyst support, because: (1) this material has been widely used as a catalyst support in refinery, petro-chemical, and vehicle emission control; (2) the surface area is high (>150 m2/g); (3) stronger interactions with precious metals, as opposed to silica and zeolite, allowing sintered catalysts to be fully redispersed; and (4) its structure is well-known and nearly uniform.
Instead of H2PtCl6, which is commonly used in preparing supported Pt catalysts, Pt(NH3)4(NO3)2 was used, because residual chlorine contained in the H2PtCl6 prepared catalysts complicates the oxychlorination process and the structure characterization of redispersed complexes. Instead of chlorine and HCl, which are commonly used as redispersion agents, ethylenedichloride (EDC) was employed, because: (1) it has long been used as a chlorine source in redispersing sintered Pt catalysts for the catalytic reformer, as well as for converters fitted to gasoline and diesel cars; and (2) its toxicity is less than chlorine, and its corrosiveness is less than HCl.
EXAFS (Extended X-ray Absorption Fine Structure) can provide quantitative structure characterization of surface species formed in the redispersion process [21], whereas an accurate structure characterization strongly relies on the identification of back-scatter atoms (atoms bonded to absorb-atoms, Pt) and the determination of the coordination number (N) for each shell. To identify the back-scatter atom, phase-corrected Fourier transform was performed on the EXAFS function with different phase functions. The ligands bonded to Pt were then characterized by a rather symmetric peak with a bond distance (R) close to that of crystallographic data [21]. However, the identification may be interfered by other back-scatter atoms, resulting in a distortion of the symmetry of the peak [22,23]. For the elimination of the interference, a difference file technique was used in data analysis [24]. To determine number of ligands bonded to Pt, the oxidation state of Pt based on XANES (X-ray absorption near edge structure) analysis results was used as an initial guess in structure parameter estimation. Moreover, in the EXAFS function, N and Δσ2 (the Debye-Waller factor between the sample and reference compound) are highly correlated—hence, data-fitting was performed both in different weightings, [k1χ(k)] and in [k3χ(k)], so as to decouple the correlation of these two parameters [24]. Alternatively, this correlation could be minimized by calculating Debye-Waller factors ab initio [25,26,27,28,29,30].
2. Results and Discussion
2.1. Ligand Identification
In order to separate the contributions from different shells and to identify ligands of the redispersed complexes (back-scatter atoms), phase- and amplitude-corrected Fourier transform was performed to the EXAFS function, x(k). The radial distribution function was formulated as:
where k is the electron wave number, F(k) is the backscattering amplitude characteristic of a particular type of neighboring atom, and ϕj(k) is a phase shift function, approximated by linear dependence on k, i.e.,ϕ(k) = ϕ0 + σ × k.
The phase shift function causes peaks in the radical distribution function to shift to a lower R (bond length) value, while the k dependent amplitude function can result in a peak broadening and/or a sidelobe [22,31]; especially in the case of high-Z backscatter atoms, more than one peak will be present for a single shell for the transformation without amplitude correction [32].
For an absorber-backscattering pair X–Y, if the right phase and amplitude function is applied, an imaginary part of the Fourier transform (FT) of the EXAFS function will peak positively and center at the maximum of the magnitude. The correct coordination distance determined by the peak location [22,24,31] allows us to identify ligand atoms.
In this study, only the phase correction was applied in identifying ligand atoms, because: (1) the amplitude for low-Z is relatively smooth over the EXAFS range, and the estimated distance between absorber and backscatter will not deviate from real distance significantly; and (2) the signal-to-noise ratio at the end spectrum is relatively small, and dividing χ(k) by F(k) will yield a high level of background, leading to a deviation in estimating bond distance [24].
In order to examine the efficacy of redispersion qualitatively, a k3-weighted Pt–Pt phase and amplitude-corrected Fourier-transform in the range of 4.0 < k < 14.0 Å−1 was performed to the EXAFS functions of Ptrd46, Ptrd52, and Ptrd56. As shown in Figure 1a, a positive peak at about 2.75 Å appears in the imaginary part of FT for Ptrd46, Ptrd56, while a rather broad peak with a shoulder at about 3.2 Å was observed for Ptrd52. The positive peak at 2.75 Å for Ptrd46, Ptrd56 is consistent with the first shell Pt–Pt bond distance of Pt crystal structure data [33]. Among these three samples, Ptrd56 with the highest peak amplitude indicated that the redispersion efficacy of this sample was lowest. In contrast, the lowest amplitude with peak broadening for Ptrd52 suggested that this sample was almost fully re-dispersed. The peak broadening was caused by the coupling of the characteristic peak of Pt–Pt with that of ligands.
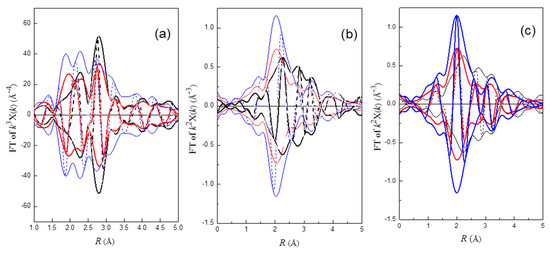
Figure 1.
Comparison of the imaginary and magnitude of Fourier transform of raw EXAFS data between Ptr56 (black), Ptr52 (blue), and Ptr46(red): (a) k3 weighted, Δk = 4.0−14 k−1, Pt–Pt phase and amplitude corrected; (b) k2 weighted, Δk = 2.8−11 k−1, Pt–Cl phase corrected; and (c) k2 weighted, Δk= 2.8−11 k−1, Pt–O phase corrected.
The possibility of the Cl ligand being bound to Pt can be examined by a k2-weighted Pt–Cl phase-corrected Fourier transform. As shown in Figure 1b, a rather symmetric positive peak at about 2.3 Å appears in the imaginary part of FT for Ptrd56, while the peak for Ptrd46 and Ptrd52 is rather asymmetric. These results suggested the existence of the Cl ligand on the redispersed Pt complex of Ptrd56.
Since oxygen gas is present in the oxychlorination process, oxygen-containing species could be a ligand of the redispersed complexes. After the Pt–O phase-corrected Fourier-transform (k2-weighted, 2.8 < k < 11.0 Å−1) was performed on the EXAFS functions, the appearance of a symmetric positive peak at about 2.05 Å for Ptrd52 and Ptrd46 (Figure 1c) suggested that oxygen was bonded to Pt. In addition, the appearance of a negative peak in the imaginary part at about 3.2 Å suggested that Cl was bonded to the O atom of Pt–O (Figure 1c); FT of Pt–Cl* (Cl* is the Cl atom of O–Cl ligand) corrected by the Pt–O phase function yielding a negative peak was due to an approximate π radian difference between the Pt–Cl and Pt–O phase function (ϕPt–Cl − ϕPt–O), as was calculated by FEFF8 [34]. The results suggested the existence of a OCl− ligand on Ptrd46 and Ptrd52.
2.2. XANES (X-Ray Absorption Near Edge Structure) Analysis
The intensity of the threshold resonance of the Pt LIII-edge XANES is related to the transition probability of exciting 2p3/2 mainly into 5d5/2 and 5d3/2 orbitals. Nonetheless, XANES has been widely used to study the coordination chemistry and oxidation state of Pt complexes. Due to the lack of a simple equation for XANES, the majority of studies based on the analysis of XANES data still rely on reference materials [35]. A comparison of Pt LIII edge data for references PtCl2, PtCl4, H2Pt(OH)6, and Ptrd52 is shown in Figure 2a, and that for Ptrd46, Ptrd56, Ptrd52, Air/ED=20, Ptrd52, WHSV=0.187, and Ptrd52 is shown in Figure 2b.
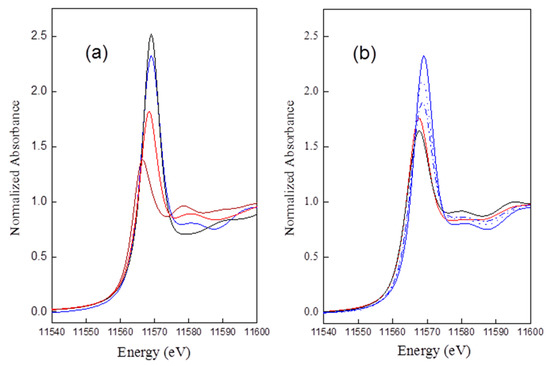
Figure 2.
Comparison of the normalized Pt LIII absorption data (XANES) between: (a) H2Pt(OH)6 (oliver line), Ptr52 (blue line), PtCl4 (orange), and PtCl2 (wine); and (b) Ptr52 (blue solid line), Ptrd52, Air/EDC=20 (blue dotted line), Ptrd52, WHSV=0.187 (blue dashdotted line), Ptrd46 (red), and Ptrd56 (black).
The intensity of the normalized threshold resonance of the absorption edge is in the order of: H2Pt(OH)6 ≈ (slightly higher than) Ptrd52 > PtCl4 ≈ Ptrd46 ≈ Ptrd56 > PtCl2. The results suggested a redispersed complex for Ptrd52 bearing about six ligands, in contrast to about four for Ptrd46 and Ptrd56.
Besides H2Pt(OH)6, a small peak appearing at postedge, 11,580 eV in the spectra of Cl contained reference standards and the redispersed samples. This peak was assigned as a hybridization peak by the authors in [36], which could be arisen by the hybridization of the Pt d photoelectron state with the unoccupied atomic Cl 3d states, mediated by multiple scattering. The results suggested the presence of Cl neighboring with Pt clusters after oxychlorination.
2.3. Detail EXAFS Analysis
A k2-weighted Fourier transformation was performed on the EXAFS function over the range of 3.0 < k < 14.5 Å−1 for all samples. The major contributions were isolated by inverse Fourier transformation of the data in the ranges of 1.15 < r < 3.30 Å. For Ptrd56, the structural parameters characteristic of the Pt–Pt contribution were roughly determined by fitting the k3-weighted Fourier isolated EXAFS function in the range 6.0 < k < 13.0 Å−1 to de-emphasize the low-Z contribution. An EXAFS function calculated from these parameters was then subtracted from the raw data (Fourier isolated EXAFS function). The residual spectra were expected to represent the ligands of the redispersed complexes; for example, Pt–Cl. The EXAFS parameters of the Pt–Cl contribution was then estimated with the coordination distance that gave the best agreement with the Pt–Cl phase-corrected FT of the residual spectra.
To check other contributions, a difference file was calculated by subtracting Pt–Pt and Pt–Cl contributions from the experimental data [37]. It is evident from the difference file that two other scatters were present, as indicted by the peaks at about 2.0 and 3.2 Å. These two peaks were assigned as characteristic peaks (Pt–O and Pt–Cl*) for Pt–OCl. The structural parameters characteristic of Pt–O and Pt–Cl* were then fitted with the residual data. The calculated EXAFS functions for Pt–O and Pt–Cl* were then subtracted from the raw data, and better parameters for Pt–Pt and Pt–Cl contributions were estimated. The refinement through this iteration was continued until a good overall agreement was obtained.
EXAFS analysis steps for Ptrd46 and Ptrd52 are similar to those for Ptrd56, except that Pt–O was fitted first, because it is the main contribution of the EXAFS. The final fitting results are summarized in Table 1. Based on the results, the Pt(Os)3–4(O–Cl)2–3 (Os represents support oxygen or hydroxyl oxygen) complex was suggested to be formed on γ-Al2O3 of Ptrd52. The comparisons of the experimental EXAFS characterizing Pt–O–Cl and Pt–Cl with the fits are shown in Figure 3a,b, respectively, while the characteristic peak for Pt–O and Pt–Cl* are shown in Figure 3c,d, respectively.

Table 1.
Summary of EXAFS analysis results characterizing redispersed complexes.
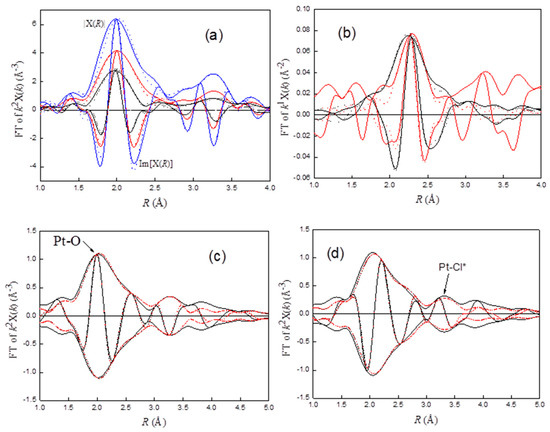
Figure 3.
Comparison of (a) FT (k2 weighted, Pt–O phase corrected) of experimental Pt–O–Cl (raw data–calculated (Pt–Pt + Pt–Cl), solid line) and calculated Pt–O–Cl (Pt–O + Pt–Cl*, dotted line) EXAFS contributions for Ptrd46 (red), Ptrd52 (blue), and Ptrd56 (black); (b) FT (k1 weighted, Pt–Cl phase corrected) of experimental (solid) and calculated (dotted) Pt–Cl contribution for Ptrd56 (black) and Ptrrd56 (red); (c) FT (k2 weighted, Pt–O phase corrected) of original EXAFS function (black solid line) and calculated (Pt–O + Pt–Pt + PtCl*, red dotted line) for Ptrd52; and (d) FT (k2 weighted, Pt–Cl phase corrected) of original EXAFS function (black solid line) and calculated (Pt–O + Pt–Pt + PtCl*, red dotted line) for Ptrd52; Note: raw data is defined as Fourier-filtered EXAFS function.
2.4. Oxychlorination Redispersion Mechanism Proposed Based on XAS
The redispersion of sintered catalysts involves the direct reaction between the Pt clusters and reactive gaseous components, such as Cl2, HCl, O2, and H2O [38,39]. The EXAFS results showed that the formation of PtOCl species was accompanied by the fragmentation of Pt clusters (Figure 1a, Figure 3a, and Table 1). The details of the chemistry—whereby the formation of PtOCl caused the dispersion of Pt clusters—are yet to be elucidated. Our experimental results suggest the role of an interaction between the redispersed complexes and supports.
In the reaction system, chlorine was formed by the reaction of HCl with oxygen (Equation (4) the reaction is a well-known Deacon reaction for the production of chlorine from hydrogen chloride. The chlorine molecules, Cl2, may be adsorbed on the active sites, S, of Pt/γ-Al2O3 and then dissociated to Cl⋅ (Equation (6)). The very reactive Cl⋅ then attacks PtO2 to form Pt–O–Cl species (Equation (7)). The species may peel off from Pt clusters and get trapped on the surface of the support (Equation (8)), thereby redispersing the sintered Pt clusters.
The interactions between Pt–O–Cl species and γ-Al2O3 can be characterized by the loss of multiple scattering effects of the Pt–Cl* peak. According to Teo [40], multiple scattering in EXAFS is significant when atoms (e.g., Pt, O, Cl) are arranged in an approximately linear array. The photoelectron emitted from Pt is strongly forward-scattered by the intervening O atom, resulting in a significant amplitude enhancement. Another indication of multiple scattering effects is the phase shift of approximately 180° of the Pt–Cl* peak, which results in a negative peak located at the maximum of the magnitude of the Pt–Cl phase-corrected FT. As shown in Figure 3d, FT corrected by Pt–Cl, a positive peak without amplitude enhancement, was observed at about 3.25 Å. These results suggest the interactions of Pt–O–Cl with support (Equation (8)); the peak appearing at about 3.8 Å for Ptrd52 (solid black line, Figure 3c) could be the characteristic peak of the interactions.
In summary, the possible reactions involved in the oxychlorination redispersion reaction were proposed by the following equations:
2C2H4Cl2 + 5O2 → 4CO2 + 2H2O + 4HCl
Ptx + xO2 ↔ (PtO2)x
2HCl + 1/2O2 ↔ Cl2 + H2O
(PtO2)x + 2xHCl ↔ xPtCl2 + xH2O + x/2O2
S + Cl2 ↔ Cl2⋅⋅S → S + 2Cl·
(PtO2)x + 2Cl·→ (PtO2)x−1Pt(O–Cl)2 → (PtO2)x−1 + Pt(O–Cl)2
Pt–O–Cl + [–Os–] → Pt–O⋅⋅Cl⋅⋅Os
The reaction chemistry involved in the oxychlorination reaction is very complicated. The mechanism proposed is simplified, as there may be a variety of mechanisms, rather than just one. Specifically, the mechanism of the formation of reactive Cl⋅ (Equation (6)) and the roles of the support in redispersed complex formation remain unclear (Equation (7)).
Reactive Cl⋅ was suggested to be formed from the dissociation of Cl2 (Equation (6)), whereas—inferred from the paper reported by Moser et al. [41]—reactive Cl⋅ may also be formed by the dissociation of O2 on the active sites, S (Equation (9)), followed by stripping proton from HCl (Equation (10)). The stripped proton was then associated with intermediate O⋅⋅S to form HO⋅⋅S (Equation (10)).
S + O2 ↔ O2⋅⋅S + S → 2O⋅⋅S
O⋅⋅S + HCl → HO⋅⋅S + Cl·
Pt clusters could be the active sites (S) responsible for the formation of reactive Cl⋅ However, reactive Cl⋅ could also be formed from the cleavage of chlorine molecular followed by the penetration of Cl⋅ into the lattice of PtO2—hence, concomitant with Cl· formation, the cleaved Cl atom (Cl·) may replace the lattice oxygen atom of PtO2 to form a Pt⋅⋅Cl bond (Equation (11)). The formation of a Pt–Cl bond was evidenced by the appearance of a PtCl characteristic peak of 2.3 Å for Ptrd56 (Figure 3b).
PtO2 + Cl2 → Cl⋅⋅Pt–O + 1/2O2 + Cl·
Moreover, based on the paper reported by Fung [38,39], chlorine could be dissociated on γ-Al2O3 to form HOCl or H2O associated with the formation of a Al–Cl bond (Equations (12) and (13)). The interactions of PtO2 with the surface chlorides may promote the formation Pt–OCl and/or Pt–Cl concomitant with the dissociation these Cl-containing species from Pt clusters. Some of the Al-bound Cl may be located at the interface between Pt clusters and support, resulting in an appearance of a Pt–Cl characteristic peak (Figure 3b).
Cl2 + [–OsAl–OH] → HOCl + [–OsAl⋅⋅Cl]
Cl2 + 2[–OsAl–OH] → H2O +1/2O2 + 2[–OsAl⋅⋅Cl]
2.5. Effects of Operation Conditions on Redispersion Efficacy
The deacon reaction is mildly exothermic (ΔH0 = −113.6 kJ mol−1) and equilibrium-limited. Lower reaction temperatures favor the formation of Cl2 [42]. For Ptsin redispersed at 520 °C, equilibrium chlorine concentration in the reaction system is lower than that which is redispersed at 460 °C, whereas more PtOCl species were formed (Figure 3a, Table 1) and a higher redispersion efficacy were observed (Table 1). The results suggest that factors influencing the redispersion efficacy depend not only on the chlorine concentration, but also the dissociation of the chlorine molecule and the interactions between redispersed complexes and the support.
Even though increasing the temperature to 560 °C may prompt Cl2 dissociation to enhance the redispersion efficacy, it also decreases the complex-support interactions and the available chlorine concentration, leading to a lower redispersion. Hence, as shown in Table 1, CNPt–Pt of 4.3 for Ptrd56 is the biggest among all three samples. Further increasing redispersion temperature, the mobile redispersed complexes may collide to form bigger particles, leading to Pt sintering, rather than redispersion.
DFT (density function theory) calculations indicated that an increased O coverage promotes stripping protons from HCl (Equation (10)) [43,44]. Hence, maintaining a higher O2 content in the redispersion process could result in increased redispersion efficacy. Our experimental results show that sintered Pt clusters (Ptsin) were almost fully redispersed under the redispersion conditions of temp = 520 °C, WHSV = 0.087, and Air/EDC = 30 to 40. As air/EDC was decreased to 20 (Ptrd52, Air/EDC=20), concomitant with the decrease of white line intensity (Figure 2a), CNPt–Cl* decreases from 2.6 to 2.2, while CNPt–Pt increases from 1.7 to 1.9 (Table 1).
PtO2 on the surface may react with Cl (Equation (7)) and/or HCl (Equation (5)). Increasing WHSV drives chlorine away from its equilibrium concentration, leading to an increase in the HCl/Cl2 ratio, which favors the formation of PtCl in the competitive reactions (Equations (5) and (7)).
When increasing WHSV from 0.07 to 0.187 (Ptrd52, WHSV=0.187), with the appearance of a PtCl characteristic peak at about 2.3 Å (Figure 4b), CNPt–Cl* was decreased from 2.6 to 1.5 (Table 1, Figure 4a). Actually, some PtCl may also have been formed in Ptrd46, Ptrd52, Air/EDC=20, and Ptrd52. However, due to strong coupling between the characteristic peak of Pt–O (dPt–O ≈ 2.0 Å) and Pt–Cl (dPt–O ≈ 2.3 Å), the rather small Pt–Cl contribution for these samples could not be decoupled by the Fourier filter and a difference file-fitting technique. Hence, the estimation of structure parameters for the Pt–Cl contribution of these samples was not attempted.
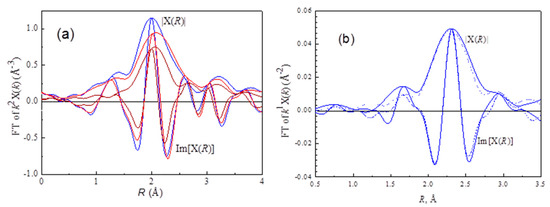
Figure 4.
Results of EXAFS analysis obtained with the best calculated structure parameters for (a) FT (k2 weighted, Δk = 3.5−11.0 k−1, Pt–O phase corrected) of experimental Pt–O–Cl (raw data–calculated (Pt–Pt + Pt–Cl), solid line) characterizing Ptrd52 (blue), Ptrd52, Air/EDC=20 (red), and Ptrd52, WHSV=0.187 (wine); and (b) FT (k1 weighted, Pt–Cl phase corrected) of experimental (raw data–calculated (Pt–Pt + Pt–O–Cl),solid line) and calculated Pt–Cl (dotted line) characterizing Ptrd52, WHSV=0.187.
2.6. Metal-Support Interface of the Re-Dispersed Pt/γ-Al2O3
The Pt–Pt k3 weighted phase- and amplitude-corrected Fourier transform characterizing Ptsin Ptrrd46, Ptrrd52, and Ptrrd56 samples are shown in Figure 5a. The peaks at about 2.7, 3.9, 4.7, 5.6 Å are consistent with the first, second, third, and fourth shell for bulk FCC (faced centered cubic) platinum [27]. These samples are characterized by a first-shell Pt–Pt contribution with a coordination number of 5.8, 7.2, 8.1, and 8.4, corresponding 0.9, 1.3, 2.2, and 3.1 nm for Ptrrd52, Ptrrd46, Ptrrd56, and Ptsin, respectively. The particle size for the redispersed samples (Table 2) is inversely proportional to the Pt–O–Cl contribution (CNPt–Cl*, Table 1), suggesting that the formation of Pt–O–Cl plays a key role in oxychlorination redispersion.
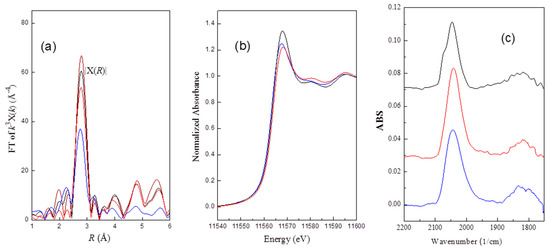
Figure 5.
Ptsin (wine), Ptrrd46 (red), Ptrrd52 (blue), and Ptrrd56 (black) characterized by (a) Fourier-transformed EXAFS (k3 weighted, Δk = 4.0–14 k−1, Pt–Pt phase and amplitude corrected); (b) XANES spectroscopy; and (c) infrared spectra in the νCO stretching region of the CO adsorbed on Pt clusters.
Table 2.
Summary of EXAFS analysis results characterizing sintered and redispersed Pt/γ-Al2O3.
In investigating the metal-support interface by X-ray absorption spectroscopy, an EXAFS function calculated from structure parameters of the first shell Pt–Pt contribution was subtracted from the Fourier-isolated EXAFS function. The residual spectra were expected to represent platinum-support interactions. For Ptrrd52, the residual spectra were contributed from Pt–Ol of the bond distance at 2.58 Å and Pt–Os at 2.16 Å (Table 2). In contrast, for Ptrrd56, the residual spectra were contributed from Pt–Cl at 2.26 Å (Table 2). These results suggested that Pt clusters on Ptrrd52 were bonded to the oxygen of γ-Al2O3 support, whereas those on Ptrrd56 were bonded to Cl on support.
A metal-oxygen bond length of about the sum of the covalent radii of the metal and oxygen (about 2.1 Å) is normally observed when the catalyst is reduced at a high temperature (>450 °C). However, when the supported-metal catalysts are treated at low temperature in H2, a longer Pt–O (2.5–2.7 Å) is observed. The longer distance could be due to the interactions between platinum and support oxide with a hydride presented at the interface between the metal and oxygen atoms [46,47].
Bazin et al. reported a strong correlation existing between the electronic density and the metal cluster size of a nanometer-scale through ab initio calculation [48]. Based on the results, we expected that XANES intensity decreased with increasing Pt particle size. Except for the Ptrrd46 sample, the experimental results were as expected. As shown in Figure 5b, the intensity of the normalized threshold resonance edge decreases in the order: Ptrrd56 > Ptrrd52 > Ptrrd46. The unexpected higher XANES intensity for Ptrrd56 may be due to Pt–Cl interactions. Electrons withdrawn from Pt clusters to Cl atom result in an increase in XANES intensity.
2.7. FT-IR (Fourier-Transform Infrared)Spectroscopy Characterizing the CO Adsorbed on the Pt of the Re-Dispersed Pt/γ-Al2O3
The FT-IR (Fourier-transform infrared) spectra of the CO adsorbed on the re-dispersed catalyst samples were consistent with spectra reported for CO adsorbed on supported Pt catalysts [49,50]. The band peaking at about 2045 cm−1 for all three samples was assigned as the terminal CO adsorbed on Pt clusters, and the broad absorption band located at about 1840 cm−1 could be the characteristic peak for bridging CO adsorption (Figure 5c).
In contrast to Ptrrd46, Ptrrd52 where it can be seen that the terminal peak is a rather symmetrical peak, an additional shoulder at about 2075 cm−1 was observed for Ptrrd56. The shift of the CO absorption bands suggest that the electron density of Pt is decreased by Pt–Cl interactions. The Cl atom abstracts electrons from Pt, which should thus decrease the number of Pt electrons available for π-bonding to the CO adsorbed on Pt clusters. The decrease in this backbonding from Pt to CO orbital results in a shift of CO to a high frequency [51]. The decrease of electronic density of the Pt clusters on Ptrrd56 due to the Pt–Cl interactions, suggested by FT-IR, is consistent with the XANES results.
A change in Pt electronic density due to Pt–Cl interactions may change catalytic properties. For example: (1) the decrease of electron density on Pt induced by metal-support or bimetallic interactions may decrease the affinity of H2S for Pt clusters, thereby increasing the stability maintenance in sulfur-poisoning catalyst deactivation [50,52]; and (2) decreasing Pt electron density may demote the activation of both C=C and C=O functional groups in a hydrogenation reaction [53]. Hence, an investigation of reduction parameters for different redispersed complexes and their effects on catalytic reactivity should be studied further.
3. Materials and Methods
3.1. Materials and Sample Preparation
The catalyst samples were prepared by using an impregnation technique. The γ-Al2O3 samples (A2U, γ-Al2O3, with a surface area of about 170 m2/g and particle size of about 1 mm, purchased from Osaka Yogyo, Japan) were brought in contact with Pt(NH3)4(NO3)2 (Strem, Newburyport, MA, USA, 99.9%) aqueous solution of 0.0061 mol/L, followed by evacuation (10−1–10−2 torr) at room temperature, and then calcined at 450 °C for 4 h. The resulting material was noted as PtO2/γ-Al2O3 and the samples were stored in vials under N2 environment before reduction. Prior to the study on the effects of reduction temperature, the sintered sample (Ptsin) was prepared by flowing water-containing (4000 ppm) H2 at 50 mL/min with temperature ramping from room temperature to 600 °C and held for 2 h.
The oxychlorination redispersion process for Pt/γ-Al2O3 was conducted in a continuous downflow fixed-bed reactor. The reactor was a stainless-steel tube with an inside diameter of 2.1 cm and volume of 94.0 mL. It was heated electrically and controlled by a PID (proportional, integral, and derivative) temperature controller with a sensor in the center of the catalyst bed. Acid gas in the effluent gas was neutralized by 1.0 N NaOH aqueous solution before purging.
Five grams of the Ptsin sample was mixed with an inert ceramic which was 0.2 cm in diameter at a ratio of 1:10, and the top of the reactor bed was filled with glass balls which were 1.6 mm in diameter to preheat and prevent channeling of the feed. The samples were pre-oxidized in flowing air at 500 °C prior to oxychlorination reaction. The redispersion process was then carried out at an Air/EDC mole ratio of 30, and WHSV of 0.07 h−1 for 16 h at three different temperatures of 460, 520, and 560 ± 15 °C, and the samples were noted as Ptrd46, Ptrd52, and Ptrd56.
In order to study the effects of the Air/EDC ratio and the residence time of the reaction on the structure of the redispersed complex, the redispersion process was also performed at 520 °C for 16 h with WHSV of 0.07 h−1, Air/EDC of 20, and with WHSV of 0.187 h−1, Air/EDC of 30, respectively. These two samples were noted as Ptrd52, Air/EDC=20 and Ptrd52, WHSV=0.187.
3.2. X-ray Absorption Spectroscopy
The X-ray absorption measurements were performed on the wiggler beamline BL17C at the National Synchrotron Radiation Research Center (NSRRC, Hsinchu, Taiwan). The electron storage ring was operated at an energy of 1.5 GeV, and a beam current between 120 and 200 mA. A Si(111) double-crystal monochromator was employed for energy selection, and higher harmonic radiation was rejected by mirrors. The transmission geometry was arranged using gas-filled ionization chambers to monitor the intensities of the incident, and transmitted x-ray beams. For the collection of a full spectrum, the energy was scanned from 200 eV below the Pt LIII absorption edge (11,564 eV) to 1200 eV above the edge.
The Ptrd46, Ptrd52, and Ptrd56 catalyst samples were pulverized into powder, pressed into wafers, and loaded into an EXAFS cell. The cell was connected to a gas-handling manifold for in situ treatment. After purging with N2, EXAFS spectra were taken. Catalyst samples were then reduced by flowing H2 of 20 mL/min with temperature ramping from room temperature to 400 °C at a rate of 5 °C/min. After the temperature reached the setting temperature, it was maintained for 1 h. The cell was allowed to cool to room temperature, and the EXAFS spectrum was measured. The reduced samples for Ptrd46, Ptrd52, and Ptrd56 were noted as Ptrrd46, Ptrrd52, and Ptrrd56, respectively.
Data reduction and data analysis were performed with the XDAP code developed by Vaarkamp et al. [37]. Standard procedures were followed to extract the EXAFS data from the measured absorption spectra. The pre-edge was approximated by a modified Victoreen curve, and the post-edge background was subtracted using cubic spline routines. Normalization was performed by dividing the background-subtracted spectrum by the height at 50 eV above the edge [22,31,37]. Phase shifts and backscattering amplitude functions of Pt–Pt, Pt–O and Pt–Cl were generated by the FEFF8 code [34], and used as reference files for EXAFS data analysis.
3.3. Characterization of Catalyst Samples by FT-IR
Infrared Fourier transform spectra of surface species were recorded with a Shimadzu IR Prestige-21 instrument (Kyoto, Japan), having a spectral resolution of 2 cm−1. Catalyst samples were pulverized into powder and loaded into a diffuse-reflectance infrared Fourier Transform spectroscopy (DRIFT) IR cell, and treatments were done in situ. To characterize the CO-adsorbed catalyst sample, before FT-IR measurement, samples were reduced in H2 flowing at about 20 mL/min at 400 °C for 1 h. After the reduction, the sample was cooled down to room temperature, and CO (flowing at 20 mL/min at 1 atm) was introduced into the cell and maintained for about 20 min. After the CO treatment, the cell was evacuated to a pressure of approximately 10−2–10−3 Torr, and IR spectra were recorded.
4. Conclusions
The fundamental understanding of the detailed oxychlorination redispersion chemistry could help us to develop and/or improve the processes for regeneration of deactivated supported-metal catalysts. In this study, a nearly uniform redispersion (fully redispersed) complex was prepared at an Air/EDC mole ratio of 30, WHSV of 0.07 h−1 for 16 h at 520 °C. By fully characterizing the structure of this complex, a possible mechanism for oxychlorination redispersion was proposed. The formation of a O–Cl ligand concomitant with the disruption of Pt clusters in the redispersion process, as was evidenced by EXAFS, suggested that chlorine formed from the reaction of HCl with oxygen plays the main role in the redispersion process. Increasing the operation temperature prompts Cl2 dissociation, thereby enhancing redispersion of the sintered Pt clusters, whereas this positive factor may be counteracted by the reduction in equilibrium conversion of HCl to Cl2, the decrease in complex-support interactions, and the loss in support surface area. Our experimental results showed that the optimal redispersion temperature is at about 520 °C. By decreasing the redispersion temperature from 520 °C to 460 °C, the coordination number of Pt–Cl* (Pt–O–Cl), CNPt–Cl* decreased from 2.6 to 1.4. On the other hand, by increasing the redispersion temperature from 520 °C to 560 °C, Pt–Cl was formed with the decrease of CNPt–Cl* to 1.5. Inferred from our experimental results, a lower optimal redispersion temperature for Pt/zeolite and Pt/SiO2, as opposed to that for Pt/γ-Al2O [4,54,55], were suggested due to the lower affinity of the redispersed complexes to these supports. Moreover, considering the structure of redispersed complexes and their interactions with supports, the residence time of oxychlorination reaction is also an important parameter that affects redispersion efficacy. High WHSV decreases Cl2 conversion, which decreases Pt–O–Cl while increasing Pt–Cl formation. After reduction in H2 at 400 °C, Pt–Cl remains intact. The Cl atom bonded to Pt may abstract electrons from Pt, resulting in a decrease in electronic density of the Pt clusters that could lead to a change in catalyst reactivity. To develop an efficient and economical regeneration process, optimal reduction conditions for the redispersed complexes of different structure should be investigated.
Author Contributions
C.-C.H. and C.-Y.Y. prepared catalyst samples, performed redispersion experiments, and did XAS measurement; C.-C.H. wrote rough-draft manuscript in Chinese; C.-C.S. analyzed and discussed experimental results; J.-R.C. analyzed EXAFS data, organized experimental data, and wrote manuscript.
Funding
This research was funded by Ministry of Science and Technology, Taiwan, grant number MOST-107-2221-E-194-018.
Acknowledgments
The EXAFS data were analyzed using the FEFF and XDAP Data Analysis Program. XDAP program was developed by M. Vaarkam; J. C. Linders, and D. C. Koningsberger. The supports of Ministry of Science & Technology, R.O.C. (Contract No. MOST-107-2221-E-194-018 and MOST 107-2622-E-224-012-CC1), National Synchrotron Radiation Research Center (NSRRC), and Refining & Manufacturing Research Institute, CPC Corporation, Taiwan is acknowledged. We also thank Ming-Hsiu Kuo and Chia-Chi Chang for their preliminary studies in redispersion techniques.
Conflicts of Interest
The authors declare no conflict of interest.
References
- Morgan, K.; Goguet, A.; Hardacre, C. Metal Redispersion Strategies for Recycling of Supported Metal Catalysts: A Perspective. ACS Catal. 2015, 5, 3430–3445. [Google Scholar] [CrossRef]
- Normand, F.L.; Borgna, A.; Garetto, T.F.; Apesteguia, C.R.; Moraweck, B. Redispersion of Sintered Pt/Al2O3 Naphtha Reforming Catalysts: An in Situ Study Monitored by X-ray Absorption Spectroscopy. J. Phys. Chem. 1996, 100, 9068–9076. [Google Scholar] [CrossRef]
- Lee, T.J.; Kim, Y.G. Redispersion of Supported Platinum Catalysts. J. Catal. 1984, 90, 279–291. [Google Scholar] [CrossRef]
- Argyle, M.D.; Bartholomew, C.H. Heterogeneous Catalyst Deactivation and Regeneration: A Review. Catalysts 2015, 5, 145–269. [Google Scholar] [CrossRef]
- Franck, J.P.; Martino, G. Deactivation and Regeneration of Catalytic-Reforming Catalysts. In Progress in Catalyst Deactivation; NATO Advanced Study Institute Series E., No. 54; Figueiredo, J.L., Ed.; Martinus Nijhoff Publishers: Boston, MA, USA, 1982; pp. 355–397. [Google Scholar]
- Innes, R.A.; Holtermann, D.L.; Mulaskey, B.F. Low Temperature Regeneration of Coke Deactivated Reforming Catalysts. U.S. Patent 5,883,031, 16 March 1999. [Google Scholar]
- Buss, W.C.; Hughes, T.R. In Situ Hydrocarbon Conversion Catalyst Regeneration and Sulfur Decontamination of Vessels Communicating with Catalyst Reactor. U.S. Patent 4,482,637, 13 November 1984. [Google Scholar]
- Huang, Y.Y.; LaPierre, R.B.; McHale, W.D. Process for Dispersing or Redispersing a Group VIII Noble Metal Species or a Porous Inorganic Support. U.S. Patent 4,952,543, 28 August 1990. [Google Scholar]
- Leirsburg, D.A.V.; Mohr, D.H.; Tamm, P.W.; Jacobson, R.L.; Hughes, T.R.; Wilson, C.R. Process for Regenerating Sulfur Contaminated Reforming Catalyst. U.S. Patent 4,851,380, 25 July 1989. [Google Scholar]
- Afonso, J.C.; Aranda, D.A.G.; Schmal, M.; Frety, R. Regeneration of a Pt-Sn/Al2O3 Catalyst: Influence of Heating Rate, Temperature and Time of Regeneration. Fuel Process. Technol. 1997, 50, 35–48. [Google Scholar] [CrossRef]
- Fino, D.; Bensaid, S.; Piumetti, M.; Russo, N. A Review on the Catalytic Combustion of Soot in Diesel Particulate Filters for Automotive Applications: From Powder Catalysts to Structured Reactors. Appl. Catal. A 2016, 509, 75–96. [Google Scholar] [CrossRef]
- Landolt, G.R.; McHale, W.D.; Schoennagel, H.J. Catalyst Regeneration Procedure. U.S. Patent 4,359,400, 16 November 1982. [Google Scholar]
- Nagai, Y.; Dohmae, K.; Ikeda, Y.; Takagi, N.; Tanabe, T.; Hara, N.; Guilera, G.; Pascarelli, S.; Newton, M.A.; Kuno, O.; et al. In Situ Redispersion of Platinum Autoexhaust Catalysts: An On-line Approach to Increasing Catalyst Lifetimes? Angew. Chem. Int. Ed. 2008, 47, 9303–9306. [Google Scholar] [CrossRef]
- Nagai, Y.; Dohmae, K.; Ikeda, Y.; Takagi, N.; Hara, N.; Tanabe, T.; Guilera, G.; Pascarelli, S.; Newton, M.A.; Takahashi, N.; et al. In Situ Observation of Platinum Sintering on Ceria-based Oxide for Autoexhaust Catalysts Using Turbo-XAS. Catal. Today 2011, 175, 133–140. [Google Scholar] [CrossRef]
- Kim, S.; D’Aniello, M.J., Jr. Electron Microscopy Study of a Rejuvenated Vehicle-Aged Automotive Exhaust Catalyst. Appl. Catal. 1989, 56, 45–56. [Google Scholar] [CrossRef]
- Borgna, A.; Garetto, T.F.; Apesteguia, C.R.; Normand, F.L.; Moraweck, B. Sintering of Chlorinated Pt/γ-Al2O3 Catalysts: An in Situ Study by X-Ray Absorption Spectroscopy. J. Catal. 1999, 186, 433–441. [Google Scholar] [CrossRef]
- Wanke, S.E. Sintering of commercial supported platinum group metal catalysts. In Progress in Catalyst Deactivation; NATO Advanced Study Institute Series E, No. 54; Figueiredo, J.L., Ed.; Martin Nijhoff Publishers: Boston, MA, USA, 1982; pp. 315–328. [Google Scholar]
- Fung, S.C. Regeneration a Reforming Catalyst. CHEMTEC 1994, 24, 40–44. [Google Scholar]
- Antos, G.J.; Aitani, A.M. Catalytic Naphtha Reforming, 2nd ed.; Marcel Dekker, Inc.: New York, NY, USA, 2004; pp. 453–456. [Google Scholar]
- Decoodt, X.; Durand, S.; Le-Goff, P.Y.; Wermester, S. Process for Regenerating a Reforming Catalyst. U.S. Patent 2010/0,311,566, 9 December 2010. [Google Scholar]
- Hyde, T.I.; Ash, P.W.; Boyd, D.A.; Randlshofer, G.; Rothenbacher, K.; Sankar, G. X-Ray Absorption Spectroscopic Studies of Platinum Speciation in Fresh and Road Aged Light-Duty Diesel Vehicle Emission Control Catalysts. Platin. Met. Rev. 2011, 55, 233–245. [Google Scholar] [CrossRef]
- Koningsberger, D.C.; Prins, R. X-ray Absorption: Principles, Applications, Techniques of EXAFS, SEXAFS, and XANES; John Wiley & Sons: New York, NY, USA, 1988. [Google Scholar]
- Vaarkamp, M.; Linders, J.C.; Koningsberger, D.C. A New Method for Parameterization of Phase Shift and Backscattering Amplitude. Physica B 1995, 208–209, 159–160. [Google Scholar] [CrossRef]
- Kampers, F.W.H. EXAFS in Catalysis: Instrumentation and Applications. Ph.D. Thesis, Eindhoven University of Technology, Eindhoven, The Netherlands, 1988. [Google Scholar]
- Dimakis, N.; Bunker, G. Ab initio single-and multiple-scattering EXAFS Debye-Waller factors: Raman and infrared data. Phys. Rev. B 1998, 58, 2467–2475. [Google Scholar] [CrossRef]
- Dimakis, N.; Bunker, G. Group-fitted ab initio single- and multiple-scattering EXAFS Debye-Waller factors. Phys. Rev. B 2002, 65, 201103(R). [Google Scholar] [CrossRef]
- Dimakis, N.; Bunker, G. Ab initio self-consistent x-ray absorption fine structure analysis for metalloproteins. Biophys. J. 2006, 91, L87–L89. [Google Scholar] [CrossRef][Green Version]
- Dimakis, N. Ab Initio Calculation of XAFS Debye-Waller Factors for Crystalline Materials. AIP Conf. Proc. 2007, 882, 126. [Google Scholar]
- Poiarkova, A.V.; Rehr, J.J. Multiple-scattering X-ray-absorption fine-structure Debye-Waller factor calculations. Phys. Rev. B 1999, 59, 948–957. [Google Scholar] [CrossRef]
- Rehr, J.J.; Kas, J.J.; Vila, F.D.; Prange, M.P.; Jorissen, K. Parameter-free calculations of x-ray spectra with FEFF9. Phys. Chem. Chem. Phys. 2010, 12, 5503–5513. [Google Scholar] [CrossRef] [PubMed]
- Iwasawa, Y. X-ray Absorption Fine Structure for Catalysts and Surface; World Scientific: Singapore, 1995; pp. 33–58. [Google Scholar]
- Chen, N.Y.; Liu, M.C.; Yang, S.C.; Chang, J.R. EXAFS Peaks and TPR Characterizing Bimetallic Interactions: Effects of Impregnation Methods on the Structure of Pt-Ru/C Catalysts. J. Spectrosc. 2014, 2014, 1–13. [Google Scholar] [CrossRef]
- Purnell, S.K.; Sanchez, K.M.; Patrini, R.; Chang, J.R.; Gates, B.C. Genesis and Growth of Pt Particles on MgO: Characterization by X-ray Absorption Spectroscopy and Infrared Spectroscopy. J. Phys. Chem. 1994, 98, 1205–1212. [Google Scholar] [CrossRef]
- Zabinsky, S.I.; Rehr, J.J.; Ankudinov, A.; Albers, R.C.; Eller, M.J. Multiple-scattering Calculations of X-ray-absorption Spectra. Phys. Rev. B 1995, 52, 2995–3009. [Google Scholar] [CrossRef]
- Bare, S.R. EXAFS Data Collection and Analysis Course; NSLS (National Synchrotron Light Source): Upton, NY, USA, 2003; pp. 1–40. [Google Scholar]
- Ankudinov, A.L.; Rehr, J.J.; Bare, S.R. Hybridization Peaks in Pt-Cl XANES. Chem. Phys. Lett. 2000, 316, 495–500. [Google Scholar] [CrossRef]
- Vaarkamp, M. XDAP User’s Guide; XAFS Services International: Woudenberg, The Netherlands, 1996. [Google Scholar]
- Fung, S.C. Redispersion of Iridium-Containing Catalysts: Chemistry and Kinetics. Ind. Eng. Chem. Res. 2003, 42, 1551–1556. [Google Scholar] [CrossRef]
- Fung, S.C. Redispersion of Iridium Using in Situ Chlorine Generation and Avoiding Iron Contamination. Catal. Today 1999, 53, 325–338. [Google Scholar] [CrossRef]
- Teo, B.K. EXAFS: Basic Principles and Data Analysis; Springer: New York, NY, USA, 1986; p. 96. [Google Scholar]
- Moser, M.; Mondelli, C.; Amrute, A.P.; Tazawa, A.; Teschner, D.; Schuster, M.E.; Klein-Hoffman, A.; Lopez, N.; Schmidt, T.; Perez-Ramirez, J. HCl Oxidation on IrO2 Based Catalysts: From Fundamentals to Scale-Up. ACS Catal. 2013, 3, 2813–2822. [Google Scholar] [CrossRef]
- Nanda, A.K. The Kinetics of the Reverse Deacon Reaction. Ph.D. Thesis, Iowa State University, Ames, IA, USA, 1981. [Google Scholar]
- López, N.; Gómez-Segura, J.; Marín, R.P.; Pérez-Ramírez, J. Mechanism of HCl Oxidation (Deacon Process) Over RuO2. J. Catal. 2008, 255, 29–39. [Google Scholar] [CrossRef]
- Zweidinger, S.; Crihan, D.; Knapp, M.; Hofmann, J.P.; Seitsonen, A.P.; Weststrate, C.J.; Lundgren, E.; Andersen, J.N.; Over, H. Reaction Mechanism of the Oxidation of HCl over RuO2(110). J. Phys. Chem. C 2008, 112, 9966–9969. [Google Scholar] [CrossRef]
- Gates, B.C. Catalytic Chemistry; John Wiley & Sons: New York, NY, USA, 1991; p. 246. [Google Scholar]
- Koningsberger, D.C.; Gates, B.C. Nature of The Metal-support and Metal-promoter Interface: Implications of X-ray Absorption Spectroscopy for Catalysis. Catal. Lett. 1992, 14, 271–277. [Google Scholar] [CrossRef]
- Oudenhuijzen, M.K.; Bitter, J.H.; Koningsberger, D.C. The Nature of the Pt-H Bonding for Strongly and Weakly Bonded Hydrogen on Platinum. A XAFS Spectroscopy Study of the Pt-H Antibonding Shaperesonance and Pt-H EXAFS. J. Phys. Chem. B 2001, 105, 4616–4622. [Google Scholar] [CrossRef]
- Bazin, D.; Rehr, J.J. Limits and Advantages of X-ray Absorption Near Edge Structure for Nanometer Scale Metallic Clusters. J. Phys. Chem. B 2003, 107, 12398–12402. [Google Scholar] [CrossRef]
- Little, L.H. Infrared Spectra of Adsorbed Species; Academic Press: New York, NY, USA, 1966; pp. 47–88. [Google Scholar]
- Jan, C.A.; Lin, T.B.; Chang, J.R. Aromatics Reduction over Supported Platinum Catalysts. 3. Effects of Catalyst Precursors and Pretreatment Conditions on the Performance of Palladium-Promoted Platinum Catalysts. Ind. Eng. Chem. Res. 1996, 35, 3893–3898. [Google Scholar] [CrossRef]
- Cotton, F.A.; Wilkinson, G. Advanced Inorganic Chemistry, 5th ed.; John Wiley & Sons: New York, NY, USA, 1988; pp. 58–62. [Google Scholar]
- Sheu, H.S.; Lee, J.F.; Shyu, S.G.; Chou, W.W.; Chang, J.R. Chang Sulfur Resistance Enhancement by Grafted TiO2 in SiO2-supported Pd catalysts: Role of Grafted TiO2 and Genesis of Pd Clusters. J. Catal. 2009, 266, 15–25. [Google Scholar] [CrossRef]
- Hsu, C.Y.; Chiu, T.C.; Shin, M.H.; Tsai, W.J.; Chen, W.Y.; Lin, C.H. Effect of Electron Density of Pt Catalysts Supported on Alkali Titanate Nanotubes in Cinnamaldehyde Hydrogenation. J. Phys. Chem. C 2010, 114, 4502–4510. [Google Scholar] [CrossRef]
- McCullen, S.B.; Wong, S.S.; Huang, T.J. Regeneration of Noble Metal-highly Siliceous Zeolite with Sequential Hydrogen Halide and Halogen or Organic-halogen Compound Treatment. U.S. Patent 4,645,751, 24 February 1987. [Google Scholar]
- Borghard, W.S.; Huang, T.J.; McCullen, S.B.; Schoennagel, H.J.; Tsao, Y.P.; Wong, S.S. Redispersion of Agglomerated Noble Metals on Zeolite Catalysts. U.S. Patent 4,657,874, 14 April 1987. [Google Scholar]


© 2019 by the authors. Licensee MDPI, Basel, Switzerland. This article is an open access article distributed under the terms and conditions of the Creative Commons Attribution (CC BY) license (http://creativecommons.org/licenses/by/4.0/).