Article

Influence of Sn Content, Nanostructural Morphology, and Synthesis Temperature on the Electrochemical Active Area of Ni-Sn/C Nanocomposite: Verification of Methanol and Urea Electrooxidation

by
Nasser A. M. Barakat
1,*,
Mohammad Ali Abdelkareem
1,2,3 and
Emad A. M. Abdelghani
1
1
Chemical Engineering Department, Minia University, El-Minia 61519, Egypt
2
Dept. of Sustainable and Renewable Energy Engineering, University of Sharjah, P.O. Box 27272 Sharjah, UAE
3
Center for Advanced Materials Research, University of Sharjah, P.O. Box 27272 Sharjah, UAE
*
Author to whom correspondence should be addressed.
Catalysts 2019, 9(4), 330; https://doi.org/10.3390/catal9040330
Submission received: 12 February 2019 / Revised: 21 March 2019 / Accepted: 22 March 2019 / Published: 3 April 2019
(This article belongs to the Special Issue Immobilized Non-Precious Electrocatalysts for Advanced Energy Devices)

Abstract

:
In contrast to precious metals (e.g., Pt), which possess their electro catalytic activities due to their surface electronic structure, the activity of the Ni-based electrocatalysts depends on formation of an electroactive surface area (ESA) from the oxyhydroxide layer (NiOOH). In this study, the influences of Sn content, nanostructural morphology, and synthesis temperature on the ESA of Sn-incorporated Ni/C nanostructures were studied. To investigate the effect of the nanostructural, Sn-incorporated Ni/C nanostructures, nanofibers were synthesized by electrospinning a tin chloride/nickel acetate/poly (vinyl alcohol) solution, followed by calcination under inert atmosphere at high temperatures (700, 850, and 1000 °C). On the other hand, the same composite was formulated in nanoparticulate form by a sol-gel procedure. The electrochemical measurements indicated that the nanofibrous morphology strongly enhanced formation of the ESA. Investigation of the tin content concluded that the optimum co-catalyst content depends on the synthesis temperature. Typically, the maximum ESA was observed at 10 and 15 wt % of the co-catalyst for the nanofibers prepared at 700 and 850 °C, respectively. Study of the effect of synthesis temperature concluded that at the same tin content, 850 °C calcination temperature reveals the best activity compared to 700 and 1000 °C. Practical verification was achieved by investigation of the electrocatalytic activity toward methanol and urea oxidation. The results confirmed that the activity is directly proportionate to the ESA, especially in the case of urea oxidation. Moreover, beside the distinct increase in the current density, at the optimum calcination temperature and co-catalyst content, a distinguished decrease in the onset potential of both urea and methanol oxidation was observed.

1. Introduction

The near depletion of fossil fuels, as well as emission of various environmentally unacceptable oxides, such as NOx, COx, and SOx, has forced researchers at both academic and industrial levels to search for alternative fuel sources. Fuel cells could be promising candidates if the capital cost is reduced. Commercially, utilizing precious electrodes strongly constrains the wide applications of the fuel cells because of the high cost. Although in literature there are huge trials investigating the use of the transition metals as electrodes, based on our best knowledge, there are no commercial applications. On the other hand, transition metal electrodes can be effectively used as anode materials in hydrogen production by electrolysis. Hydrogen is the most promising candidate fuel from sustainability and environmental points of view, and as a future alternative to fossil fuels [1,2]. There are several techniques that have been introduced to generate hydrogen, including fermentation of waste biomasses [3,4], water electrolysis [5], water photosplitting [6], thermal production [7], etc. These general techniques suffer from some drawbacks, such as low yield (fermentation and water photosplitting), high cost (water electrolysis and thermal processes), or seasonality (water photosplitting under solar radiation). Among these methods, electrolysis is the most widely used due to the ability to reduce the required power by using other precursors rather than water, such as alcohols and urea [8,9,10].
Methanol is the simplest and the most popular investigated alcohol in the electrooxidation process. Methanol can be classified as a renewable energy source because it can be produced from biomasses [11,12]. Furthermore, compared to compressed hydrogen, methanol exhibits more efficient storage in terms of weight and volume. Accordingly, methanol does not require a cryogenic container that oftentimes needs to be maintained at a very low temperature [13,14]. Additionally, the risk of flash fire and explosion is low due to the low volatility. Therefore, hydrogen extraction from methanol fulfills most of the requirements for the generation and storing processes. Compared to water electrolysis, methanol electrooxidation needs a smaller potential at 1.2 and 0.02 V, respectively, which makes it a preferable technology from an energy requirement point of view. Methanol electrooxidation for hydrogen production can be performed according to the following reactions:
In acid media
Anode:  CH3OH + H2O → CO2 + 6H+ + 6e
Cathode:  6H+ + 6e → 3H2
Overall:  CH3OH + H2O → CO2 + 3H2
In alkaline media
Anode:  CH3OH + 6OH → CO2 + 5H2O + 6e
Cathode:  6H2O + 6e → 3H2 + 6OH
Overall:  CH3OH + H2O → CO2 + 3H2
Yet, this trivial required cell potential is a theoretical value, while a high overpotential is created depending on the electrocatalytic activity of the utilized anode [15,16].
Beside methanol, urea is another important future candidate as a hydrogen precursor because urea-contaminated wastewater is produced in large amounts from fertilizer manufacturing plants. Therefore, generating hydrogen from urea-polluted wastewater solves an environmental problem simultaneously. Theoretically, production of hydrogen from urea does not need additional power, as it is an exothermic reaction according to the following equations [17,18,19,20]:
Anode:  CO(NH2)2 + 6OH → N2 + 5H2O + CO2 + 6e  E0 = −0.746 V
Cathode:  6H2O + 6e → 3H2 + 6OH         E0 = −0.829 V
Overall:  CO(NH2)2 + H2O → N2 + 3H2 + CO2    E0 = −0.083 V
So far, based on our best knowledge, no anode material has been reported that could achieve the task without additional power.
Among the investigated transition metals, Ni showed promising electrochemical oxidation activity for both methanol and urea [21,22]. In contrast to precious metals, nickel owes its electocatalytic activity from the ability to form an electroactive oxyhydroxide layer (NiOOH), which can be formed by being swept in an alkaline solution or during the oxidation process [23]. The active compound forms an electroactive surface area (ESA). Typically, nickel is first oxidized to Ni(OH)2, then the hydroxide layer is transformed to the oxy(hydroxide) form [24,25]. Therefore, there is a strong belief that enhancing the formation of the ESA leads to improvement of the electrocatalytic performance.
Different strategies have been carried out to improve activity of Ni, whether by increasing its surface area [26,27,28,29] or by forming an alloy with other transition metals, such as Mn [30], Co [31,32], Cr [33], Cu [34], and TiO2 [35]. As a co-catalyst, tin is extensively used to improve the electrochemical oxidation activity of Pt towards methanol oxidation [36,37,38,39,40]. Tin improves methanol oxidation by one or more of the following ways. By providing a charge to Pt, it can increase the adsorption of alcoholic residues on the catalyst surface, and it can decrease the content of higher valent Pt sites [37]. Moreover, tin can decrease the poisoning of Pt by CO by providing an oxygen group on its surface [40]. With nickel, NiSn bimetallic nanoparticle-immobilized titanium and carbon nanofiber supports were introduced as electrode materials for methanol and urea electrooxidation [20,41,42]. Moreover, NiSn discrete nanoparticles have been reported as a stable electro catalyst for methanol oxidation [43].
Beside the catalyst composition, the size also has a strong influence on the activity. Accordingly, synthesizing the functional materials in nanostructural forms strongly enhances the performance. However, the nanostructural morphology can considerably affect the activity. The large axial ratio characteristic improves the electron transfer process. This is a very effective feature that privileges the nanofibers from the other nanostructures [44]. There are several nanofibers making techniques that have been reported, including template-assisted [45], self-assembly [46], drawing [47], and electrospinning [48]. However, only the electrospinning process is widely used due to its simplicity, high yield, low cost, and ease of control on the product morphology [28,48,49]. Basically, the electrooxidation reactions are considered a combination between adsorption and chemical reaction processes. Therefore, the carbonaceous materials showed good performances as supports for different electrocatalysts [50,51,52,53]
In this study, the influence of tin content, the nanostructural morphology, and the synthesis temperature on the ESA of Sn-incorporated Ni/C nanostructures were investigated. To properly prove the obtained conclusion, practical verification was done by investigating the electocatalytic activities toward methanol and urea. The nanofibers have been prepared by calcination of electrospun nanofibers composed of poly(vinyl alcohol), tin chloride, and nickel acetate under vacuum atmosphere at different temperatures. Nanoparticulate morphology was formulated by crushing and grinding dried sol-gels from the same mixture followed by a calcination process. The electrochemical measurements indicated that the ESA can be improved by optimizing the Sn content and the calcination temperature. Moreover, the nanofibrous morphology leads to formation of high ESA compared to the nanoparticles. Regarding methanol and urea electrooxidation, the results proved that the electrocatalytic activity mainly depends on the ESA.

2. Results Discussion

2.1. Crystalline Structure, Surface Morphology, and Composition of the Prepared Materials

Among the nanofiber making techniques, electrospinning produces the highest quality from the morphology point of view. Usually, if the electrospinning parameters are optimized, good morphology can be obtained. On the other hand, maintaining the nanofibrous morphology during the calcination process depends on the utilized precursor for the inorganic nanofibers. Polycondensation is the main characteristic of a good precursor. In this regard, alkoxides are the best precursors. Due to the containing oxy-organic anion, metals acetates show good tendency for polycondensation [54]. Consequently, after the calcination process, good morphology nanofibers were obtained, as seen in Figure 1, which displays Scanning Electron Microscope (SEM) and Field Emission Scanning Electron Microscope (FE SEM) images for the powder obtained from 10 wt % tin chloride. It is noteworthy mentioning that all the formulations (at different Sn contents) reveal good morphology nanofibers with the appearance of some nanoparticles at high tin contents. Data are not shown.
XRD analysis is a high confidence technique for investigating the crystal structure and composition of the crystalline materials. Tin and nickel can form a bimetallic alloy with a wide composition range [55]. Figure 2 displays the XRD pattern of the nanofibers obtained from an initial electrospun solution containing different concentrations from the tin precursor. As shown, change in the initial electrospun solution concentration resulted in variation in the final product composition. However, it can be concluded that the produced nanofibers are composed of two main metalic compunds; Ni3Sn2 and Ni3Sn. The diffraction peaks for the crystal plans of (1 0 1), (0 0 2), (1 0 2), (1 1 0), (2 0 1), (1 1 2), (1 0 3), (2 0 2), and (2 1 1) at 2θ values of 30.8°, 34.75°, 43.55°, 44.65°, 55.09°, 57.58°, 59.85°, 63.91°, and 73.42° conclude the formation of Ni3Sn2 alloy according to the standard JCDPS database (#06-0414). On the other hand, the other diffraction peaks at 2θ values of 28.6°, 39.3°, 42.5°, 44.8°, and 59.3°, corresponding to the (1 0 1), (2 0 0), (0 0 2), (2 0 1), and (2 0 2) crystal planes, respectively, conclude the formation of Ni3Sn alloy (JCDPS# 35-1362). It is noteworthy mentioning that the nanomorphology did not affect the XRD result. In other words, at the same composition, similar XRD patterns were obtained for the nanofiber and nanoparticle samples. Furthermore, change in the calcination temperature resulted in change in the intensity of the observed peaks in the XRD pattern (data are not shown), however the data concluded that all the prepared samples are composed of NiSn alloys. The observed peak at 2θ~25° referring to an experimental d spacing of 3.37 Å indicates formation of graphite-like carbon (d (002), JCPDS; 41-1487).
Figure 3A illustrates the internal structural of produced nanofibers, which was investigated by TEM analysis. As shown in the figure, the prepared nanofibers are composed of crystalline nanoparticles incorporated in an amorphous nanofibrous matrix. Based on the XRD results, the crystalline nanoparticles can be assigned to NiSn, while the nanofiber body consists of the formed amorphous graphite. Accordingly, it can be concluded that the final products are NiSn nanoparticle-incorporated carbon nanofibers. Figure 3B demonstrates the line elemental analysis at a randomly selected line. As shown, the result is in consistent with the XRD data. Obtaining similar distribution for the nickel and tin concludes the formation of the NiSn alloy, which supports the XRD results.
Change in the chemical composition can be explored by the thermal gravimetrical analysis (TGA); Figure 4A shows the obtained results. To mathematically extract the embedded information in the TGA spectrum, the first derivative of the graph was determined (Figure 4B) because the big changes in the sample weight are translated into peaks. The first peak, at ~100 °C, can be assigned to evaporation of the physically attached water in the sample. The high intensity peak observed at ~250 °C denotes a big decrease in the sample weight at this temperature. Based on the thermal characteristics of the used polymer, this peak can be assigned to the polymer decomposition [8,10]. Formation of zero valent metals rather than the expected metal oxides was attributed to the abnormal decomposition of the acetate anion under the inert atmosphere. Briefly, strongly reducing gases (namely carbon monoxide and hydrogen) are produced due to the decomposition of acetate, which leads to complete reduction of the precursors to metals. The full reduction of nickel acetate can be chemically represented by these equations [56]:
Ni(CH3COO)2·4H2O → 0.86Ni(CH3COO)2·0.14Ni(OH)2 + 0.28CH3COOH + 3.72H2O
0.86 Ni(CH3COO)2·0.14Ni(OH)2 → NiCO3 + NiO + CH3COCH3 + H2O
NiCO3 → 6NiO + CO2
NiO + CO → 6Ni + CO2
Similarly, formation of pure tin can be assigned to the evolved reducing gases. Therefore, the remaining peaks in the first derivative plot represent the aforementioned chemical transformations.
As they were detected in the final product, it can be claimed that NiSn metallic alloys have higher melting points with respect to the synthesis temperature. On the other hand, tin (M.P 231.9 °C) is more volatile compared to nickel (M.P 1455 °C). Accordingly, vaporization of the free tin is expected during the calcination process, while, due to its high thermal stability, nickel can withstand at this high temperature without losing any weight. Therefore, free Ni (excess than the stoichiometry) can be expected to be present in the produced nanofibers in either amorphous form or embedded as discrete atoms inside the formed graphite; both structures are not detectable by the XRD analysis. Accordingly, it can be claimed that the nickel content in the final nanofibers matches the amount in the initial precursor.
Nipre = NiNi3Sn + NiNi3Sn2 + Nifree
On the other hand, no free tin can withstand the produced nanofibers, so the used tin can be estimated as follows:
Snpre = SnNi3Sn + SnNi3Sn2 + SnEvap
In each formulation, the ratio between Ni3Sn and Ni3Sn2 almost matches the ratio between the intensities of the main peaks (R) in the XRD pattern, i.e., R = NiNi3Sn/NiNi3Sn2, then if there is no free Ni:
N i Pr e = 3 M . w t N i M . w t N i 3 S n × N i 3 S n + 3 M . w t N i M . w t N i 3 S n 2 × N i 3 S n 2
N i Pr e = 3 M . w t N i M . w t N i 3 S n × R × N i 3 S n 2 + 3 M . w t N i M . w t N i 3 S n 2 × N i 3 S n 2
N i 3 S n 2 = N i Pr e 3 M . w t N i × ( R M . w t N i 3 S n + 1 M . w t N i 3 S n 2 )
With the same strategy, for full consumption of Sn in the formed alloys:
S n Pr e = M . w t S n M . w t N i 3 S n × N i 3 S n + 2 M . w t S n M . w t N i 3 S n 2 × N i 3 S n 2
S n Pr e = M . w t S n M . w t N i 3 S n × R × N i 3 S n 2 + 2 M . w t S n M . w t N i 3 S n 2 × N i 3 S n 2
N i 3 S n 2 = S n Pr e M . w t S n × ( R M . w t N i 3 S n + 2 M . w t N i 3 S n 2 )
From these equations, the amount of Ni3Sn and Ni3Sn2, and consequently Ni and Sn in each formulation can be estimated. Later on, the formed graphite can also be estimated from the TGA data. From the calculations, it was observed that the losses in tin occurred in the highest tin precursor sample (35 wt %), as Ni was totally consumed in the metallic alloy, so the remaining Sn evaporated and no free nickel was obtained. Numerically, the rough estimation of the elemental composition of the produced nanofibers is summarized in Table 1.

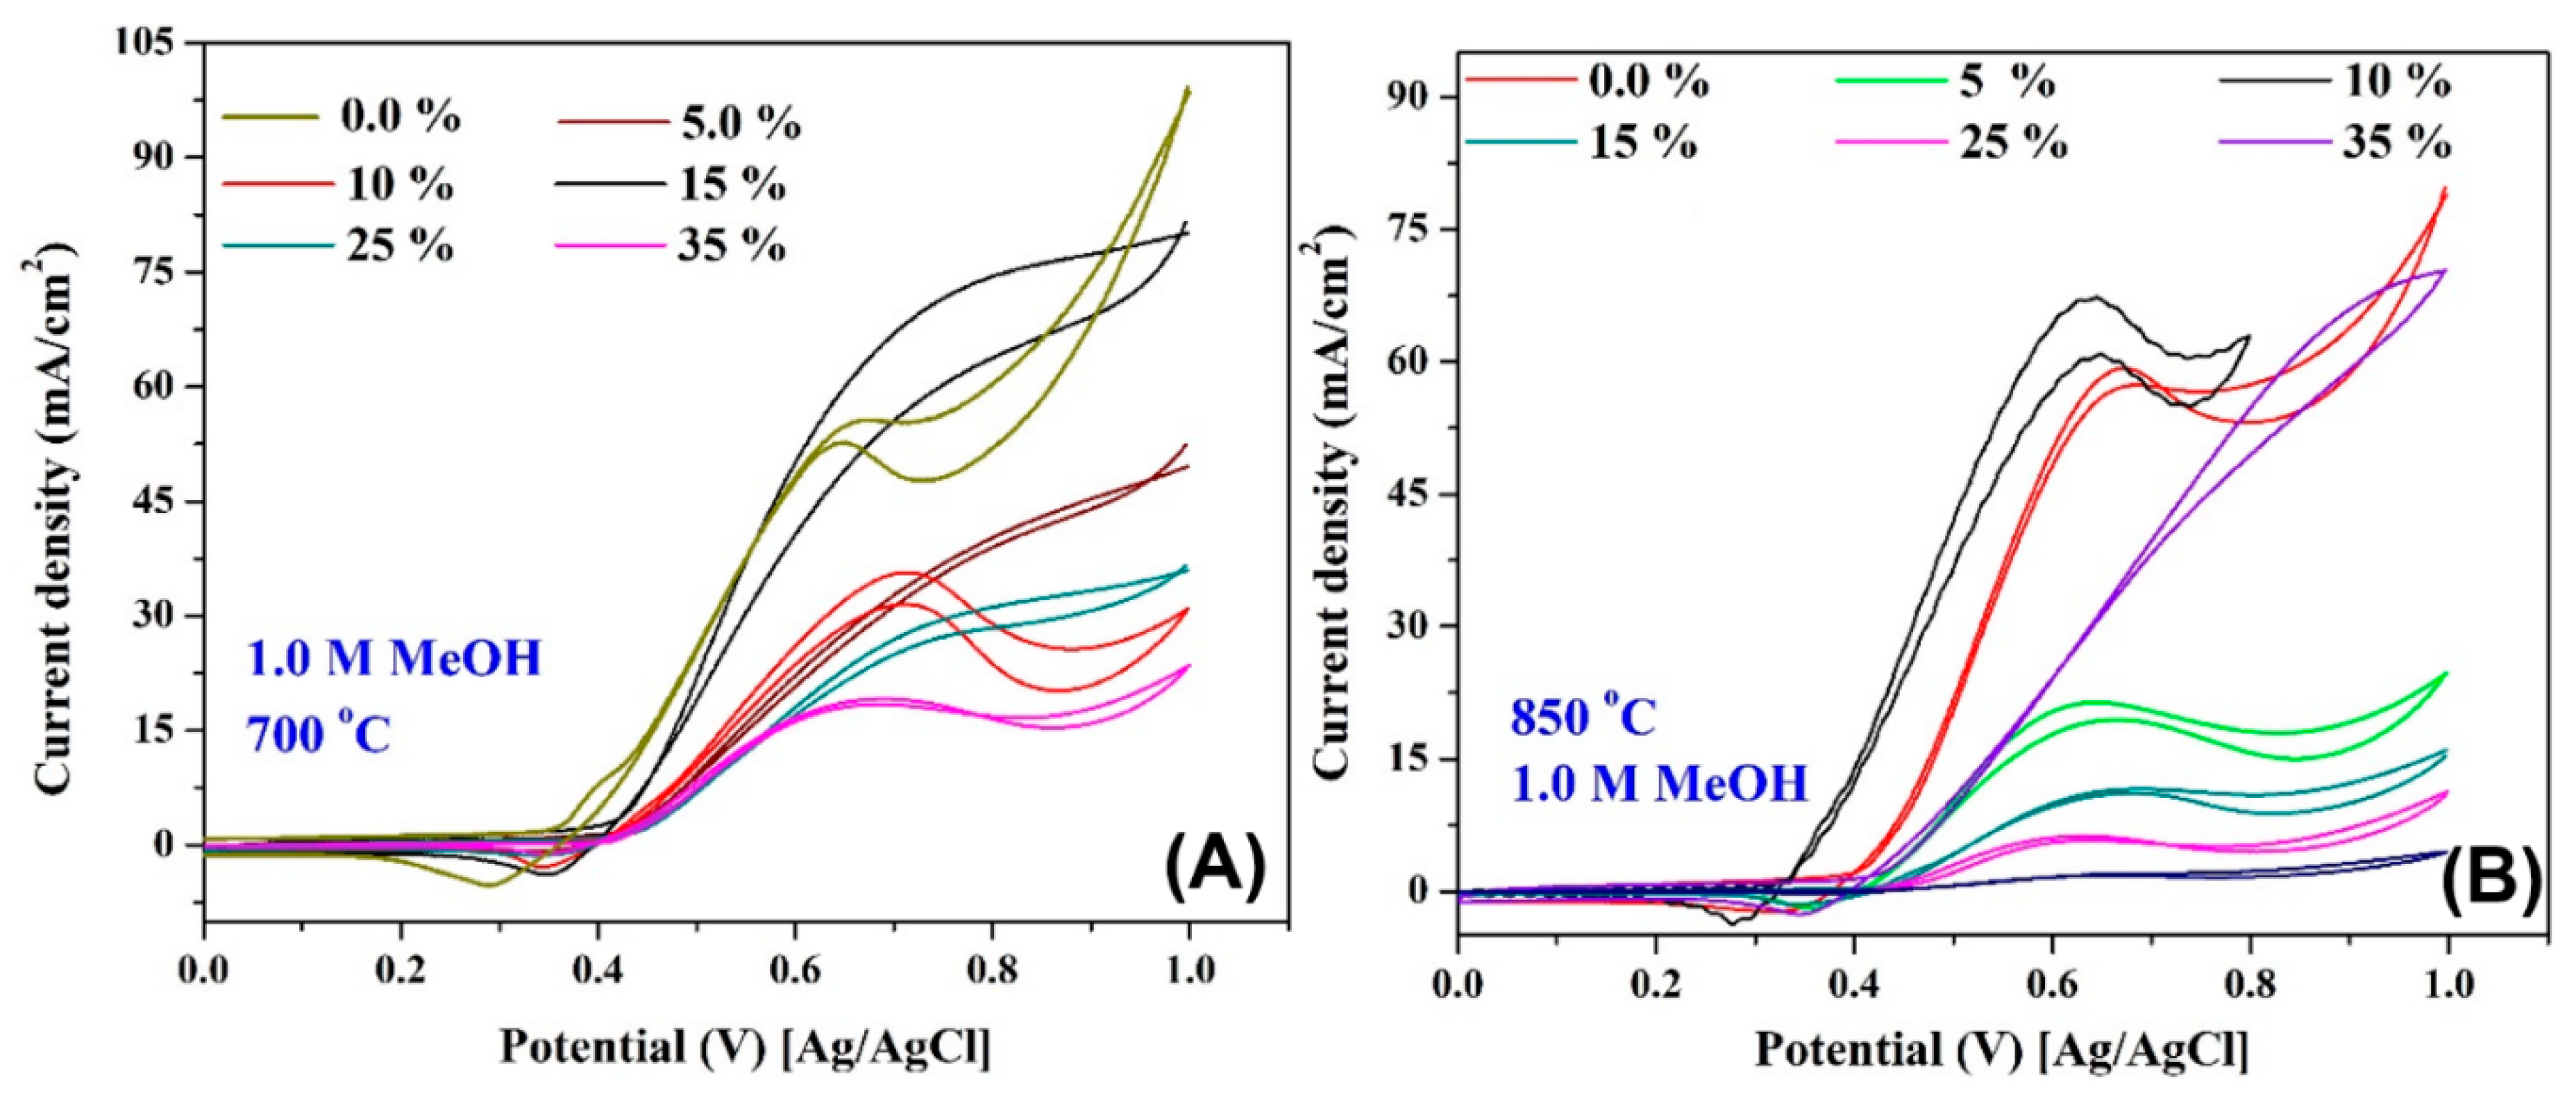
2.2. Electrochemical Performance
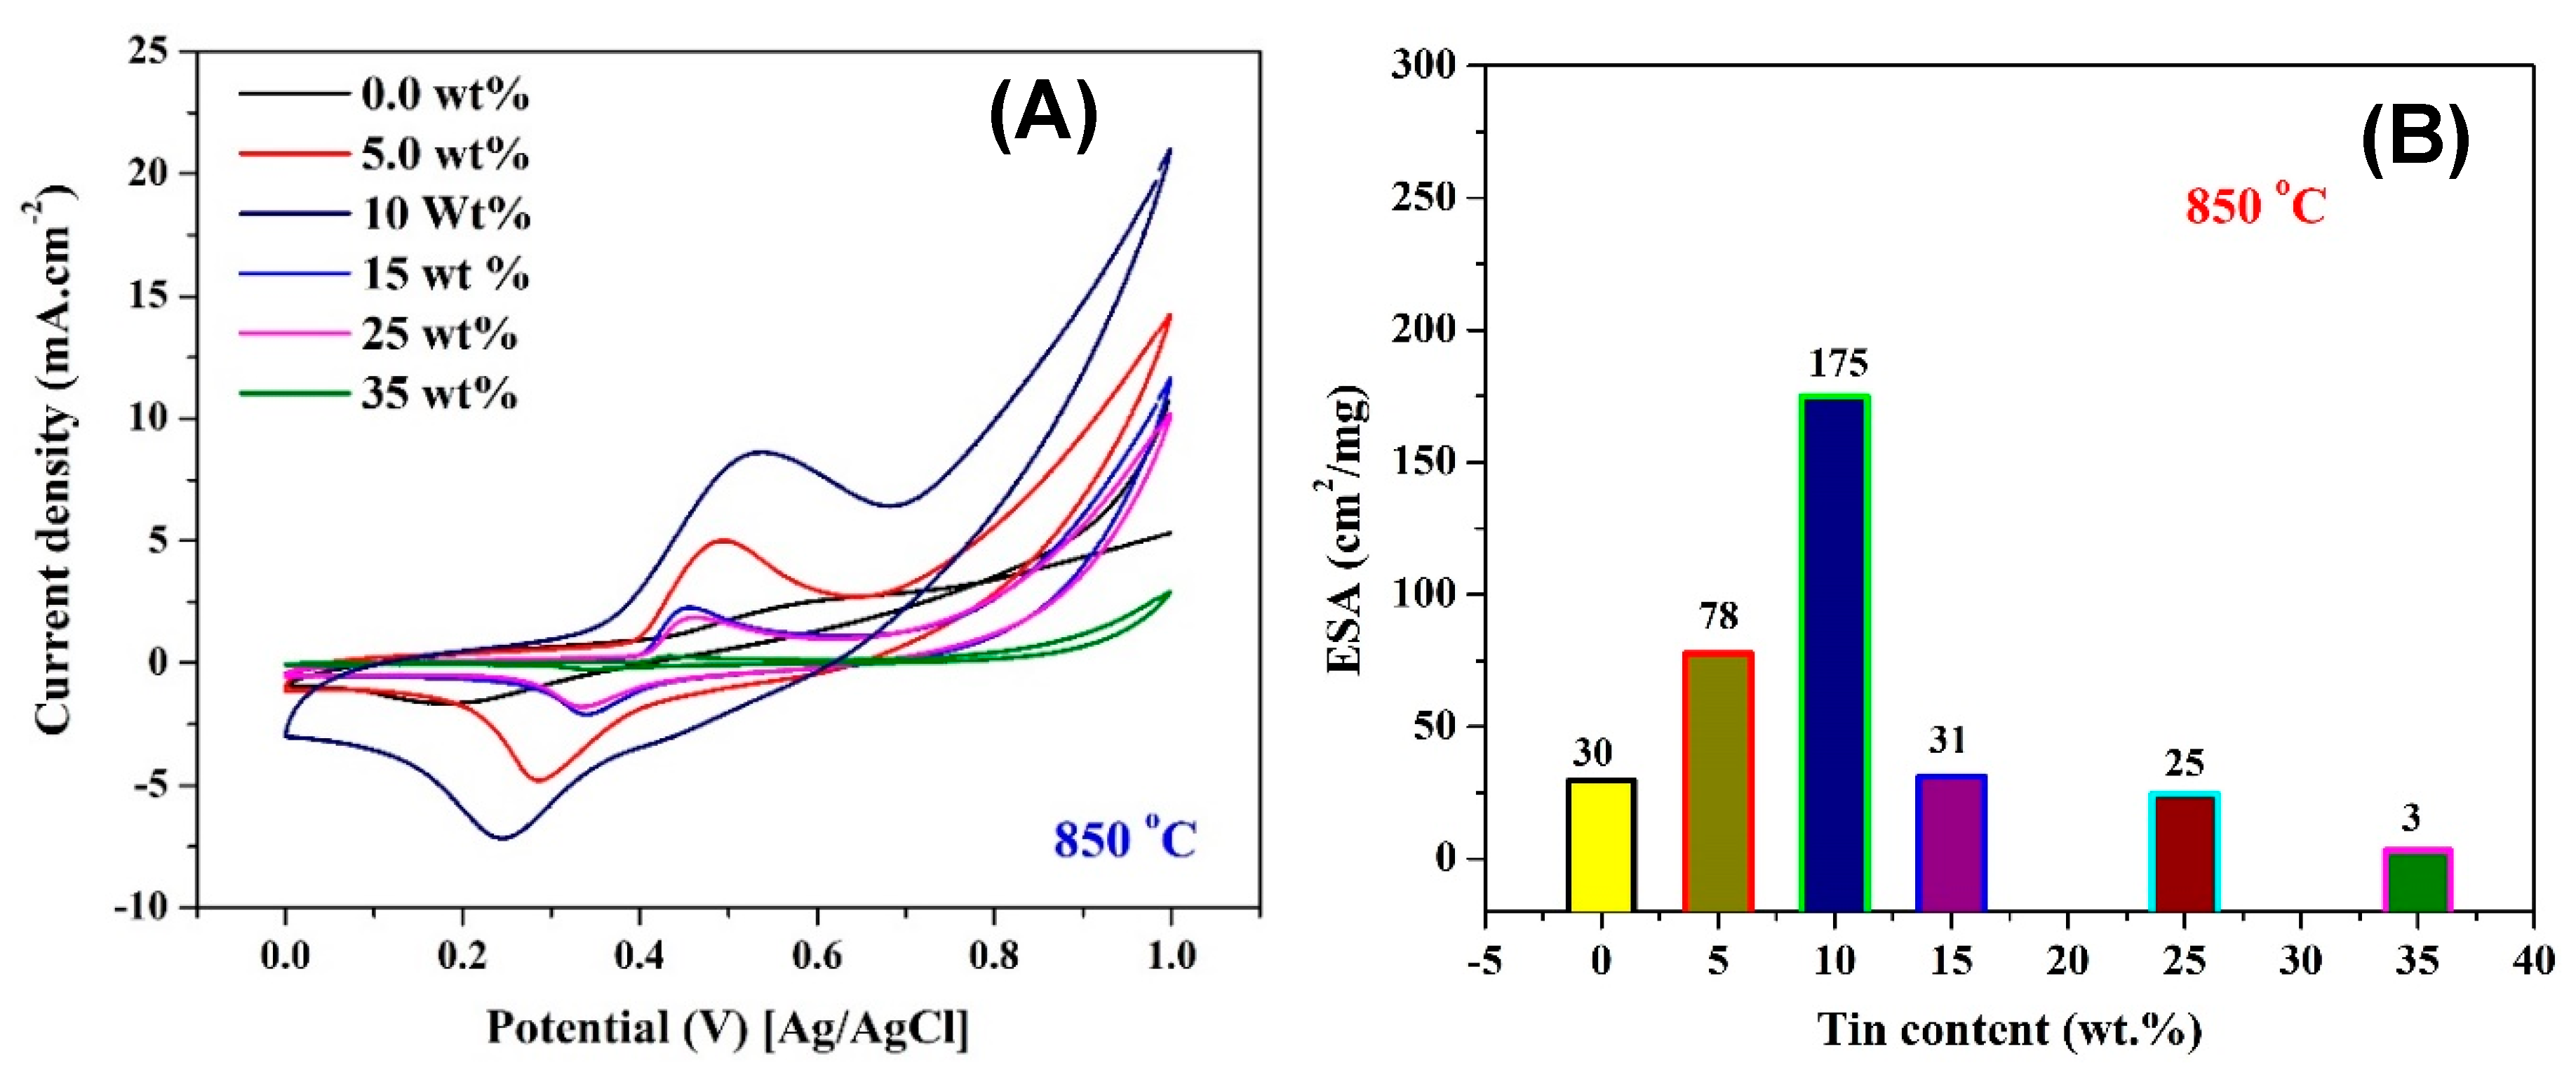
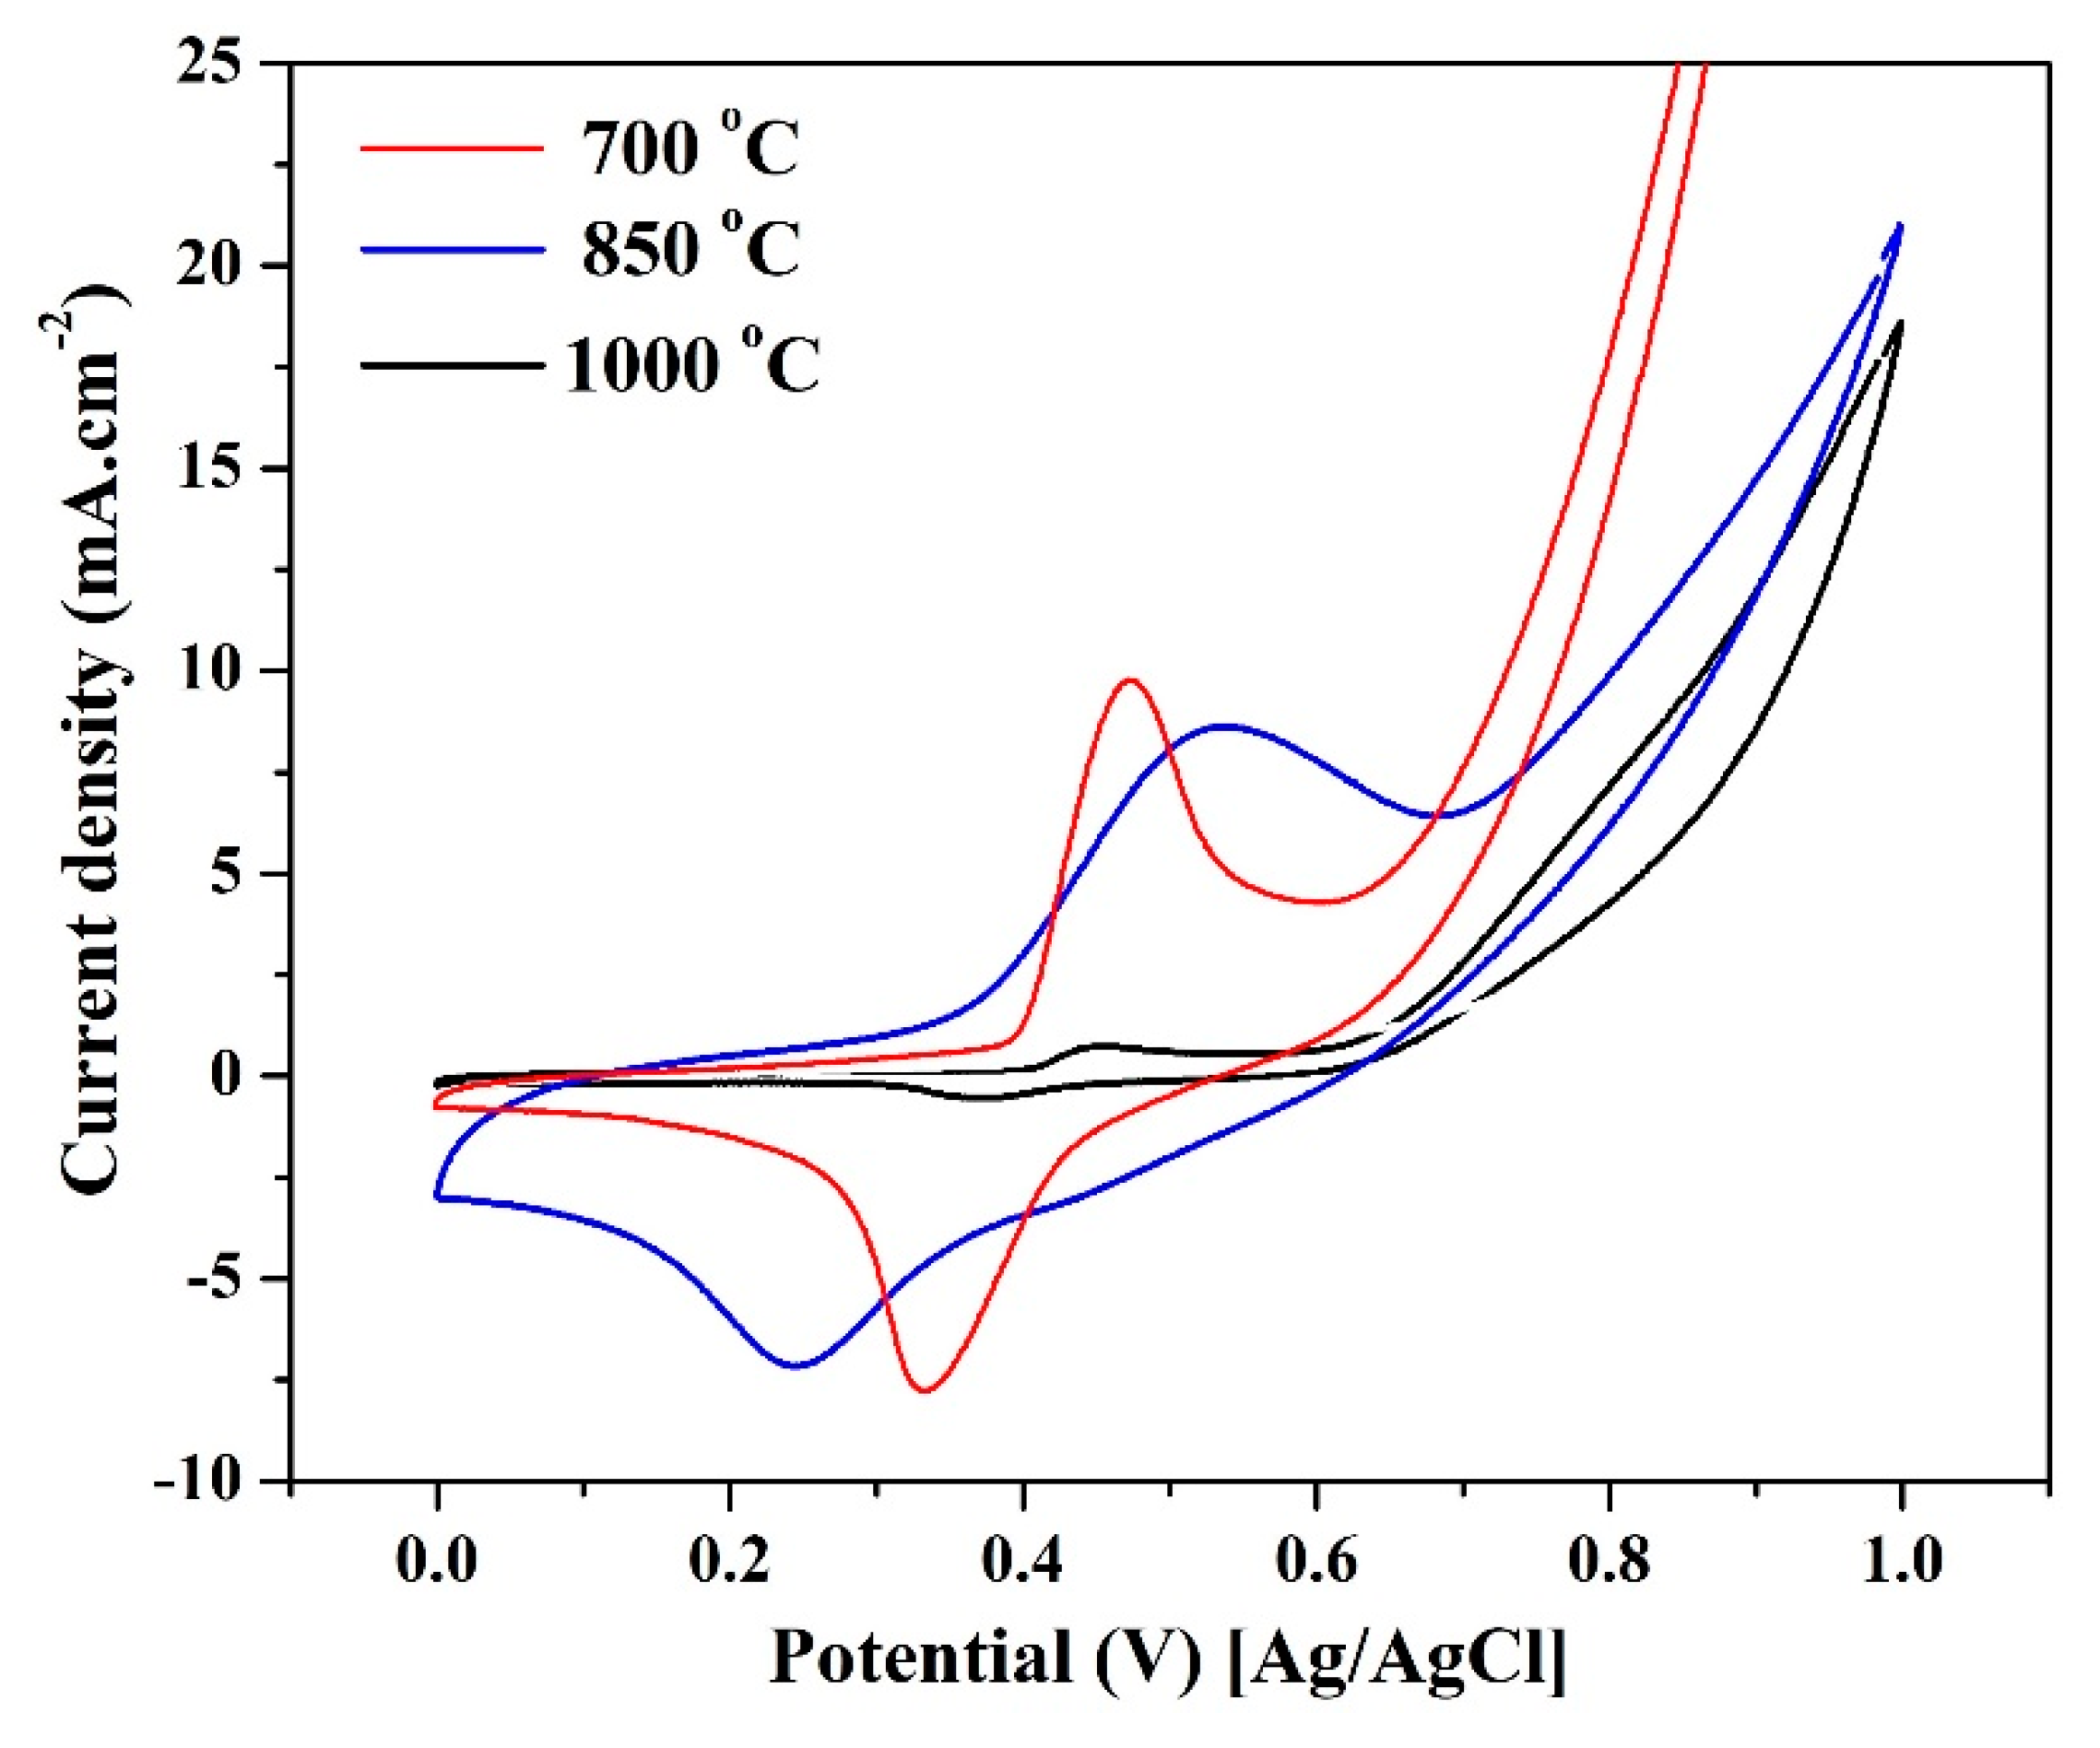
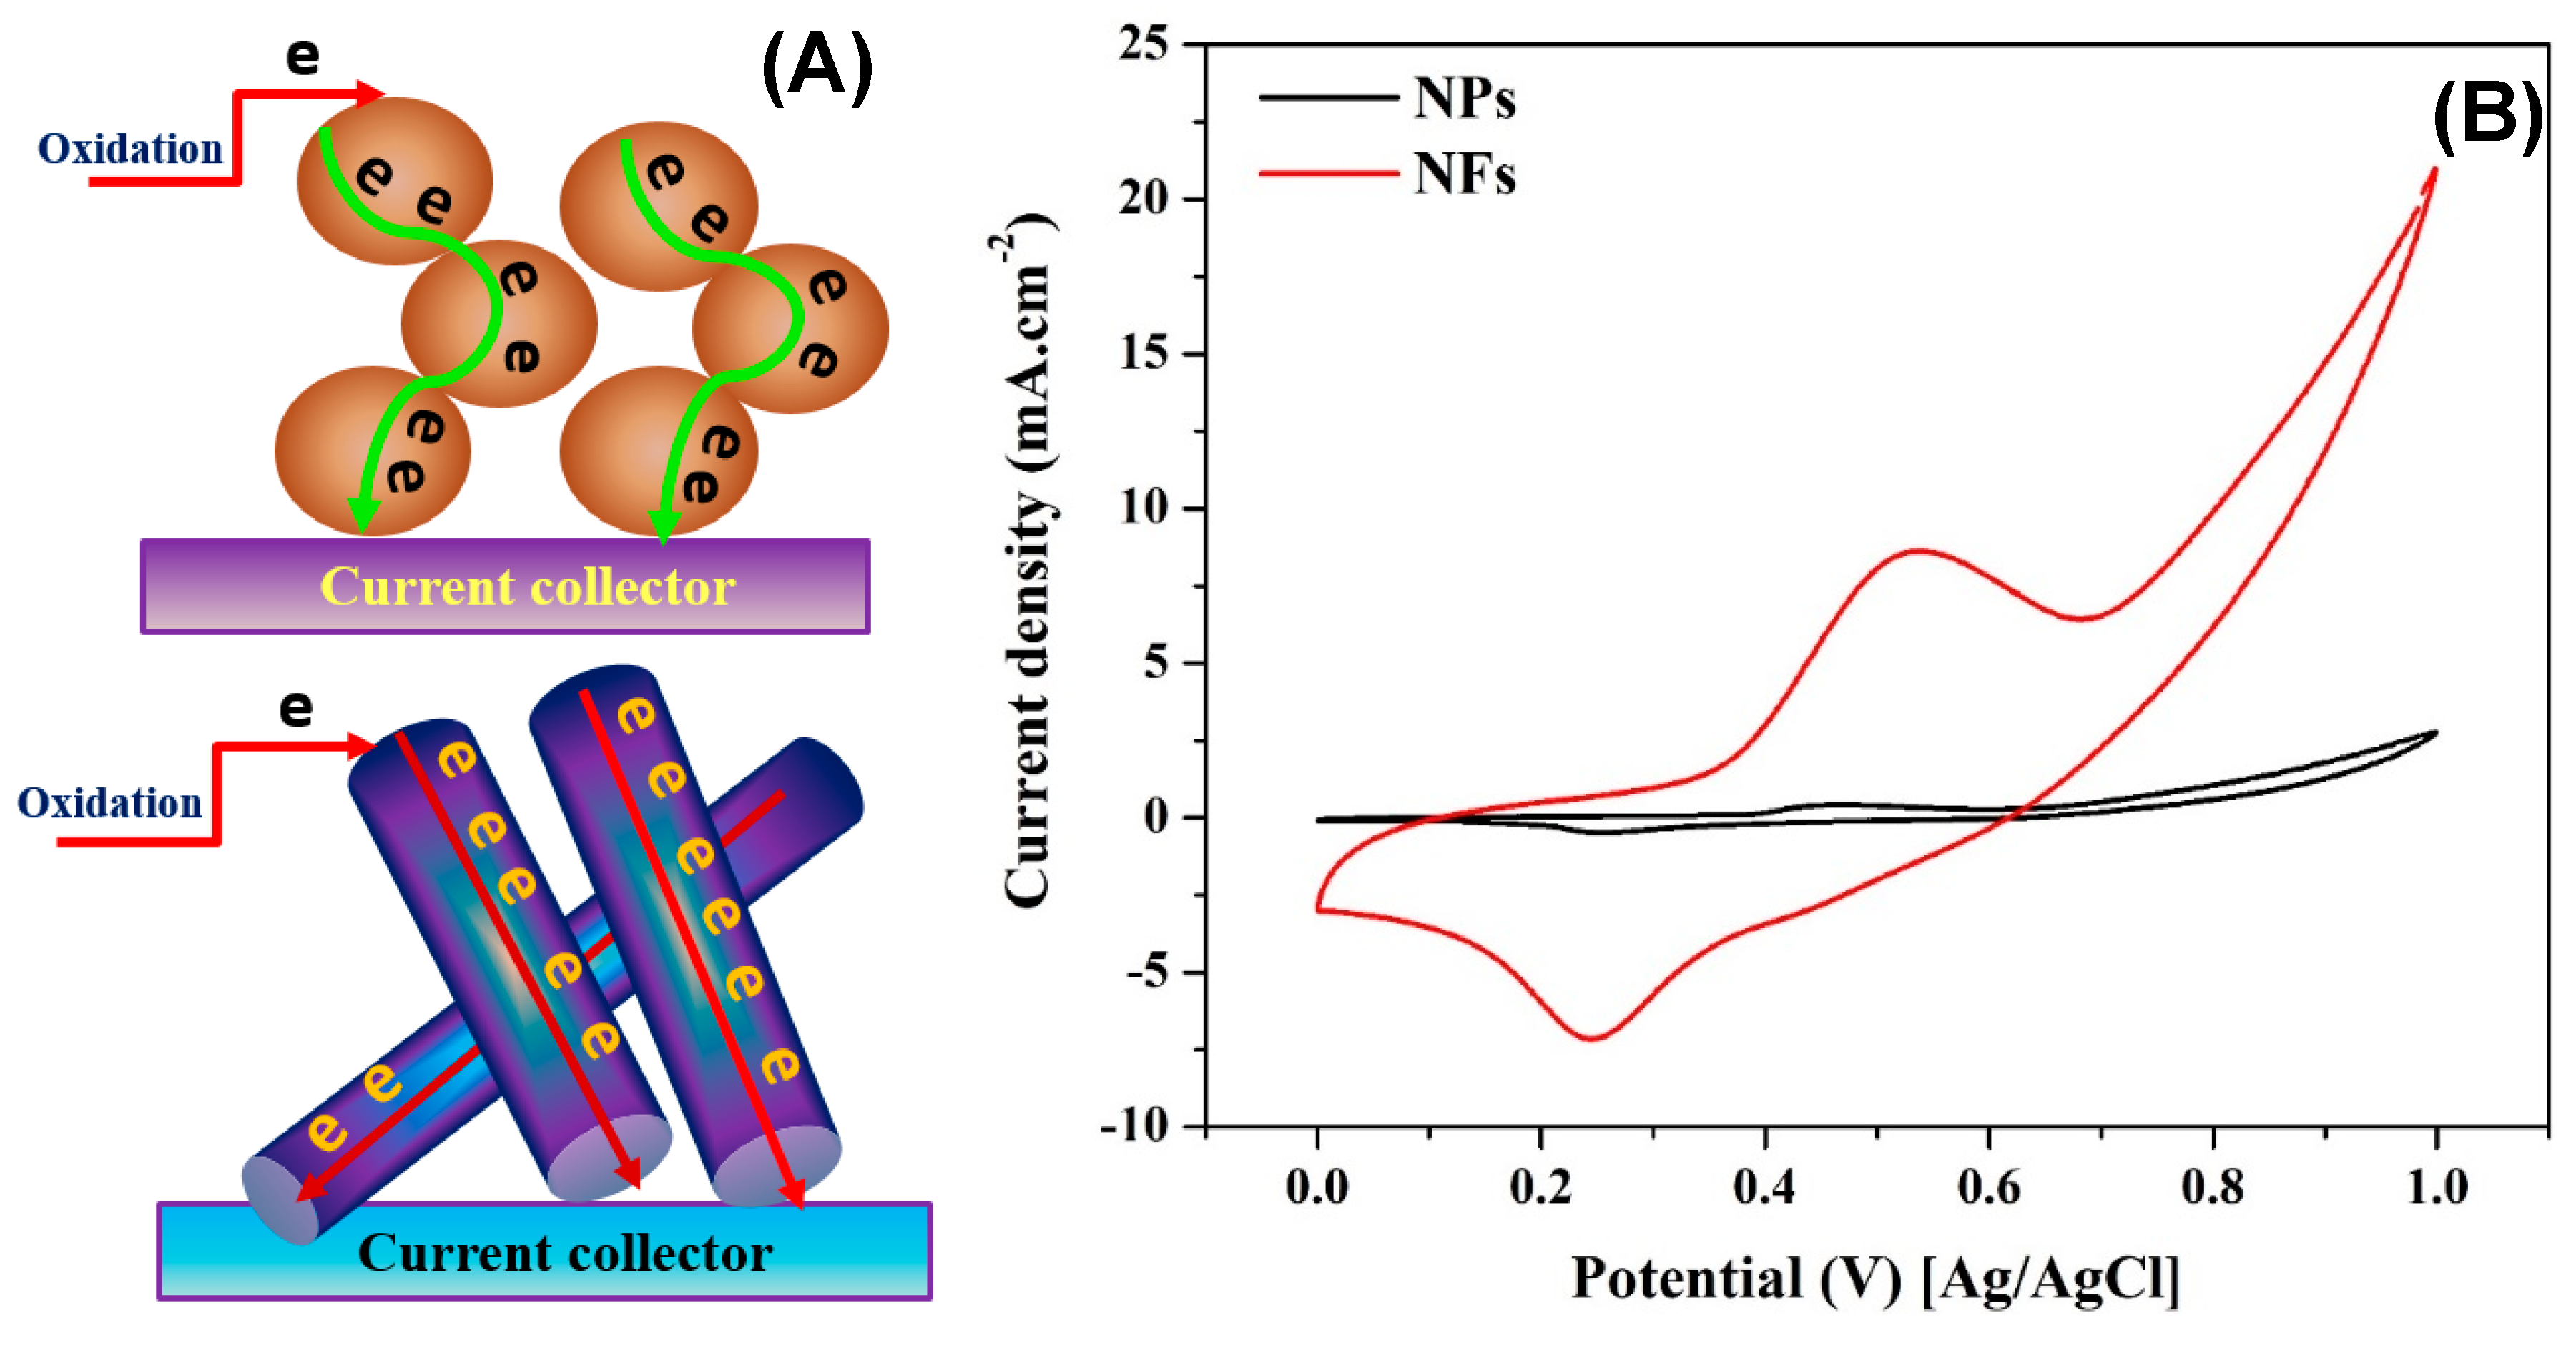
ESA Investigation

Activation of the nickel-based electrodes can be carried in situ or in vivo. In other words, the electrode can be preliminarily activated by sweeping in a strong alkaline solution before use, or simultaneously during the electrooxidation process [23]. The activation denotes formation of ESA from the NiOOH active compound. During the activation, usually two regions are observed; the first one is seen in the negative potential region (at ~ −650 mV) due to formation of nickel hydroxide as follows [57]:
Ni + 2OH → Ni(OH)2 + 2e
The corresponding peak is usually very small in the first cycle and disappears in the subsequent ones [57,58,59]. The second transformation is done in the positive potential side associated with appearance of a strong peak related to the oxidation of Ni(OH)2 to NiOOH according to the following reaction [59,60,61]:
Ni(OH)2 + OH → NiOOH + H2O + e
Increasing the number of sweeping cycles leads to a progressive increase of the current density values of the cathodic peak due to the entry of OH into the Ni(OH)2 surface layer, which results in a progressive formation of a thicker NiOOH layer [57].
Figure 5A demonstrates the cyclic voltammograms for nanofibers with different tin contents and that were calcined at 700 °C. As shown, the Ni(OH)2/NiOOH transformation peaks are clearly observed for all formulations. The ESA can be calculated from the obtained graphs according to the following equation [62,63,64]
E S A = Q m q
where Q is the charge required to reduce NiOOH to Ni(OH)2, m is the loading amount of the catalysts, and q is the charge associated with the formation of a monolayer from Ni(OH)2. As only one electron is needed to perform NiOOH to Ni(OH)2 transformation, the value of q can be used as 257 µC/cm2 [65,66]. Q can be determined from the area of the cathodic peak. Figure 5B displays the influence of Sn content on the ESA of the prepared nanofibers. From the results, it can be concluded that if Sn content was optimized, a distinct enhancement in the ESA can be performed. As shown, ESA of the nanofibers prepared from a solution containing 15 wt % tin precursor increased to 5 times higher than the Sn-free nanofibers; the estimated ESAs were 275 and 53 cm2/mg for the two formulations, respectively. There are also other compositions of the nanofibers that reveal high ESA compared to the un-doped Ni/C ones. Typically, the ESAs created on the surface of nanofibers containing 10 and 25 wt % Sn are 110.2 and 87.7 cm2/mg, which is 2 and 1.5 times higher than the Ni/C nanofibers, respectively. Other formulations (5 and 35 wt % Sn) reveal lower activity. This finding indicates that the alloy composition strongly affects the ESA formation on the surface of the electrocatalyst due to the change in the electronic composition.
Increasing the synthesis temperature to 850 °C leads to a considerable change in the obtained results, as shown in Figure 6. As can be observed, the optimum tin content is 10 wt %. At this composition, the ESA is almost 6 times more compared to Sn-free Ni/C nanofibers, at 175 and 30 cm2/mg, respectively. Also, the nanofibers with 5 wt % Sn which displayed a low performance when they were synthesized at 700 °C, while at 850 °C these nanofibers became the second best among the investigated samples. Excluding the nanofibers containing the maximum Sn content, the remaining nanofibers showed a close ESA. Consequently, the synthesis temperature has an important impact on the ESA formation on the surface of the investigated nanofibers.
To properly investigate the influence of the synthesis temperature, Figure 7 shows a comparison between three synthesis temperatures for nanofibers containing 10 wt % Sn. As can be concluded from the figure, further increase in the synthesis temperature (to 1000 °C) does have a negative influence on the area of the cathodic peak and consequently on the ESA. Numerically, the determined ESA formed on the surface of the nanofibers prepared at 700, 850, and 1000 °C is 110, 175, and 25 cm2/mg, respectively. Paradoxically, the sample with 15 wt % co-catalyst reveals very high ESA when synthesized at 700 °C compared to 850 °C (Figure 5A and Figure 6A). However, all the samples synthesized at 1000 °C revealed very low ESA values compared to the other two temperatures; data are not shown. Accordingly, it can be concluded that the optimum synthesis temperature is either 700 or 850 °C according to the nanofiber composition. Another important finding that can be observed from these results is the shift of the cathodic peak to the negative potential direction in the case of the nanofibers containing 10 wt % Sn and synthesized at 850 °C. This shift leads to a distinct decrease in the onset potentials of the electrooxidation process.
Electron transfer resistance is a very important parameter affecting the electrocatalyst performance. Accordingly, the catalyst morphology can have a considerable impact. Beside the Ohm resistance of the electrocatalyst, the electron faces another kind of resistance to transfer through the catalyst layer; the interfacial resistance. Therefore, the axial ratio is an important characteristic. In other words, the long axial ratio nano-morphology is the low interfacial resistance. In detail, in the case of the spherical nanoparticles, there are numerous contact points with very small contact areas, which creates a high interfacial resistance. On the other hand, in the case of the nanofibrous morphology, the long axial ratio leads to formulation of direct channels to the current collector, which strongly decreases the interfacial resistance. Figure 8A displays a schematic illustration for the electron that passes through the nanoparticles and the nanofibers. The average diameter of the fabricated nanoparticles was ~235 nm, while the composition was almost similar to the corresponding nanofibers. As shown, in the case of the nanoparticles, the electron has to pass through several contact points in a zigzag pass, which means high interfacial resistance. On the other hand, the long axial ratio helps to create direct passes for the electrons to reach to the current collector [44]. The aforementioned hypothesis was scientifically proved by synthesis nanoparticles from the same sol-gel used in the electrospinning process and calcined at the same temperature; 10 wt % Sn at 850 °C. As shown in Figure 8B, there is a big difference between the created ESA in the two formulations. Accordingly, it is expected that the nanofibrous morphology will strongly enhance the electrocatalytic activity.
To scientifically prove the influence of the ESA on the electrocatalytic activity of the proposed composites, the performance of the proposed materials toward the electrooxidation of methanol and urea was investigated. Figure 9 displays the electroactivity of the prepared nanofibers at different Sn contents prepared at 700 and 850 °C toward methanol oxidation (1.0 M methanol in 1.0 KOH, scan rate 50 mV/s). As shown in Figure 9A, the nanofibers owing the maximum ESA (15 wt % Sn and prepared at 700 °C) reveal the best activity. Similarly, in the case of the 850 °C calcination temperature, the best performance was associated with the maximum ESA, with the nanofibers containing 10 wt %. However, at the two temperatures, the performance does not follow the ESA order. For instance, for the two temperatures, the second best performance is associated with the Sn-free nanofibers. Moreover, for the remaining Sn-containing nanofibers, the electro-catalytic activity sequence does not follow the ESA order for the two temperatures. This result draws the attention toward an important conclusion, that NiOOH is not the main tool for the methanol oxidation. In other words, as was concluded in our previous study, methanol can be oxidized on the surface of the un-activated nickel electrode with simultaneous formation of NiOOH [23]. Therefore, the current study supports our previous one and introduces a new understanding for methanol oxidation. However, the two studies confirm that the NiOOH-based mechanism is essential but not unique. Beside this new finding, there is another one that can be extracted from Figure 9B. As shown, there is good enhancement in the methanol oxidation onset potential in the case of the nanofibers containing 10 wt % Sn and prepared at 850 °C. It is important to link with the negative shift observed during the activation of these nanofibers (Figure 6A). In more detail, the formation potential of the NiOOH affects the methanol oxidation onset potential. This finding is very important from an application point of view. Decreasing the onset potential is highly preferable in the case of production of hydrogen from methanol using the electrolysis process because it results in decreasing the required power.
Figure 10 displays the influence of Sn content on the electrocatalytic activity of the proposed nanofibers toward urea oxidation; 1.0 M urea in 1.0 M KOH, scan rate 50 mV/s. As seen in the figure, for the two synthesis temperatures, Sn incorporation distinctly improves the electrocatalytic activity. In contrast to methanol oxidation, Sn-free Ni/C nanofibers reveal low electrocatalytic activity toward urea oxidation. Another important piece of information that can be gained from the figure is that the electrocatalytic activity almost follows the ESA sequence in the prepared nanofibers, which indicates that the urea oxidation mainly depends on the amount of the formed NiOOH molecules on the surface of the electrocatalyst. This result also supports the proposed urea oxidation mechanism, confirming the dependence on the NiOOH species [17,62]. Similar to methanol, the nanofibers containing 10 wt % Sn and prepared at 850 °C show very low onset potential for urea oxidation compared to the other formulations, as seen in Figure 10B. Numerically, the corresponding onset potential decreased to 195 mV (vs. Ag/AgCl), while all other formulations prepared at the same temperature (850 °C) have an onset potential of ~ 410 mV. This finding is interesting because it indicates the possibility of exploiting these nanofibers as an anode material in the direct urea fuel cells. Table 2 summarizes the onset potentials of urea and methanol oxidation at the surface of the proposed nanofibers.
According to the XRD results, the interesting small onset-potential obtained with the 10 wt % sample synthesized at 850 °C, especially in urea oxidation, can be attributed to the formation of only Ni3Sn2 alloy with some free non-crystalline nickel (Table 1). Therefore, it can be claimed that this alloy structure possesses higher electrocatalytic activity toward urea oxidation compared to the Ni3Sn one.
Figure 11 and Figure 12 display the influence of the calcination temperature and the nano-morphology on the electrocatalytic activity of the proposed nanocomposites toward methanol and urea oxidation, respectively. As shown in Figure 11A, which displays the influence of the synthesis temperature on the electrocatalytic activity of the nanofibers containing 10 wt % Sn toward methanol, the optimum temperature is 850 °C, and increasing the temperature does have a negative impact on the activity. Moreover, the performance follows the ESA sequence. In the same fashion, as shown in Figure 11B, the electrocatalytic activity toward urea oxidation depends on the formed NiOOH active layer (ESA) on the surface of the investigated nanofibers.
Figure 12 displays a good translation for the results obtained in Figure 8 (influence of the nano-morphology on the ESA), and simultaneously supports the aforementioned hypothesis about the role of the axial ratio in enhancing the electron transfer process. As shown in the figure, for both methanol and urea, the nanofibrous morphology provides an advantage for the investigated electrocatalyst in enhancing the electrocatalytic activity toward oxidation of methanol (Figure 12A) and urea (Figure 12B).

3. Materials and Methods

3.1. Preparation of the Nanofibers and Nanoparticles

Sn-incorporated Ni/C nanofibers were prepared by dissolving (1 g) of nickel (II) acetate tetrahydrate (NiAc, 98%, Aldrich Co., Milwaukee, WI, USA) in 4 mL of de-ionized water that is mixed with 15 g of 10 wt % aqueous polymer solution of poly(vinyl alcohol) (PVA, MW = 65,000 g/mol, DC Chemical Co., Seoul, Korea). The mixture is stirred for several hours at 50 °C. Later on, specific amounts of tin chloride (SnCl2; Aldrich Co., Milwaukee, WI, USA) were dissolved in the minimum amount of de-ionized water and mixed with the prepared NiAc/PVA solution. To study the influence of Sn content, solutions having 0, 5, 10, 15, 25, and 35 wt % of SnCl2 compared to NiAc were prepared. For instance, a 10 wt % sample means the tin chloride was 10%, while the nickel acetate was 90 wt %. The electrospinning process was carried out at 20 kV at room conditions and at a 15 cm distance between the syringe and the rotating drum collector. After vacuum drying of the electrospun mats, the calcination process was carried out under vacuum atmosphere at different temperatures (700, 850, and 1000 °C) for 5 h. The nanoparticles were synthesized by drying sol-gels prepared by the aforementioned procedure under a vacuum for 24 h at 80 °C. Then, the solids were crushed and ground carefully into fine particles before being subjected to the calcination process.

3.2. Characterization

The nanofibrous morphology was confirmed by using scanning electron microscopy (SEM and FESEM, Hitachi S-7400, Tokyo, Japan). The chemical composition of the prepared nanostructures was studied by X-ray diffraction (XRD, Rigaku, Tokyo, Japan). Thermal properties have been studied by a thermal gravimetric analyzer (TGA, Pyris1, PerkinElmer Inc., Hopkinton, MA, USA). The electrochemical measurements were carried out using potentiostat (VersaStat 4, Princeton Applied Research. Co., Oak Ridge, TN, USA). A three electrode cell structure composed of glass carbon electrode (GCE) as the working electrode, Ag/AgCl as the reference electrode, and Pt wire as the counter electrode (CE) was utilized. WE was prepared by depositing 15 µL of catalyst ink onto the active surface of the GCE. The catalyst ink was prepared by well dispersion of the functional material in a mixture of Nafion solution and isopropanol followed by drying at 80 °C for 30 min.

4. Conclusions

Sn-incorporated Ni/C nanofibers can be produced by the electrospinning process. Due to the polycondensation characteristic of the main metal precursor (nickel acetate), well maintaining of the nanofibrous morphology during the calcination process can be achieved; accordingly, good morphology nanofibers are obtained. Addition of the proposed co-catalyst distinctly affects formation of the active NiOOH compound on the surface of the proposed electrocatalyst. However, the tin percentage should be optimized to maximize the electroactive surface area (ESA). Beside the composition, the synthesis temperature does have an important impact on the ESA. Typically, 700 and 850 °C calcination temperatures can be invoked based on the nanofiber composition. Due to the large axial ratio, which strongly assists the electron transfer process, the nanofibrous morphology distinctly maximizes ESA during the activation process. Although the electrocatalytic activity for the investigated nanofibers toward methanol oxidation does not exactly follow the ESA sequence, improving the ESA leads to a considerable decrease in the onset potential. On the other hand, the electrocatalytic activity toward urea oxidation is proportionate to the ESA, so the highest current density and lowest onset potential correspond to the nanofibers covered by the maximum ESA. Lastly, it is highly recommended to formulate the electrocatalysts in the nanofibrous morphology to gain the advantage of the large axial ratio, which distinctly improves the electocatalytic activity toward urea and methanol.

Author Contributions

N.A.M.B. planned the experimental work, wrote the manuscript, helped in the analysis, explained the results, and manipulated the data results. M.A.A. helped in the experimental work and writing of the manuscript. E.A.M.A. helped with the writing of the manuscript.

Funding

This research received no external funding.

Conflicts of Interest

The authors declare no conflict of interest.

References

  1. Badwal, S.; Giddey, S.; Munnings, C.; Kulkarni, A. Review of progress in high temperature solid oxide fuel cells. ChemInform 2015, 46. [Google Scholar] [CrossRef]
  2. Stambouli, A.B. Fuel cells: The expectations for an environmental-friendly and sustainable source of energy. Renew. Sustain. Energy Rev. 2011, 15, 4507–4520. [Google Scholar] [CrossRef]
  3. Levin, D.B.; Pitt, L.; Love, M. Biohydrogen production: Prospects and limitations to practical application. Int. J. Hydrog. Energy 2004, 29, 173–185. [Google Scholar] [CrossRef]
  4. Han, S.-K.; Shin, H.-S. Biohydrogen production by anaerobic fermentation of food waste. Int. J. Hydrog. Energy 2004, 29, 569–577. [Google Scholar] [CrossRef]
  5. Zeng, K.; Zhang, D. Recent progress in alkaline water electrolysis for hydrogen production and applications. Prog. Energy Combust. Sci. 2010, 36, 307–326. [Google Scholar] [CrossRef]
  6. Ni, M.; Leung, M.K.; Leung, D.Y.; Sumathy, K. A review and recent developments in photocatalytic water-splitting using TiO2 for hydrogen production. Renew. Sustain. Energy Rev. 2007, 11, 401–425. [Google Scholar] [CrossRef]
  7. Grochala, W.; Edwards, P.P. Thermal decomposition of the non-interstitial hydrides for the storage and production of hydrogen. Chem. Rev. 2004, 104, 1283–1316. [Google Scholar] [CrossRef] [PubMed]
  8. Barakat, N.A.; Abdelkareem, M.A.; Yousef, A.; Al-Deyab, S.S.; El-Newehy, M.; Kim, H.Y. Cadmium-doped cobalt/carbon nanoparticles as novel nonprecious electrocatalyst for methanol oxidation. Int. J. Hydrog. Energy 2013, 38, 3387–3394. [Google Scholar] [CrossRef]
  9. Barakat, N.A.; El-Newehy, M.H.; Yasin, A.S.; Ghouri, Z.K.; Al-Deyab, S.S. Ni&Mn nanoparticles-decorated carbon nanofibers as effective electrocatalyst for urea oxidation. Appl. Catal. A Gen. 2016, 510, 180–188. [Google Scholar]
  10. Barakat, N.A.; Motlak, M.; Elzatahry, A.A.; Khalil, K.A.; Abdelghani, E.A. NixCo1 − x alloy nanoparticle-doped carbon nanofibers as effective non-precious catalyst for ethanol oxidation. Int. J. Hydrog. Energy 2014, 39, 305–316. [Google Scholar] [CrossRef]
  11. Demirbas, A. Biomethanol production from organic waste materials. Energy Sources Part A 2008, 30, 565–572. [Google Scholar] [CrossRef]
  12. Amigun, B.; Gorgens, J.; Knoetze, H. Biomethanol production from gasification of non-woody plant in South Africa: Optimum scale and economic performance. Energy Policy 2010, 38, 312–322. [Google Scholar] [CrossRef]
  13. Shamsul, N.; Kamarudin, S.K.; Rahman, N.A.; Kofli, N.T. An overview on the production of bio-methanol as potential renewable energy. Renew. Sustain. Energy Rev. 2014, 33, 578–588. [Google Scholar] [CrossRef]
  14. Hosseini, M.G.; Momeni, M.M. UV-cleaning properties of Pt nanoparticle-decorated titania nanotubes in the electro-oxidation of methanol: An anti-poisoning and refreshable electrode. Electrochim. Acta 2012, 70, 1–9. [Google Scholar] [CrossRef]
  15. Mehmood, A.; Scibioh, M.A.; Prabhuram, J.; An, M.-G.; Ha, H.Y. A review on durability issues and restoration techniques in long-term operations of direct methanol fuel cells. J. Power Sources 2015, 297, 224–241. [Google Scholar] [CrossRef]
  16. Abdelkareem, M.A.; Allagui, A.; Tsujiguchi, T.; Nakagawa, N. Effect of the Ratio Carbon Nanofiber/Carbon Black in the Anodic Microporous Layer on the Performance of Passive Direct Methanol Fuel Cell. J. Electrochem. Soc. 2016, 163, F1011–F1016. [Google Scholar] [CrossRef]
  17. Yan, W.; Wang, D.; Botte, G.G. Nickel and cobalt bimetallic hydroxide catalysts for urea electro-oxidation. Electrochim. Acta 2012, 61, 25–30. [Google Scholar] [CrossRef]
  18. King, R.L.; Botte, G.G. Investigation of multi-metal catalysts for stable hydrogen production via urea electrolysis. J. Power Sources 2011, 196, 9579–9584. [Google Scholar] [CrossRef]
  19. Wang, D.; Yan, W.; Vijapur, S.H.; Botte, G.G. Electrochemically reduced graphene oxide–nickel nanocomposites for urea electrolysis. Electrochim. Acta 2013, 89, 732–736. [Google Scholar] [CrossRef]
  20. Barakat, N.A.; Amen, M.T.; Al-Mubaddel, F.S.; Karim, M.R.; Alrashed, M. NiSn nanoparticle-incorporated carbon nanofibers as efficient electrocatalysts for urea oxidation and working anodes in direct urea fuel cells. J. Adv. Res. 2019, 16, 43–53. [Google Scholar] [CrossRef]
  21. Ferdowsi, G.S. Ni nanoparticle modified graphite electrode for methanol electrocatalytic oxidation in alkaline media. J. Nanostruct. Chem. 2015, 5, 17–23. [Google Scholar] [CrossRef]
  22. Das, S.; Dutta, K.; Kundu, P.P. Nickel nanocatalysts supported on sulfonated polyaniline: Potential toward methanol oxidation and as anode materials for DMFCs. J. Mater. Chem. A 2015, 3, 11349–11357. [Google Scholar] [CrossRef]
  23. Barakat, N.A.; Yassin, M.A.; Al-Mubaddel, F.S.; Amen, M.T. New electrooxidation characteristic for Ni-based electrodes for wide application in methanol fuel cells. Appl. Catal. A Gen. 2018, 555, 148–154. [Google Scholar] [CrossRef]
  24. Pyun, S.-I.; Kim, K.-H.; Han, J.-N. Analysis of stresses generated during hydrogen extraction from and injection into Ni(OH)2/NiOOH film electrode. J. Power Sources 2000, 91, 92–98. [Google Scholar] [CrossRef]
  25. Klaus, S.; Cai, Y.; Louie, M.W.; Trotochaud, L.; Bell, A.T. Effects of Fe electrolyte impurities on Ni(OH)2/NiOOH structure and oxygen evolution activity. J. Phys. Chem. C 2015, 119, 7243–7254. [Google Scholar] [CrossRef]
  26. Guo, F.; Ye, K.; Cheng, K.; Wang, G.; Cao, D. Preparation of nickel nanowire arrays electrode for urea electro-oxidation in alkaline medium. J. Power Sources 2015, 278, 562–568. [Google Scholar] [CrossRef]
  27. Ye, K.; Zhang, D.; Guo, F.; Cheng, K.; Wang, G.; Cao, D. Highly porous nickel@ carbon sponge as a novel type of three-dimensional anode with low cost for high catalytic performance of urea electro-oxidation in alkaline medium. J. Power Sources 2015, 283, 408–415. [Google Scholar] [CrossRef]
  28. Barakat, N.A.M.; Moustafa, H.M.; Nassar, M.M.; Abdelkareem, M.A.; Mahmoud, M.S.; Almajid, A.A.; Khalil, K.A. Distinct influence for carbon nano-morphology on the activity and optimum metal loading of Ni/C composite used for ethanol oxidation. Electrochim. Acta 2015, 182, 143–155. [Google Scholar] [CrossRef]
  29. Zhu, H.; Wang, J.; Liu, X.; Zhu, X. Three-dimensional porous graphene supported Ni nanoparticles with enhanced catalytic performance for Methanol electrooxidation. Int. J. Hydrog. Energy 2017, 42, 11206–11214. [Google Scholar] [CrossRef]
  30. Danaee, I.; Jafarian, M.; Mirzapoor, A.; Gobal, F.; Mahjani, M.G. Electrooxidation of methanol on NiMn alloy modified graphite electrode. Electrochim. Acta 2010, 55, 2093–2100. [Google Scholar] [CrossRef]
  31. Deng, Z.; Yi, Q.; Zhang, Y.; Nie, H. NiCo/C-N/CNT composite catalysts for electro-catalytic oxidation of methanol and ethanol. J. Electroanal. Chem. 2017, 803, 95–103. [Google Scholar] [CrossRef]
  32. Tarrús, X.; Montiel, M.; Vallés, E.; Gómez, E. Electrocatalytic oxidation of methanol on CoNi electrodeposited materials. Int. J. Hydrog. Energy 2014, 39, 6705–6713. [Google Scholar] [CrossRef]
  33. Gu, Y.; Luo, J.; Liu, Y.; Yang, H.; Ouyang, R.; Miao, Y. Synthesis of Bimetallic Ni–Cr Nano-Oxides as Catalysts for Methanol Oxidation in NaOH Solution. J. Nanosci. Nanotechnol. 2015, 15, 3743–3749. [Google Scholar] [CrossRef]
  34. Wu, D.; Zhang, W.; Cheng, D. Facile Synthesis of Cu/NiCu Electrocatalysts Integrating Alloy, Core–Shell, and One-Dimensional Structures for Efficient Methanol Oxidation Reaction. ACS Appl. Mater. Interfaces 2017, 9, 19843–19851. [Google Scholar] [CrossRef]
  35. He, H.; Xiao, P.; Zhou, M.; Zhang, Y.; Lou, Q.; Dong, X. Boosting catalytic activity with a p–n junction: Ni/TiO2 nanotube arrays composite catalyst for methanol oxidation. Int. J. Hydrog. Energy 2012, 37, 4967–4973. [Google Scholar] [CrossRef]
  36. Guo, Y.G.; Hu, J.S.; Zhang, H.M.; Liang, H.P.; Wan, L.J.; Bai, C.L. Tin/Platinum Bimetallic Nanotube Array and its Electrocatalytic Activity for Methanol Oxidation. Adv. Mater. 2005, 17, 746–750. [Google Scholar] [CrossRef]
  37. Aricò, A.S.; Antonucci, V.; Giordano, N.; Shukla, A.K.; Ravikumar, M.K.; Roy, A.; Barman, S.R.; Sarma, D.D. Methanol oxidation on carbon-supported platinum-tin electrodes in sulfuric acid. J. Power Sources 1994, 50, 295–309. [Google Scholar] [CrossRef]
  38. Veizaga, N.S.; Rodriguez, V.I.; Rocha, T.A.; Bruno, M.; Scelza, O.A.; de Miguel, S.R.; Gonzalez, E.R. Promoting Effect of Tin in Platinum Electrocatalysts for Direct Methanol Fuel Cells (DMFC). J. Electrochem. Soc. 2015, 162, F243–F249. [Google Scholar] [CrossRef]
  39. Li, X.; Wei, J.; Chai, Y.; Zhang, S. Carbon nanotubes/tin oxide nanocomposite-supported Pt catalysts for methanol electro-oxidation. J. Colloid Interface Sci. 2015, 450, 74–81. [Google Scholar] [CrossRef]
  40. Li, Y.; Liu, C.; Liu, Y.; Feng, B.; Li, L.; Pan, H.; Kellogg, W.; Higgins, D.; Wu, G. Sn-doped TiO2 modified carbon to support Pt anode catalysts for direct methanol fuel cells. J. Power Sources 2015, 286, 354–361. [Google Scholar] [CrossRef]
  41. Yi, Q.F.; Huang, W.; Yu, W.Q.; Li, L.; Liu, X.P. Fabrication of Novel Titanium-supported Ni-Sn Catalysts for Methanol Electro-oxidation. Chin. J. Chem. 2008, 26, 1367–1372. [Google Scholar] [CrossRef]
  42. Barakat, N.A.; Al-Mubaddel, F.S.; Karim, M.R.; Alrashed, M.; Kim, H.Y. Influence of Sn content on the electrocatalytic activity of NiSn alloy nanoparticles-incorporated carbon nanofibers toward methanol oxidation. Int. J. Hydrog. Energy 2018, 43, 21333–21344. [Google Scholar] [CrossRef]
  43. Li, J.; Luo, Z.; Zuo, Y.; Liu, J.; Zhang, T.; Tang, P.; Arbiol, J.; Llorca, J.; Cabot, A. NiSn bimetallic nanoparticles as stable electrocatalysts for methanol oxidation reaction. Appl. Catal. B 2018, 234, 10–18. [Google Scholar] [CrossRef]
  44. Barakat, N.A.; Abdelkareem, M.A.; El-Newehy, M.; Kim, H.Y. Influence of the nanofibrous morphology on the catalytic activity of NiO nanostructures: An effective impact toward methanol electrooxidation. Nanoscale Res. Lett. 2013, 8, 402. [Google Scholar] [CrossRef] [PubMed]
  45. Tao, S.L.; Desai, T.A. Aligned Arrays of Biodegradable Poly(ε-caprolactone) Nanowires and Nanofibers by Template Synthesis. Nano Lett. 2007, 7, 1463–1468. [Google Scholar] [CrossRef]
  46. Chen, S. Self-Assembly of Perylene Imide Molecules into 1D Nanostructures: Methods, Morphologies, and Applications. Chem. Rev. 2015, 115, 11967–11998. [Google Scholar] [CrossRef]
  47. Sehaqui, H.; Mushi, N.E.; Morimune, S.; Salajkova, M.; Nishino, T.; Berglund, L.A. Cellulose Nanofiber Orientation in Nanopaper and Nanocomposites by Cold Drawing. ACS Appl. Mater. Interfaces 2012, 4, 1043–1049. [Google Scholar] [CrossRef] [PubMed]
  48. Barakat, N.A.M.; Abdelkareem, M.A.; Shin, G.; Kim, H.Y. Pd-doped Co nanofibers immobilized on a chemically stable metallic bipolar plate as novel strategy for direct formic acid fuel cells. Int. J. Hydrog. Energy 2013, 38, 7438–7447. [Google Scholar] [CrossRef]
  49. Thamer, B.M.; El-Newehy, M.H.; Barakat, N.A.M.; Abdelkareem, M.A.; Al-Deyab, S.S.; Kim, H.Y. Influence of Nitrogen doping on the Catalytic Activity of Ni-incorporated Carbon Nanofibers for Alkaline Direct Methanol Fuel Cells. Electrochim. Acta 2014, 142, 228–239. [Google Scholar] [CrossRef]
  50. Zhao, Y.; Yang, X.; Tian, J.; Wang, F.; Zhan, L. Methanol electro-oxidation on Ni@ Pd core-shell nanoparticles supported on multi-walled carbon nanotubes in alkaline media. Int. J. Hydrog. Energy 2010, 35, 3249–3257. [Google Scholar] [CrossRef]
  51. Asgari, M.; Maragheh, M.G.; Davarkhah, R.; Lohrasbi, E.; Golikand, A.N. Electrocatalytic oxidation of methanol on the nickel–cobalt modified glassy carbon electrode in alkaline medium. Electrochim. Acta 2012, 59, 284–289. [Google Scholar] [CrossRef]
  52. Zhong, J.-P.; Fan, Y.-J.; Wang, H.; Wang, R.-X.; Fan, L.-L.; Shen, X.-C.; Shi, Z.-J. Highly active Pt nanoparticles on nickel phthalocyanine functionalized graphene nanosheets for methanol electrooxidation. Electrochim. Acta 2013, 113, 653–660. [Google Scholar] [CrossRef]
  53. Yu, M.; Chen, J.; Liu, J.; Li, S.; Ma, Y.; Zhang, J.; An, J. Mesoporous NiCo2O4 nanoneedles grown on 3D graphene-nickel foam for supercapacitor and methanol electro-oxidation. Electrochim. Acta 2015, 151, 99–108. [Google Scholar] [CrossRef]
  54. Yousef, A.; Barakat, N.A.; Amna, T.; Unnithan, A.R.; Al-Deyab, S.S.; Kim, H.Y. Influence of CdO-doping on the photoluminescence properties of ZnO nanofibers: Effective visible light photocatalyst for waste water treatment. J. Lumin. 2012, 132, 1668–1677. [Google Scholar] [CrossRef]
  55. Nash, P.; Nash, A. The Ni−Sn (Nickel-Tin) system. Bull. Alloy Phase Diagr. 1985, 6, 350–359. [Google Scholar] [CrossRef]
  56. Yousef, A.; Barakat, N.A.M.; El-Newehy, M.; Kim, H.Y. Chemically stable electrospun NiCu nanorods@carbon nanofibers for highly efficient dehydrogenation of ammonia borane. Int. J. Hydrog. Energy 2012, 37, 17715–17723. [Google Scholar] [CrossRef]
  57. Rahim, A.; Hameed, R.A.; Khalil, M. Nickel as a catalyst for the electro-oxidation of methanol in alkaline medium. J. Power Sources 2004, 134, 160–169. [Google Scholar] [CrossRef]
  58. Hahn, F.; Beden, B.; Croissant, M.; Lamy, C. In situ UV visible reflectance spectroscopic investigation of the nickel electrode-alkaline solution interface. Electrochim. Acta 1986, 31, 335–342. [Google Scholar] [CrossRef]
  59. Vuković, M. Voltammetry and anodic stability of a hydrous oxide film on a nickel electrode in alkaline solution. J. Appl. Electrochem. 1994, 24, 878–882. [Google Scholar] [CrossRef]
  60. Fleischmann, M.; Korinek, K.; Pletcher, D. The oxidation of organic compounds at a nickel anode in alkaline solution. J. Electroanal. Chem. Interfacial Electrochem. 1971, 31, 39–49. [Google Scholar] [CrossRef]
  61. Enea, O. Molecular structure effects in electrocatalysis--II. Oxidation of d-glucose and of linear polyols on Ni electrodes. Electrochim. Acta 1990, 35, 375–378. [Google Scholar] [CrossRef]
  62. Yan, W.; Wang, D.; Botte, G.G. Electrochemical decomposition of urea with Ni-based catalysts. Appl. Catal. B Environ. 2012, 127, 221–226. [Google Scholar] [CrossRef]
  63. Xia, B.Y.; Wang, J.N.; Wang, X.X. Synthesis and application of Pt nanocrystals with controlled crystallographic planes. J. Phys. Chem. C 2009, 113, 18115–18120. [Google Scholar] [CrossRef]
  64. Wang, D.; Yan, W.; Vijapur, S.H.; Botte, G.G. Enhanced electrocatalytic oxidation of urea based on nickel hydroxide nanoribbons. J. Power Sources 2012, 217, 498–502. [Google Scholar] [CrossRef]
  65. Machado, S.A.; Avaca, L. The hydrogen evolution reaction on nickel surfaces stabilized by H-absorption. Electrochim. Acta 1994, 39, 1385–1391. [Google Scholar] [CrossRef]
  66. Brown, I.; Sotiropoulos, S. Preparation and characterization of microporous Ni coatings as hydrogen evolving cathodes. J. Appl. Electrochem. 2000, 30, 107–111. [Google Scholar] [CrossRef]
Figure 1. SEM; (A) and FE-SEM; (B) images for the prepared nanofibers containing 10 wt % Sn, and calcined at 850 °C.
Catalysts 09 00330 g001
Figure 2. XRD analysis of the Sn-incorporated Ni/C nanofibers synthesized at 850 °C calcination temperature.
Catalysts 09 00330 g002
Figure 3. TEM image (A), and EDX line scan (B) for the prepared Sn-incorporated nanofibers; 10 wt % and 850 °C calcination temperature.
Catalysts 09 00330 g003
Figure 4. Thermal gravimetric analysis (TGA) (A), and first derivative for the TGA data (B) for an electrospun mat containing 10 wt % tin precursor.
Catalysts 09 00330 g004
Figure 5. Activation of Sn-incorporated Ni/C nanofibers with different Sn contents and prepared at 700 °C (A); and influence of the Sn content on the electrochemical surface area (B).
Catalysts 09 00330 g005
Figure 6. Activation of Sn-incorporated Ni/C nanofibers with different Sn contents and prepared at 850 °C (A), and influence of the Sn content on the electrochemical surface area (B).
Catalysts 09 00330 g006
Figure 7. Influence of the calcination temperature on the ESA of the activated nanofibers containing 10 wt % Sn.
Catalysts 09 00330 g007
Figure 8. Schematic illustration of the electron passing through the nanoparticles and nanofibers (A). Influence of the nanostructural morphology on the ESA of the activated composites containing 10 wt % Sn and calcined at 850 °C (B).
Catalysts 09 00330 g008
Figure 9. Electrocatalytic activity of Ni/C nanofibers containing different Sn contents and prepared at 700 °C (A) and 850 °C (B) toward methanol oxidation (1.0 M in 1.0 KOH) at room temperature and at a scan rate of 50 mV/s.
Catalysts 09 00330 g009
Figure 10. Electrocatalytic activity of Ni/C nanofibers containing different Sn contents and prepared at 700 °C (A) and 850 °C (B) toward urea oxidation (1.0 M in 1.0 KOH) at room temperature and a scan rate of 50 mV/s.
Catalysts 09 00330 g010
Figure 11. Influence of calcination temperature on the electrocatalytic activity of 10 wt % Sn nanofibers toward oxidation of methanol (1.0 M in 1.0 KOH) (A) and urea (1.0 M in 1.0 KOH) (B); the measurements were performed at room temperature and a scan rate of 50 mV/s.
Catalysts 09 00330 g011
Figure 12. Influence of the nanostructural morphology on the electrocatalytic activity of 10 wt % Sn nanofibers prepared at 850 °C toward oxidation of methanol (1.0 M in 1.0 KOH) (A) and urea (1.0 M in 1.0 KOH); (B) the measurements were performed at room temperature and a scan rate of 50 mV/s.
Catalysts 09 00330 g012
Table 1. Composition of the produced nanofibers produced at 850 °C.
SnCl2 in the Initial Solution (%)NiSn Alloys ContentElemental Compostion
Ni3Sn2 (%)Ni3Sn (%)Ni (in NiSn Alloys) (%)Ni (Free) (%)Sn (%)Snevap (%)C (%)
542585.45728.0824.510061.952
1010006.54424.3808.779060.297
25594123.3990.45920.31055.823
35544619.703016.89010.21553.192
Table 2. The onset potentials (mV vs. Ag/AgCl) of urea and methanol oxidation at the surface of the proposed nanofibers.
Synthesis Temp. °CSn Precusor Content (wt %)
0510152535
Methanol700375415412405423425
850395403360415445415
Urea700408412405401415425
850410412195405406408

