Article

Hydrocracking of Athabasca Vacuum Residue Using Ni-Mo-Supported Drill Cuttings

1
Department of Chemical & Petroleum Engineering, University of Calgary, Calgary, AB, Canada T2N 1N4
2
State Key Laboratory of Heavy Oil Processing, College of Chemical Engineering, China University of Petroleum, Beijing 102249, China
*
Author to whom correspondence should be addressed.
Catalysts 2019, 9(3), 216; https://doi.org/10.3390/catal9030216
Submission received: 20 January 2019 / Revised: 1 February 2019 / Accepted: 7 February 2019 / Published: 26 February 2019

Abstract

:
Ni-Mo supported drill cuttings were used to catalyze the hydrocracking (HDC) of Athabasca vacuum residue (AVR) in an autoclave. Drill cuttings are a common waste product that are, depending on their origin, plentiful in acidic sites. The catalyst was prepared using the wet impregnation method. HDC was carried out at both low and high H2 pressure at 400 °C. Control thermal cracking (TC) and HDC runs with and without raw drill cuttings were performed to better examine the role of the supported drill cuttings catalyst. The quality in terms of viscosity and °API gravity, and the yield of various fractions making up the product oil were used to gauge the performance of the catalyst. Similar temperature and energy profiles between TC and HDC suggested strong overlap between the two different reactions, despite H2 presence. Nevertheless, supported drill cuttings runs at high H2 pressures promoted H2 consumption to a strong extent. Consequently, the liquid yield was the highest (~75 wt.%) and the coke yield was negligible. High temperature simulated distillation results revealed a residue conversion of ~55% for both low and high pressure HDC catalytic runs. The product oil quality with respect to viscosity and °API gravity was also found to be comparable between the low and high pressure HDC catalytic runs. Accordingly, no trade-off between liquid yield and quality was incurred at high H2 pressure. Effectively the supported drill cuttings drastically reduced coke formation, while maximizing the yield of the desired liquid product.

Graphical Abstract

1. Introduction

Heavy oil constitutes the vast majority of the proven oil reserve [1]. Nevertheless, the strong presence of heavy molecules such as asphaltenes poses a major recovery and upgrading problems of these reserves. Therefore, exploring inexpensive processes for upgrading heavy oil into lighter fractions is essential for the resource to compete in the market [2]. A wide variety of upgrading processes exist and are being used today [3]. For example, hydrocracking (HDC) is an upgrading process that uses hydrogen in order to promote a higher H:C ratio, and therefore a higher yield of light products [4]. Unlike other upgrading processes, HDC can utilize many different feedstocks to produce a higher quality liquid product while still maintaining a low coke yield [5]. Coke formation during upgrading, especially catalytic upgrading, deactivates catalysts and accelerates conversion to undesirable products [6]. Therefore, coke formation incurs an additional significant economic cost on the process.
The addition of a catalyst to HDC can reduce the operational severity while leading to more favorable products [7]. A HDC catalyst must have bi-functionality, consisting of dehydrogenation/hydrogenation metals, for example, Co-Mo [8] or Ni-Mo [9], as well as a strong acidic support such as silica-alumina [10,11] that can crack the hydrocarbon molecules [12]. Good distribution and abundance of acidic and metallic sites on a HDC catalyst largely dictates its performance, as larger distances between sites impede the step-by-step reactions during HDC [13]. HDC reactions typically occur in the following order: (i) molecule reaching a metallic site undergo dehydrogenation, (ii) diffusion of the molecule to the nearest available acidic site, (iii) cracking on the acidic site (iv) transport back to an available metallic site, (v) final hydrogenation on the metallic site [14]. The majority of current work on HDC aims to improve on catalyst performance by optimizing its structure [15]. A major focus is on improving pore distribution of the support material, as it affects elemental distribution onto the surface as well as mass transfer within the catalyst [16]. However, there has been a growing interest in other, less conventional, methods of improving HDC as a process [17]. An overview of recent HDC studies can be found in Table S1 [18,19,20,21,22,23,24]. Additional reviews on HDC of heavy oils can be found elsewhere [17,25,26,27,28].
It has been suggested earlier that fine particles and materials such as coke could be added to the feed to suppress coke formation and hence increase the liquid product yield during heavy oil upgrading [29,30,31]. Drill cuttings are common waste products of drilling industry [32]. Cuttings consisting of an alumina-silica base, e.g. sandstone, potentially offer abundance in acidic sites and, hence, offer a good cracking catalyst. While drill cuttings can vary in composition between different drilling sites, an acidic type cutting collected from drilling in shale or sandstone type formation would be required for catalytic cracking. The lack of pore space within drill cuttings, on the other hand, can be compensated by using higher than normal concentrations of this waste product. Use of this waste material in upgrading as a catalyst could greatly reduce the economic and environmental severity of the process [33]. Recent studies examining the utilization of waste products as catalysts for fuel production include using Ni red mud for hydrodeoxygenation [34], an alkali biowaste-based catalyst for biodiesel production [35,36] and metallosilicate catalyst product from glass waste [37]. These studies aim to use widely available, suitable waste materials, e.g. high in Ca content [38] for catalyst production. This theme is also applicable to drill cuttings, where their acidic nature could be ideal for thermal and catalytic cracking. In our previous work, drill cuttings were reported to be very effective at catalyzing thermal cracking (TC), despite their low catalytic surface area [39,40]. An optimum drill cuttings concentration of 10 wt.% was found to provide the highest quality and yield liquid product [39]. As the drill cuttings are a waste product, regeneration may not be required or even desired. In the past, various Ni-Mo silica catalysts have been successfully prepared and used for upgrading of biomass and residue type feedstocks [41,42]. Drill cuttings supported with hydrogenation elements such as Ni, Co and Mo could potentially serve as an inexpensive catalyst for a hydrotreating process.
This study investigates the use of raw drill cuttings and Ni-Mo supported drill cuttings for HDC of Athabasca vacuum residue (AVR) in an autoclave. Product quality in terms of °API gravity and viscosity, and liquid yield were the criteria for determining the effectiveness of the catalyst. TC and HDC control runs using both raw drill cuttings and supported drill cuttings were used to determine the exact role of the catalyst. To better understand the types of reactions occurring during upgrading within the autoclave, energy consumption was monitored. While energy analysis is rarely performed in HDC literature, it has been shown to contribute much of the understanding of heavy oil upgrading reactions [39,43,44]. Additionally, a direct comparison between catalytic TC and HDC runs is uncommon in the literature, yet it can provide deeper insights into the mechanism of reactions. While HDC has been well known and studied for a long time, the innovation of a catalyst that could greatly reduce operational, economic and environmental severity [33] would have significant value in making the process more economical and competitive. To the best of our knowledge, no previous investigations have explored the possibility of using drill cuttings, or a similar waste product, as a HDC catalyst. Exploring the potential of such a catalyst could open up new research directions for using other, similar, waste products as HDC catalysts.

2. Results and Discussions

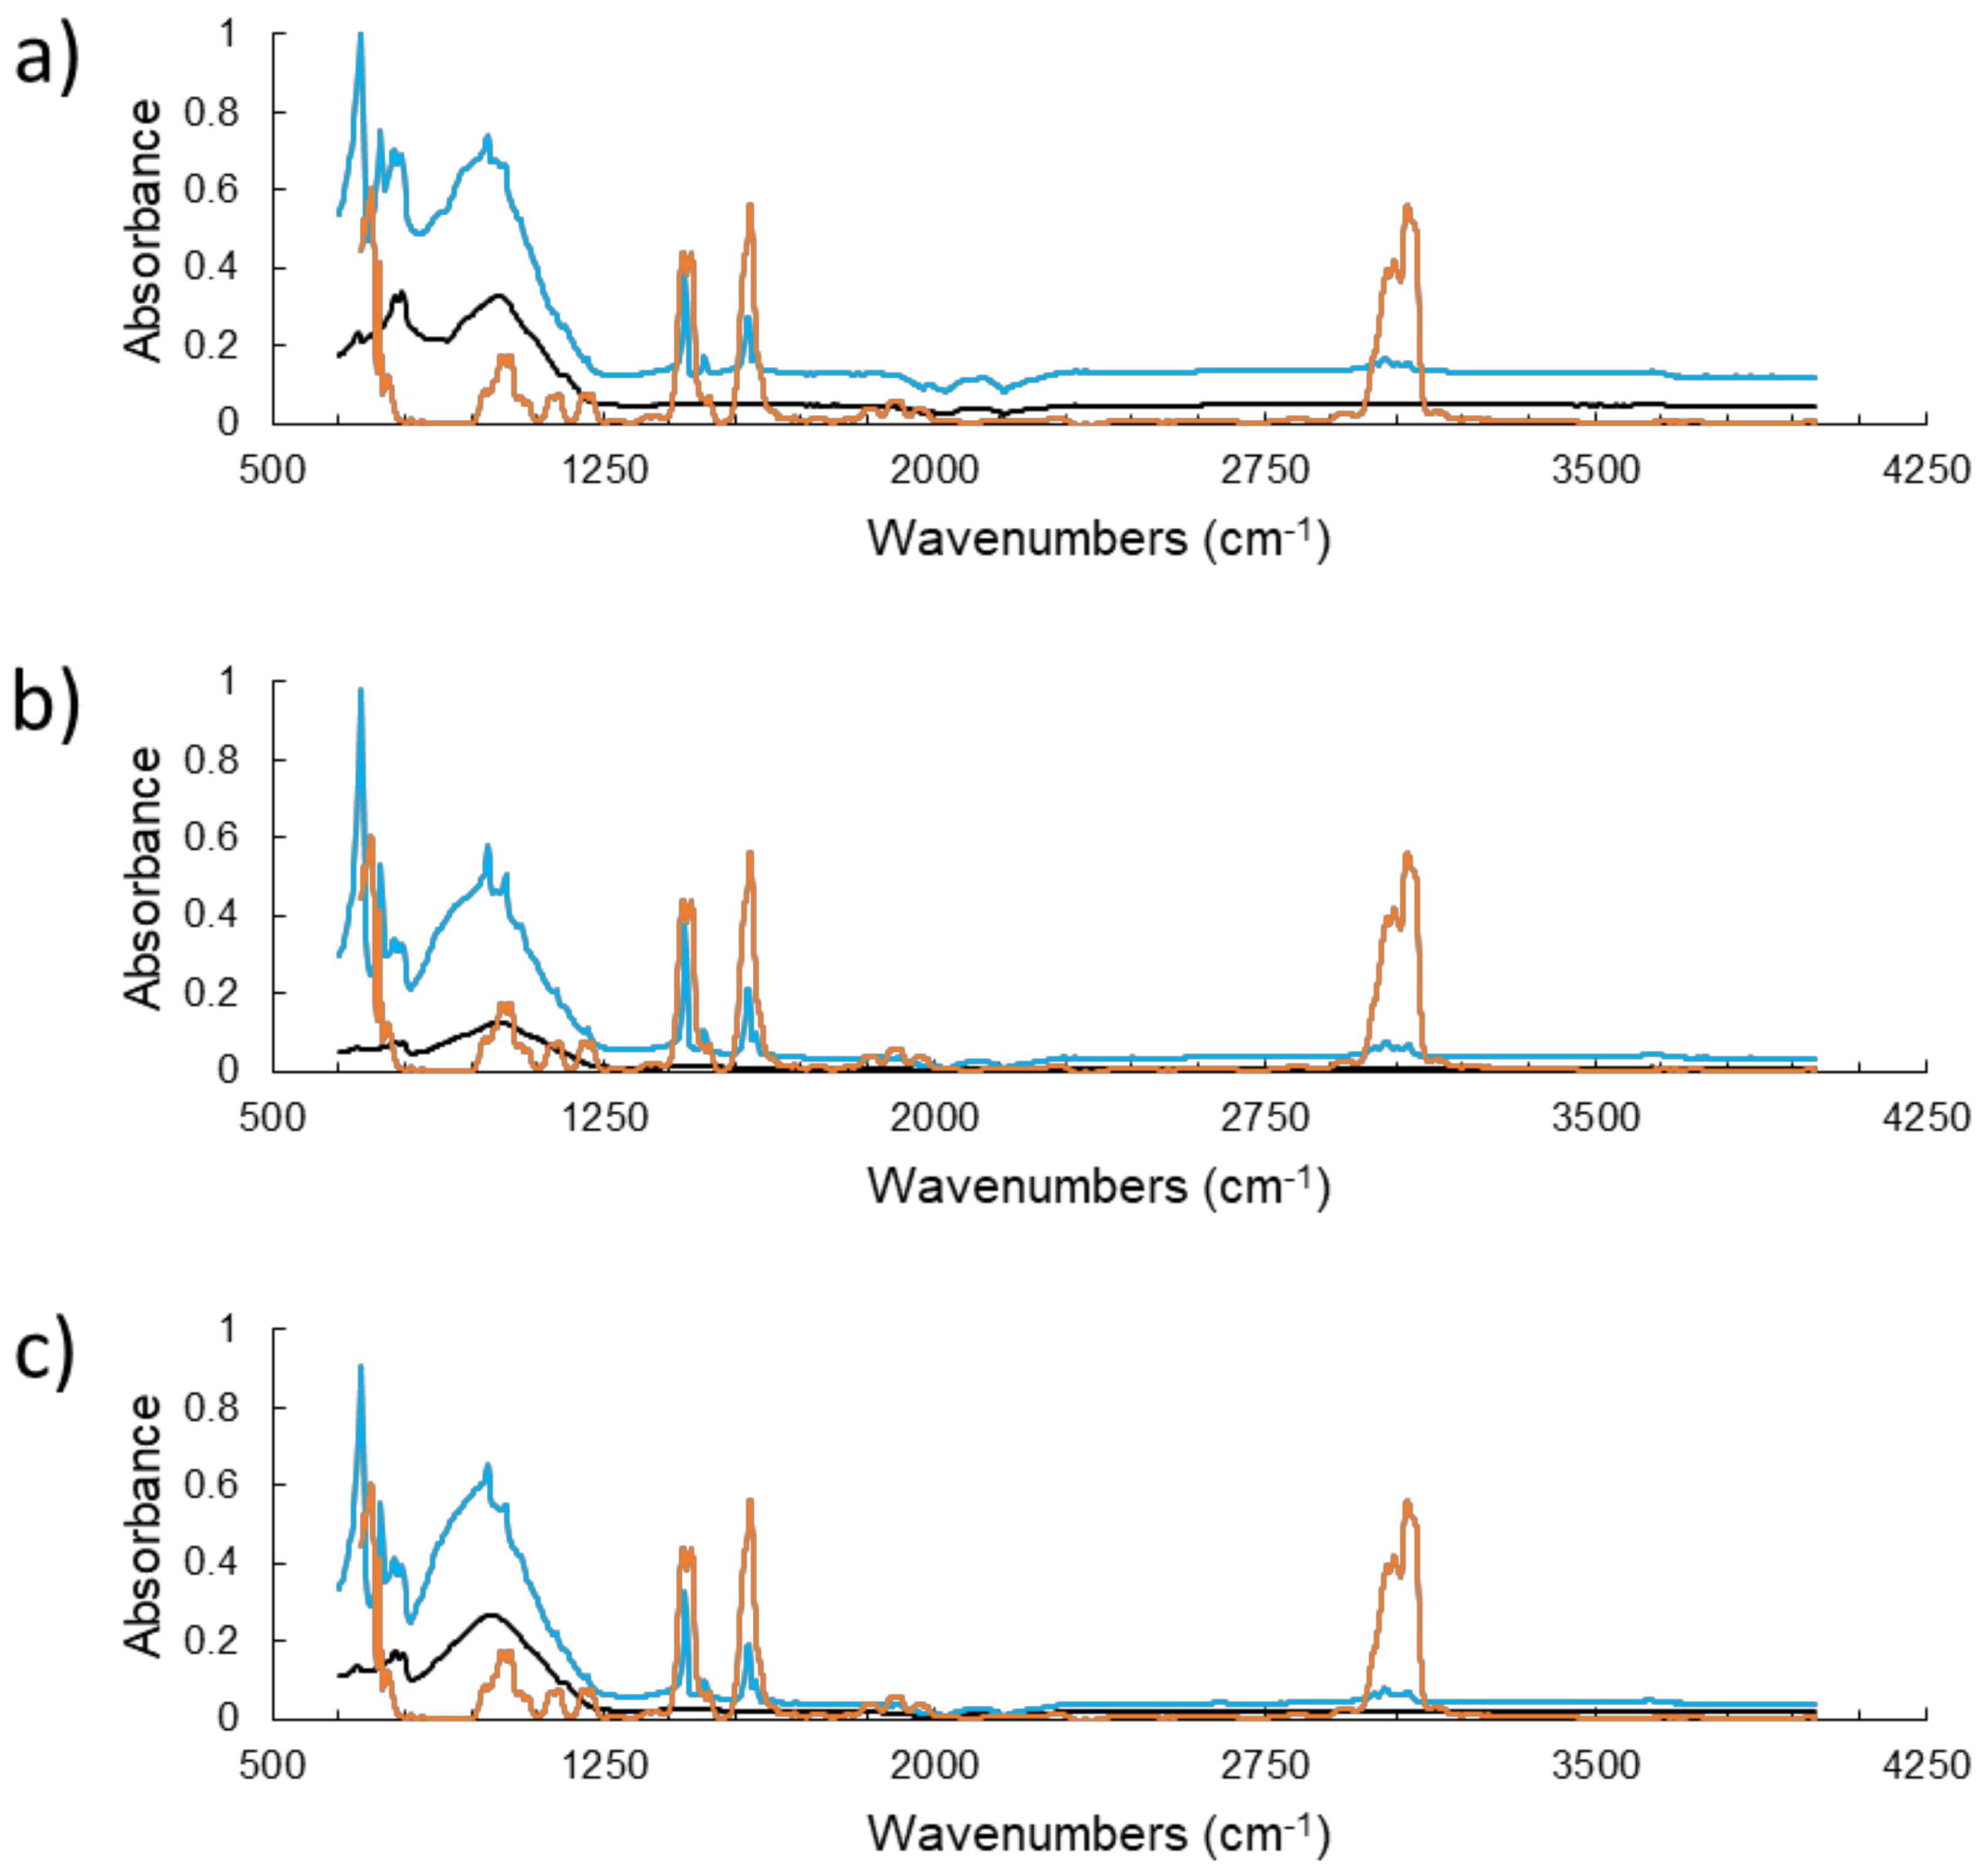
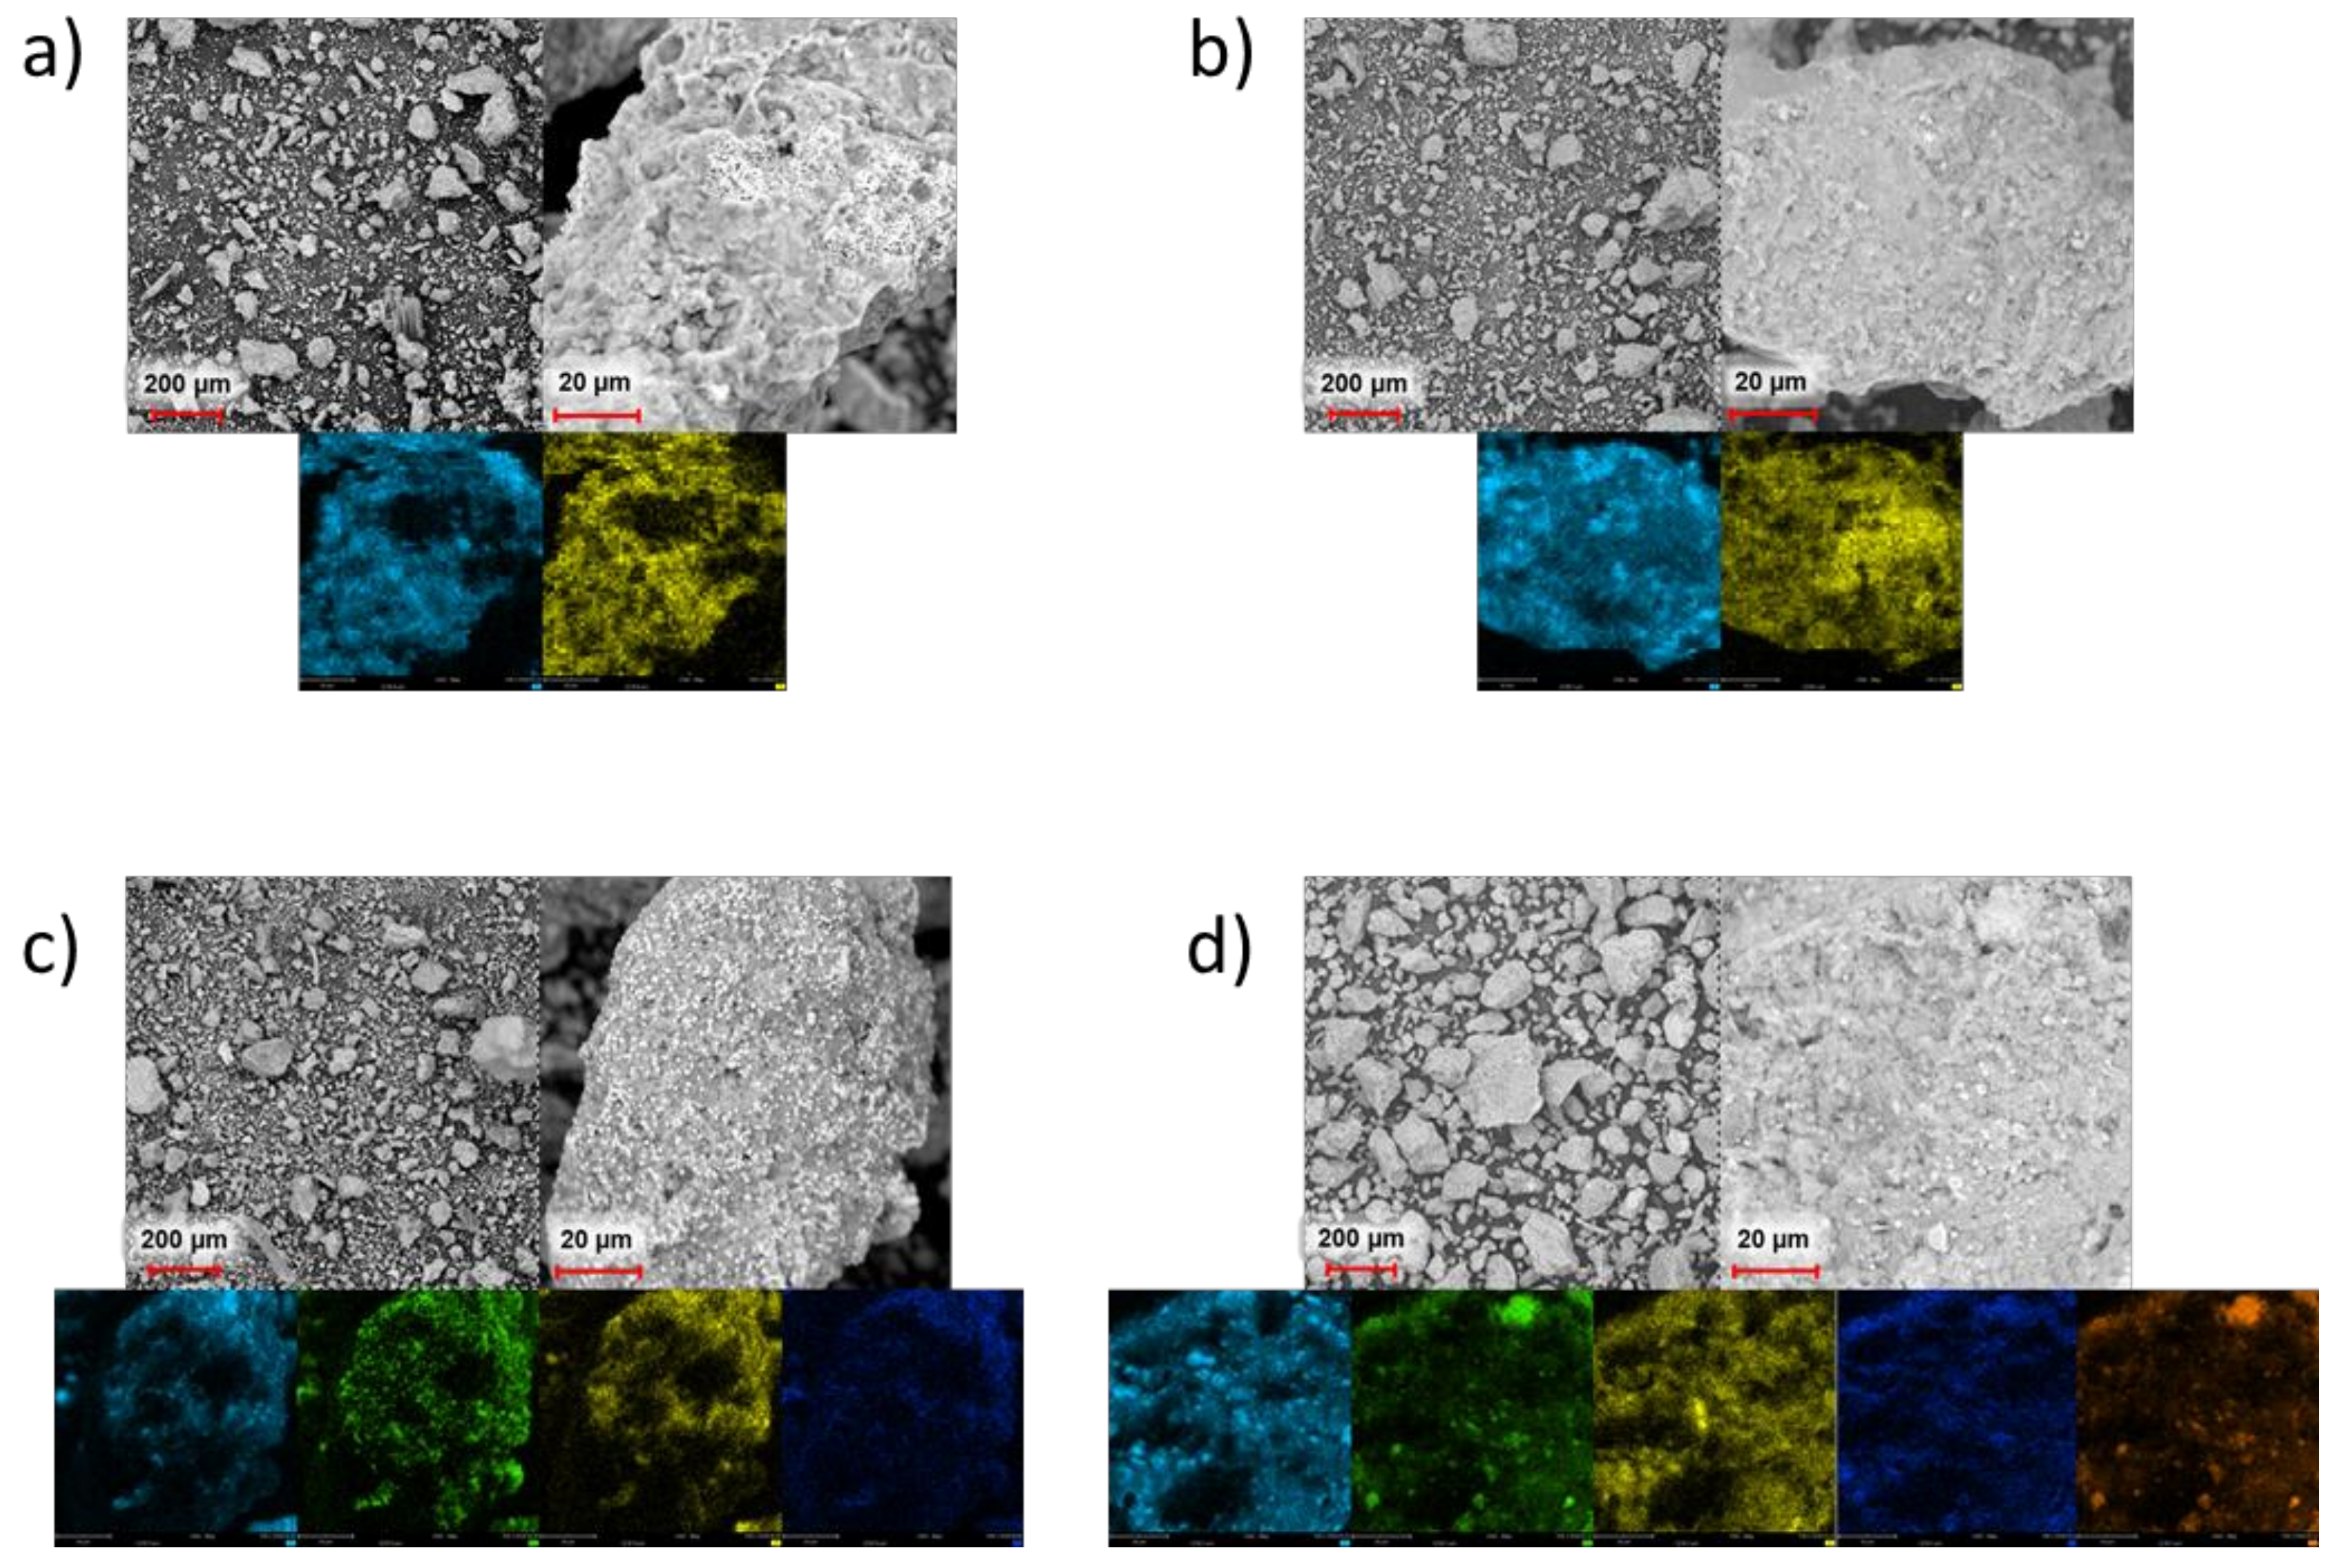
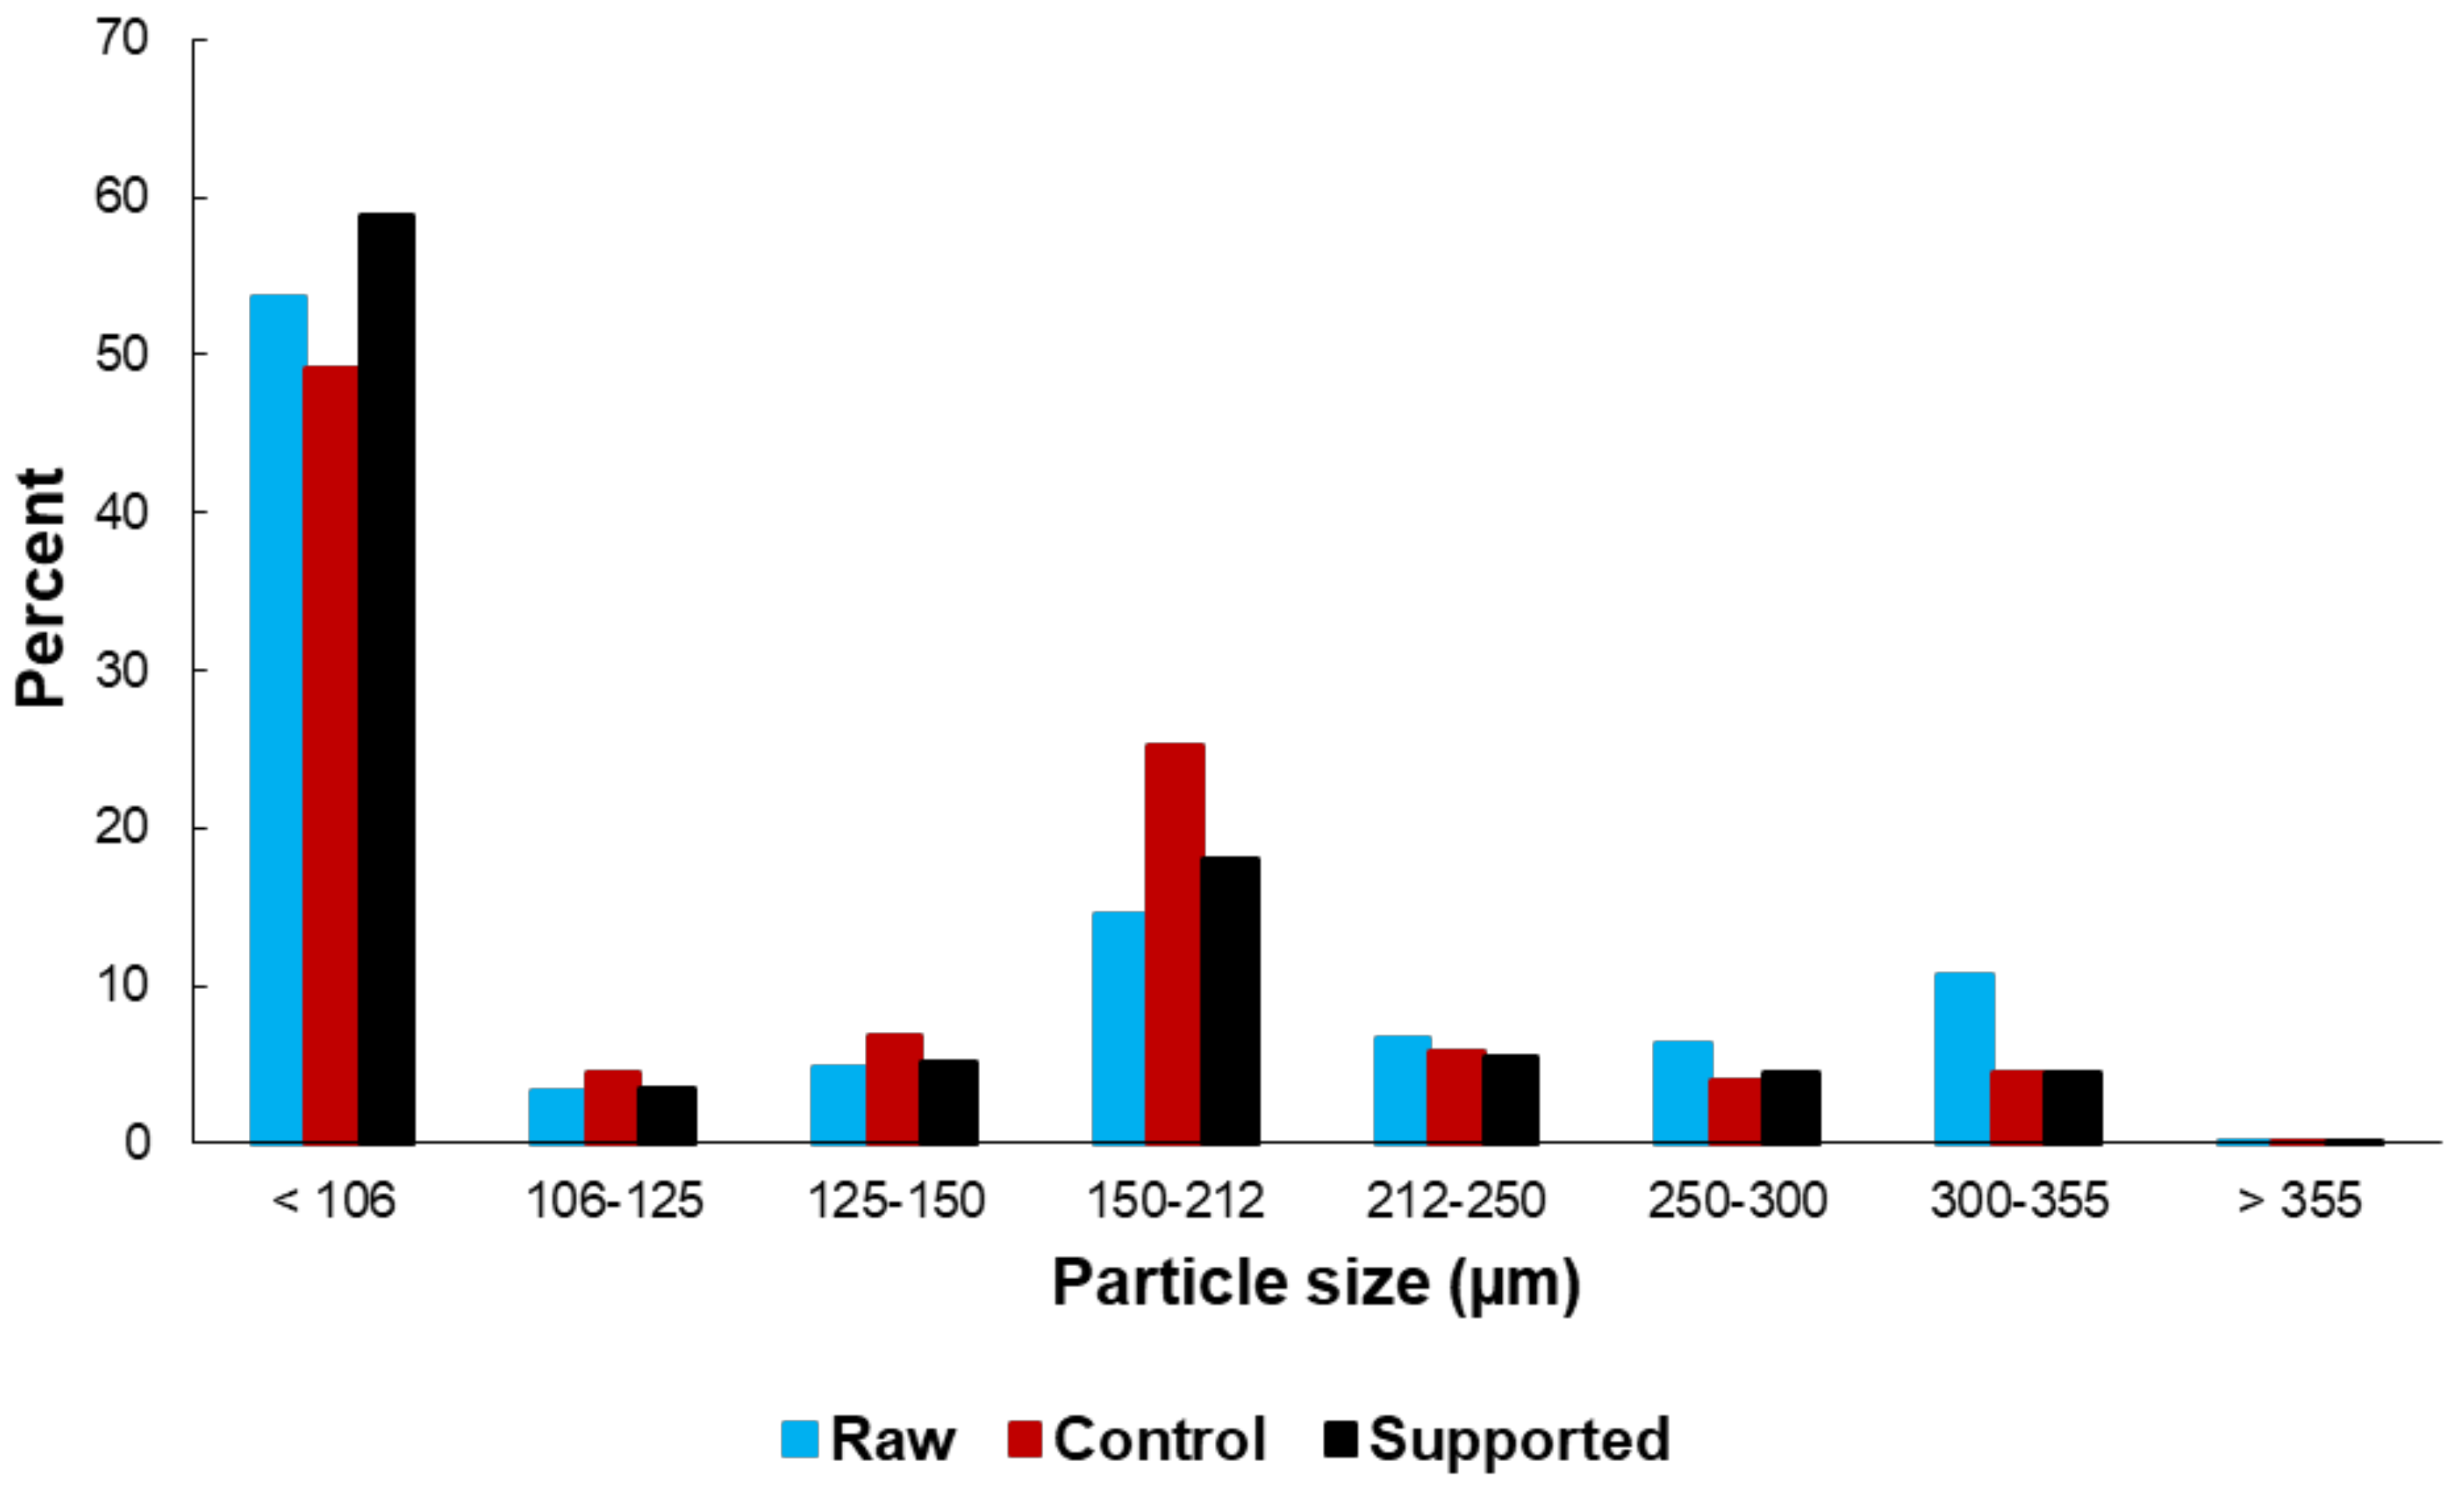
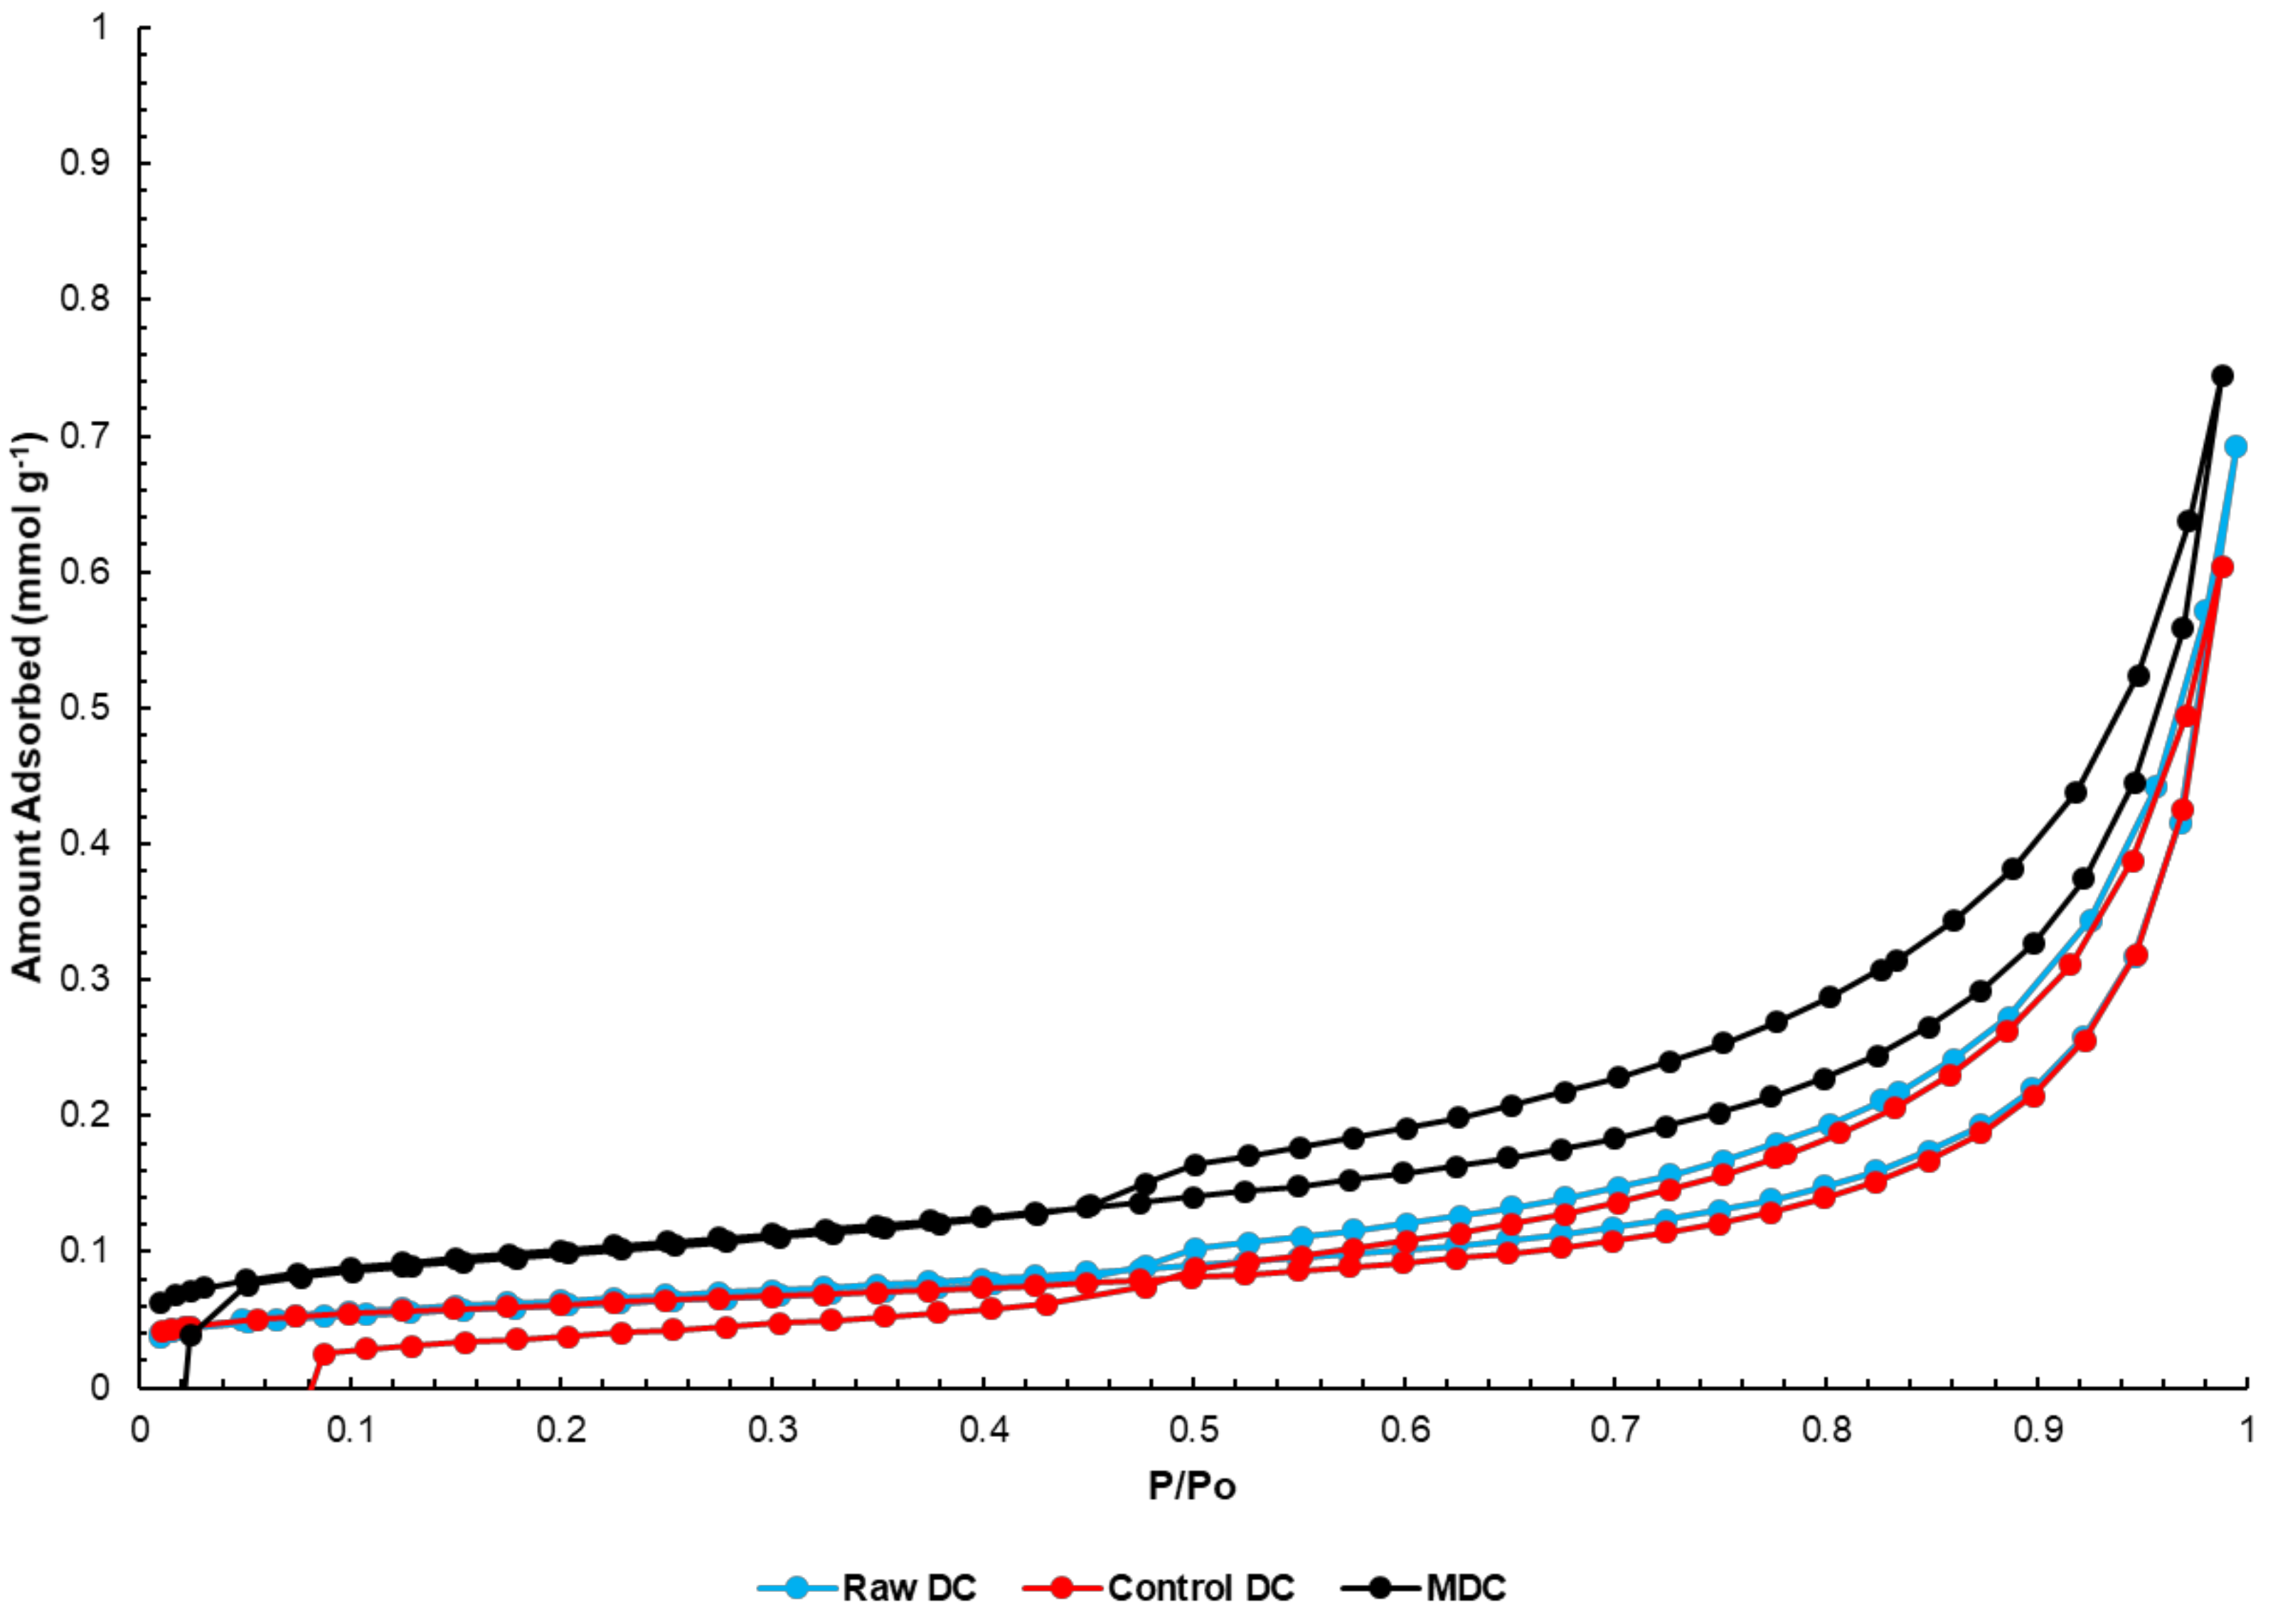
2.1. Catalyst Characterization

Figure 1 shows scanning electron microscopy/energy-dispersive X-ray (SEM/EDX) images of the raw, control and Ni-Mo supported drill cuttings. The particle size of the drill cuttings was <350 µm in accordance with the preparation procedure. Interestingly, the average size of the control drill cuttings and supported drill cuttings appeared to be smaller than that of the raw drill cuttings, suggesting that wet impregnation procedure and/or heat treatment introduced changes to at least the morphology of the drill cuttings. This is confirmed through the particle size distribution for the three different types of cuttings, as seen in Figure 2. Finer drill cuttings most likely better disperse during the reaction. It has been shown earlier that greater dispersion of fine solids within the heavy oil feed improves the dispersion of the coke precursors during upgrading, resulting in more effective exposure to hydrogen donors [30,45]. Subsequently, it is anticipated that the TI yield would decrease, while the liquid yield would increase. Details on the role of dispersion on product quality and quantity will follow.
As evident from Figure 1, all forms of the drill cuttings show an excellent distribution of silica and alumina over the entire surface of the particles. In addition, the supported drill cuttings show even distribution of Ni and Mo promoters onto its surface. The even distribution of the different elements onto the surface of the catalyst most likely shrinks the diffusion length between the metallic and acidic sites and therefore the supported drill cuttings should, in principle, provide good selectivity towards hydrogenation [46]. Table 1 shows the elemental concentrations on the surface of the supported drill cuttings before and after upgrading, per EDX measurements. It can be seen that the supported drill cuttings is activated in-situ as the necessary metal sulfide sites are formed during the HDC reaction, despite no prior sulfidation [47,48,49].
N2 adsorption-desorption curves for the drill cuttings samples are shown in Figure 3. It can be seen that the isotherms follow a typical H3 type hysteresis curve [50]. Such a curve does not provide very reliable pore volume information, however it is expected that the drill cuttings have negligible pore volume, as seen in Table 2. Interestingly, the supported drill cuttings show a significantly higher BET surface area than the other two samples. This suggests that the supported drill cuttings possess a higher catalytic activity than the raw or control drill cuttings, simply by nature of the preparation step, despite the similar treatment steps control drill cuttings have been through. The higher BET surface area of the supported drill cuttings coupled with the lower pore volume relative to control drill cuttings can be understood in light of Figure 2, which shows higher population of small particles for the promoted drill cuttings. It should be noted, nevertheless, that the surface area and pore volume of the different drill cuttings is inferior to typical HDC catalysts. Therefore, higher concertation of the drill cuttings catalyst is used in this study than the typical slurry HDC catalysis, especially since drill cuttings is a waste product.
Fourier transform infrared (FT-IR) spectra of the dry drill cuttings and pyridine-drill cuttings samples can be seen in Figure 4 below. In general, the spectra for all the samples follow the same trend. This suggests that no chemical change has occurred, at the very least, on the surface of the drill cuttings. Thus, also considering the SEM/EDX images, the apparent particle size is the only major difference between the raw and control drill cuttings. The band present at 1000 cm-1 is associated with vibrations of the silica network within the drill cuttings [51]. The band at 600 cm-1 is most likely associated with stretching vibrations of the Al-O bond in alumina [52]. Catalyst acidity is characterized by the number of Lewis acid sites (LAS) and Bronsted acid sites (BAS) present on the catalyst, as captured by the bands at 1455 cm-1 and 1545 cm-1, respectively. The different drill cuttings samples possess a higher number of BAS compared to LAS, as seen by the increased intensity [53]. Cracking can occur on either one of these sites, either through protolytic cracking on BAS, or β-scission on Lewis acid sites [54]. Typically the activation energy is lower for protolytic cracking, nevertheless, aside from energetic considerations, the HDC mechanism should not change [55].

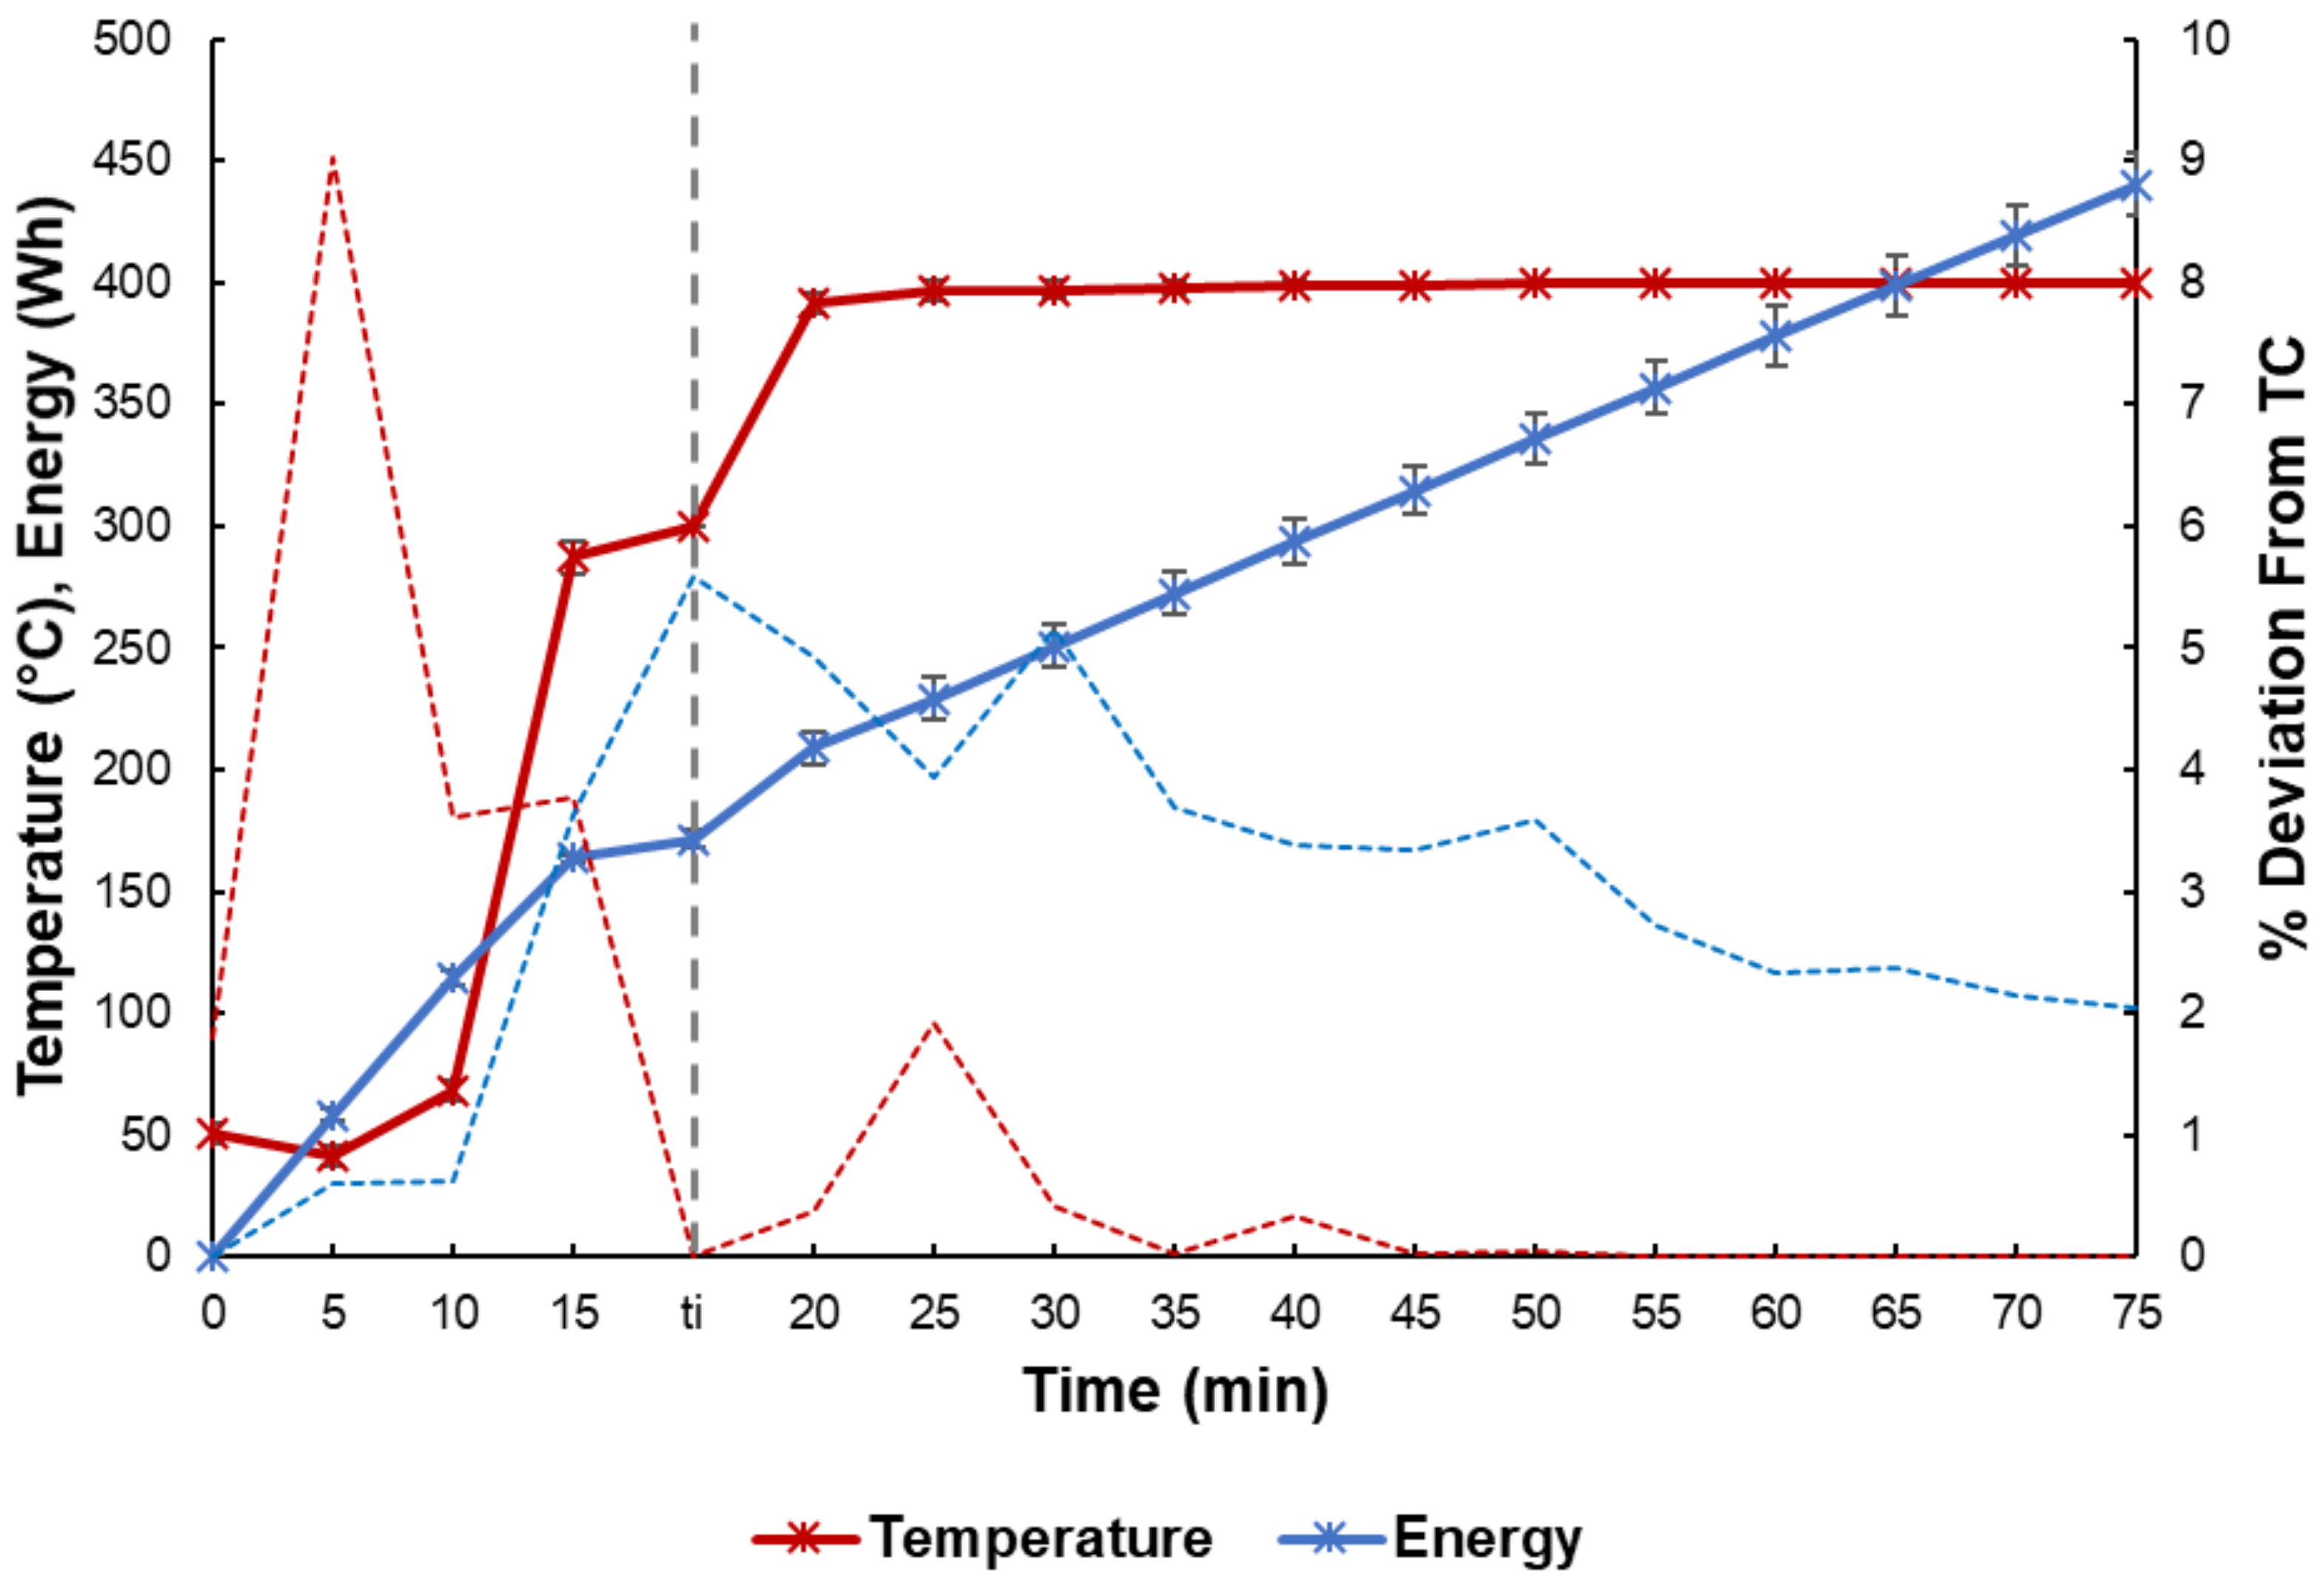
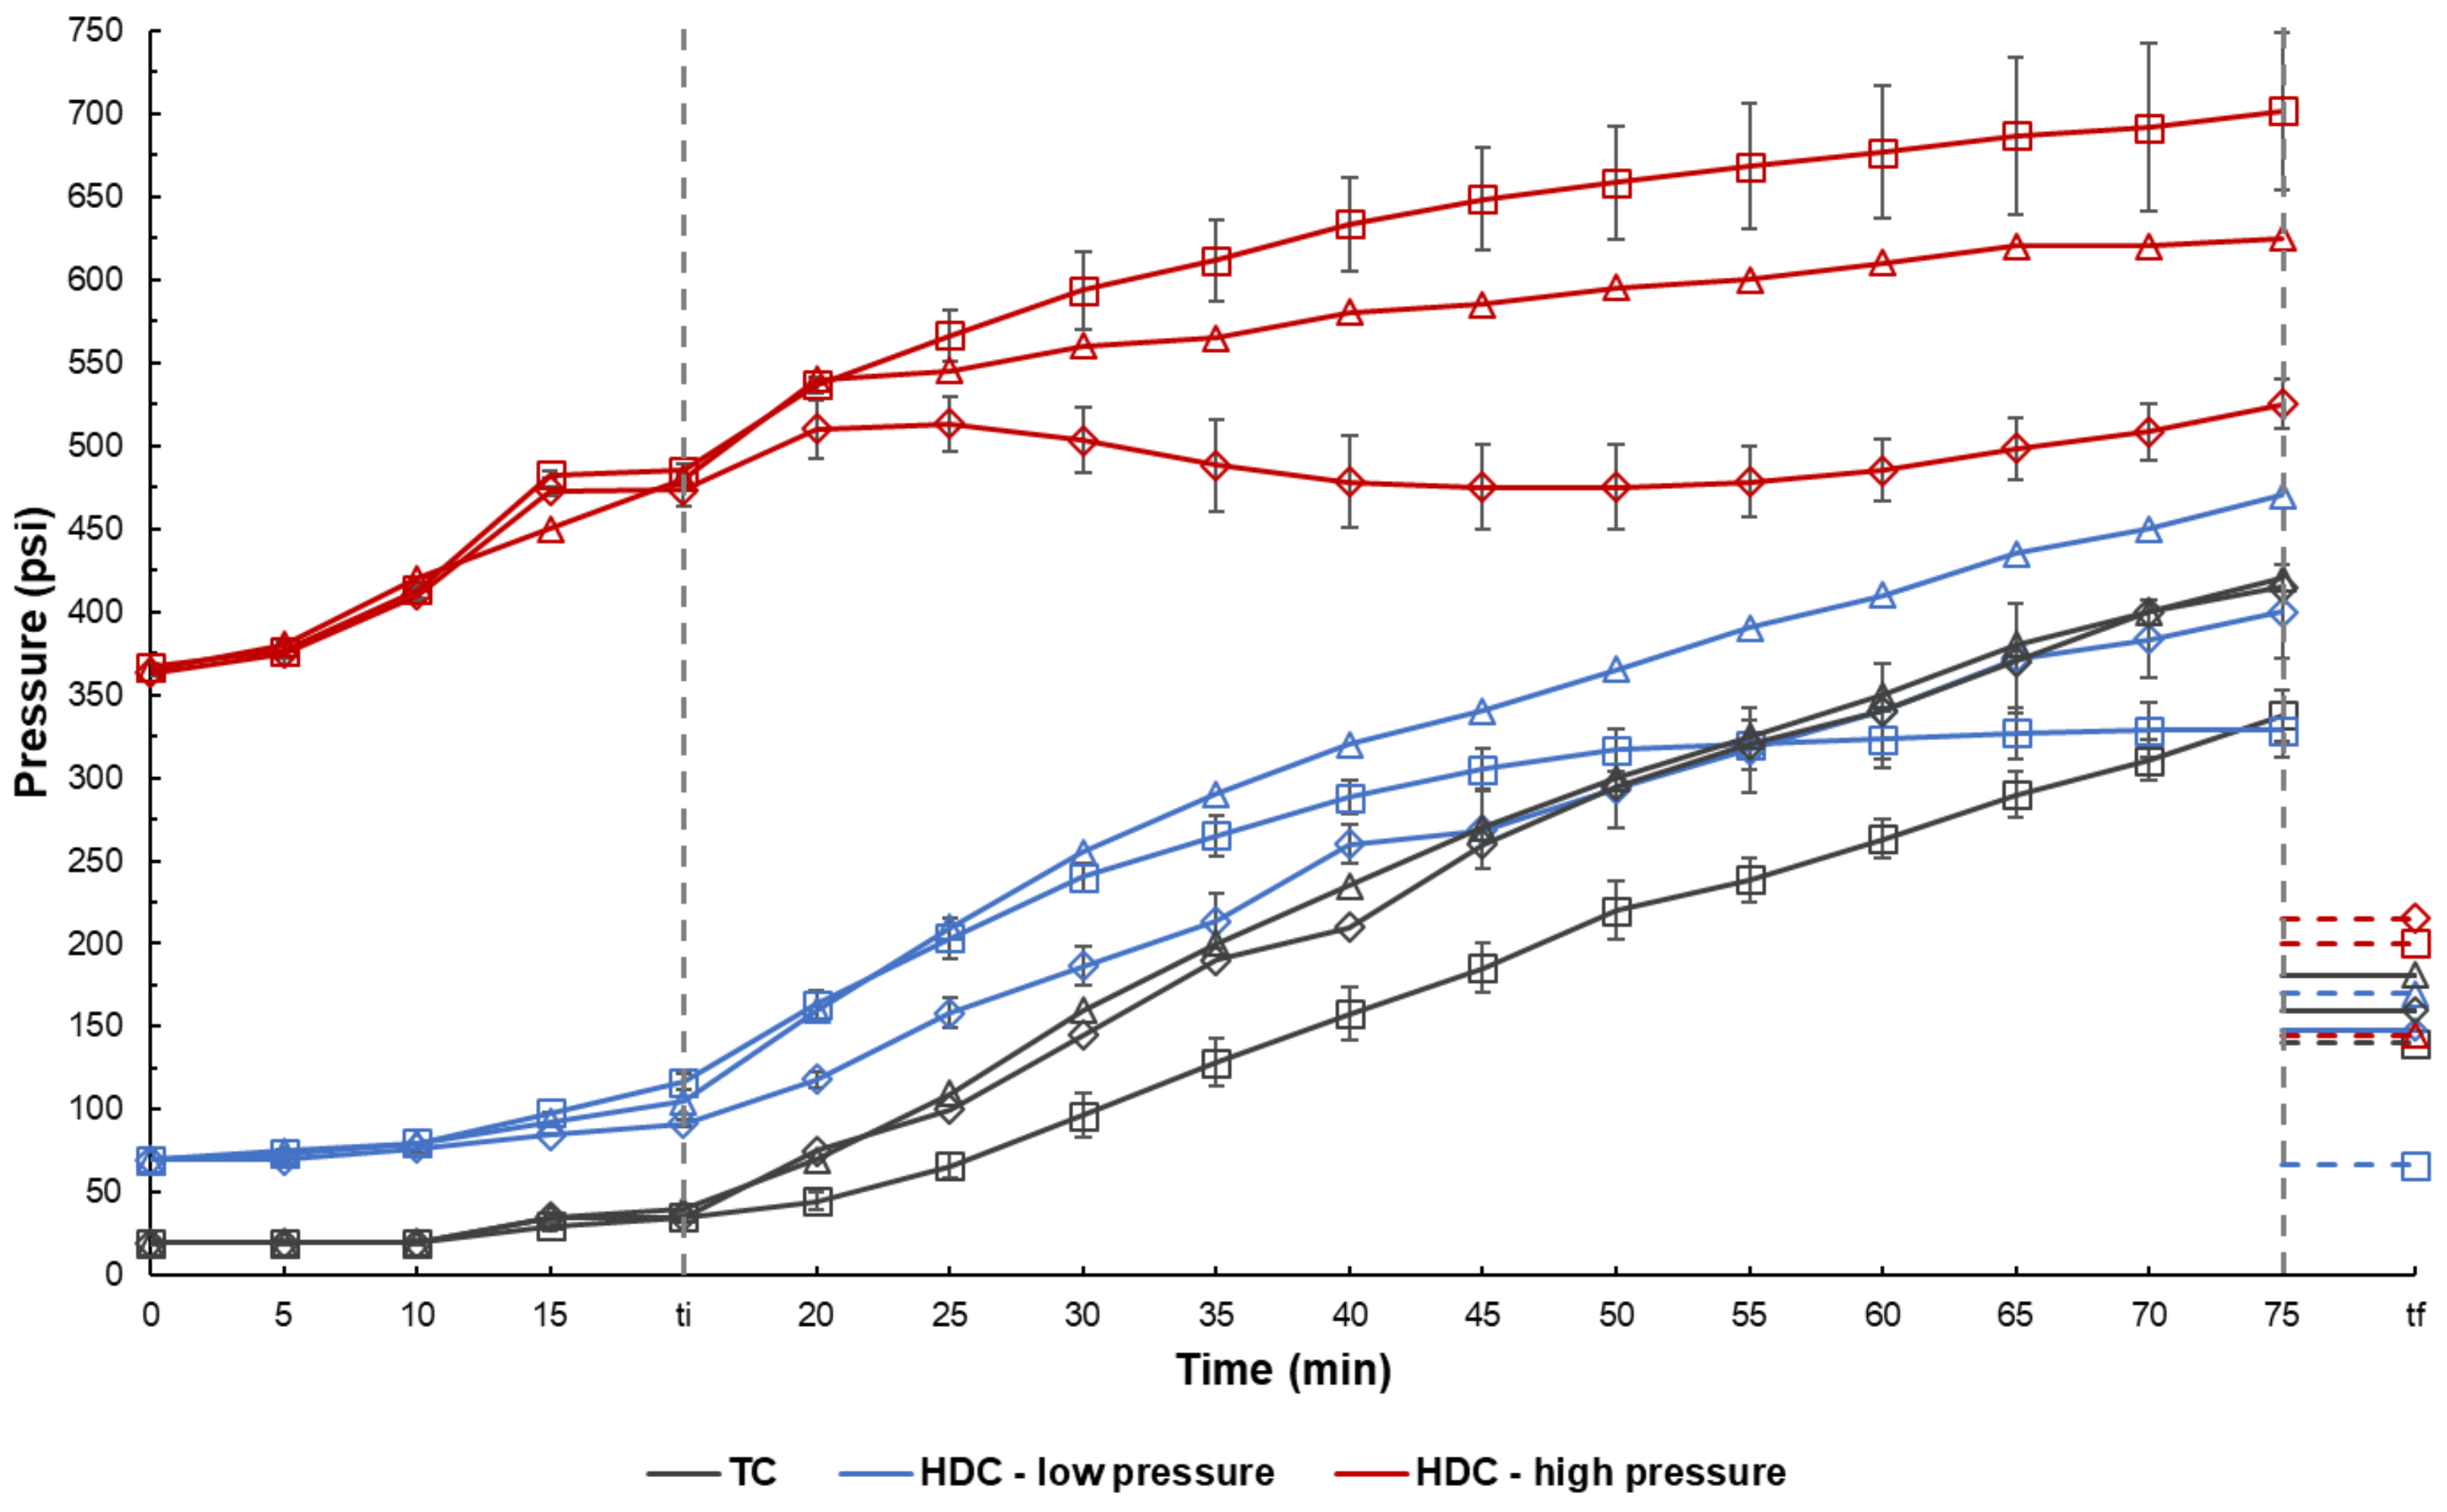
2.2. Temperature, Pressure and Energy Profiles
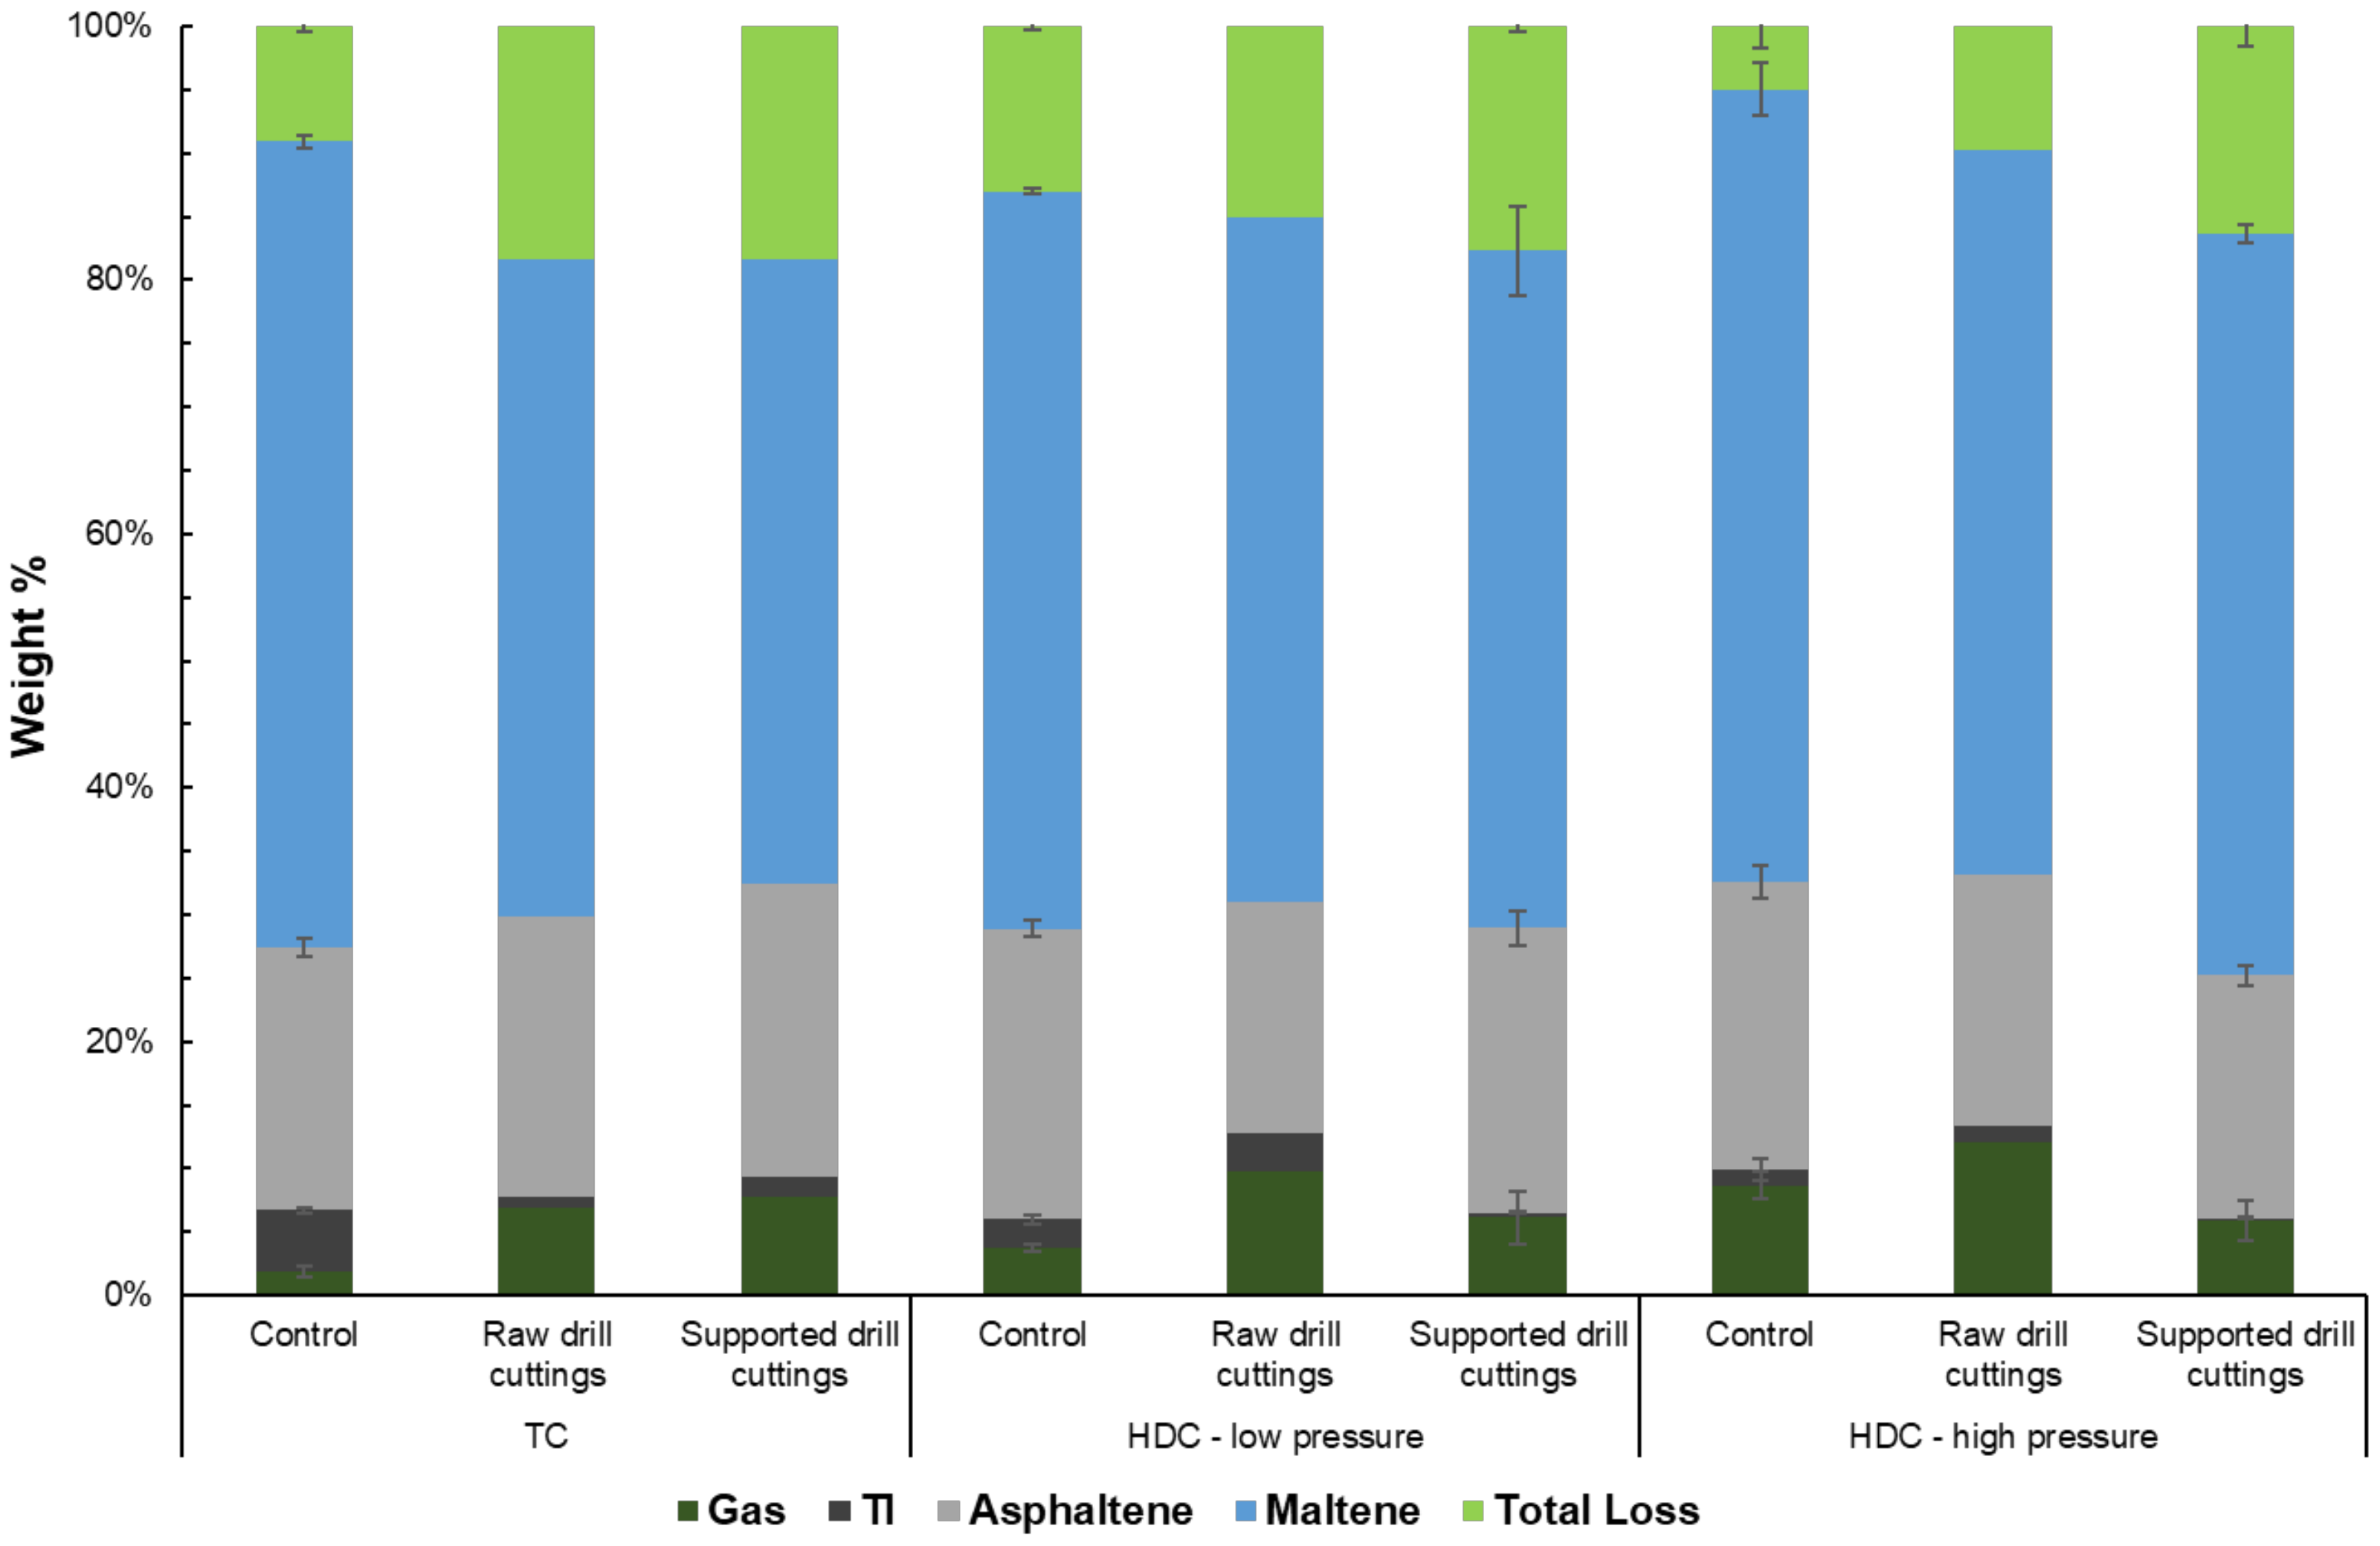
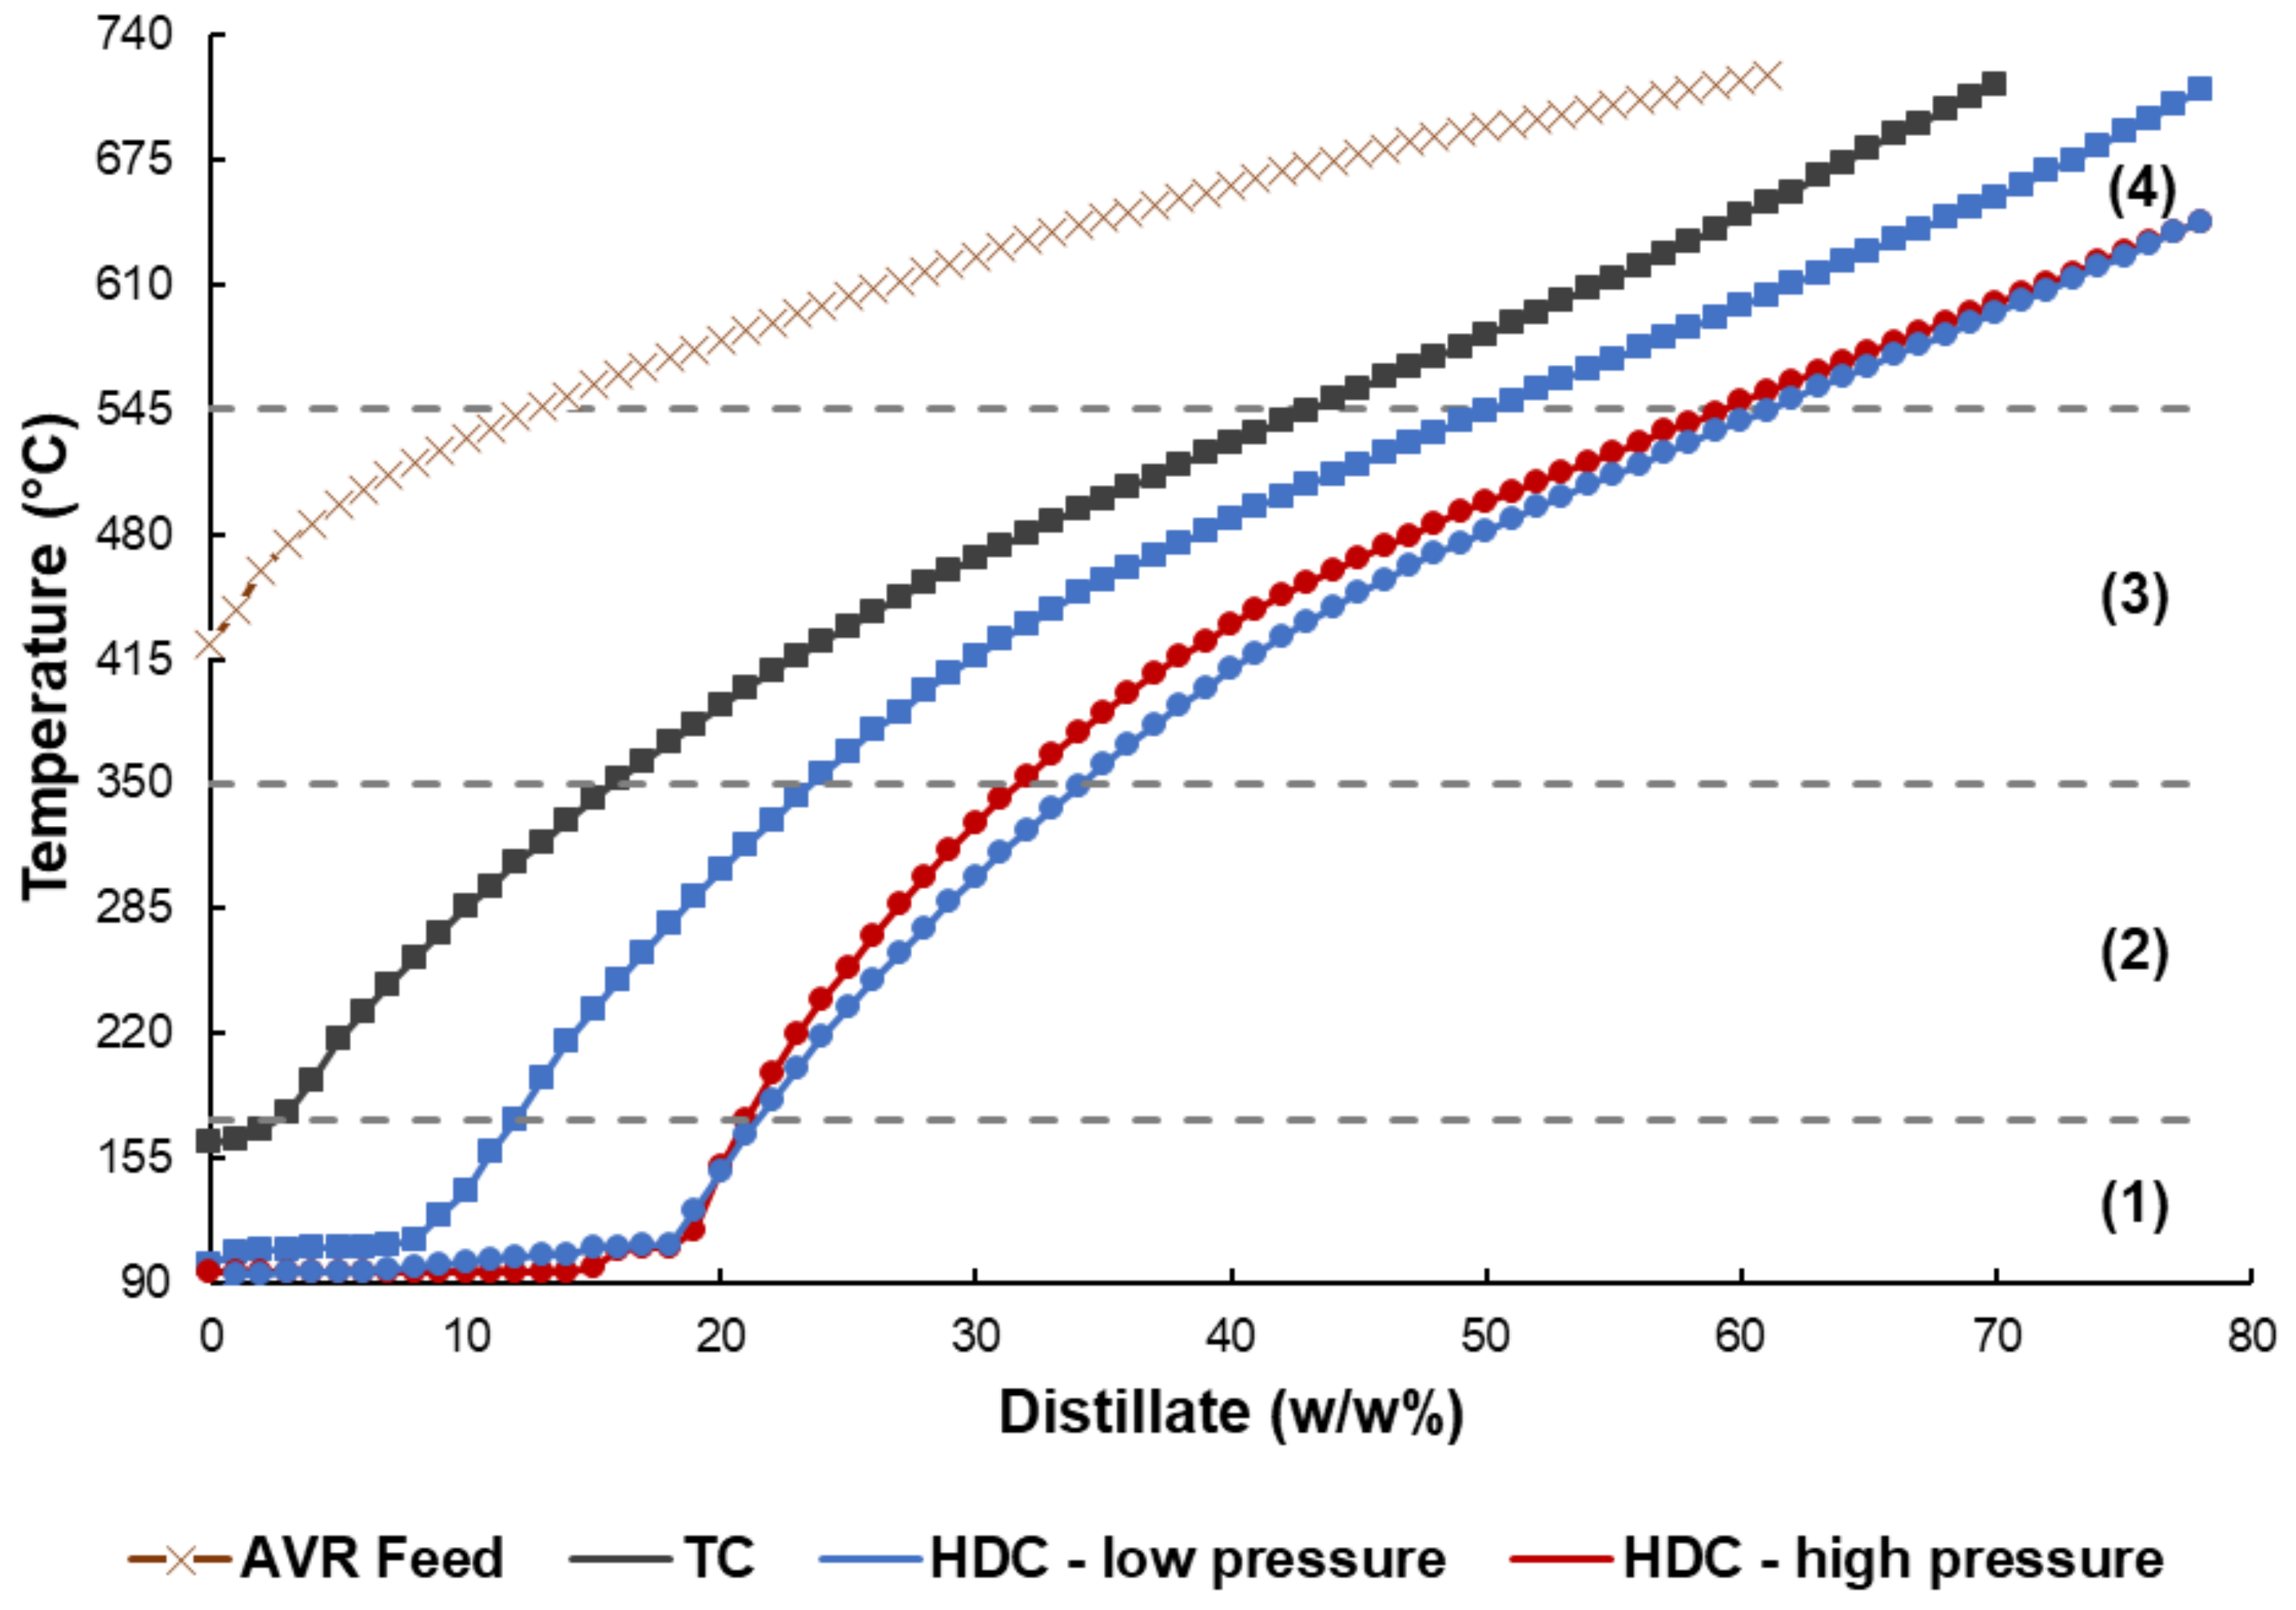
Figure 5 presents the energy consumed and temperature trends for the HDC runs, as well as the % deviation from the respective TC runs. The average deviations in the temperature between the HDC and the TC runs fill below 8% and deviations in the energy consumption fill below 4%. It is worth noting that, per our previous work, the setup provides reliable measurements on the energy consumed during the reactions [44]. The small differences in energy consumption between TC and HDC suggests that strongly endothermic cracking reactions were dominant [43], even under higher pressure HDC conditions. An imbalance of acidic and metallic function on the supported drill cuttings catalyst is unlikely, as seen by the uniform distribution in Figure 1. As such, the HDC reactions could be hydrogen transfer limited, especially since batch HDC is commonly run at much higher pressures, e.g. 1500 psi or greater [48]. This preliminary hypothesis is still to be tested in light of other results.
Figure 6 presents pressure development within the autoclave during the various runs. There was continuous pressure buildup for the TC and catalytic low-pressure HDC runs, except for the low-pressure HDC control run. For the low-pressure HDC control run, reactions responsible for forming short chain, gaseous components were limited due to lack of a catalyst [56]. The rate of pressure buildup for the high-pressure HDC control and drill cuttings runs was more limited than with low pressure runs, perhaps due to a higher hydrogen presence leading to greater hydrogen consumption. Interestingly, the supported drill cuttings showed a very high hydrogen consumption rate from the start of the reaction. This suggests that the supported drill cuttings had a high affinity for utilizing hydrogen present in the reactor. It appears that as the reaction progressed, the hydrogen consumption and gas production rates balanced, until some pressure buildup started occurring. Pressure buildup for the supported drill cuttings at lower H2 pressure was lower than that of the raw drill cuttings, suggesting a higher hydrogen consumption in presence of supported drill cuttings. Gas chromatography results for TC and HDC control, as well as supported drill cuttings runs are shown below in Table 3.
Interestingly, the low-pressure HDC supported drill cuttings run shows a low yield of light end gaseous components, compared to other runs. This suggests that at low H2 concentration, the radical capping mechanism of H2 was limited, and therefore shorter chain components yield decreased. On the other hand, runs with high H2 pressure show comparable fractions of C1–C4 products to the TC control, and higher amounts of C5+ components. These results confirm the similarity in gas evolution and pressure buildup between TC and HDC in the reactor, which could be attributed to similar types of reactions occurring within the reactor despite different conditions, as stated earlier. C4 and higher gases are expected to condense upon cooling the reactor, and therefore contribute to the final liquid oil product. As seen in Table 3, the HDC runs show higher C4+ gas fraction yields, suggesting that the quality of the product oil should increase in respect to the TC runs, as the light-medium fractions of C4+ add to the yield of the product oil and enhance its properties.

2.3. Product Yyield

The yield of various fractions present in the upgraded oil for all runs; including catalytic supported drill cuttings and control HDC, at low and high H2 pressures, TC control and TC raw drill cuttings runs are included in Figure 7.

2.3.1. Control Experiments

It can be seen from Figure 7 that TC control runs in presence of raw drill cuttings or supported drill cuttings produced a much greater gas yield of 6.9 wt.% and 7.7 wt.%, respectively, than non-catalytic TC, 1.8 ± 0.4 wt.%. This is also reflected in Figure 6, where the gas yield and pressure buildup of the control TC were lower than that of the TC raw drill cuttings and TC supported drill cuttings runs. On the other hand, the TI (toluene insoluble) and liquid yields were significantly higher for the non-catalytic TC runs. The increased gas yield of the supported drill cuttings over drill cuttings is likely due to increased catalytic activity as seen by BET surface area in Table 2. The drill cuttings effectively promoted cracking reactions that led to gaseous products, while inhibiting coke formation. This could also be due to the aforementioned dispersion effect, allowing hydrogen donors from the bulk phase to more readily diffuse and cap cracked molecules [29,30,31]. The extent of reduction of coke during upgrading using drill cuttings is in agreement with pasts results [39]. Therefore, in terms of yields, the modification of the drill cuttings led to not only more suitability to HDC, but also increased TC performance.
A comparison of non-catalytic HDC to TC runs shows only slight differences in gas and liquid yields. However, as compared to the other control experiments, the TI yield of the TC control run, 4.9 ± 0.4 wt.%, was significantly higher. With increasing H2 pressure, the gas and asphaltene yield increased and the TI yield decreased. This result is further confirmed by Table 3, where the yield of C1–C3 components was higher at higher H2 pressures. This suggests that polymerization of coke precursors into coke was limited, and instead a higher fraction of medium to long chain components was formed as a result of cracking.

2.3.2. Catalyst Performance at Low H2 Pressure

The raw drill cuttings show poor results at low H2 pressure. While the asphaltene yield of 18.2 wt.% was relatively low for raw drill cuttings run, the gas and TI yields were relatively significant, at 9.8 wt.% and 3.0 wt.%, respectively. Additionally, the liquid yield of the raw drill cuttings run was poor compared to the other low pressure runs. On the other hand, the supported drill cuttings low-pressure runs showed similar results to the low-pressure HDC control in terms of gas, liquid and asphaltene yields. However, the TI yield of 0.4 ± 0.1 wt.% is relatively negligible. The supported drill cuttings not only dispersed coke precursors well within the bulk, increasing hydrogen mass transfer rates, but also utilized the excess H2 to increase the H:C ratio of the product. However, it is possible that H2 utilization at low H2 pressures was sub optimal compared to higher pressures runs, potentially due to mass transfer effects within the reacting system, as seen by the low C1–C3 yields for the low-pressure HDC supported drill cuttings runs in Table 3. This is reflected in the increased yield of the short chain components; namely the gas and volatile yields of 6.1 ± 2.0 wt.% and 17.7 ± 0.4 wt.%, respectively. A similar trend can be seen in Figure 6, where the pressure buildup and final pressure were significantly higher than of the low-pressure HDC control. Such a result is very attractive, as no coke formation is extremely desirable, mainly for economic reasons [57]. This suggests that the HDC could potentially be run at higher temperatures, in order to improve upgrading, without risking conversion to low quality coke product and/or catalyst deactivation.

2.3.3. Catalyst Performance at High H2 Pressure

The high-pressure raw drill cuttings HDC run showed relatively undesirable performance with a gas yield of 12 wt.%, and a total liquid yield of 66.9 wt.%, in line with the high-pressure HDC control. A comparison between low and high-pressure raw drill cuttings HDC runs show that further addition of H2 to the system had a negligible effect, suggesting that the drill cuttings on its own is unable to utilize the H2 effectively in dehydrogenation/hydrogenation reactions as it is lacking the necessary metallic sites. Unlike raw drill cuttings, supported drill cuttings showed a significant increase in performance with increasing H2 pressure. Similar to the low-pressure runs, a TI yield of 0.2 ± 0.1 wt.% is considered negligible. Additionally, the gas yield was only 5.9 ± 1.5 wt.%, leading to a very high liquid yield of 74.8 ± 2.3 wt.%. Most likely, at high H2 pressure, supported drill cuttings catalyst was able to utilize the H2 present in the reactor at a faster rate, as diffusion rates became higher with an increased presence of H2 within in the reactor. This is reflected in the C1–C3 gas yield of the high-pressure HDC supported drill cuttings run, compared to the low-pressure HDC supported drill cuttings run.

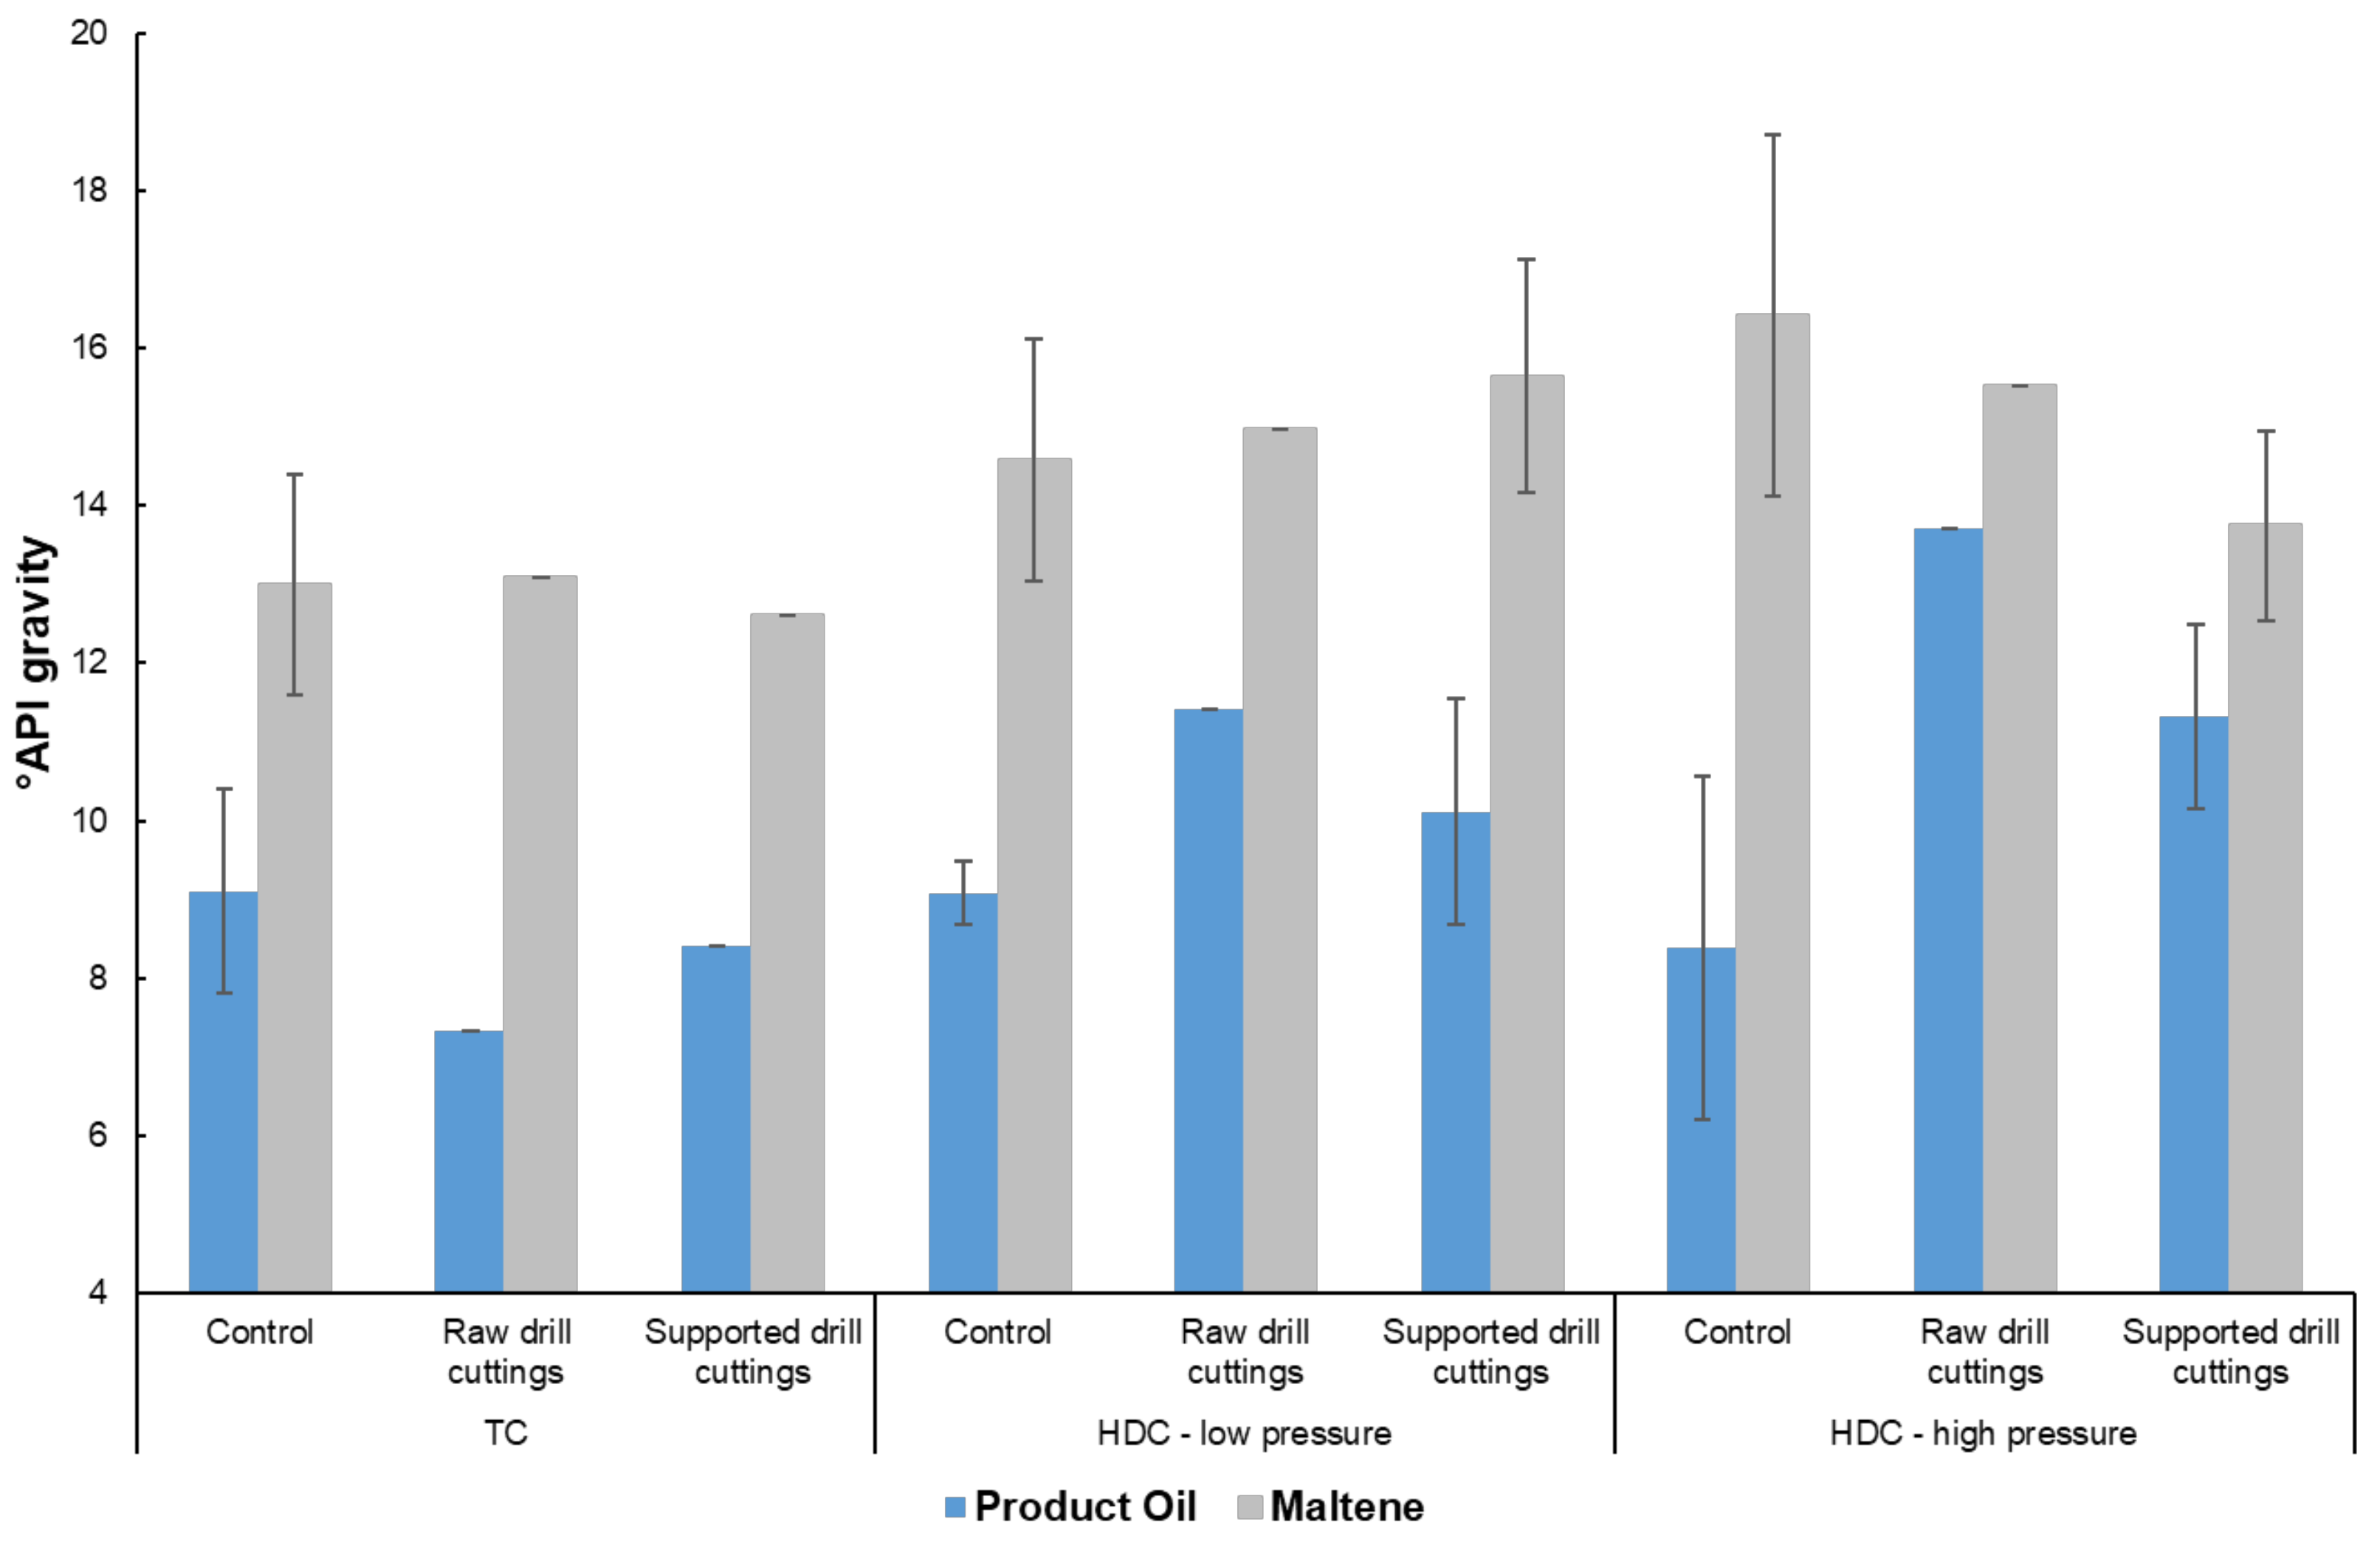
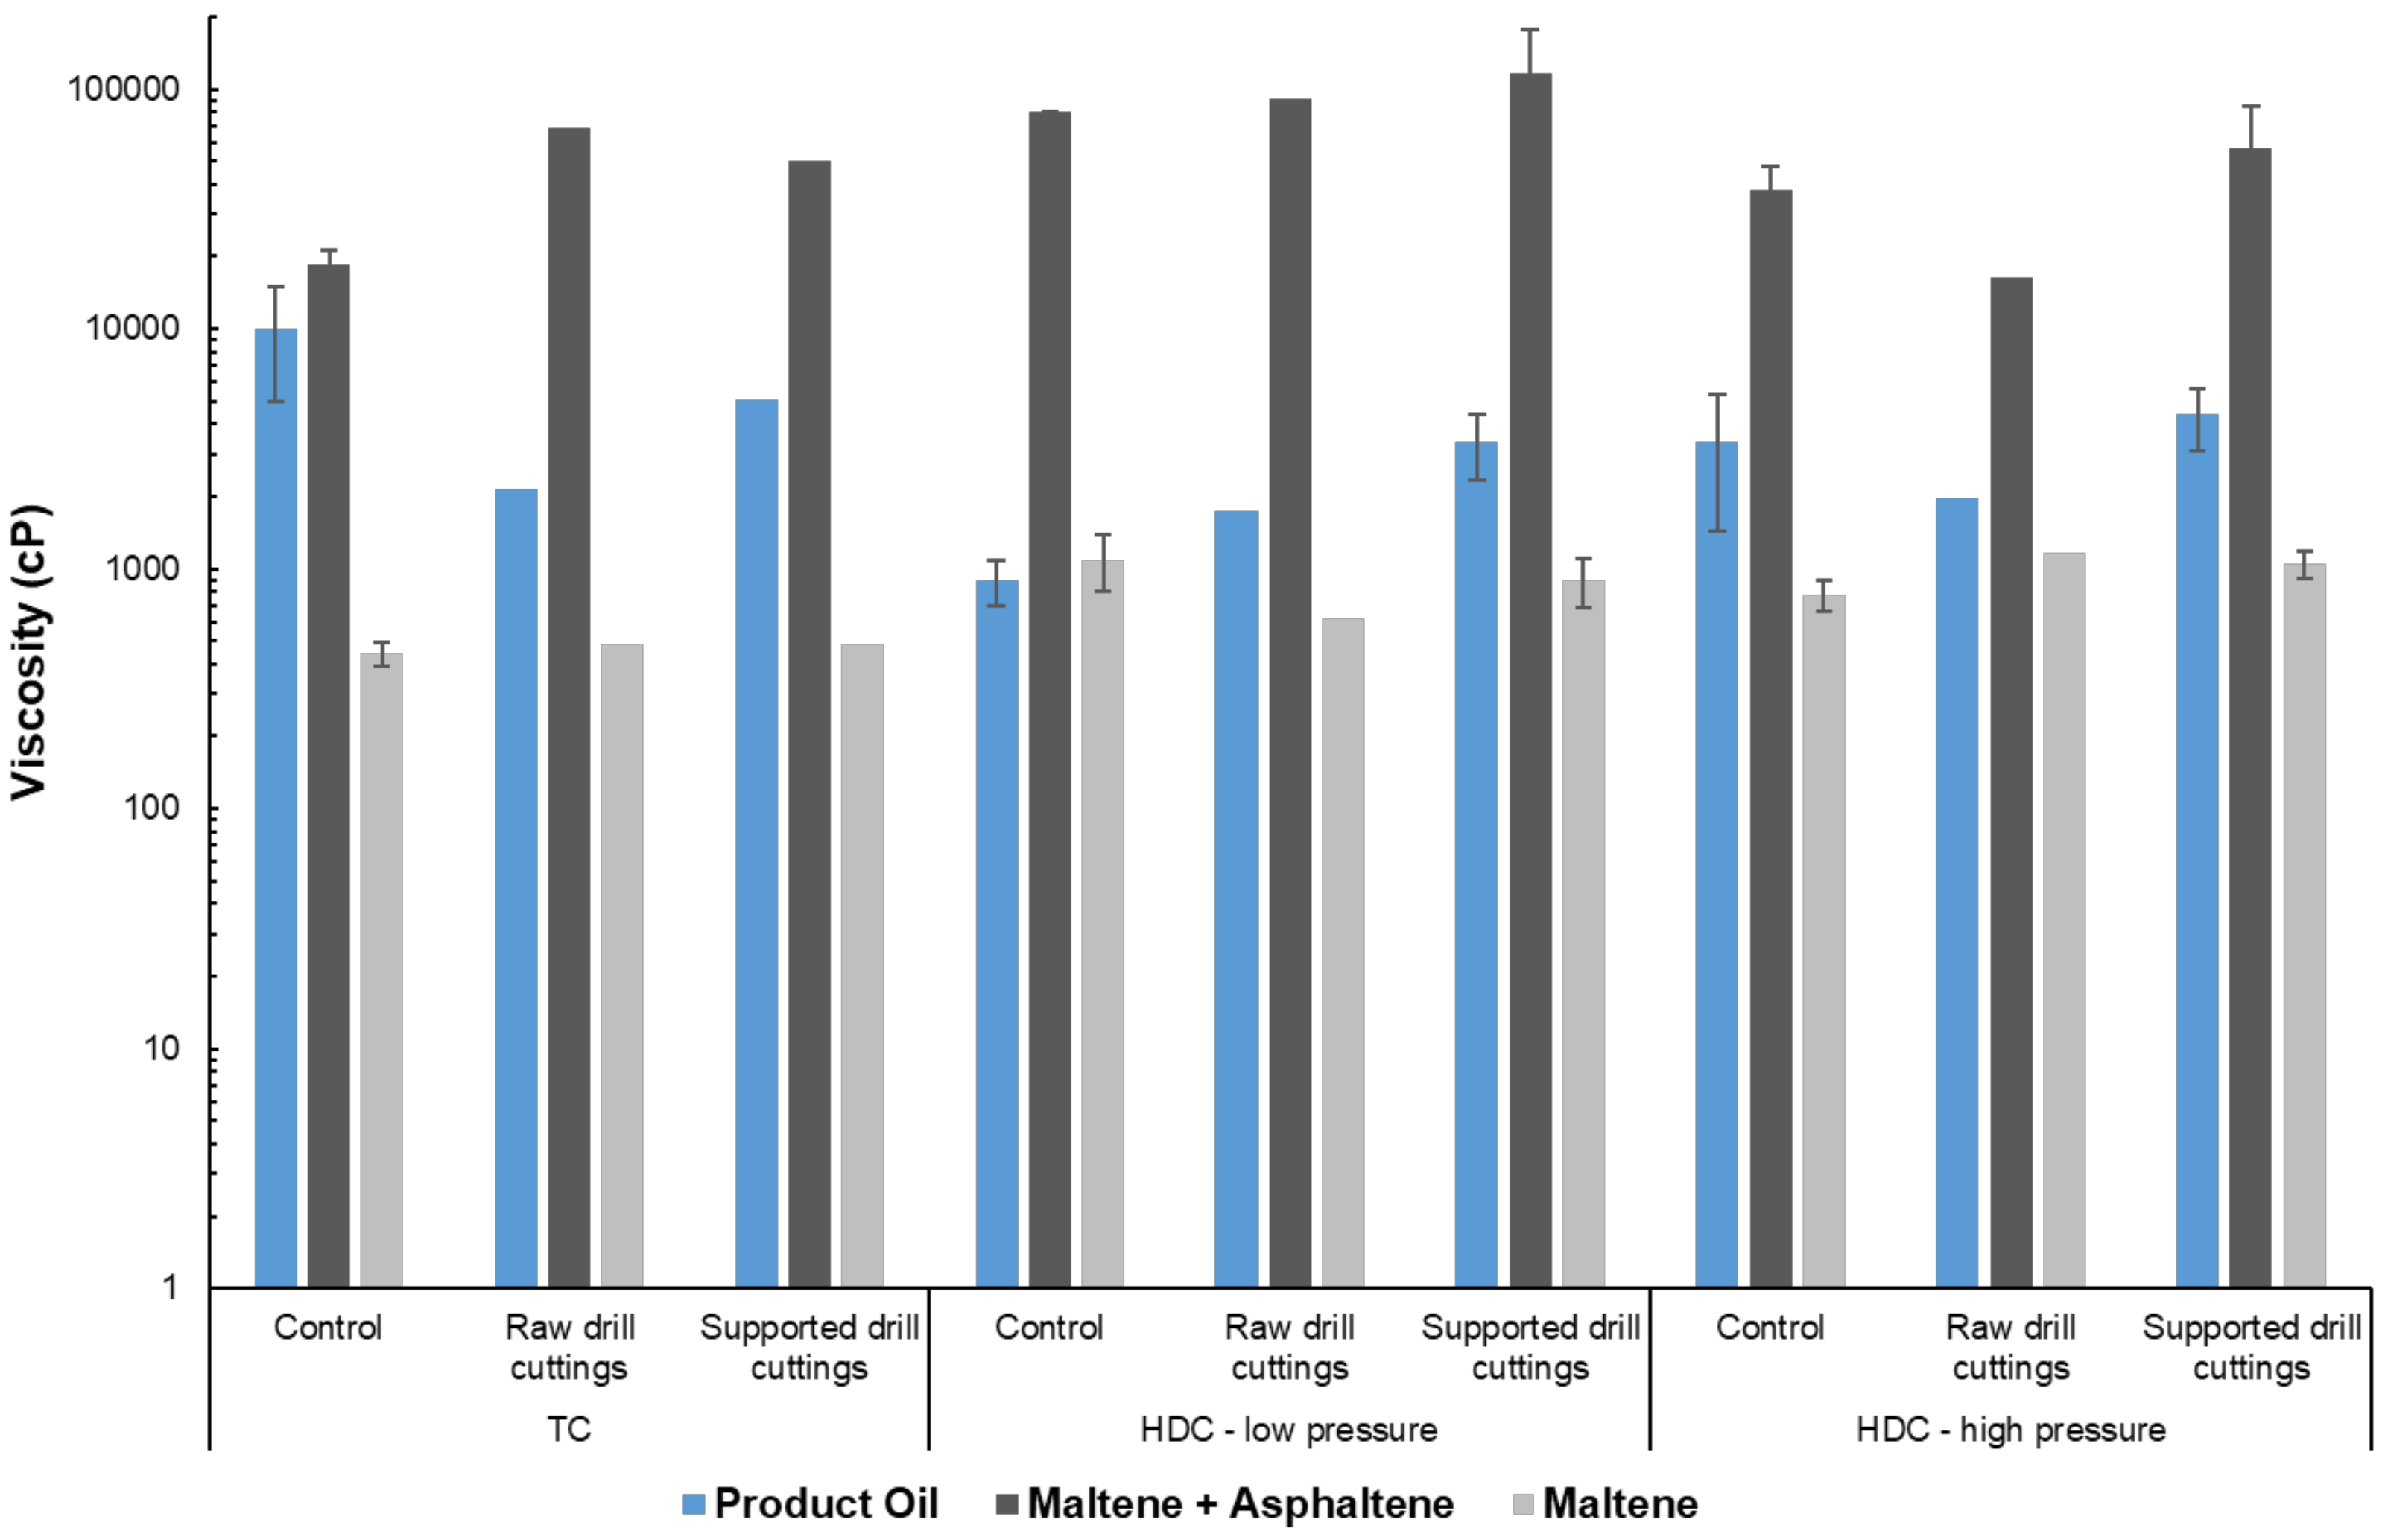
2.4. Product Quality

Figure 8 presents the viscosity measurements at 37 °C of the product oil, maltene-asphaltene and maltene fractions, while °API gravity measurements at 24 °C of the product oil as well as maltene fraction, are shown in Figure 9. High temperature simulated distillation curves for the product oil, from select runs, with distillation cut points shown as volatiles (<n-C10, T < 175 °C), medium range distillates (n-C10-n-C20, 175 °C < T < 350 °C), high boiling point distillates (n-C20-n-C44, 350 °C < T < 545 °C) and residue (>n-C44, T > 545 °C) [58,59] are presented in Figure 10. In order to exclude the effect of sample ageing, the volatile yield between Figure 7 and 10 was synced by shifting the simulated distillation curves accordingly. Table 4 shows the mass distilled in terms of the different cuts shown in. Table 5 presents the calculated residue conversion for the selected product oil samples.

2.4.1. Control Experiments

Between the control runs, the non-catalytic TC had the highest product oil viscosity of 1.0 × 10⁴ ± 0.5 × 10⁴ cP. On the other hand, the °API gravity of the product oil was 9.1 ± 1.3, in line with other control runs. This suggests that the viscosity and °API gravity results are not necessarily directly correlated. Such an effect could be caused by dissolved gases or solids being present in the sample during viscosity measurement [56]. However, the effect of dissolved gases would not necessarily translate to °API gravity measurement, where the sample is first dissolved in toluene, allowing any gases present in the sample to escape. This discrepancy between the two measurements has been reported in our previous work employing the same methodology [36]. In comparison to the TC control, the TC raw drill cuttings and TC supported drill cuttings runs showed a greater extent of viscosity reduction from the feed, resulting in a product oil viscosity of 2.5 × 10³ and 5.1 × 10³ cP, respectively. Thus, the raw drill cuttings had a role in producing lighter, short chain components. Such a result is reflected in Figure 7, where the volatiles yields of the TC raw drill cuttings and supported drill cuttings runs were higher than that of the TC control runs. Addition of H2 into the system during upgrading further reduced the viscosity of the product oil as seen by the low and high-pressure HDC control runs in comparison to the TC control run. The higher fraction of lighter cuts could most likely be attributed to the radical capping mechanism of hydrogen [57]. This result is in agreement with the data in Table 4, as light, yet un-condensable components were more numerous for the HDC runs compared to the TC runs.
High temperature simulated distillation curves for the TC control, low-pressure HDC control and low and high-pressure HDC supported drill cuttings runs are shown in Figure 10. TC control only had 34% residue conversion, versus 43% for the control HDC at low-pressure, as reported in Table 7. The higher residue conversion is in agreement with the trend of the viscosity results, showing the greater extent of upgrading with HDC.
The maltene-asphaltene viscosities show a substantial increase, up to 200 times, from the product oil in all cases. The extent of increase is likely linked to the asphaltene yield of the sample, as well as losses of volatiles experienced during solvent evaporation. Asphaltenes have a very strong effect on heavy oil viscosity, and the concentration of asphaltenes increase upon loss of the volatile components [58,59,60,61,62]. For example, the TC raw drill cuttings and supported drill cuttings runs had a higher maltene-asphaltene viscosity than the TC control run, as the asphaltene yield was higher for those runs coupled with higher total losses.
The viscosity and °API gravity of the maltene fraction between the TC runs was comparable, in the range of 500 cP and 13, respectively. Thus, the major differences between the liquid of catalytic and non-catalytic TC was due to the volatile, TI and asphaltene fractions still being present in the product oil, as seen in the product oil quality measurements. Low and high H2 pressure HDC control runs showed a maltene viscosity of 1000 cP and 800 cP and a °API gravity of 14 and 16, respectively, suggesting that H2 helped in forming more branched liquid products, impeding shear-induced alignment [63], and therefore increased viscosity to a slightly higher extent than TC, while still maintaining lower density.

2.4.2. Catalyst Performance at Pow H2 Pressure

Low-pressure HDC raw drill cuttings and supported drill cuttings runs had a product oil viscosity of 1.8 × 10³ and 3.4 × 10³ ± 1.0 × 10³ cP, respectively, higher than that of the low-pressure HDC control. This could be due to the presence of drill cuttings fines during viscosity measurement, as dispersed fine solids are known to have a negative impact on fluid viscosity [60]. The °API gravity of 11 and 10 ± 1.4 for the low-pressure HDC raw drill cuttings and supported drill cuttings, respectively, on the other hand, showed some improvement relative to the control run, despite the presence of dispersed drill cuttings. Thus, more light components were most likely formed during the catalytic HDC reactions. This result is further supported by Figure 10 and Table 4, where the conversion of the residue for the low-pressure HDC supported drill cuttings was 56%, highest out of all of the runs. The flat line trend observed at the start of the simulated distillation curve is attributed to various light components such as naphtha [61]. Additionally, the results in Table 4 show that the difference in light components stems from the different volatile yields between the various runs. Therefore, for low-pressure HDC, not only was the coke yield minimized but the conversion of heavy components present in the feed was maximized by the presence of supported drill cuttings.
The quality of the maltene fraction for the low-pressure HDC raw drill cuttings and supported drill cuttings runs show little improvement over the control in terms of viscosity and °API gravity. The viscosities were 600 cP and 900 cP, whereas the °API gravity measurements were 15 and 16, respectively. Similar to TC, it is possible that the difference in volatiles, TI and asphaltene fractions accounted for the majority of the differences seen in the quality of the product oil.

2.4.3. Catalyst Performance at High H2 Pressure

As with the catalytic low-pressure HDC run, the catalytic high-pressure HDC did not show significant improvement in the quality of the product oil over control or low-pressure runs. The viscosities and °API gravities of the product oil were 1.9 × 10³ cP, 13.7 and 4.4 × 10³ ± 1.2 × 10³ cP, 11.3 ± 1.2, respectively. The residue conversion of the high-pressure HDC supported drill cuttings run was 54%, in line with the supported drill cuttings at low-pressure. Additionally, as seen in Table 4, the percentages of the various distillate cuts were about the same between the low and high-pressure HDC supported drill cuttings runs. Interestingly, while the quality of the product oil remained the same compared to low-pressure runs, the liquid yield significantly increased at higher pressures, as seen in Figure 7. Typically, a trade-off occurs between liquid quality and yield during upgrading [49,62,63], however this was not the case with the low and high-pressure HDC supported drill cuttings runs. The sulfur and Conradson carbon residue (CCR) content of the feed, TC and high-pressure HDC in the presence of the supported drill cuttings can be found in Table 6. A 20% reduction in sulfur is obtained from the feed, however no improvement is seen over the control TC sample in presence of supported drill cuttings. Thus, while high-pressure HDC in the presence of supported drill cuttings was effective, the desulfurization activity was mainly limited to TC reactions. It is likely that hydrodesulfurization was limited due to insufficient pressures, as pressure of 750–1500 psi are required for typical hydrotreating processes [5]. On the other hand, hydrogenation still took place to a significant extent, as the CCR content of the HDC product, 21.2 wt.%, was much lower than of TC, 29.7%. An increase in CCR from the feed even under HDC conditions suggests that thermal and catalytic cracking are still very prominent in the system, as also concluded from the energy profiles for TC and HDC of Figure 5, suggesting similarity of major reactions between the two processes.
Similar to the product oil, and as seen with the low-pressure results, the quality of the maltene did not significantly improve between high-pressure control and catalytic HDC runs. Again, this likely suggests that differences in the product oil quality were most likely due to the volatile fractions, rather than the composition of the maltene, despite the higher maltene yield as seen in the high-pressure HDC supported drill cuttings runs.

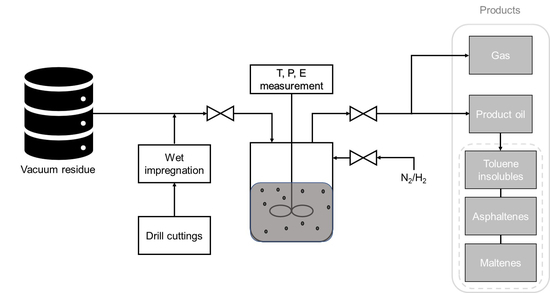
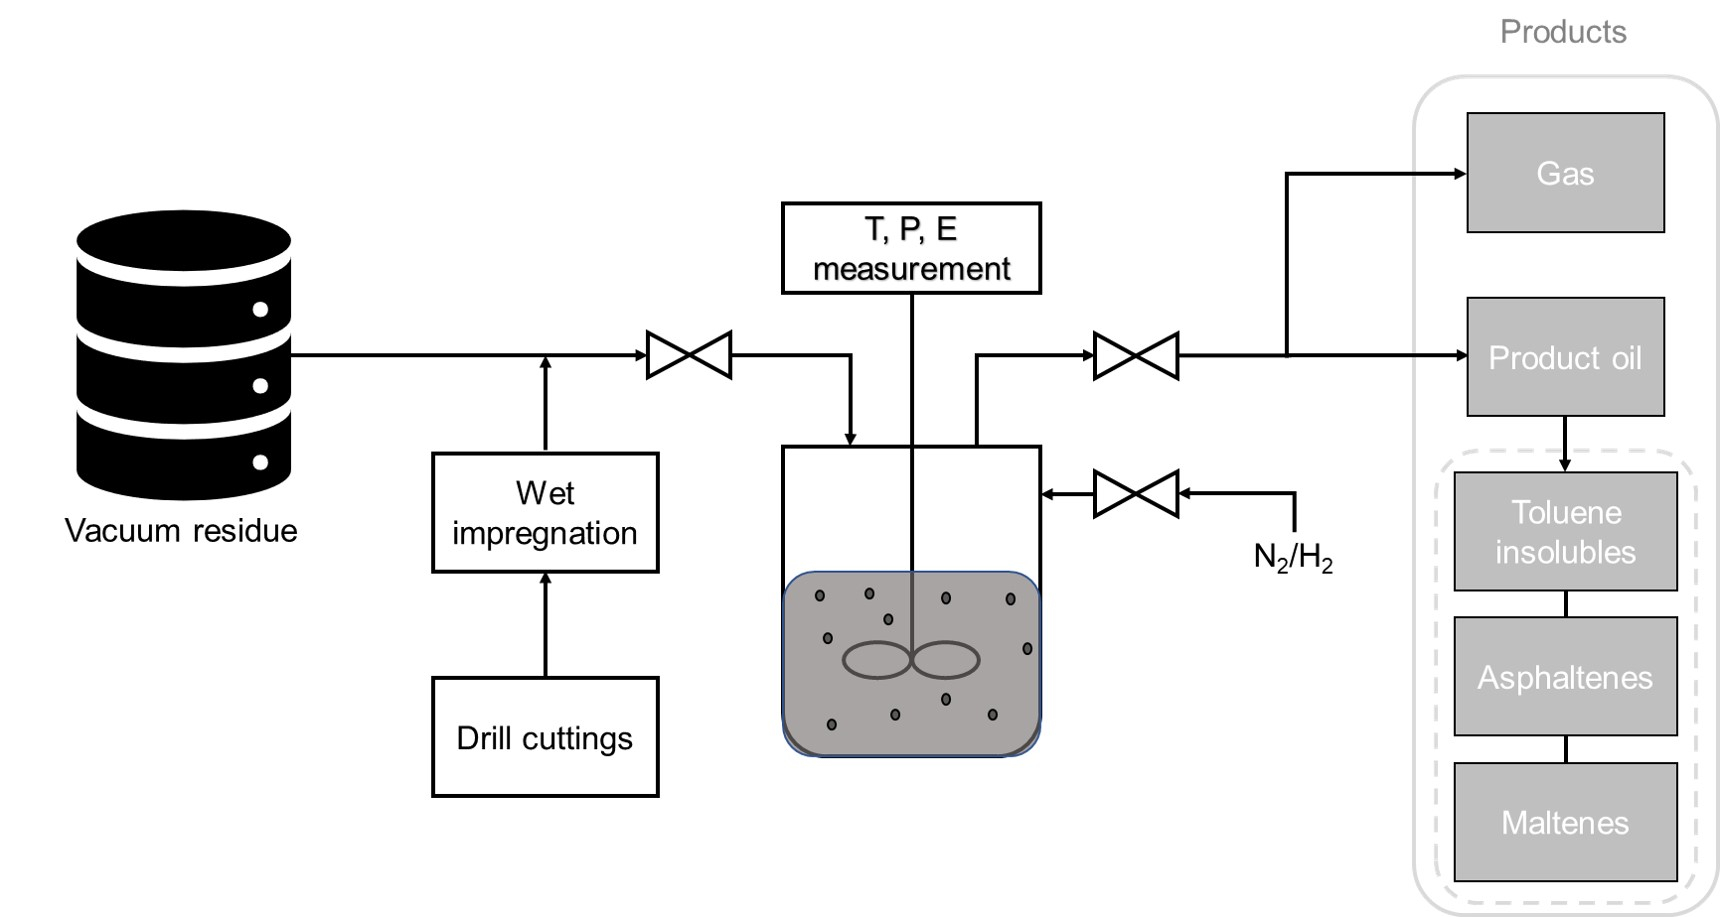
3. Materials and Methods

3.1. Materials

The reactor for HDC runs was purged using H2 (99% purity, Praxair Specialty Gas & Equipment, Calgary, AB, Canada), while for TC runs, N2 was used (99% purity, Praxair Specialty Gas & Equipment, Calgary, AB, Canada). TI and asphaltene fractions were separated out of the product oil by mixing with toluene (BDH 99.8%, Edmonton, VWR, Canada) and n-heptane (BDH technical, Edmonton, VWR, Canada), as detailed below.

3.2. Catalyst Preparation and Characterization

Sandstone-based drill cuttings were received from Executive Mat Service (Calgary, AB, Canada). The drill cuttings were bathed in water and then dried for 12 h. A 355 µm sieve was used to screen the drill cuttings, and only the fraction with diameter <355 µm, henceforth termed raw drill cuttings, was used for upgrading and further modification. Supported drill cuttings were prepared by wet impregnation, as detailed elsewhere [64]. A mass of 22.50 g of drill cuttings was added to a beaker containing 500 mL deionized water. Masses of 0.80 g of nickel(II) nitrate hexahydrate (Sigma-Aldrich, 99.99% purity, Toronto, ON, Canada) and 3.3 g of ammonium heptamolybdate (Sigma-Aldrich, 99.98% purity) were then added to the drill cuttings-water slurry to obtain a typical 3 wt.% Ni/12.5 wt.% Mo concentration on the catalyst [65]. It should be noted that optimizing the hydrocracking performance of the catalyst through manipulating the mass ratio of the metals was out of the scope of this study. Therefore, we adopted optimum mass ratio between Ni and Mo reported in the literature for effective hydrocracking catalysts [65,66,67,68,69]. A magnetic stirrer was used to stir the solution at 40 °C for 1 h, and then the water was evaporated by heating in an oven at 120 °C for 24 h. The impregnated drill cuttings were collected and calcined in a 100 mL Parr reactor at 400°C for 2 h under constant air flow. A control version of the drill cuttings catalyst was prepared using the above methodology excluding the addition of nickel (II) nitrate hexahydrate and ammonium heptamolybdate into the deionized water-drill cuttings slurry. These control drill cuttings were only used for comparison to the supported drill cuttings for catalyst characterization. A summary of the types of drill cuttings used in this work is shown in Table 7 below.
Morphology of the control and impregnated drill cuttings was analyzed using scanning electron microscopy (SEM) (Quanta FEG 250, FEI inc., Calgary, AB, Canada). Additionally, energy-dispersive X-ray spectroscopy (EDX) provided elemental analysis of the drill cuttings catalyst surface using a Quantax 5030 (Bruker, Calgary, AB, Canada). N2 adsorption carried out at −196 °C was used to evaluate the surface area of the drill cuttings catalysts. The drill cuttings catalysts were initially degassed at a temperature of 150 °C under a N2 atmosphere overnight, before running adsorption experiments. The drill cuttings catalysts were then introduced into a Micromeritics surface area analyzer (TriStar 2000, Micromeritics Instrument Corporation, Norcross, GA, USA). Surface area of the drill cuttings samples was calculated using Brunauer-Emmet-Teller (BET) equation. The Barrett-Joyner-Halenda (BJH) method was used to calculate the total pore volume of the drill cuttings, using N2 uptake values at a relative pressure (P/P0) of 0.99. Drill cuttings acid site characterization was collected on an Agilent Cary 630 Fourier-transform infrared spectroscopy (FT-IR) at ambient conditions. First, dry drill cuttings catalysts were introduced and analyzed. After obtaining dry spectra, pyridine was introduced onto the drill cuttings catalyst samples, and FT-IR spectra were recollected in order to identify any acid sites present.

4.3. Feed Preparation

Upgrading runs used de-fined AVR as the feedstock. Fines were separated out of the AVR, potentially avoiding some catalytic effect due to the fines [44]. A gravity convection oven (model: DX300, Yamato Scientific America Inc., Santa Clara, CA, USA) was used to heat the AVR up to 190 °C for 30 min, reducing viscosity substantially, allowing transfer into the reactor. The AVR was homogenized by mixing with a metal rod. Next, the AVR was de-fined by dissolving in toluene at a 1:40 v/v ratio, and fines were separated with 25 µm VWR filter paper. Finally, a rotary evaporator (model: Hei-Vap value digital HL/G3, Heidolph Instruments GmbH & Co. KG, Schwabach, Germany) operating at 93 °C and 2 psi evaporated the toluene out of the toluene-oil system. After observing the final drop of toluene in the condenser, the AVR feed was allowed to dry for 5 min, before it was collected. Table 8 presents the major properties of the AVR feed.

3.4. Upgrading

Upgrading runs were performed in a batch mode, allowing the gases to build up during the reaction. The feedstock and catalyst, when applicable, totaling 50.0 g, were introduced into a 100 mL Parr reactor (1.3 in. i.d. and 4.6 in. length, 4590 Micro Bench Top Reactor, Parr Instrument Company, Moline, IL, USA). Raw drill cuttings or supported drill cuttings catalyst sample of 5.0 g was mixed with the feed in order to obtain a 10 wt.% (100,000 ppm) concentration, as per the optimum concentration determined earlier by our group [39]. The reactor was surrounded by an electric heating jacket, which was wired to the digital control unit. For HDC runs, the reactor was initially purged using H2 at ambient conditions for 3 min, and then pressurized to either 70 or 365 psi, for low and high-pressure runs, respectively. For TC runs, reactor purging was accomplished using N2 for 3 min. No pressure build-up was allowed during purging, and all inlets and outlets were closed upon purge completion. The pressure was closely monitored for 5 min, to ensure no leakage present in the system, after which heating commenced at a set rate of 25 °C min-1. Energy usage, temperature, and pressure were monitored and recorded every 5 min using the control unit. A DI-50E meter (Electro-Meters Company Ltd., Calgary, AB, Canada) was used to measure energy consumption by placing it in series with the heating jacket and controller. Mixing at a rate of 500 rpm commenced once a temperature of 120 °C was achieved within the reactor. Our previous work showed that absence of mixing during catalytic thermal cracking of Athabasca VR led to excessive formation of toluene insolubles. This observation was attributed to mass transfer limitation of hydrogen donors to the adsorbed coke precursors as well as improper heat transfer and temperature distribution caused by the settled drill cuttings particles. Reaction time for upgrading was considered starting at a temperature of 300 °C, and then left to run for 1 h. At the end of the reaction, gases were collected for sampling when applicable, and then the reactor was quenched using cold water. After quenching, the reactor was cooled in ambient conditions to 24 °C, after which the pressure due to any leftover uncondensed gases was recorded. These gases were then carefully vented out of the reactor by slightly opening the outlet valve. The reactor was then removed from the apparatus and weighed. The gas yield was taken to be the discrepancy between the starting and final mass of oil present in the reactor. More in-depth procedures on the TC control runs are detailed in our group’s previous work [44].

3.5. Product Characterization

The hydrocarbon components of the product gas samples were investigated using gas chromatography (Model: Varian-3900 GC, Varian Inc., Palo Alto, CA, USA). The liquid product was collected out of the reactor, and a sample was taken. The viscosity at 37 °C and °API gravity at 24 °C were measured using a Brookfield digital viscometer (Model: LVDV-1 PRIME, Brookfield Engineering Laboratories Inc., Middleboro, MA, USA), and a specific gravity bottle (Thomas Scientific, Swedesboro, NJ, USA), respectively. The collected liquid product was then mixed with toluene at a 1:40 v/v ratio and filtered with 25 µm VWR filter paper to reject any TI present in the system, including the drill cuttings catalyst. The filters containing the TI solids were washed continuously using toluene up to the point where the filtrate did not display any color. Next, the filter cake was then allowed to dry after which it was weighed and collected for TI characterization. The mass of TI was calculated as the difference in mass between the material collected on the filter paper and the mass of drill cuttings originally added to the feed, under the assumption that all the drill cuttings precipitated out upon addition of toluene. Toluene was evaporated out of the toluene-oil mixture using a rotary evaporator operating at a temperature and pressure of 93 °C and 2 psi, respectively. Some volatiles were permanently lost from the oil system during the evaporation of solvent. A comparison of the mass of the oil pre and post evaporation accounted for the lost mass in the volatiles. Viscosity at 37 °C was then measured for the remaining maltene-asphaltene fraction. The asphaltenes were rejected out of the maltene-asphaltene system by solubilizing with n-heptane at a 1:40 v/v ratio and filtering with 25 µm VWR filter paper. Solids left on the filter paper were washed continuously using n-heptane until, as with the TI filtration, the filtrate did not display any color. Next, the filter cake was dried and weighed, and a sample was collected for characterization of the asphaltene fraction. The rotary evaporator operating at the same conditions described above was used to remove any n-heptane present in the filtrate, and any remaining volatiles that escaped the oil at this point were accounted for again by comparing the initial and final masses of the evaporating system. Finally, the leftover maltene fraction’s viscosity at 37 °C and °API gravity at 24 °C was measured. To obtain 95% confidence intervals, three replicates were carried out for 55% of runs. For selected experiments, distillation cuts of the collected product oil were determined using high-temperature simulated distillation (Agilent GC, Calgary, AB, Canada) following the ASTM D7169-2005 method. Conversion of residual components, with boiling pointer > 545 °C+, is of interest in assessing the effectiveness of upgrading and was obtained as follows [44]:
conv545 = (wt.%, feed545 − wt.%, product oil545)/wt.%, feed545,
Total sulfur content of the feed and upgraded oil samples was measured using a Trace Sulfur Analyzer Model TS-100 (Mitsubishi Chemical Analytech Co. LTD, Yamato, Japan). CCR content of select product oil samples was determined using thermogravimetric analysis, following a procedure outline by Cardillo & Galtieri [70].

4. Conclusions

HDC of AVR was carried out at both low and high H2 pressure of 70 and 365 psi, respectively, at 400 °C in an autoclave. Drill cuttings (drill cuttings) and Ni-Mo-supported drill cuttings (supported drill cuttings) at 10 wt.% were compared as slurry type catalysts. The supported drill cuttings were prepared using wet impregnation, and the distribution of Ni-Mo on the surface was monitored. SEM imaging and EDX mapping confirmed a uniform distribution of elements on the surface of the supported drill cuttings, suggesting higher likelihood of uniform distribution of acidic and metallic sites. Surface area evaluation using BET equation confirmed higher surface area of the supported drill cuttings catalyst. Control HDC and TC runs were provided to better evaluate the effectiveness of the drill cuttings catalysts. Temperature and cumulative energy profiles were found to be very similar for TC and HDC, suggesting high overlap between major endothermic reactions occurring in both kinds of upgrading. All runs showed a steady increase in pressure over time during upgrading, however, at higher pressures the supported drill cuttings was found to dramatically increase the hydrogen consumption rate. The higher hydrogen consumption translated into very high liquid yield of ~75 wt.%, compared with other experiments. Additionally, the coke yield was negligible, and the residue conversion was maximized, ~55%, for both the low and the high-pressure HDC runs with supported drill cuttings. Product oil quality for the catalytic HDC runs in terms of viscosity and °API gravity was similar to the respective control runs. Accordingly, HDC provided a higher extent of upgrading than TC, especially with the presence of the drill cuttings catalysts, as confirmed by the percent conversion of residue and the yield of the product liquid. Additionally, increase in CCR content from the feed was minimal under HDC conditions, in comparison to TC. However, hydrodesulfurization was not more pronounced for HDC compared to TC, most likely due to insufficient H2 pressures.

Supplementary Materials

The following are available online at https://www.mdpi.com/2073-4344/9/3/00216/s1, Table S1: Literature review on hydrocracking and slurry hydrocracking of VR.

Author Contributions

Conceptualization, T.K. and M.H.; methodology, T.K. and M.H.; validation, T.K and Q.S.; formal analysis, T.K.; investigation, T.K.; resources, M.H.; writing—original draft preparation, T.K.; writing—review and editing, T.K., M.H. and Q.S.; supervision, M.H.; funding acquisition, M.H.

Funding

This research was funded by Natural Sciences and Engineering Research Council of Canada (NSERC).

Conflicts of Interest

The authors declare no conflict of interest.

Abbreviations

The following abbreviations are used in the article:
AVRAthabasca vacuum residue
BASBronsted acid sites
CCRConradson carbon residue
HDCHydrocracking
LASLewis acid sites
TCThermal cracking
TIToluene insolubles

References

  1. Owen, N.A.; Inderwildi, O.R.; King, D.A. The status of conventional world oil reserves-Hype or cause for concern? Energy Policy 2010, 38, 4743–4749. [Google Scholar] [CrossRef]
  2. Shah, A.; Fishwick, R.; Wood, J.; Leeke, G.; Rigby, S.; Greaves, M. A review of novel techniques for heavy oil and bitumen extraction and upgrading. Energy Environ. Sci. 2010, 3, 700. [Google Scholar] [CrossRef]
  3. Raseev, S. Thermal and Catalytic Processes in Petroleum Refining; CRC Press: Boca Raton, FL, USA, 2003; Volume 2004, ISBN 0-8247-0952-7. [Google Scholar]
  4. Vernon, L.W. Free radical chemistry of coal liquefaction: Role of molecular hydrogen. Fuel 1980, 59, 102–106. [Google Scholar] [CrossRef]
  5. Valavarasu, G.; Bhaskar, M.; Balaraman, K.S. Mild Hydrocracking—A Review of the Process, Catalysts, Reactions, Kinetics, and Advantages. Pet. Sci. Technol. 2003, 21, 1185–1205. [Google Scholar] [CrossRef]
  6. Zachariah, A.; Wang, L.; Yang, S.; Prasad, V.; De Klerk, A. Suppression of coke formation during bitumen pyrolysis. Energy Fuels 2013, 27, 3061–3070. [Google Scholar] [CrossRef]
  7. Ward, J.W. Hydrocracking processes and catalysts. Fuel Process. Technol. 1993, 35, 55–85. [Google Scholar] [CrossRef]
  8. Vázquez, M.I.; Escardino, A.; Aucejo, A. Hydrocracking of n-heptane with a NiO-MoO3/HYUS zeolite as catalyst. Kinetic study. Can. J. Chem. Eng. 1988, 66, 313–318. [Google Scholar] [CrossRef]
  9. Alsobaai, A.M.; Zakaria, R.; Hameed, B.H. Gas oil hydrocracking on NiW/USY catalyst: Effect of tungsten and nickel loading. Chem. Eng. J. 2007, 132, 77–83. [Google Scholar] [CrossRef]
  10. Rezgui, Y.; Guemini, M. Effect of acidity and metal content on the activity and product selectivity for n-decane hydroisomerization and hydrocracking over nickel-tungsten supported on silica-alumina catalysts. Appl. Catal. A Gen. 2005, 282, 45–53. [Google Scholar] [CrossRef]
  11. Mohanty, S.; Kunzru, D.; Saraf, D.N. Hydrocracking: A review. Fuel 1990, 69, 1467–1473. [Google Scholar] [CrossRef]
  12. Menoufy, M.F.; Ahmed, H.S.; Betiha, M.A.; Sayed, M.A. A Comparative study on hydrocracking and hydrovisbreaking combination for heavy vacuum residue conversion. Fuel 2014, 119, 106–110. [Google Scholar] [CrossRef]
  13. Francis, J.; Guillon, E.; Bats, N.; Pichon, C.; Corma, A.; Simon, L.J. Design of improved hydrocracking catalysts by increasing the proximity between acid and metallic sites. Appl. Catal. A Gen. 2011, 409–410, 140–147. [Google Scholar] [CrossRef]
  14. Maxwell, I.E. Zeolite catalysis in hydroprocessing technology. Catal. Today 1987, 1, 385–413. [Google Scholar] [CrossRef]
  15. Song, C.; Nihonmatsu, T.; Nomura, M. Effect of Pore Structure of Ni–Mo/Al2O3 Catalysts in Hydrocracking of Coal Derived and Oil Sand Derived Asphaltenes. Ind. Eng. Chem. Res. 1991, 30, 1726–1734. [Google Scholar] [CrossRef]
  16. Corma, A.; Martínez, A.; Martínez-Soria, V.; Montón, J.B. Hydrocracking of vacuum gasoil on the novel mesoporous MCM-41 aluminosilicate catalyst. J. Catal. 1995, 153, 25–31. [Google Scholar] [CrossRef]
  17. Sahu, R.; Song, B.J.; Im, J.S.; Jeon, Y.P.; Lee, C.W. A review of recent advances in catalytic hydrocracking of heavy residues. J. Ind. Eng. Chem. 2015, 27, 12–24. [Google Scholar] [CrossRef]
  18. Puron, H.; Pinilla, J.L.; de la Fuente, J.A.; Millan, M. Effect of Metal Loading in NiMo/Al2O3 Catalysts on Maya Vacuum Residue Hydrocracking. Energy Fuels 2017, 31, 4843–4850. [Google Scholar] [CrossRef]
  19. Manek, E.; Haydary, J. Hydrocracking of vacuum residue with solid and dispersed phase catalyst: Modeling of sediment formation and hydrodesulfurization. Fuel Process. Technol. 2017, 159, 320–327. [Google Scholar] [CrossRef]
  20. Kim, D.-W.; Jeon, P.R.; Moon, S.; Lee, C.-H. Upgrading of petroleum vacuum residue using a hydrogen-donor solvent with acid-treated carbon. Energy Convers. Manag. 2018, 161, 234–242. [Google Scholar] [CrossRef]
  21. Yang, T.; Liu, C.; Meng, H.; Qin, Y.; Deng, W.; Niu, Q. Molybdenum Dialkyldithiophosphate as self-sulfurized catalyst precursor in Hydrocracking of Residue. In Proceedings of the IOP Conference Series: Earth and Environmental Science; 2018; Volume 170, p. 22036. [Google Scholar]
  22. Kim, S.H.; Kim, K.D.; Lee, Y.K. Effects of dispersed MoS2 catalysts and reaction conditions on slurry phase hydrocracking of vacuum residue. J. Catal. 2017, 347, 127–137. [Google Scholar] [CrossRef]
  23. Kim, S.H.; Kim, K.D.; Lee, D.; Lee, Y.K. Structure and activity of dispersed Co, Ni, or Mo sulfides for slurry phase hydrocracking of vacuum residue. J. Catal. 2018, 364, 131–140. [Google Scholar] [CrossRef]
  24. Hur, Y.G.; Lee, D.W.; Lee, K.Y. Hydrocracking of vacuum residue using NiWS(x) dispersed catalysts. Fuel 2016, 185, 794–803. [Google Scholar] [CrossRef]
  25. Rana, M.S.; Sámano, V.; Ancheyta, J.; Diaz, J.A.I. A review of recent advances on process technologies for upgrading of heavy oils and residua. Fuel 2007, 86, 1216–1231. [Google Scholar] [CrossRef]
  26. Castañeda, L.C.; Muñoz, J.A.D.; Ancheyta, J. Current situation of emerging technologies for upgrading of heavy oils. Catal. Today 2014, 220–222, 248–273. [Google Scholar] [CrossRef]
  27. Demirbas, A.; Bafail, A.; Nizami, A.S. Heavy oil upgrading: Unlocking the future fuel supply. Pet. Sci. Technol. 2016, 34, 303–308. [Google Scholar] [CrossRef]
  28. Zhang, S.; Liu, D.; Deng, W.; Que, G. A review of slurry-phase hydrocracking heavy oil technology. Energy Fuels 2007, 21, 3057–3062. [Google Scholar] [CrossRef]
  29. Nhieu, P.; Liu, Q.; Gray, M.R. Role of water and fine solids in onset of coke formation during bitumen cracking. Fuel 2016, 166, 152–156. [Google Scholar] [CrossRef]
  30. Tanabe, K.; Gray, M.R. Role of fine solids in the coking of vacuum residues. Energy Fuels 1997, 11, 1040–1043. [Google Scholar] [CrossRef]
  31. Gentzis, T.; Rahimi, P.; Malhotra, R.; Hirschon, A.S. Effect of carbon additives on the mesophase induction period of Athabasca bitumen. Fuel Process. Technol. 2001, 69, 191–203. [Google Scholar] [CrossRef]
  32. Ball, A.S.; Stewart, R.J.; Schliephake, K. A review of the current options for the treatment and safe disposal of drill cuttings. Waste Manag. Res. 2012, 30, 457–473. [Google Scholar] [CrossRef] [PubMed]
  33. Gary, J.H.; Handwerk, G.E.; Kaiser, M.J. Petroleum Refining: Technology and Economics; CRC Press: Boca Raton, FL, USA, 2007. [Google Scholar]
  34. Goli, J.; Sahu, O. Development of heterogeneous alkali catalyst from waste chicken eggshell for biodiesel production. Renew. Energy 2018, 128, 142–154. [Google Scholar] [CrossRef]
  35. Jahromi, H.; Agblevor, F.A. Hydrodeoxygenation of pinyon-juniper catalytic pyrolysis oil using red mud-supported nickel catalysts. Appl. Catal. B Environ. 2018, 236, 1–12. [Google Scholar] [CrossRef]
  36. Jahromi, H.; Agblevor, F.A. Hydrodeoxygenation of Aqueous-Phase Catalytic Pyrolysis Oil to Liquid Hydrocarbons Using Multifunctional Nickel Catalyst. Ind. Eng. Chem. Res. 2018, 57, 13257–13268. [Google Scholar] [CrossRef]
  37. Elmes, V.K.; Edgar, B.N.; Mendham, A.P.; Coleman, N.J. Basic metallosilicate catalysts from waste green container glass. Ceram. Int. 2018, 44, 17069–17073. [Google Scholar] [CrossRef]
  38. Marwaha, A.; Rosha, P.; Mohapatra, S.K.; Mahla, S.K.; Dhir, A. Waste materials as potential catalysts for biodiesel production: Current state and future scope. Fuel Process. Technol. 2018, 181, 175–186. [Google Scholar] [CrossRef]
  39. Eshraghian, A.; Husein, M.M. Catalytic thermal cracking of Athabasca VR in a closed reactor system. Fuel 2018, 217, 409–419. [Google Scholar] [CrossRef]
  40. Kaminski, T.; Husein, M.M. Thermal cracking of atmospheric residue versus vacuum residue. Fuel Process. Technol. 2018, 181, 331–339. [Google Scholar] [CrossRef]
  41. Wang, Y.; Lin, H.; Zheng, Y. Hydrotreatment of lignocellulosic biomass derived oil using a sulfided NiMo/γ-Al2O3 catalyst. Catal. Sci. Technol. 2014, 4, 109. [Google Scholar] [CrossRef]
  42. Grilc, M.; Likozar, B.; Levec, J. Hydrotreatment of solvolytically liquefied lignocellulosic biomass over NiMo/Al2O3 catalyst: Reaction mechanism, hydrodeoxygenation kinetics and mass transfer model based on FTIR. Biomass Bioenergy 2014, 63, 300–312. [Google Scholar] [CrossRef]
  43. Kaminski, T.; Anis, S.; Husein, M.M.; Hashaikeh, R. Hydrocracking of Athabasca VR using NiO-WO3 Zeolite Based Catalysts. Energy Fuels 2018, 32, 2224–2233. [Google Scholar] [CrossRef]
  44. Eshraghian, A.; Husein, M.M. Thermal cracking of Athabasca VR and bitumen and their maltene fraction in a closed reactor system. Fuel 2017, 190, 396–408. [Google Scholar] [CrossRef]
  45. Sanaie, N.; Watkinson, A.P.; Bowen, B.D.; Smith, K.J. Effect of minerals on coke precursor formation. Fuel 2001, 80, 1111–1119. [Google Scholar] [CrossRef]
  46. Gosselink, J.W.; Stork, W.H.J. Coping with Catalyst Deactivation in Hydrocracking: Catalyst and Process Development. Ind. Eng. Chem. Res. 1997, 36, 3354–3359. [Google Scholar] [CrossRef]
  47. Eijsbouts, S.; Mayo, S.W.; Fujita, K. Unsupported transition metal sulfide catalysts: From fundamentals to industrial application. Appl. Catal. A Gen. 2007, 322, 58–66. [Google Scholar] [CrossRef]
  48. Husein, M.M.; Alkhaldi, S.J. In Situ Preparation of Alumina Nanoparticles in Heavy Oil and Their Thermal Cracking Performance. Energy Fuels 2014, 28, 6563–6569. [Google Scholar] [CrossRef]
  49. Alkhaldi, S.; Husein, M.M. Hydrocracking of heavy oil by means of in situ prepared ultradispersed nickel nanocatalyst. Energy Fuels 2014, 28, 643–649. [Google Scholar] [CrossRef]
  50. Thommes, M. Physical adsorption characterization of nanoporous materials. Chem. Ing. Tech. 2010, 82, 1059–1073. [Google Scholar] [CrossRef]
  51. Beganskiene, A.; Sirutkaitis, V.; Kurtinaitiene, M.; Juskenas, R.; Kareiva, A. FTIR, TEM and NMR Iinvestigations of Stöber Silica Nanoparticles. Mater. Sci. 2004, 10, 287–290. [Google Scholar]
  52. Contreras, C.A.; Sugita, S.; Ramos, E. Preparation of Sodium Aluminate from Basic Aluminium Sulfate. AZo J. Mater. Online 2006, 2. [Google Scholar] [CrossRef]
  53. Kondo, J.N.; Nishitani, R.; Yoda, E.; Yokoi, T.; Tatsumi, T.; Domen, K. A comparative IR characterization of acidic sites on HY zeolite by pyridine and CO probes with silica–alumina and γ-alumina references. Phys. Chem. Chem. Phys. 2010, 12, 11576. [Google Scholar] [CrossRef] [PubMed]
  54. Corma, A.; Planelles, J.; Sánchez-Marín, J.; Tomás, F. The role of different types of acid site in the cracking of alkanes on zeolite catalysts. J. Catal. 1985, 93, 30–37. [Google Scholar] [CrossRef]
  55. Wielers, A.F.H.; Vaarkamp, M.; Post, M.F.M. Relation between properties and performance of zeolites in paraffin cracking. J. Catal. 1991, 127, 51–66. [Google Scholar] [CrossRef]
  56. Ali, M.A.; Tatsumi, T.; Masuda, T. Development of heavy oil hydrocracking catalysts using amorphous silica-alumina and zeolites as catalyst supports. Appl. Catal. A Gen. 2002, 233, 77–90. [Google Scholar] [CrossRef]
  57. Vilcáez, J.; Watanabe, M.; Watanabe, N.; Kishita, A.; Adschiri, T. Hydrothermal extractive upgrading of bitumen without coke formation. Fuel 2012, 102, 379–385. [Google Scholar] [CrossRef]
  58. Boduszynski, M.M.; Altgelt, K.H. Composition of Heavy Petroleums. 4. Significance of the Extended Atmospheric Equivalent Boiling Point (Aebp) Scale. Energy Fuels 1992, 6, 72–76. [Google Scholar] [CrossRef]
  59. Boduszynski, M.M. Composition of Heavy Petroleums. 1. Molecular Weight, Hydrogen Deficiency, and Heteroatom Concentration as a Function of Atmospheric Equivalent Boiling Point up to 1400 °F (760 °C). Energy Fuels 1987, 1, 2–11. [Google Scholar] [CrossRef]
  60. Czarnecki, J.; Radoev, B.; Schramm, L.L.; Slavchev, R. On the nature of Athabasca Oil Sands. Adv. Colloid Interface Sci. 2005, 114–115, 53–60. [Google Scholar] [CrossRef] [PubMed]
  61. Falla, F.S.; Larini, C.; Le Roux, G.A.C.; Quina, F.H.; Moro, L.F.L.; Nascimento, C.A.O. Characterization of crude petroleum by NIR. J. Pet. Sci. Eng. 2006, 51, 127–137. [Google Scholar] [CrossRef]
  62. Matsumura, A.; Kondo, T.; Sato, S.; Saito, I.; De Souza, W.F. Hydrocracking Brazilian Marlim vacuum residue with natural limonite. Part 1: Catalytic activity of natural limonite. Fuel 2005, 84, 411–416. [Google Scholar] [CrossRef]
  63. Asgharzadeh Shishavan, R.; Ghashghaee, M.; Karimzadeh, R. Investigation of kinetics and cracked oil structural changes in thermal cracking of Iranian vacuum residues. Fuel Process. Technol. 2011, 92, 2226–2234. [Google Scholar] [CrossRef]
  64. Li, D.; Sato, T.; Imamura, M.; Shimada, H.; Nishijima, A. The effect of boron on HYD, HC and HDS activities of model compounds over Ni-Mo/gamma-Al2O3-B2O3 catalysts. Appl. Catal. B Environ. 1998, 16, 255–260. [Google Scholar] [CrossRef]
  65. Sahu, R.; Song, B.J.; Jeon, Y.P.; Lee, C.W. Upgrading of vacuum residue in batch type reactor using Ni-Mo supported on goethite catalyst. J. Ind. Eng. Chem. 2016, 35, 115–122. [Google Scholar] [CrossRef]
  66. Kasztelan, S.; Grimblot, J.; Bonnelle, J.P.; Payen, E.; Toulhoat, H.; Jacquin, Y. Preparation of Co-Mo-γAl2O3 and Ni-Mo-γAl2O3 catalysts by ph regulation of molybdenum solution. characterization of supported species and hydrogenation activities. Appl. Catal. 1983, 7, 91–112. [Google Scholar] [CrossRef]
  67. Pinilla, J.L.; De Fuente, J.A.M.; Milla, M. Hydrocracking of Maya Vacuum Residue with NiMo Catalysts Supported on Mesoporous Alumina and Silica—Alumina Holda Puro n. Energy Fuels 2013, 27, 3952–3960. [Google Scholar]
  68. Hillerová, E.; Vít, Z.; Zdražil, M. Magnesia supported Ni-Mo sulfide hydrodesulfurization and hydrodenitrogenation catalysts prepared by non-aqueous impregnation. Appl. Catal. A Gen. 1994, 118, 111–125. [Google Scholar] [CrossRef]
  69. Salerno, P.; Mendioroz, S.; López Agudo, A. Al-pillared montmorillonite-based NiMo catalysts for HDS and HDN of gas oil: Influence of the method and order of Mo and Ni impregnation. Appl. Catal. A Gen. 2003, 23, 287–297. [Google Scholar] [CrossRef]
  70. Cardillo, P.; Galtieri, A. Determination of the Carbon Residue of Fuel Oils by Means of Thermogravimetry. Riv. Combust. 1987, 41, 1–5. [Google Scholar]
Figure 1. Scanning electron microscope (SEM) images and energy-dispersive X-ray (EDX) mapping of the (a) raw drill cuttings, (b) control drill cuttings, (c) supported drill cuttings, (d) supported drill cuttings after upgrading. Light blue—silicon, yellow—aluminum, green—molybdenum, dark blue—nickel, orange—sulfur.
Catalysts 09 00216 g001
Figure 2. Particle size distribution of raw, control and supported drill cuttings.
Catalysts 09 00216 g002
Figure 3. Curves for N2 adsorption-desorption for the various drill cuttings catalysts.
Catalysts 09 00216 g003
Figure 4. Fourier transform infrared (FT-IR) spectra of drill cuttings (black), drill cuttings containing absorbed pyridine (blue), and pure pyridine (orange). (a) raw drill cuttings, (b) control drill cuttings, (c) supported drill cuttings.
Catalysts 09 00216 g004
Figure 5. Temperature and energy profiles for HDC runs (solid), and their % deviation from thermal cracking (TC) runs (dashed). The time at which the temperature inside the reactor reached 300 °C is denoted by ti.
Catalysts 09 00216 g005
Figure 6. Buildup of pressure for TC and HDC runs. The time at which the temperature inside the reactor reached 300 °C is denoted by ti. The final pressure in the reactor at ambient conditions is denoted by the point at tf. Control (square), raw drill cuttings (triangle), supported drill cuttings (circle).
Catalysts 09 00216 g006
Figure 7. Final yield of various product oil fractions. Total loss is the mass lost during toluene and n-heptane evaporation in the form of volatiles. The pressure was 70 psi and 365 psi for low and high-pressure runs, respectively.
Catalysts 09 00216 g007
Figure 8. Results of viscosity measurement at 37 °C of the product oil, maltene-asphaltene and maltene fractions. The pressure was 70 psi and 365 psi for low and high-pressure runs, respectively.
Catalysts 09 00216 g008
Figure 9. Results of °API gravity measurements at 24 °C for both the product oil and maltene fraction. The pressure was 70 psi and 365 psi for low and high-pressure runs, respectively.
Catalysts 09 00216 g009
Figure 10. Simulated distillation curves for selected TC and HDC runs. The pressure was 70 psi and 365 psi for low and high-pressure runs, respectively. Control (square), raw drill cuttings (triangle), supported drill cuttings (circle). The sections are as follows: Volatiles (1), medium range distillates (2), high boiling point distillates (3), residue (4).
Catalysts 09 00216 g010
Table 1. EDX analysis of the concentration (wt.%) of elements on the surface of supported drill cuttings before and after hydrocracking (HDC).
ElementBefore HDCAfter HDC
Silicon36.937.0
Molybdenum41.746.0
Aluminum11.310.4
Nickel10.14.9
Sulfur0.001.65
Table 2. Brunauer–Emmett–Teller (BET) surface area and pore volume measurement for the various drill cuttings.
SampleBET Surface Area
(m2 g-1)
t-Plot Micro Pore Volume
(104 cm3 g-1)
Raw drill cuttings5.04.2
Control drill cuttings4.77.1
Supported drill cuttings7.96.7
Table 3. Gaseous product analysis for various upgrading runs.
TC controlLow-pressure HDC supported drill cuttingsHigh-pressure HDC controlHigh-pressure HDC supported drill cuttings
Gaswt.%mol%wt.%mol%wt.%mol%wt.%mol%
C115.636.52.29.115.337.815.237.3
C218.823.43.98.813.818.215.119.9
C318.415.67.411.317.816.019.917.8
C417.011.011.112.815.210.36.24.1
C511.25.817.216.013.27.217.59.6
C69.34.024.919.511.55.315.06.8
C7+9.73.633.522.513.35.211.24.4
Table 4. Distillation cuts present in the product oil from various runs. Volatiles (<n-C10), medium range distillates (n-C10 to n-C20), high boiling point distillates (n-C20 to n-C44), residue (>n-C44).
Volatiles (%)
T < 175 °C
Medium Range Distillates (%)
175 °C < T < 350°C
High Boiling Point Distillates (%)
350 °C < T < 545 °C
Residue (%)
T > 545 °C
Feed--1387
TC control3132757
HDC low-pressure control12112750
HDC low-pressure supported drill cuttings22122838
HDC high-pressure supported drill cuttings21112840
Table 5. Residue conversion for select samples, calculated using equation 1.
Residue, T > 545 °C
conversion (%)
TC control34
HDC low-pressure control43
HDC low-pressure supported drill cuttings56
HDC high-pressure supported drill cuttings54
Table 6. Sulfur and Conradson carbon residue (CCR) content of the Athabasca vacuum residue Athabasca vacuum residue (AVR) feed and upgraded oil samples.
SampleSulfur (wt.%)CCR (wt.%)
Feed7.018.1
TC-supported drill cuttings5.729.7
HDC high pressure-supported drill cuttings5.921.2
Table 7. Types of drill cuttings employed in study.
TypeCompositionFunction
RawAl2O3-SiO2Upgrading and Characterization
ControlAl2O3-SiO2Characterization
SupportedAl2O3-SiO2/Ni-MoUpgrading and Characterization
Table 8. Characteristics of the feedstock consisting of de-fined AVR.
°API gravity at 24 °C4.4 ± 1.1
Viscosity at 37 °C (cP)>200,000
Asphaltenes (wt.%)31.6 ± 3.2
Maltenes (wt.%)68.4 ± 4.9
Sulfur (wt.%)7.0
CCR (wt.%)18.1

