Article

Effect of Pt Promotion on the Ni-Catalyzed Deoxygenation of Tristearin to Fuel-Like Hydrocarbons

1
Center for Applied Energy Research, University of Kentucky, 2540 Research Park Drive, Lexington, KY 40511, USA
2
Department of Chemistry, University of Kentucky, Lexington, KY 40506, USA
3
Harwell XPS, Research Complex at Harwell (RCaH), Rutherford Appleton Laboratory, Harwell Oxford, Didcot OX11 0FA, UK
4
Department of Chemistry, University College London, 20 Gordon St, Kings Cross, London WC1H 0AJ, UK
*
Author to whom correspondence should be addressed.
Catalysts 2019, 9(2), 200; https://doi.org/10.3390/catal9020200
Submission received: 31 January 2019 / Revised: 18 February 2019 / Accepted: 20 February 2019 / Published: 22 February 2019
(This article belongs to the Special Issue Development of Catalysts for Green Diesel Production)

Abstract

:
Pt represents an effective promoter of supported Ni catalysts in the transformation of tristearin to green diesel via decarbonylation/decarboxylation (deCOx), conversion increasing from 2% over 20% Ni/Al2O3 to 100% over 20% Ni-0.5% Pt/Al2O3 at 260 °C. Catalyst characterization reveals that the superior activity of Ni-Pt relative to Ni-only catalysts is not a result of Ni particle size effects or surface area differences, but rather stems from several other phenomena, including the improved reducibility of NiO when Pt is present. Indeed, the addition of a small amount of Pt to the supported Ni catalyst dramatically increases the amount of reduced surface metal sites, which are believed to be the active sites for deCOx reactions. Further, Pt addition curbs the adsorption of CO on the catalyst surface, which decreases catalyst poisoning by any CO evolved via decarbonylation, making additional active sites available for deoxygenation reactions and/or preventing catalyst coking. Specifically, Pt addition weakens the Ni-CO bond, lowering the binding strength of CO on surface Ni sites. Finally, analysis of the spent catalysts recovered from deCOx experiments confirms that the beneficial effect of Pt on catalyst performance can be partially explained by decreased coking and fouling.

1. Introduction

The limited availability and uneven geographical distribution of fossil resources, as well as environmental concerns associated with their use, demand the development of renewable and carbon neutral alternatives. Biofuels—i.e., fuels derived from biomass—are not only renewable and have the potential to become carbon neutral, but they can avoid competing with the food supply if they are obtained from waste or non-edible feedstocks [1,2,3,4]. Biodiesel, which is comprised of fatty acid methyl esters (FAMEs), is currently produced industrially from a variety of oils and fats through the transesterification or esterification of their triglyceride and fatty acid constituents, respectively. Although biodiesel production is technically straightforward, it displays several drawbacks as a fuel (e.g., poor cold flow properties and storage stability) stemming from the oxygen content of FAMEs [5,6]. Therefore, catalytic deoxygenation processes are being developed to convert the same feedstocks to fuel-like hydrocarbons that, in addition to being renewable, are also chemically identical (and thus a drop-in alternative) to fossil fuels. Investigations into such processes have revealed two dominant reaction pathways: (1) hydrodeoxygenation (HDO), where oxygen is eliminated as water; and (2) decarbonylation/decarboxylation (deCOx), in which oxygen is removed as CO or CO2, respectively. The HDO reaction pathway is typically very selective, yielding the desired hydrocarbon products with a good carbon efficiency and saturating the C=C double bonds that are abundant in many feed sources. However, this approach requires high H2 pressures and problematic sulfided catalysts that deactivate in the presence of water and risk contaminating the products with sulfur. In contrast, the deCOx pathway yields hydrocarbons containing one less carbon than the original feed, but does so avoiding the use of sulfided catalysts and requiring little to no H2 for oxygen removal [7].
In an effort to identify promising deoxygenation catalysts, Snåre et al. screened a number of active metals on various supports in the deoxygenation of stearic acid, a model fatty acid compound, and found that deoxygenation activity follows the order Pd > Pt > Ni > Rh > Ir > Ru > Os [8]. Unsurprisingly, the majority of deoxygenation studies since then have focused on the use of the two most active metals, Pd [9,10,11,12,13,14,15,16,17,18] and Pt [19,20,21,22,23,24,25,26,27,28,29]. However, in previous work, we demonstrated that supported Ni catalysts provide comparable results to Pd and Pt formulations in the deoxygenation of triglycerides [30,31]. Admittedly, the Ni loading required (20 wt.%) is higher than the loading for precious metal catalysts (1–5 wt.%); nevertheless, this is made entirely acceptable by the fact that the cost of Ni is thousands of times lower than that of Pt or Pd. Although promising, Ni catalysts are prone to deactivation from coking and typically yield more cracking products than Pd and Pt formulations. Although some cracking may be desirable to improve cold flow properties and produce hydrocarbon fuels that fall within the boiling point range of aviation fuels (150–300 °C) [30], excessive cracking can lead to lower yields of fuel-like products and catalyst deactivation [7,32]. In light of this, the development of improved Ni-based catalysts is of significant interest.
Attempts to improve Ni deoxygenation catalysts have examined the use of various supports, metal loadings, reactor types, and reaction conditions, with the conversion of lipids to fuel like-hydrocarbons over Ni-based catalysts being the subject of a recent review by Kordulis [6]. Studies focused on catalyst carriers have shown that metal oxide-supported catalysts can afford conversion and selectivity values comparable to those attained using carbonaceous supports [32,33,34,35,36,37,38]. This is made particularly noteworthy by the fact that albeit carbon-supported deCOx catalysts generally show better yields of fuel-like hydrocarbons [39], coke formation represents the main catalyst deactivation pathway [40], which precludes the facile regeneration of carbon-supported catalysts via the combustion of coke deposits as this approach would also destroy a carbonaceous support. In contrast, metal oxide-supported catalysts can be easily regenerated via calcination [33].
Efforts to develop superior Ni-based deCOx catalysts have also focused on modifying the active metal phase [32,41,42,43,44,45,46]. Loe et al. found that the addition of Cu to an Ni/Al2O3 catalyst facilitated NiO reduction at lower temperatures [32]. This is beneficial not only because Ni0 is believed to be the active phase for deCOx, but also because the catalyst can be reactivated in the course of deoxygenation reactions, which are typically performed in the presence of H2. Indeed, a continuous flow of H2 supplied in either semi-batch or fixed bed reactors not only reactivates the catalyst by reducing any oxidized surface Ni sites, but also by removing any COx generated during the deCOx process that might otherwise act as catalyst poisons [14]. Saliently, Loe et al. demonstrated that a 20% Ni-5% Cu/Al2O3 catalyst can convert model lipid compounds—such as tristearin and stearic acid—near quantitatively [32]. Remarkably, using hydrogen-rich atmospheres and reaction temperatures as low as 260 °C, which are conditions typically favoring the HDO pathway [38,47], deoxygenation was observed to proceed via deCOx [42]. The promotion effect displayed by this bimetallic catalyst relative to its Ni-only counterpart was in large part attributed to the ability of Cu to facilitate the reduction of Ni at relatively low temperatures.
The goal of the present study was to examine the promotion of Ni-based deCOx catalysts with small amounts (≤0.5 wt.%) of Pt, a candidate metal promoter due to its ability to dissociatively adsorb H2, resulting in the spillover of atomic H onto surrounding metal sites through surface migration [48]. Since Pt reduces at a lower temperature than Ni, similar promotion effects to those observed with Cu can be expected. In addition, Pt can also lower the binding energy of CO to Ni in its close proximity [49], which could increase deCOx activity by curbing the adsorption of CO on Ni sites.

2. Results and Discussion

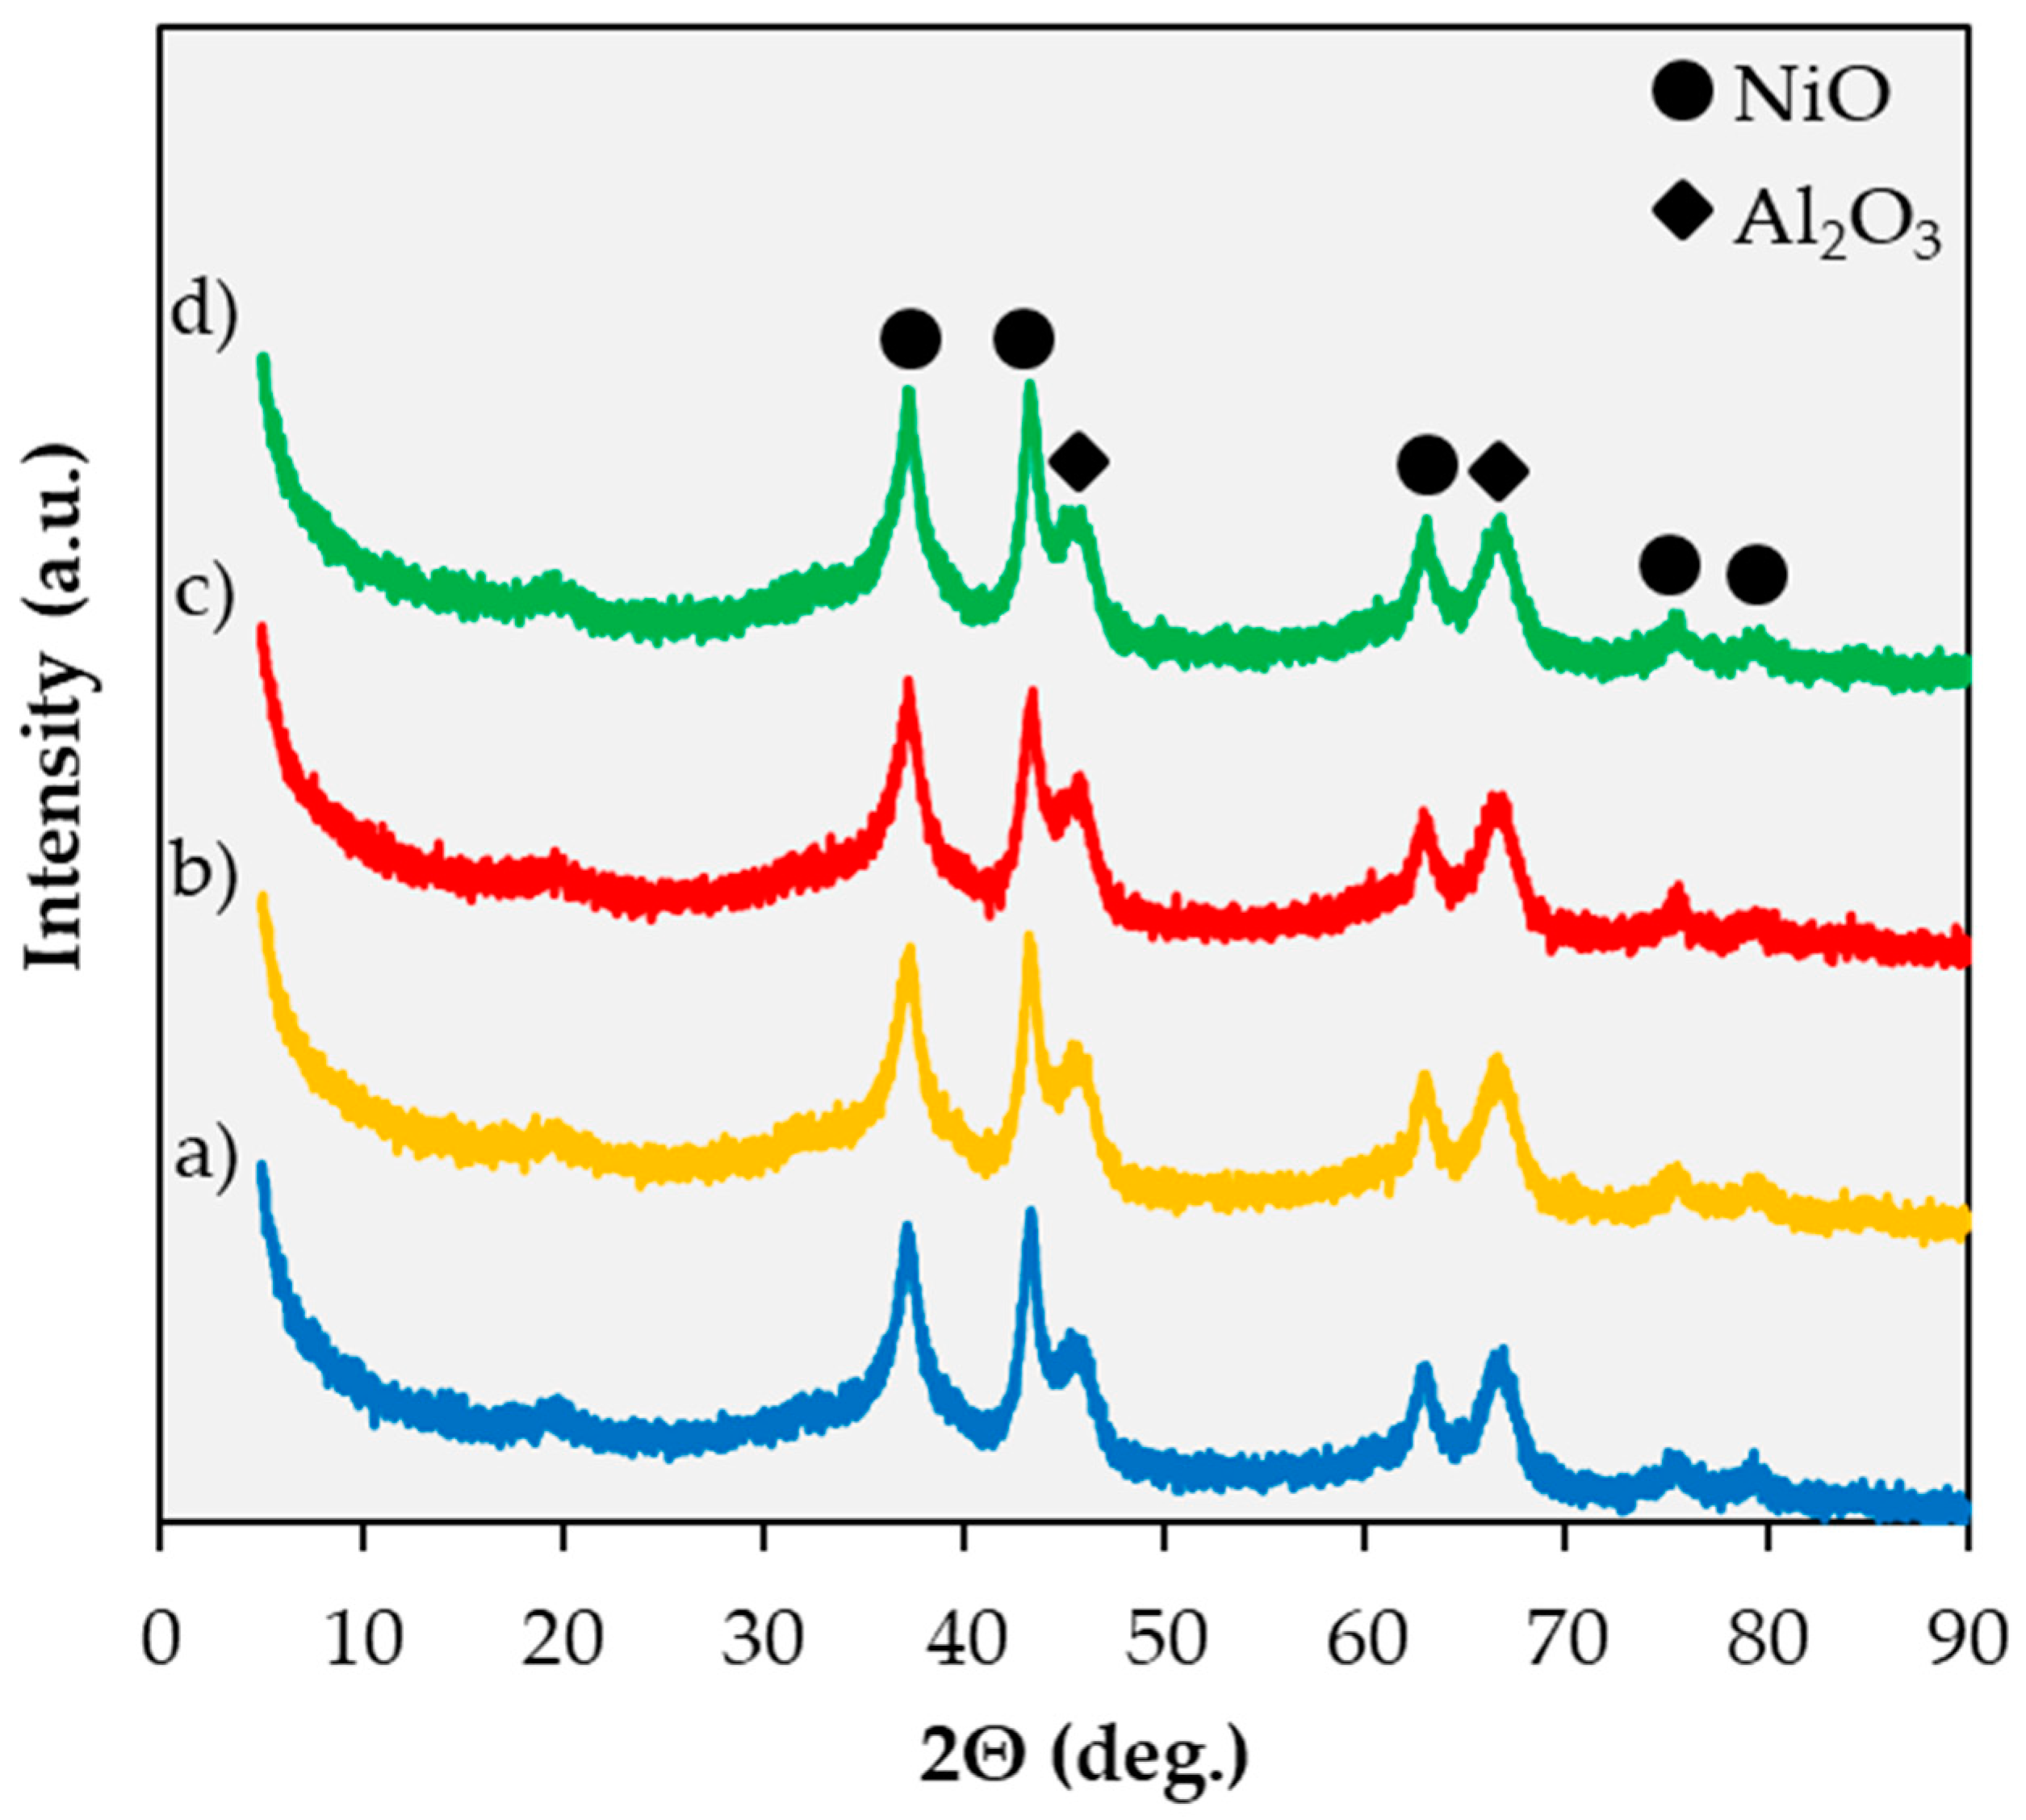
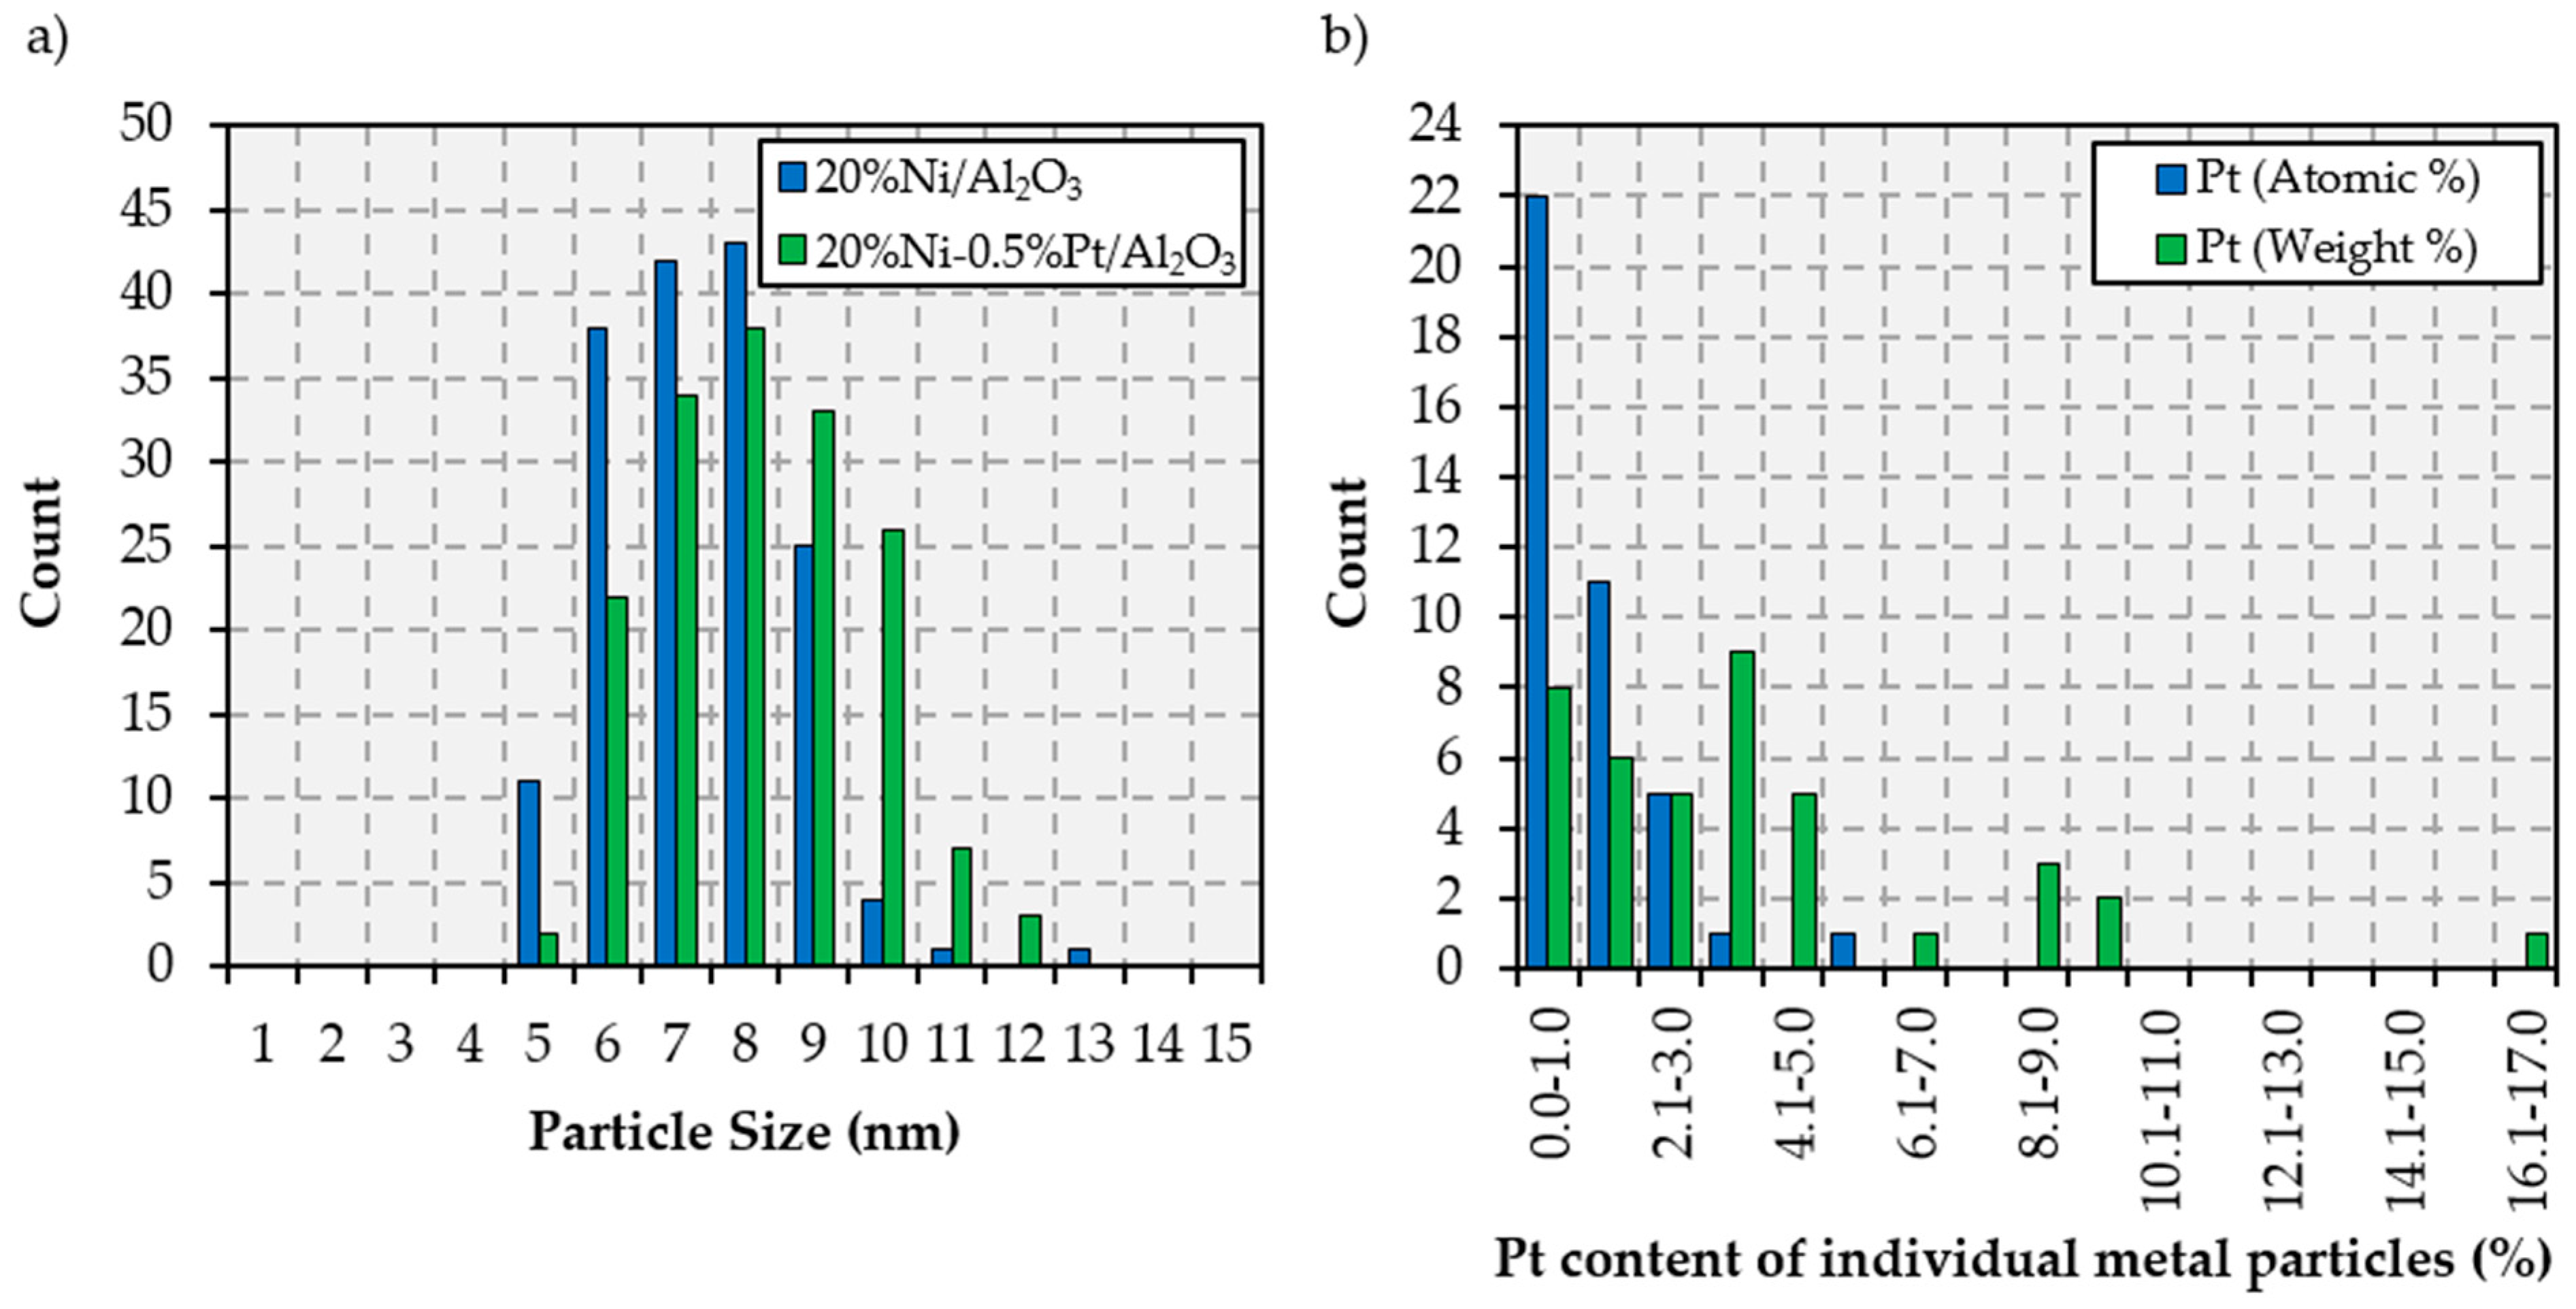
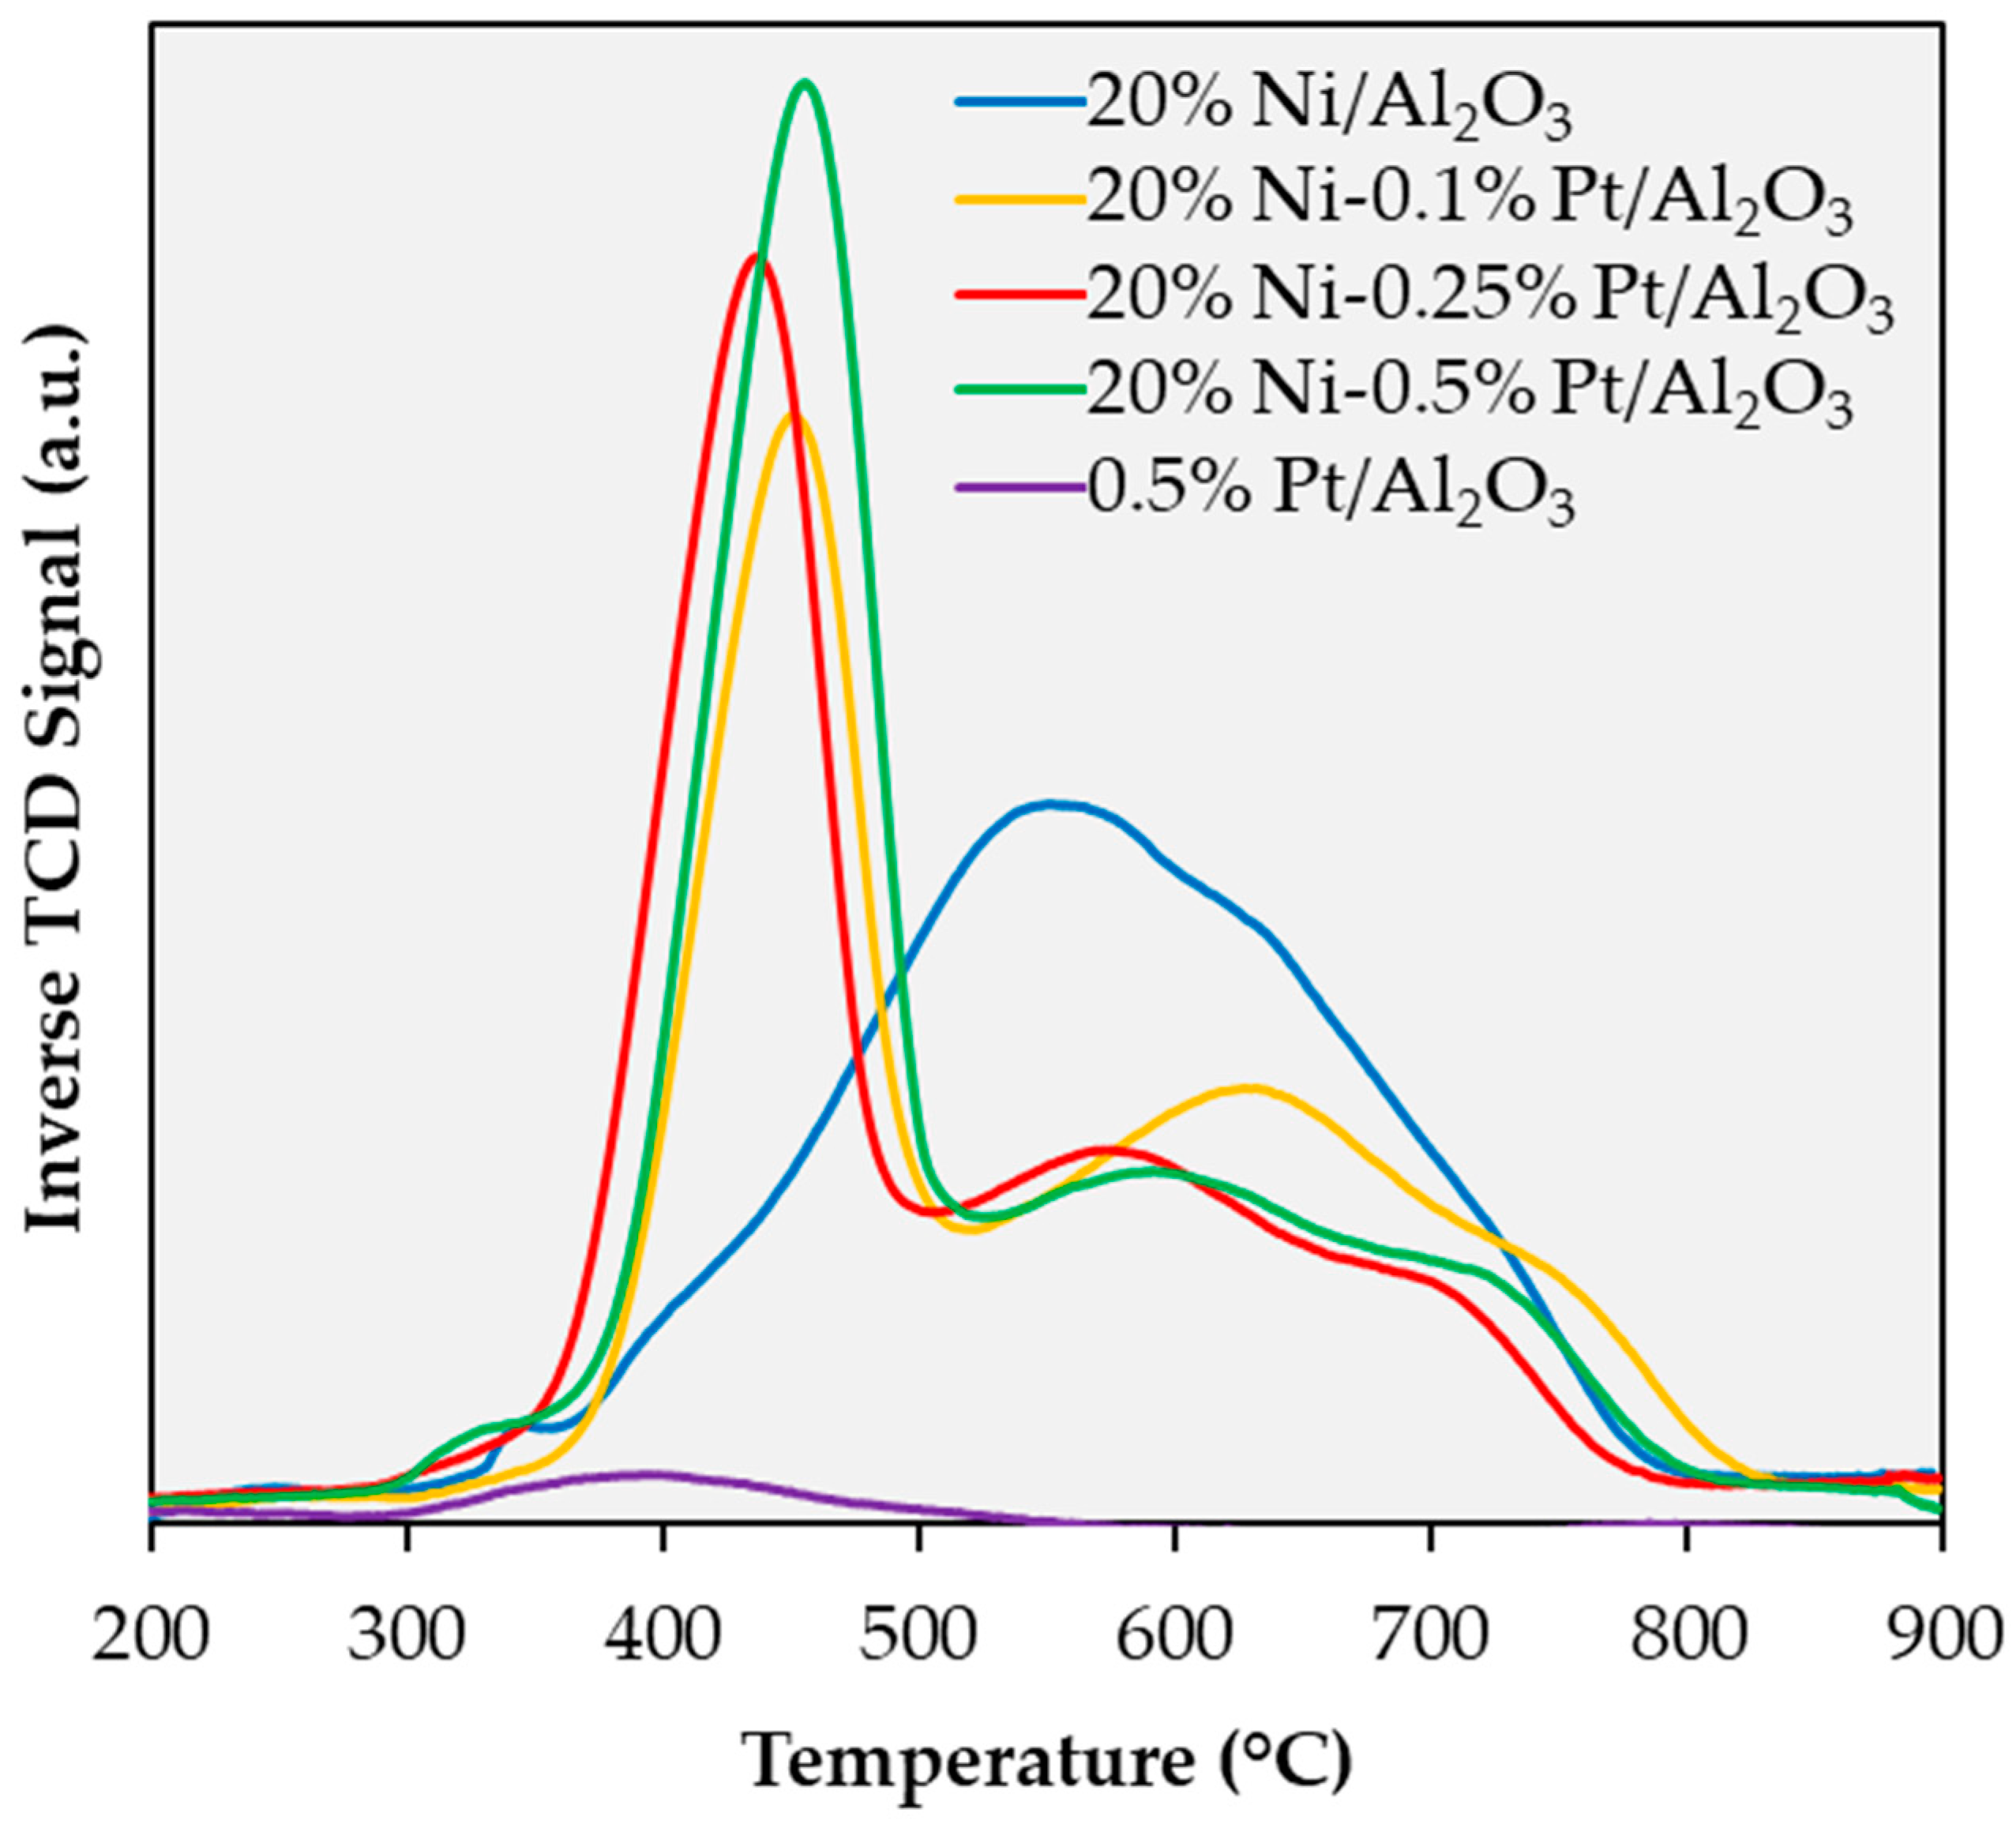
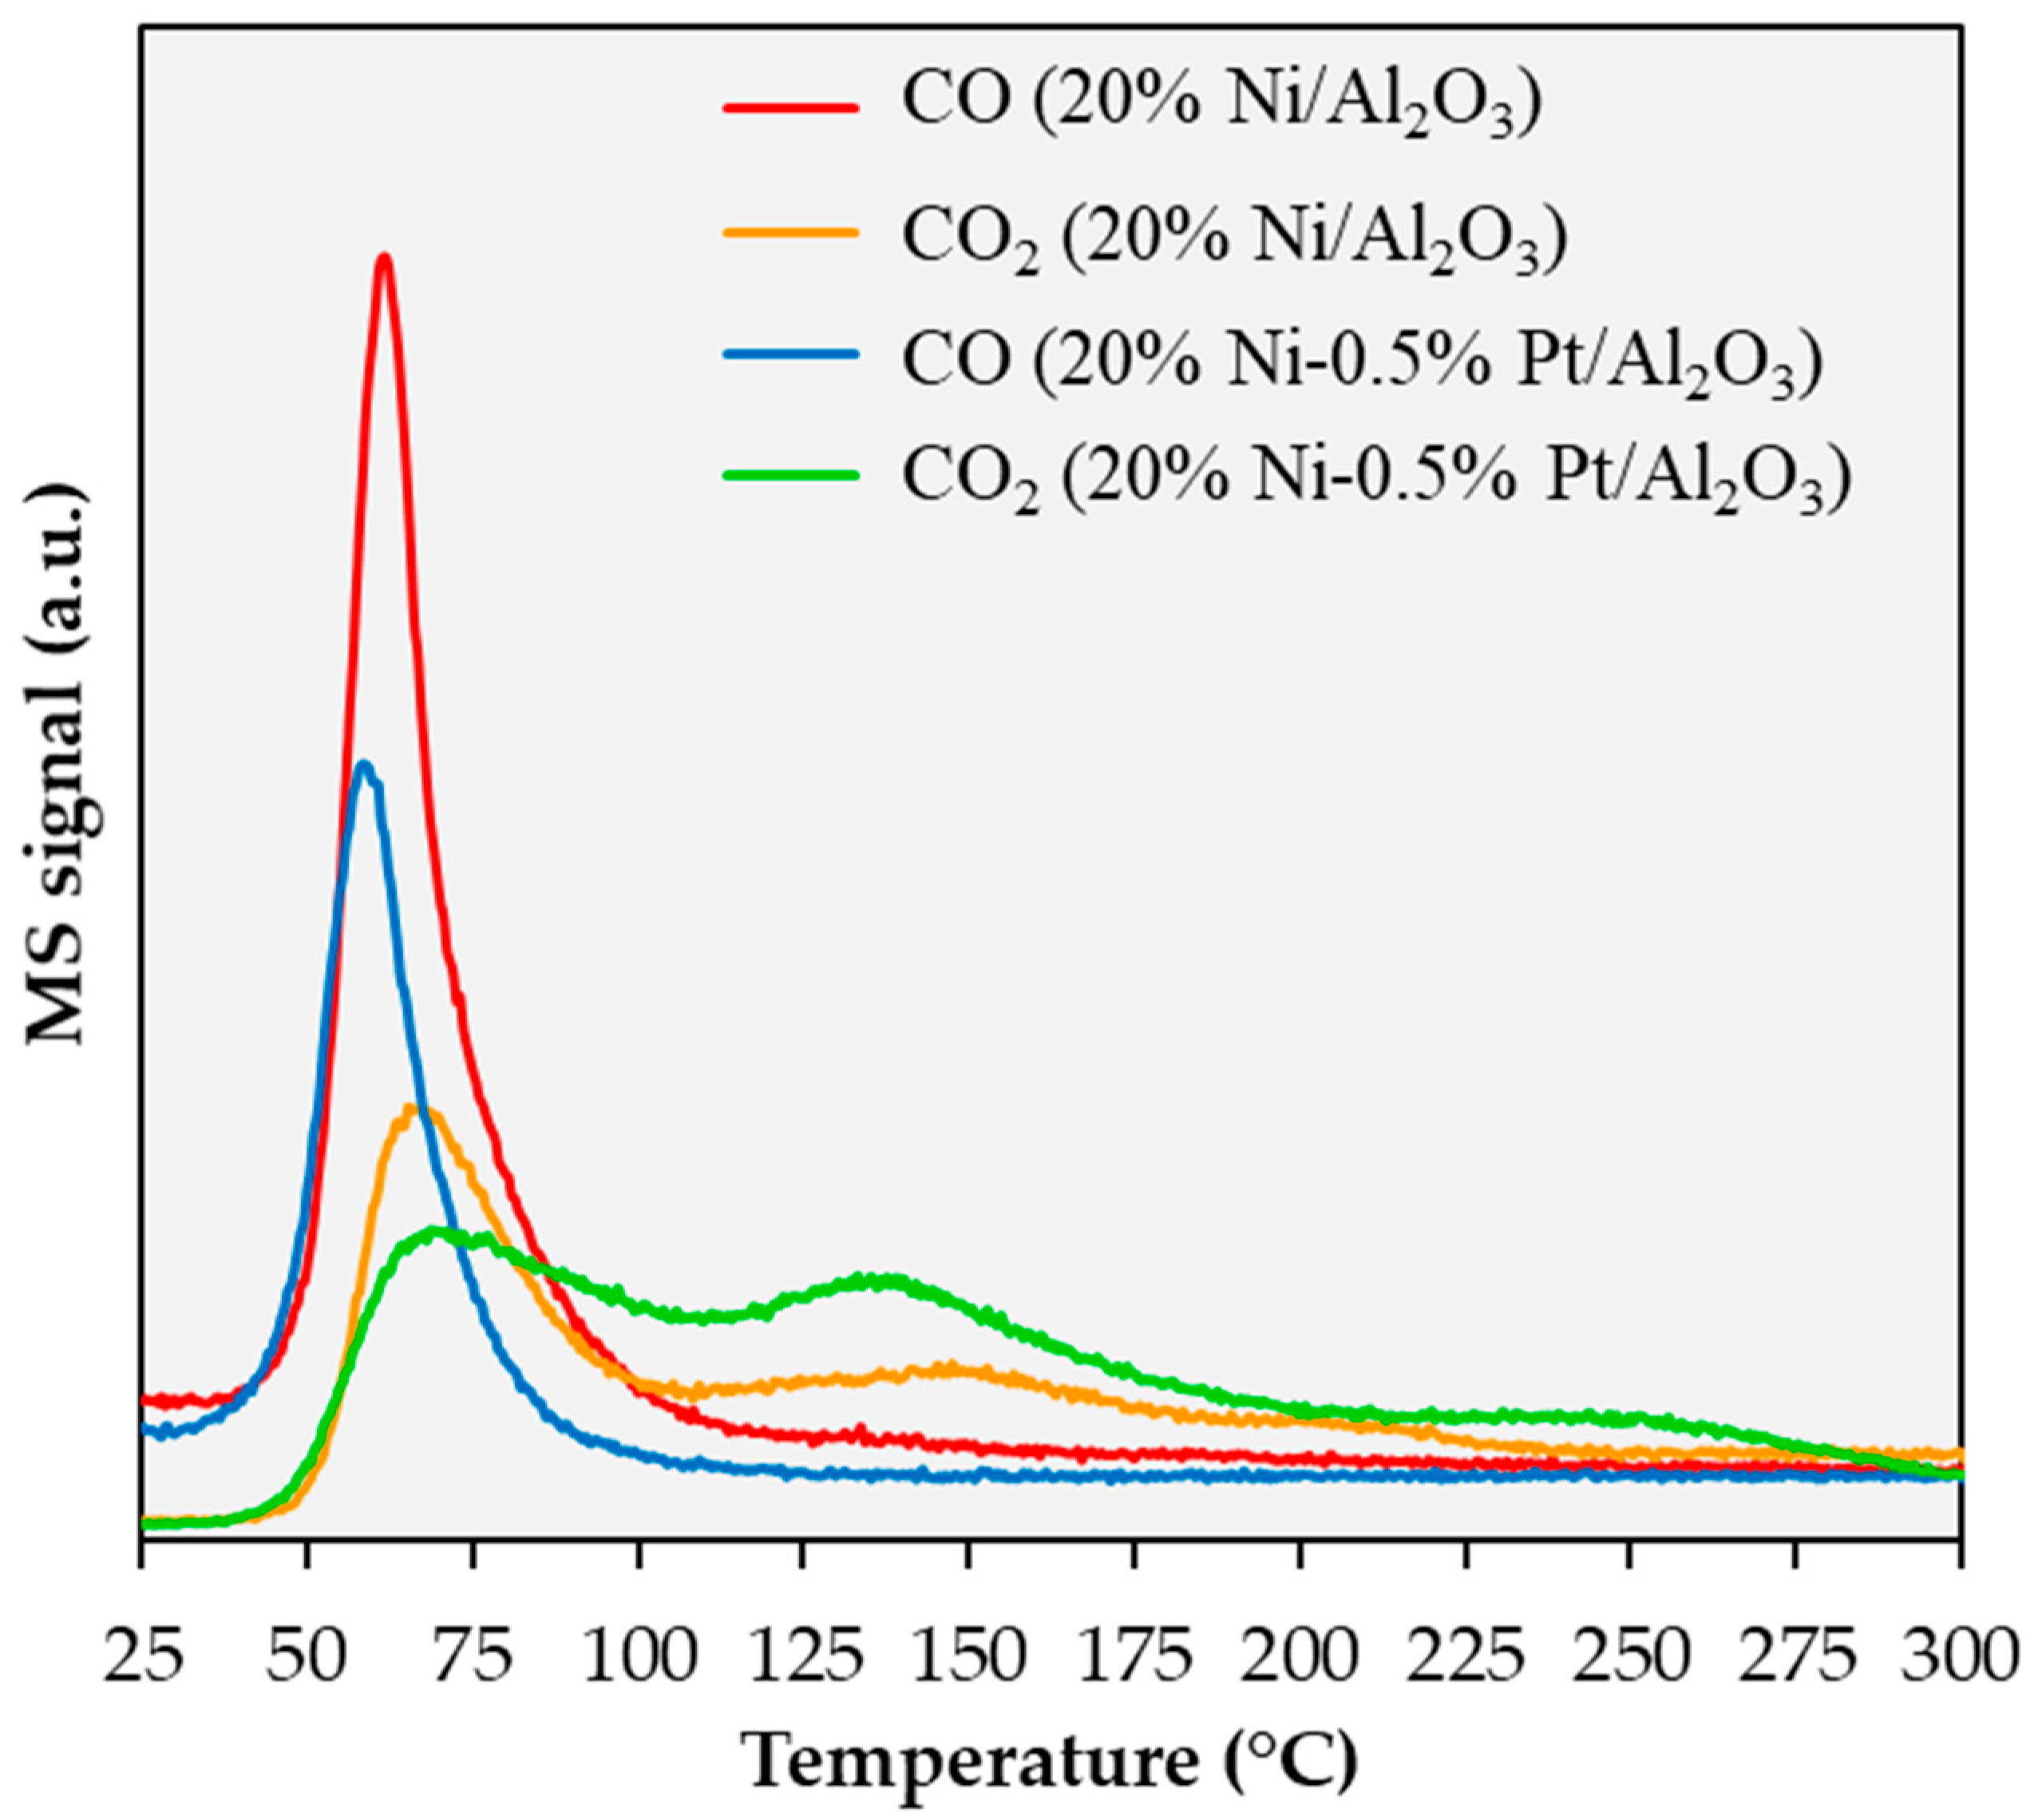
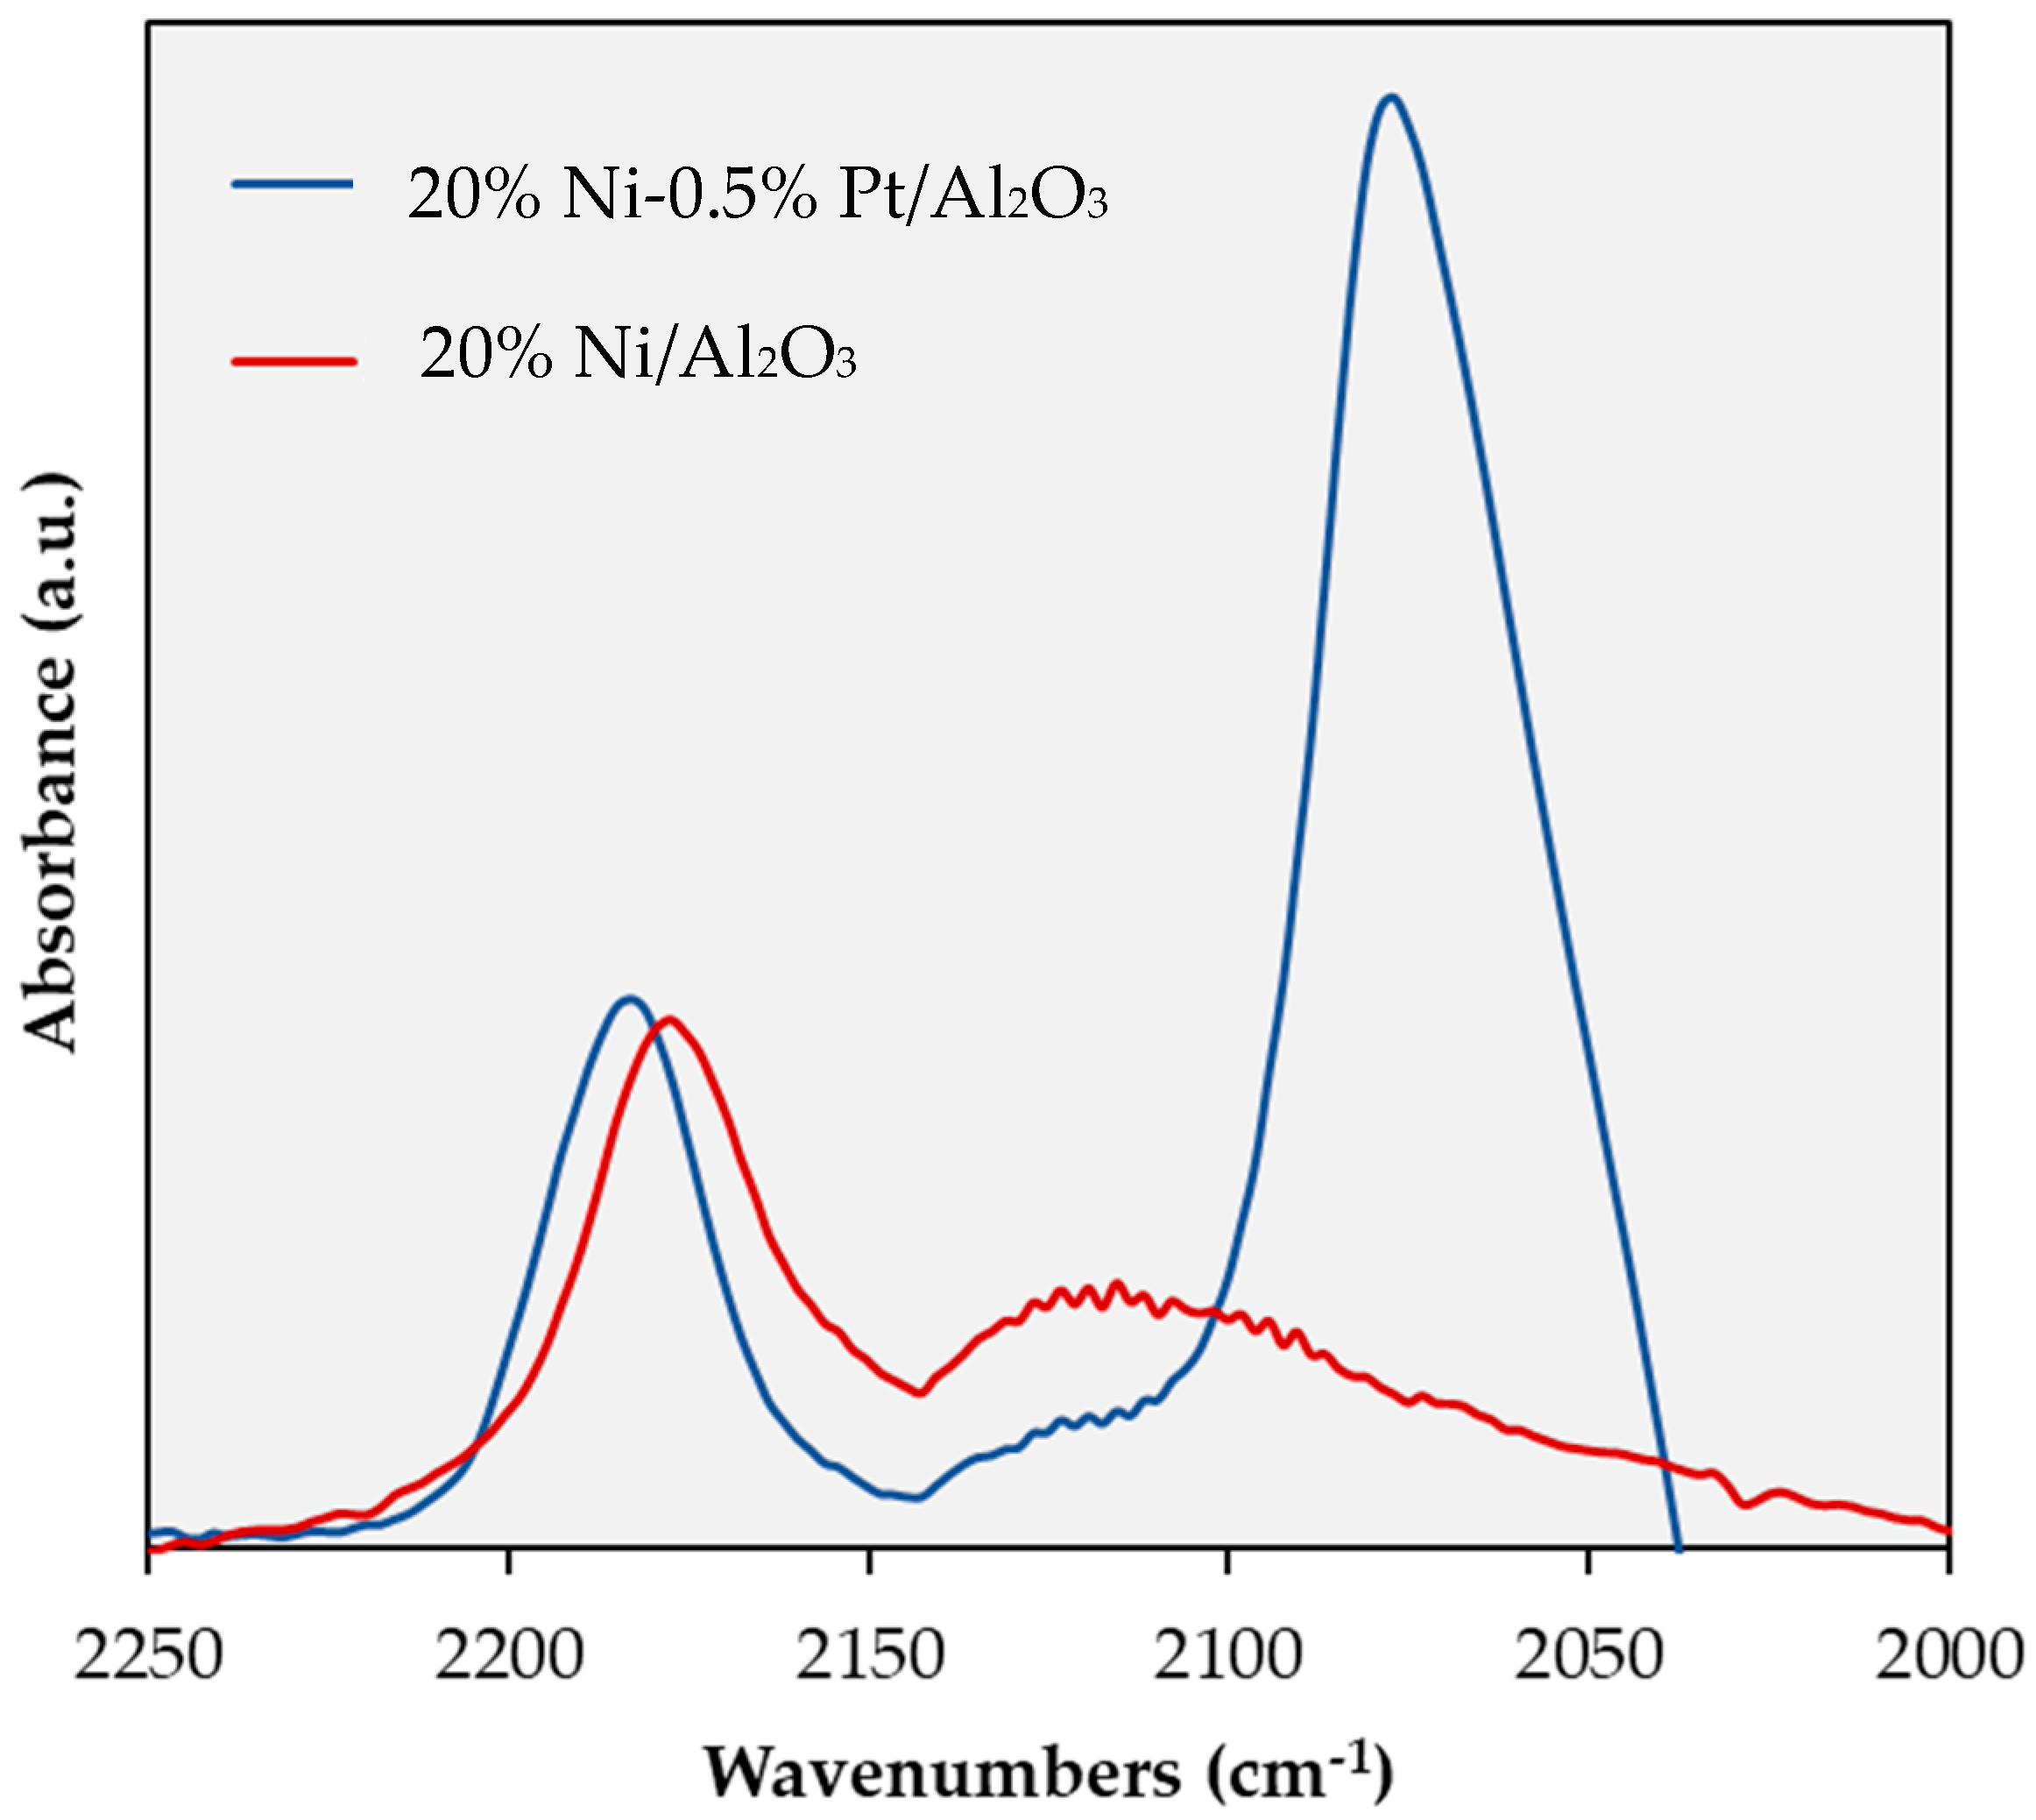
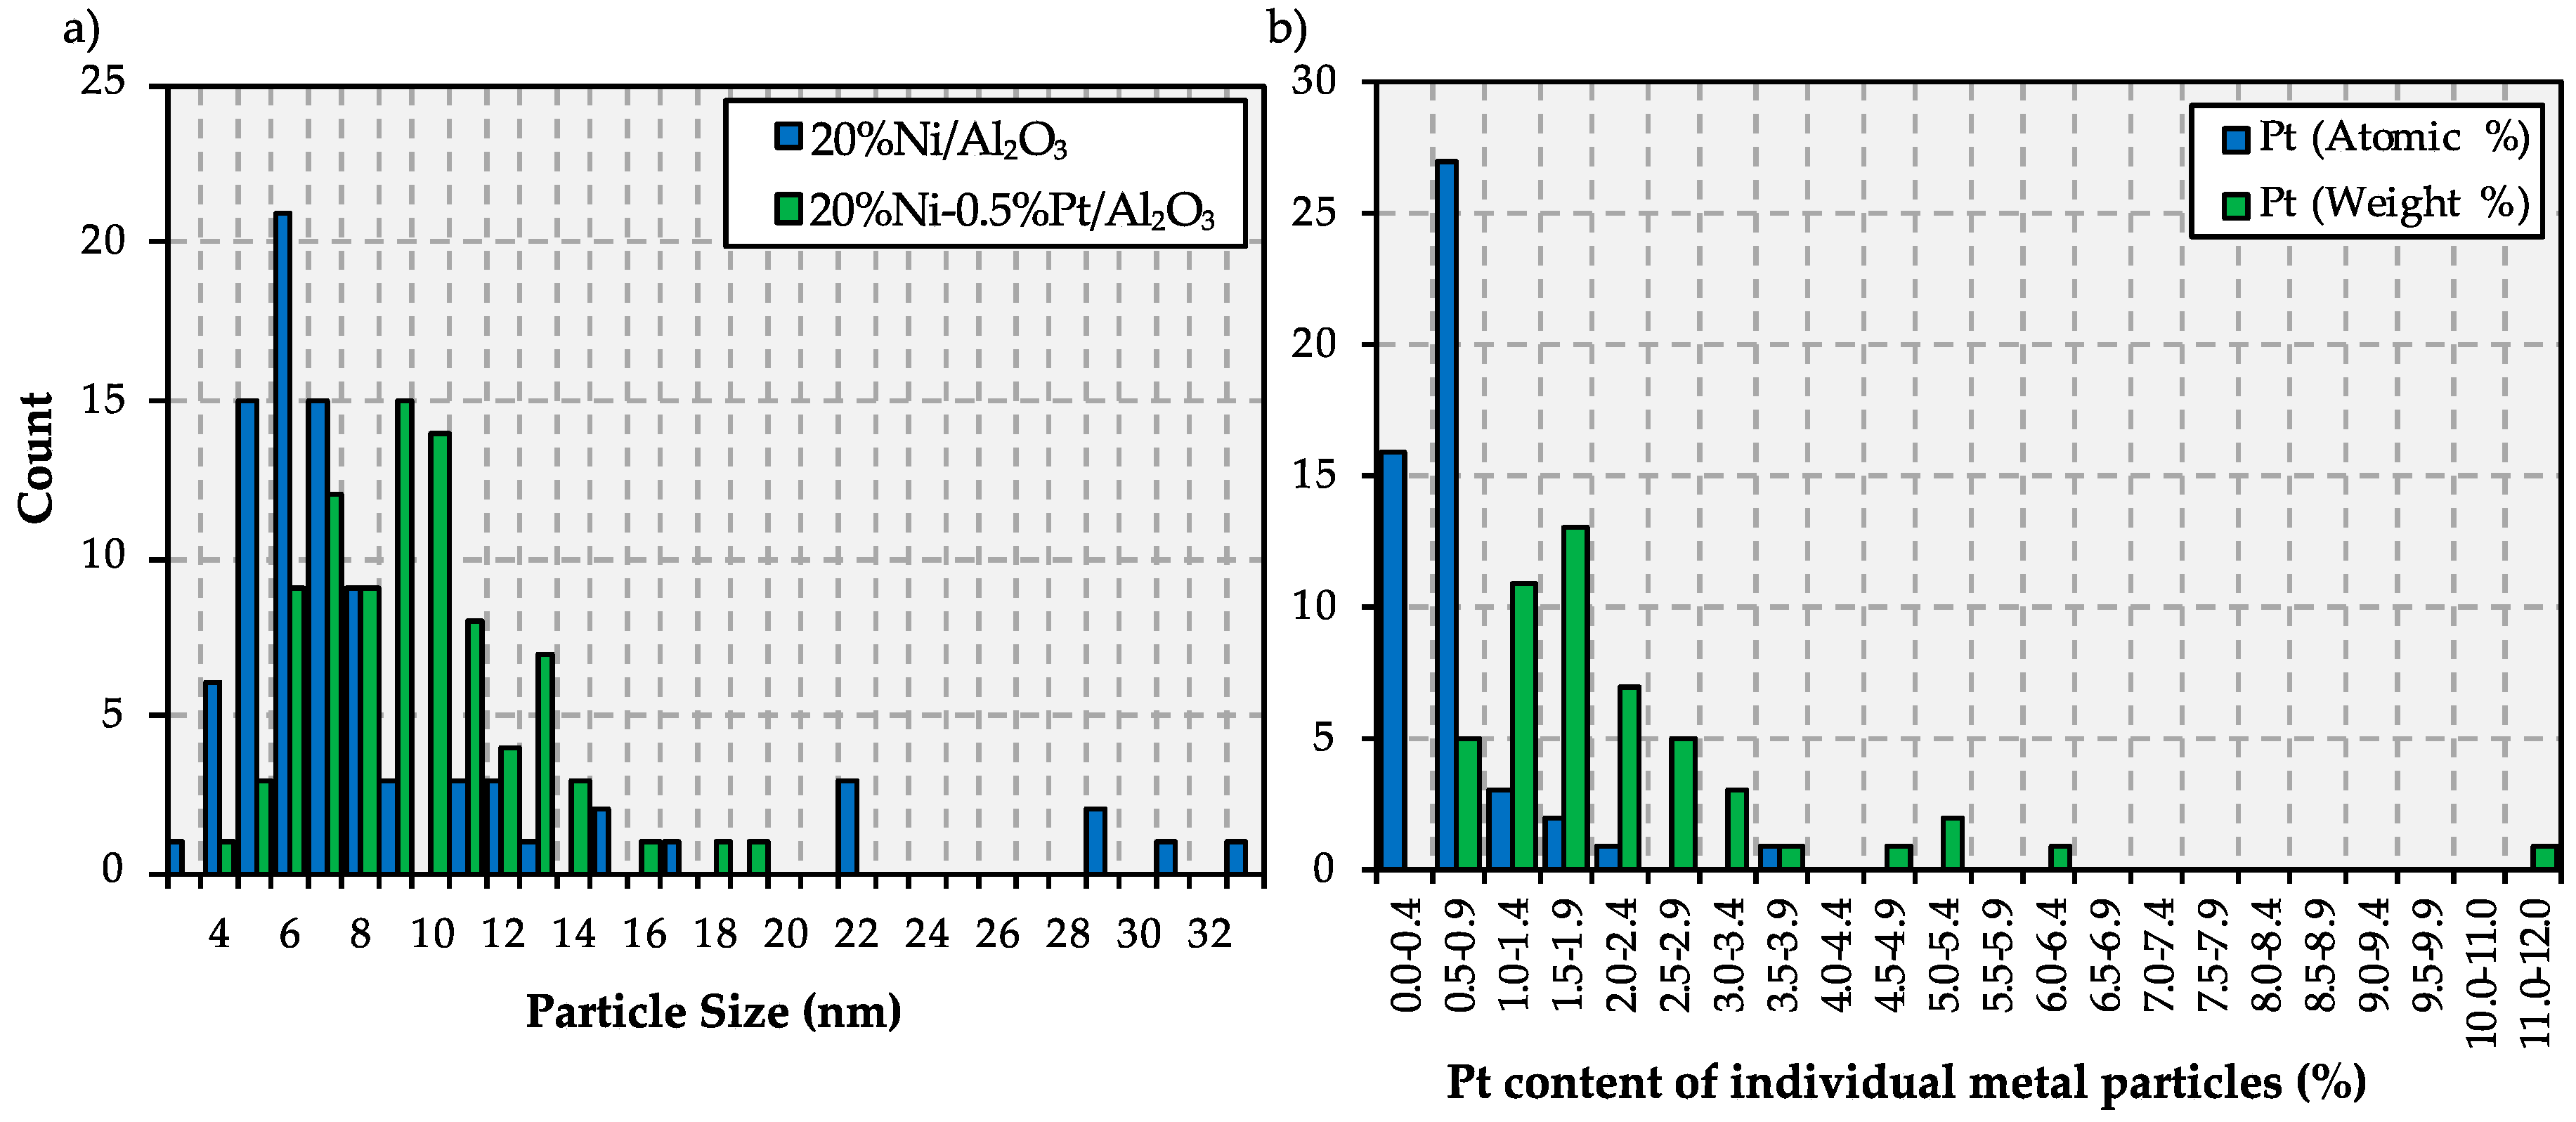
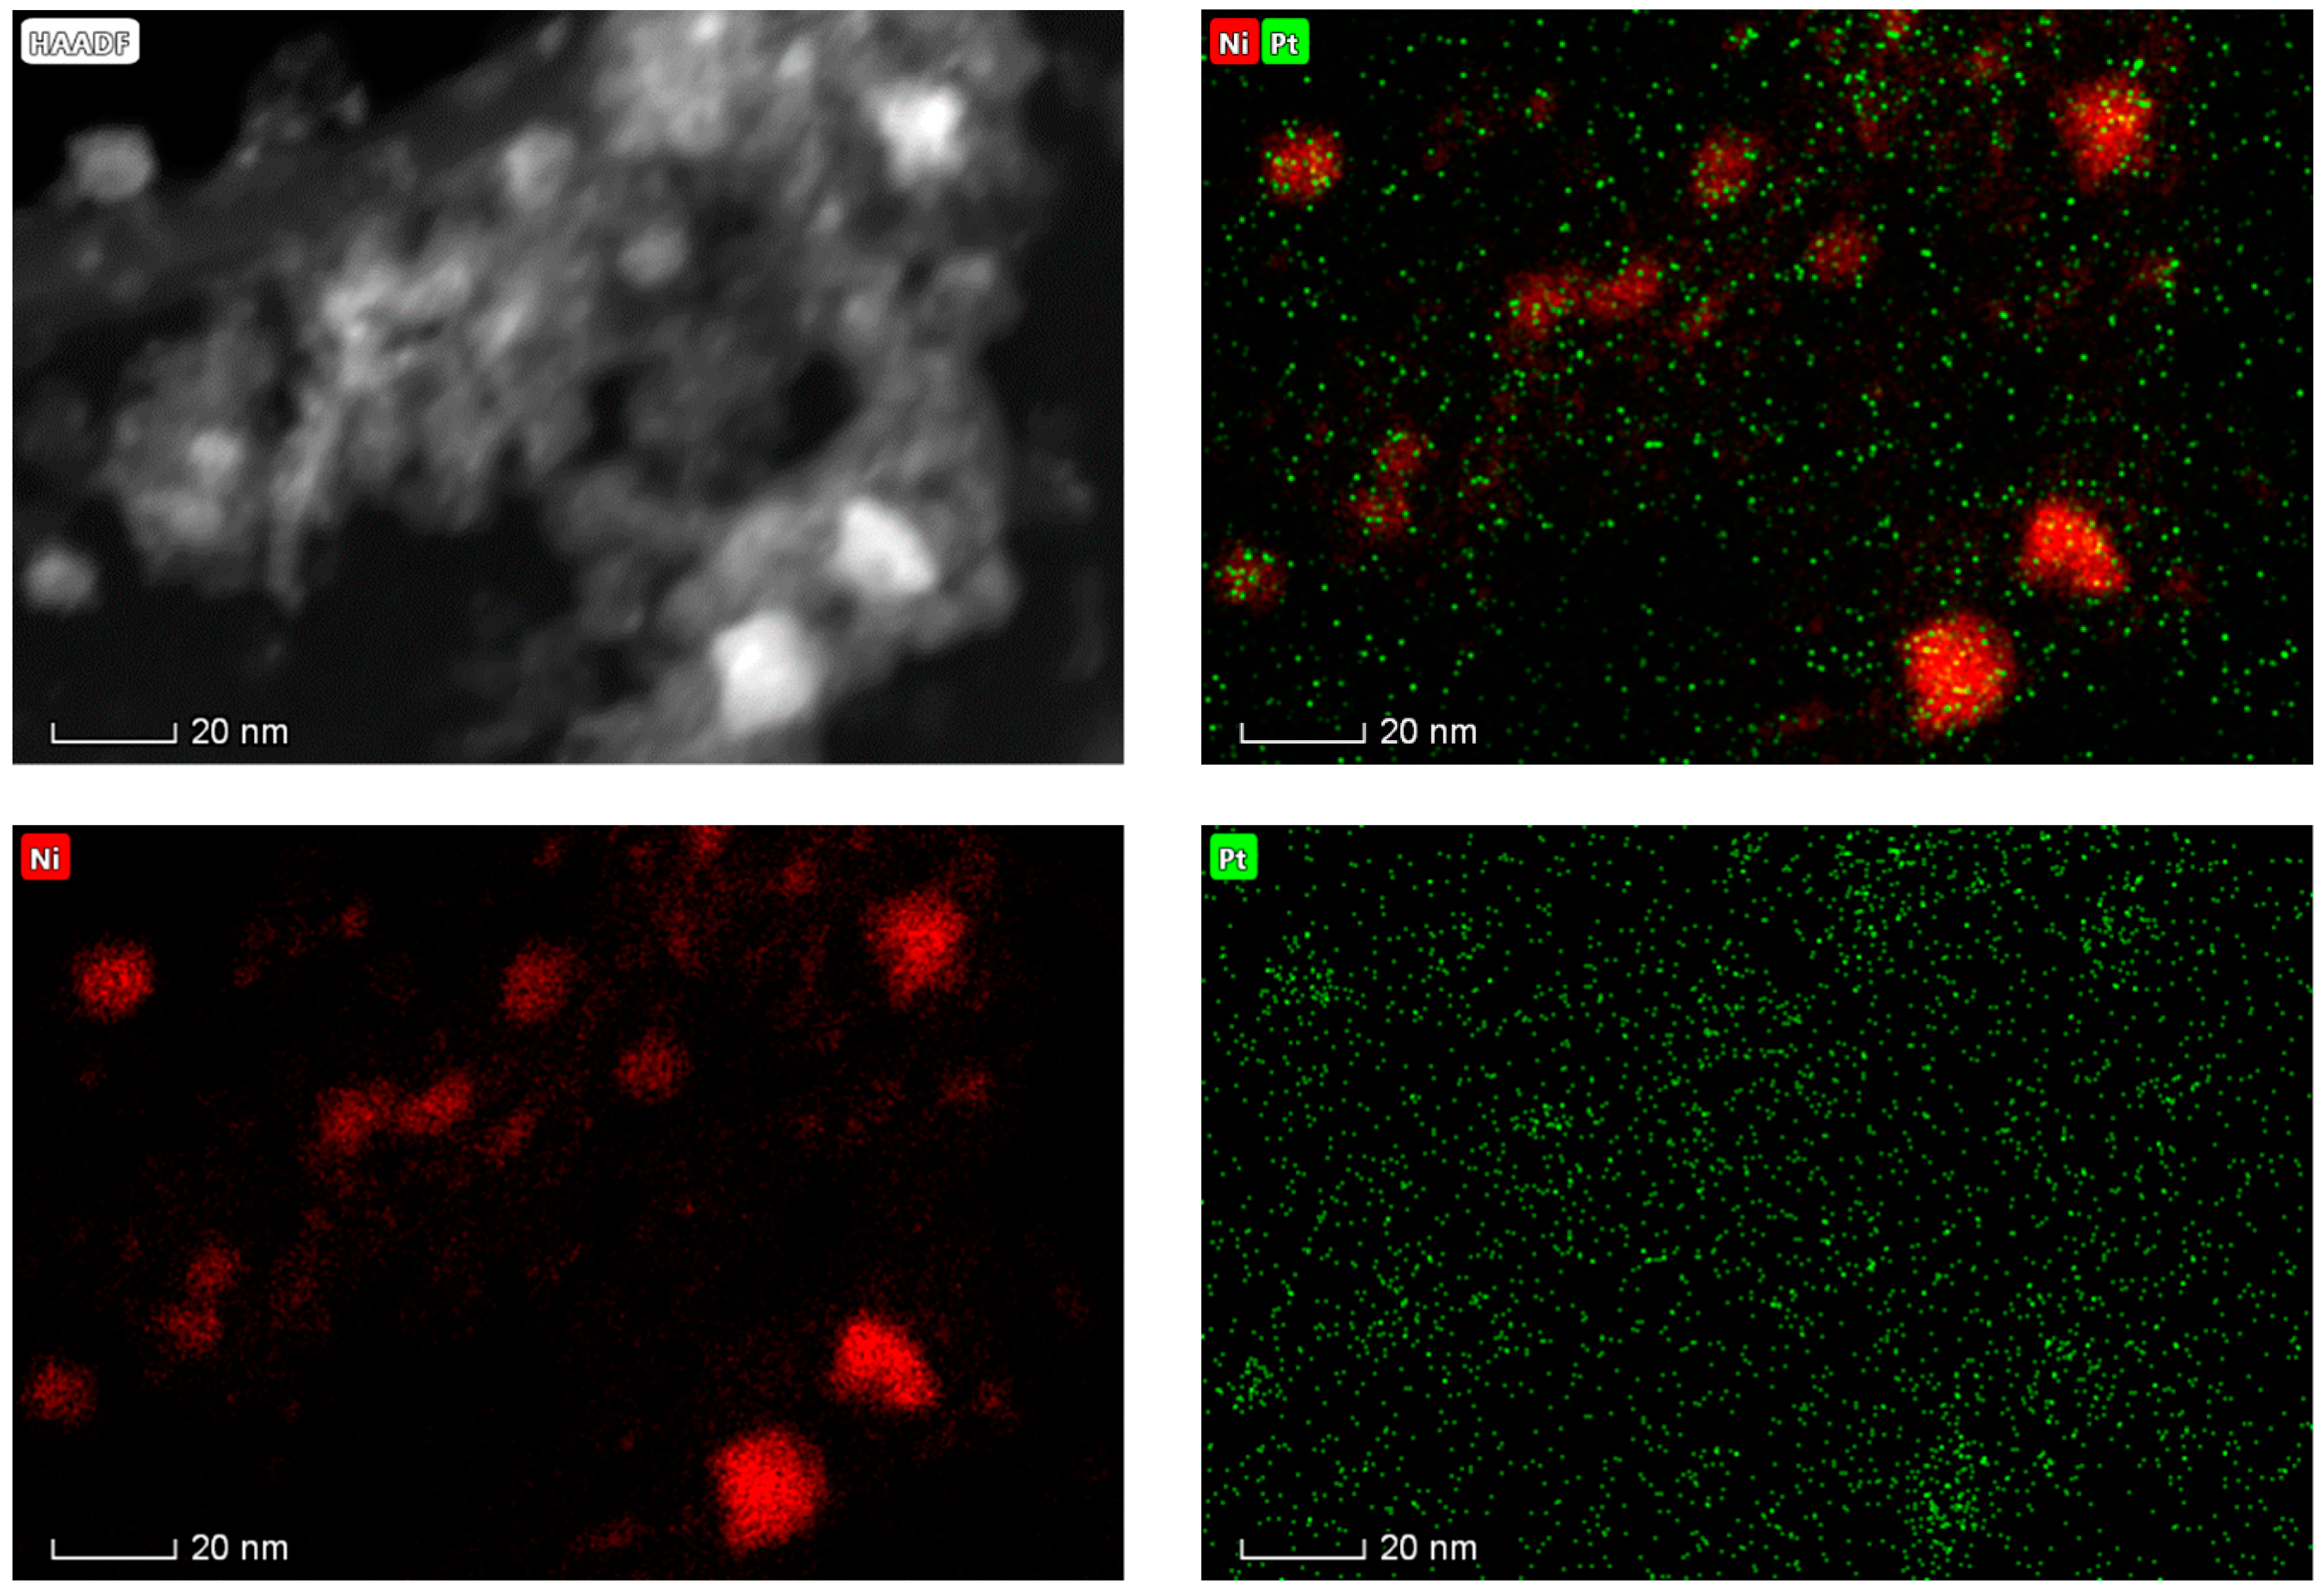
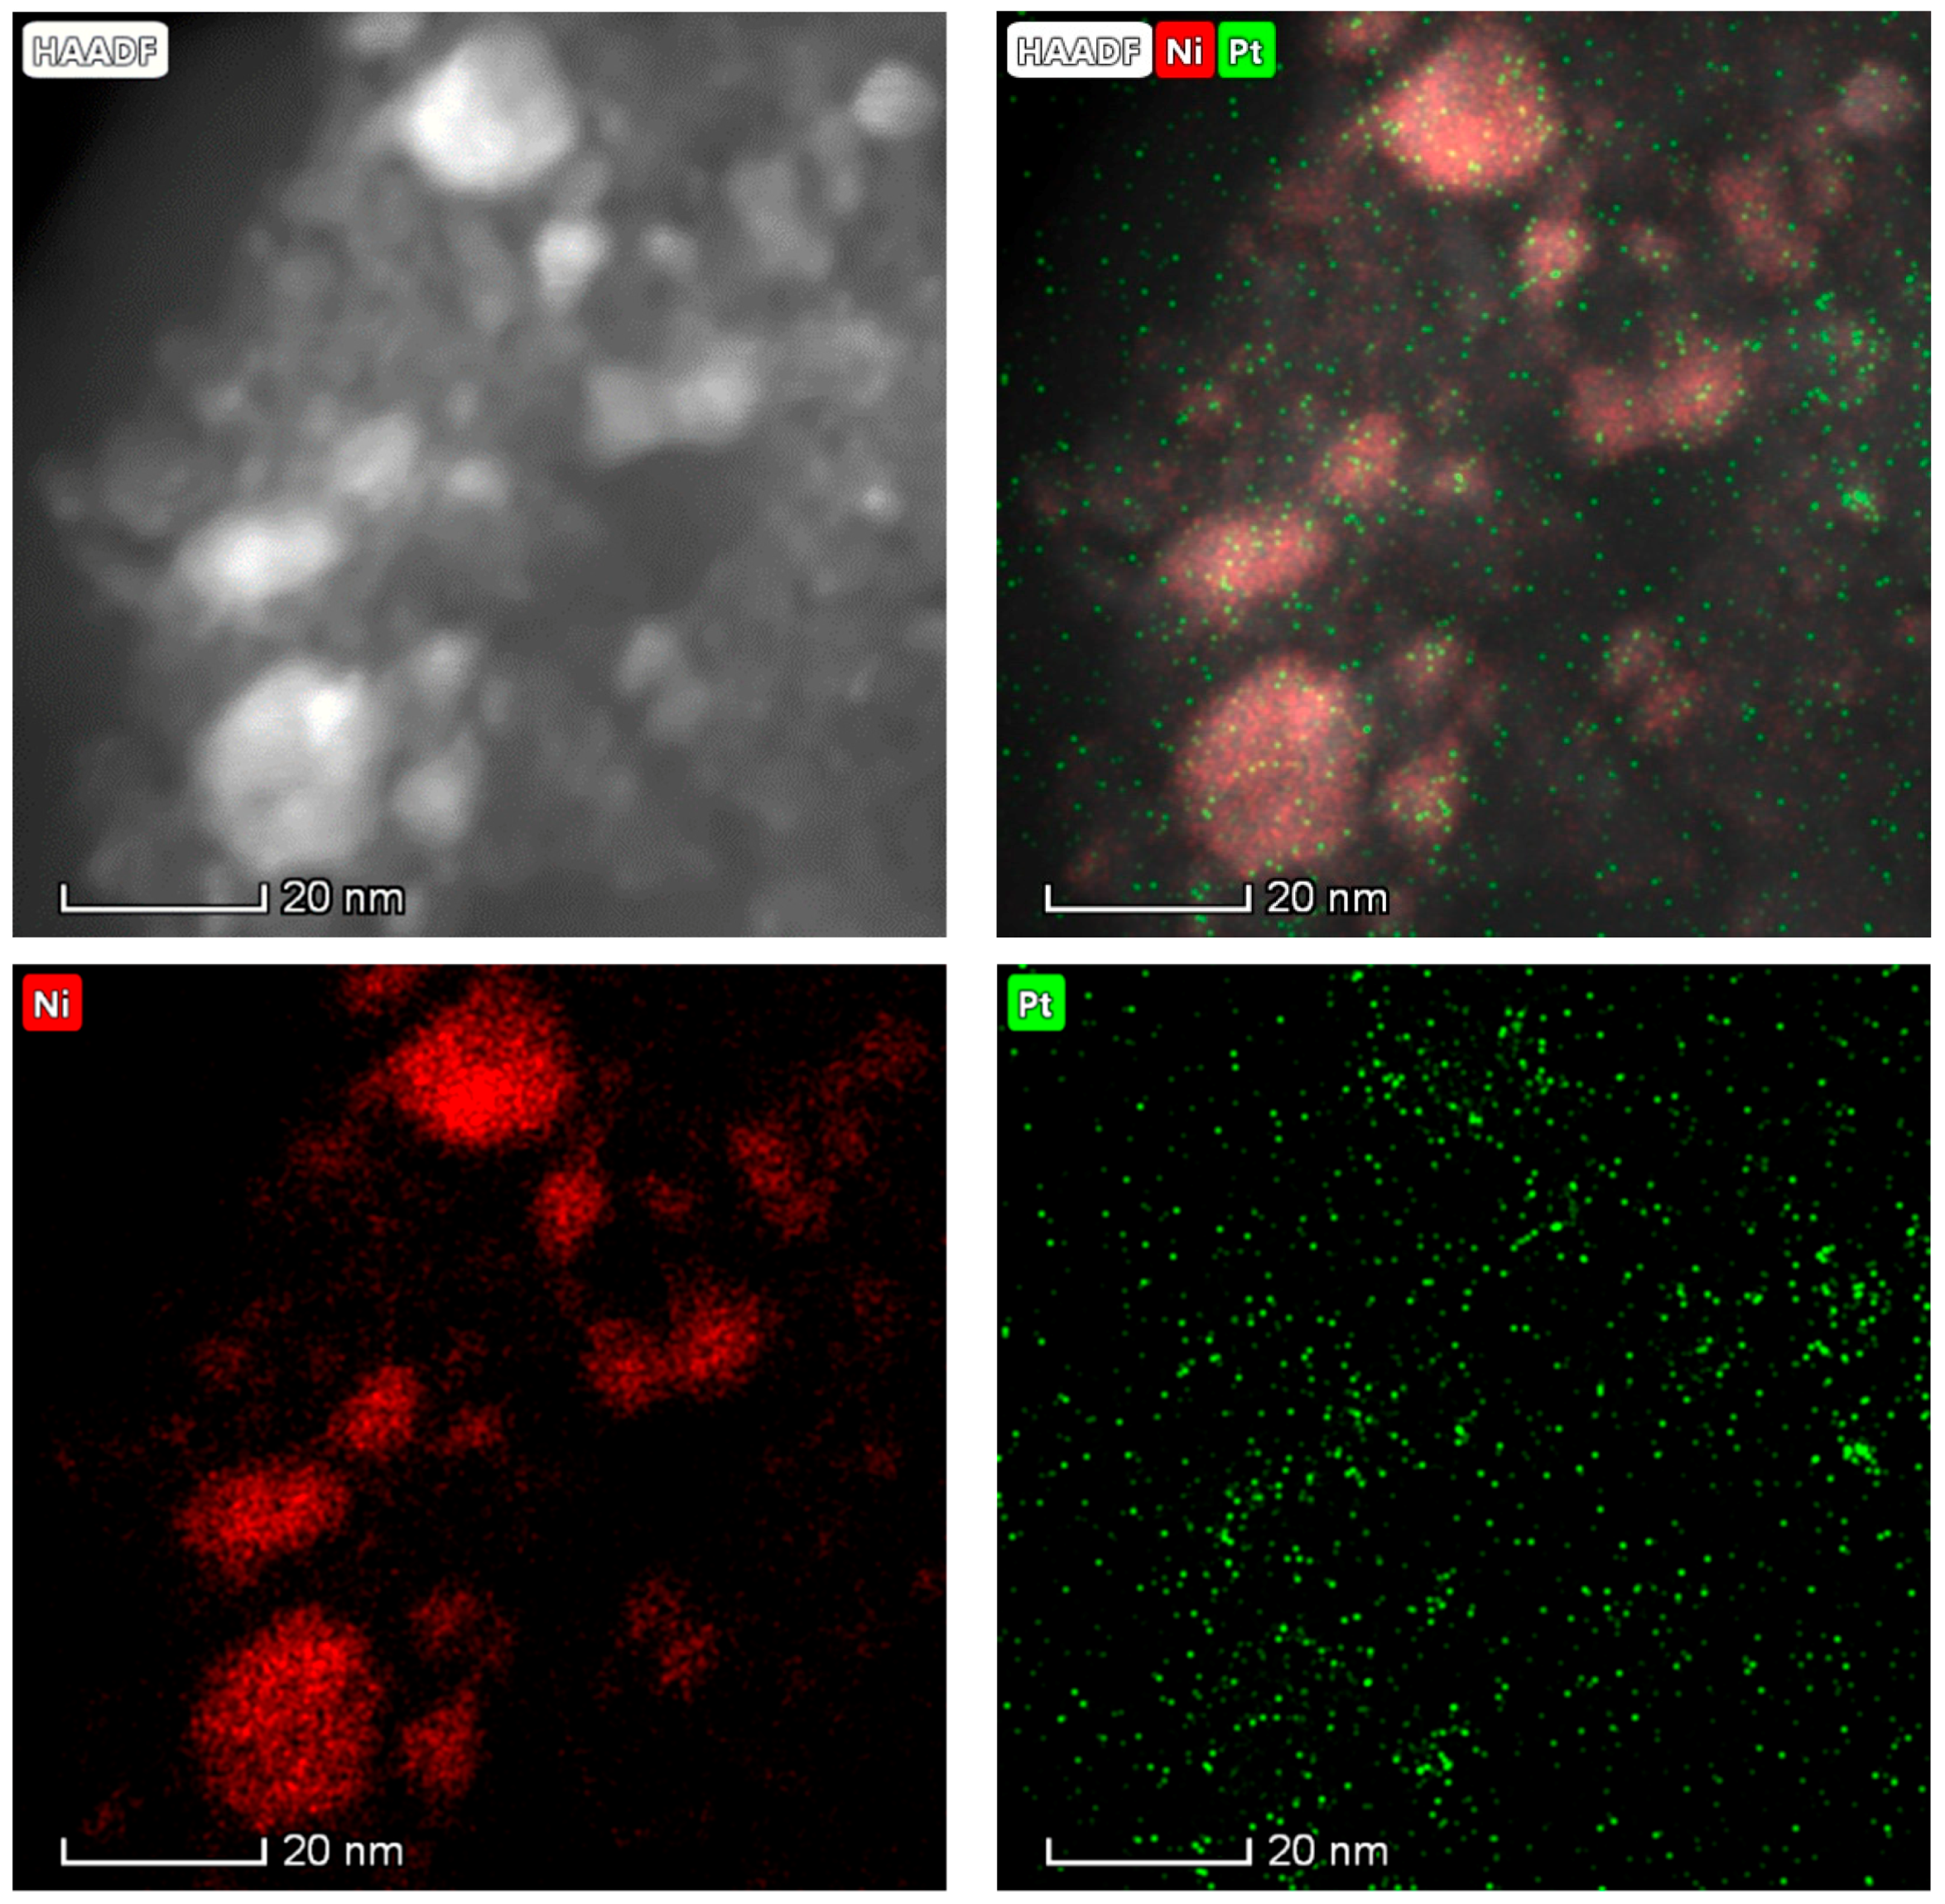
2.1. Catalyst Characterization

Catalysts were prepared corresponding to 20 wt.% Ni/Al2O3 promoted with 0, 0.1, 0.25, and 0.5 wt.% Pt. In addition, 0.5% Pt/Al2O3 was prepared as a reference. The X-ray diffractograms in Figure 1 show that all of the as-prepared Ni-containing catalysts presented diffraction peaks at 37.2, 43.4, 63.1, 75.5, and 79.4°, which points to the presence of NiO [50].
Unsurprisingly, Pt peaks are not observed due to the very low Pt metal loadings. The NiO particle sizes were obtained by applying the Scherrer equation to the 37.2° NiO peak, and the calculated particle sizes, as well as other textural properties, are listed in Table 1.
The NiO particle size of the bimetallic catalysts was similar to that of the Ni-only catalyst, indicating that the additional calcination step used during Pt addition (see Section 3.1) did not result in sintering of the NiO to form larger particles. As expected, the surface areas of 20% Ni/Al2O3 and the Ni-Pt bimetallic catalysts are also similar (129-138 m2/g), and the 0.5% Pt/Al2O3 catalyst has a higher surface area (196 m2/g) due to the absence of Ni.
Transmission Electron Microscopy (TEM) measurements and TEM observations coupled with Energy Dispersive X-Ray Spectroscopy (EDS) analyses provided additional information regarding particle size (see Figure 2a and Figure A1 in Appendix A), as well as insights into the composition of individual metal particles (see Figure 2b and Figure A2 in Appendix A) for the 20% Ni/Al2O3 and the 20% Ni-0.5% Pt/Al2O3 catalysts.
Notably, both catalysts contain metal particles in a narrow size range, with all particles measured having a diameter between 5 and 13 nm, irrespective of the catalyst. Moreover, as shown in Figure 2a, the vast majority of the metal particles in the monometallic formulation range between 6 and 9 nm, whereas the bimetallic Ni-Pt catalyst contains slightly larger metal particles in the 6 to 10 nm range. This is in agreement with the average NiO particle sizes calculated from XRD data (see Table 1), according to which the 20% Ni-0.5% Pt/Al2O3 catalyst exhibited slightly larger particles (8.7 nm on average) than the monometallic formulation (6.8 nm on average). The results of the elemental analysis (by EDS) of representative particles in the 20% Ni-0.5% Pt/Al2O3 catalyst – which were used to build the particle composition histogram in Figure 2b – show that the majority of metal particles display a Pt content between 0 and 5 wt.%, which is in line with the 2.4 wt.% Pt content that would be expected from the bulk metal loading. Interestingly, the elemental maps displayed in Figure A2 in Appendix A show that Pt-rich regions coincide with the location of Ni particles. Moreover, Pt was present in every single one of the particles analyzed by means of EDS, which suggests that Pt is either alloyed or closely associated with Ni, i.e., likely constituting a bimetallic phase as opposed to two distinct monometallic phases.
The TPR profiles shown in Figure 3 clearly show that Pt addition changes the reduction temperature of oxidized Ni species in the catalysts. Indeed, the 20% Ni/Al2O3 catalyst displays a broad reduction event with a maximum at 550 °C associated with the reduction of NiO to Ni0 on the γ-Al2O3 support [51]. This broad reduction event has two shoulders, including one with a local maximum at 350 °C attributed to the reduction of larger NiO particles that interact weakly with the support [51], and another above 600 °C assigned to the reduction of NiAl2O4 [32]. The Pt-containing catalysts also exhibit the same reduction events, with the first – occurring between 300 and 350 °C – being most likely associated with the reduction of large Ni ensembles either alloyed or in close proximity to Pt [49], and the broad peak above 500 °C with a high temperature (≥700 °C) shoulder being assigned to the reduction of NiO particles and NiAl2O4, respectively.
The most notable difference between 20% Ni/Al2O3 and the Pt-containing catalysts is the prominent reduction maximum occurring between 440-460 °C displayed by all bimetallic formulations. The TPR profile of the 0.5% Pt/Al2O3 catalyst contains a single reduction event at a similar temperature, which suggests that the peaks centered at ~450 °C are associated with the reduction of surface Pt. However, the 440-460 °C reduction maxima of the bimetallic catalysts are significantly larger than the maximum observed for the Pt-only catalyst. This indicates that the majority of the hydrogen uptake shown by the bimetallic catalysts between 350 and 500 °C must be due to the reduction of NiO, with the fact that small additions of Pt to Ni catalysts can greatly enhance the reducibility of the latter being well-documented in the literature [49,52]. Pt is known to facilitate hydrogen spillover [46], resulting in the observed shift in the reduction temperature of oxidized Ni species. Indeed, while hydrogen spillover causes the reduction of oxidized Ni sites in close proximity to Pt to shift to lower temperatures, the same phenomenon may shift the reduction of other Ni2+ sites (e.g., NiAl2O4) to higher temperatures due to the preferential engagement of hydrogen in the reduction of the former type of Ni sites.
The TPR results discussed above are consistent with the results of x-ray photoelectron spectroscopy (XPS) measurements performed on two representative catalysts, namely, 20% Ni/Al2O3 and 20% Ni-0.5% Pt/Al2O3 after reduction under H2 at 400 °C (the Ni 2p region of the resulting spectra is shown in Figure A3 in Appendix A). Integration of the peak corresponding to Ni0 indicated that while the concentration of metallic Ni on the surface of 20% Ni/Al2O3 is ~4.8 at.%, the corresponding value for 20% Ni-0.5% Pt/Al2O3 is ~7.0 at.%. This confirms that the addition of Pt to the Ni catalyst enhances its reducibility and leads to a considerably higher amount of reduced Ni sites at the catalyst surface.
H2 chemisorption was performed on the catalysts used in this study to identify the number of active sites available after the reduction step, i.e., preceding deoxygenation experiments (see Section 3.3). The amount of active metal sites was estimated assuming dissociative adsorption of the full amount of H2 adsorbed, which is displayed in Table 2 along with the theoretical H2 adsorption calculated for different scenarios. Notably, H2 adsorption increases dramatically from 0.095 mL/g for 20% Ni/Al2O3 to 0.461 mL/g for 20% Ni-0.1% Pt/Al2O3. Assuming that the number of Ni metal surface sites remains unaffected by the addition of Pt, the theoretical H2 adsorption expected after 0.1% Pt addition (with an unlikely 100% Pt metal dispersion) is calculated to be 0.152 mL/g. The fact that the observed increase in H2 adsorption is three times the theoretical value indicates that additional reduced Ni sites are created, which is in line with previous reports [49,52]. The amount of H2 adsorption does rise as Pt metal loading increases further; however, higher Pt metal loadings do not display the dramatic adsorption difference observed between the monometallic catalyst and 20% Ni-0.1% Pt/Al2O3. In fact, the H2 adsorption trend roughly corresponds to the amount expected from the incorporation of additional Pt (as calculated for a scenario assuming 50% Pt metal dispersion). Indeed, while 20% Ni-0.25% Pt/Al2O3 and 20% Ni-0.5% Pt/Al2O3 adsorb 0.560 and 0.639 mL/g H2, respectively, their theoretical adsorption would be 0.461 + (0.071 − 0.028) = 0.504 mL/g for 20% Ni-0.25% Pt/Al2O3 and 0.560 + (0.144 − 0.071) = 0.633 mL/g for 20% Ni-0.5% Pt/Al2O3 if the number of Ni metal surface sites remained unaffected by these increases in Pt loading. Therefore, albeit the addition of 0.1% Pt increases the number of adsorption sites from 2.55 × 10¹⁸/g to 1.24 × 10¹⁹/g, further augmenting the Pt loading from 0.1% to 0.5% affords significantly lower increases in the amount of reduced Ni surface sites, with 20% Ni-0.5% Pt/Al2O3 displaying 1.72 × 10¹⁹/g adsorption sites.
Since any CO evolved via decarbonylation risks interacting strongly with the surface of Ni catalysts, leading to their poisoning [6,7], the interaction of CO with these catalysts is of great interest. This is particularly true given that the addition of small amounts of Pt has been reported to lower the binding strength of CO on supported Ni catalysts and avoid the poisoning of active metal sites [49]. Therefore, two representative catalysts, namely, 20% Ni/Al2O3 and 20% Ni-0.5% Pt/Al2O3, were studied by means of CO temperature programmed desorption (TPD). The resulting TPD profiles (shown in Figure 4) include traces corresponding to CO and CO2, as both gases are evolved in these experiments through a complex desorption mechanism in which CO can be converted to CO2 via the Boudouard and water gas shift (WGS) reactions [49], with the latter reaction occurring due to the dehydroxylation of alumina [53]. Irrespective of the desorbed molecule, all desorption events take place in a temperature regime (<200 °C) characteristic of single site chemisorption, which is in turn indicative of high coverage [49]. Comparing the traces in Figure 4 corresponding to 20% Ni/Al2O3 and 20% Ni-0.5% Pt/Al2O3, it is evident that the peak temperature for CO desorption from the Pt-promoted catalyst is shifted to slightly lower temperature relative to the Ni-only catalyst. This confirms that Pt addition does lower the CO binding energy, which is advantageous since curbing the adsorption of CO on the metal should reduce the blocking of sites for deoxygenation reactions and help to prevent catalyst coking. Interestingly, above 100 °C, the Pt-promoted catalysts desorb a higher amount of CO2 than the Ni-only formulation, which can be attributed to an enhancement of the WGS reaction since thermogravimetric analysis results (vide infra) suggest that Pt addition disfavors the Boudouard reaction. In turn, this is consistent with previous reports in which a lowering of the binding energy of CO favors the WGS reaction and CO2/H2 formation [49]. This opens the prospect of in situ hydrogen generation that could reduce the need for exogenous hydrogen, which remains one of the main drawbacks to be overcome by deoxygenation technology.
Given the importance of the interaction between CO and the surface of the catalysts studied, CO TPD analyses were complemented by CO adsorption studies coupled with diffuse reflectance infrared Fourier transform spectroscopy (DRIFTS) measurements, the results of which are included in Figure 5.
As seen in Figure 5, two bands are observed on both catalysts—namely, a well-defined peak at ~2180 cm−1 and a broad feature at ~2120 cm−1—both of which can be assigned to CO adsorbed on metallic nickel sites [54,55]. Note that differences in the frequency of these bands in this and previously published reports can be attributed to the different pretreatments employed. In addition, the Pt-promoted catalyst also shows a large and well-defined peak at ~2077 cm−1, which is assigned to CO adsorbed on Pt sites [56]. However, of primary interest is the shift observed in the CO stretching frequency of the peak assigned to CO adsorbed on metallic Ni sites, the maximum of which occurs at 2175 and at 2183 cm−1 for the Ni-only and Ni-Pt catalysts, respectively. This shift is similar to that observed for other metal alloys and indicates that the alloying of Ni and Pt reduces electron back-donation from the Ni metal, which in turn results in a weaker Ni-CO bond [54,57]. Notably, this is in agreement with the conclusion that Pt addition lowers the binding strength of CO on supported Ni catalysts based on the CO TPD results reported above and elsewhere [49]. Upon heating at 50 °C in inert atmosphere, the IR absorption bands above 2100 cm−1 (i.e., those associated with CO adsorbed on Ni sites) disappeared (results not shown). This is consistent with previously published results [55] and confirms the low thermal stability and labile nature of these adspecies, which Parizotto et al. have claimed is indicative of changes in the superficial structure of Ni caused by the presence of small amounts of Pt [55].

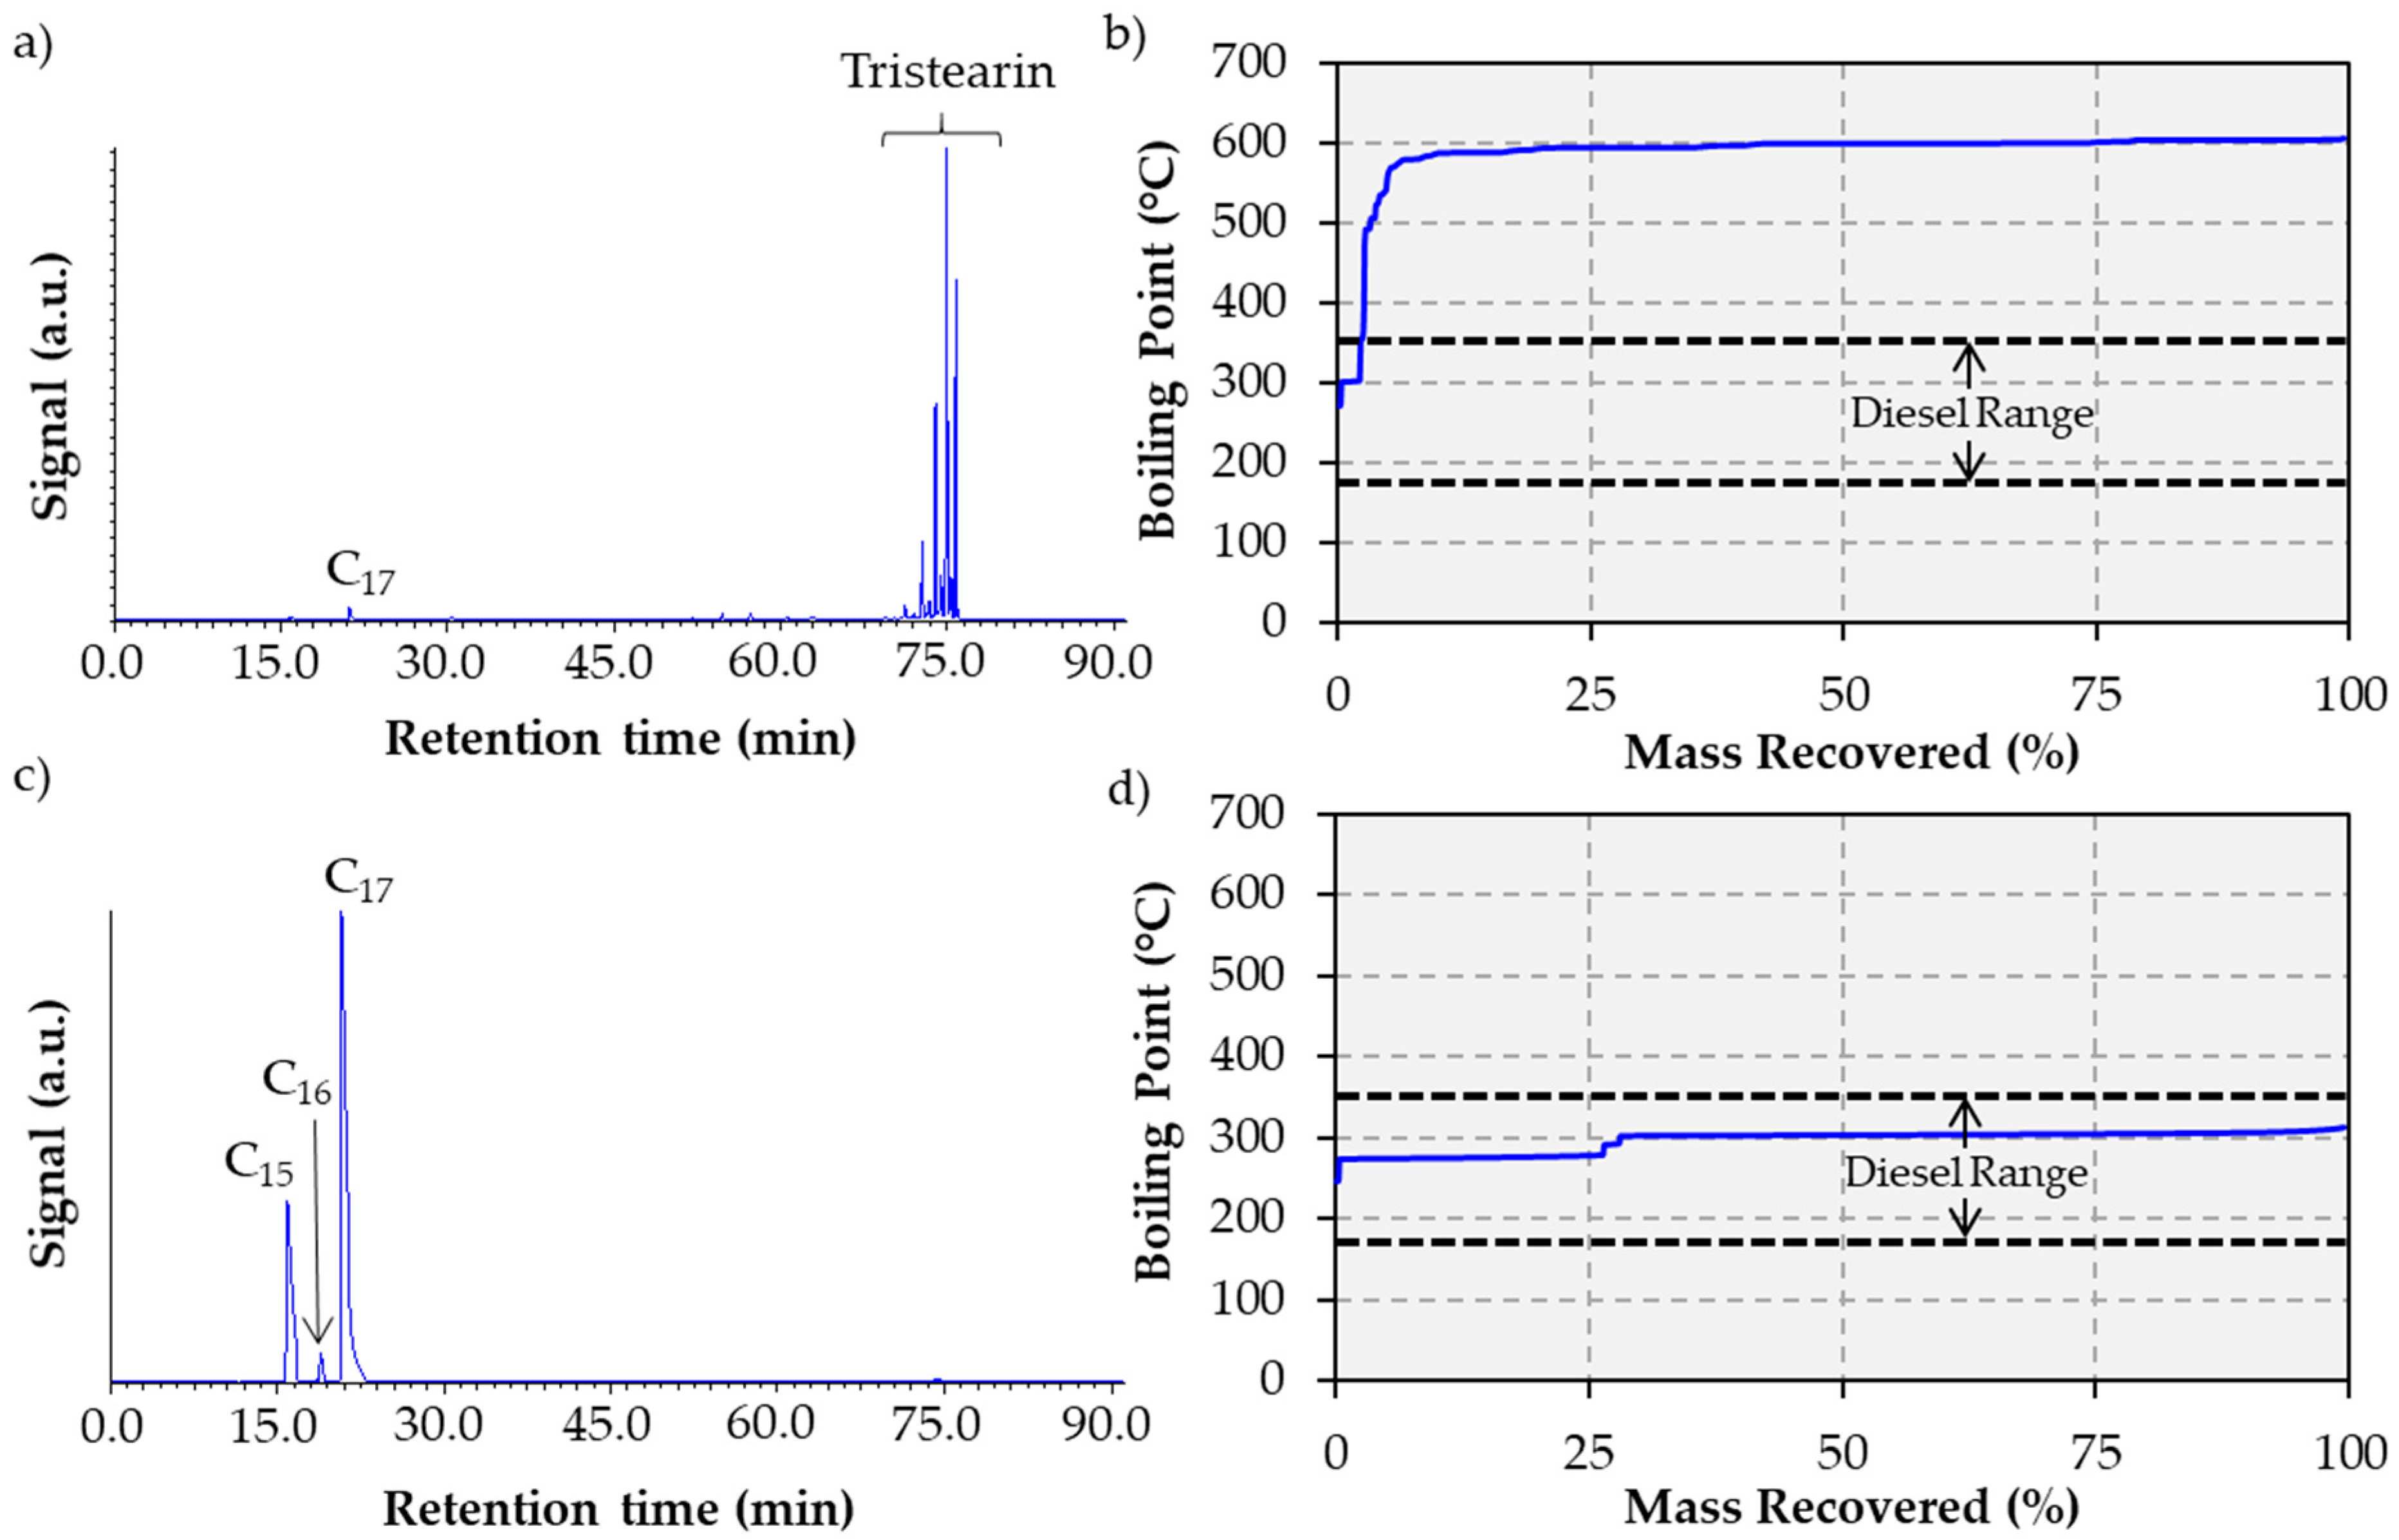
2.2. Tristearin Deoxygenation in Semi-batch Mode

The results of tristearin deoxygenation experiments are summarized in Table 3.
Remarkably, whereas the monometallic catalyst afforded a negligible (2%) conversion, the 20% Ni-0.5% Pt/Al2O3 catalyst exhibited a quantitative conversion of the feed to diesel-like hydrocarbons, and the gas chromatograms and boiling point distribution plots (BPDPs) are shown in Figure 6.
Since monometallic Pt-based catalysts have been widely reported to be active in the deoxygenation of lipids to fuel-like hydrocarbons [19,22,25,30,58], a Pt-only catalyst with the same loading as that used for the best Ni-Pt formulation identified in this study (0.5 wt.%) was tested using the same reaction conditions. Although 0.5% Pt/Al2O3 did indeed show a higher conversion (5%) than 20% Ni/Al2O3 (2%), all bimetallic formulations achieved a considerably greater tristearin conversion. Tellingly, the bimetallic catalyst with the lowest Pt loading displayed a conversion of 21%, with this value being higher than the sum of the conversions achieved by the monometallic catalysts. This indicates that its improved performance stems from a synergistic effect between Ni and Pt and not from the addition of their individual contributions. Indeed, 20% Ni-0.5% Pt/Al2O3 was found to afford a quantitative conversion and a 96% yield of diesel range (C10-C17) hydrocarbons with a 65% selectivity to C17. The identity of individual products was confirmed via MS, which verified that complete deoxygenation was achieved since fuel-like hydrocarbons were the only products detected. The dramatic increase in tristearin conversion observed as Pt loading increases from 0.1-0.5% is curious, particularly since pulsed H2 chemisorption revealed that increasing the Pt loading beyond 0.1% did not significantly augment the amount of reduced Ni sites (see Section 2.1). Therefore, other phenomena must be invoked to explain the increased conversion. As mentioned above, Pt addition curbs the adsorption of CO (see Section 2.1)—and thus coke formation (see Section 2.3)—on surface Ni active sites, resulting in a higher amount of active sites available for deoxygenation reactions, which can in turn explain how promotion with Pt can lead to improved conversion.
It is important to note that all deoxygenation reactions were performed using a 100% H2 atmosphere, which has been shown to lead to improved results, even if H2 is not directly consumed by the deCOx reactions [5,31,33,59]. The deoxygenation of lipids typically proceeds preferentially via HDO at lower reaction temperatures when both HDO and deCOx pathways are viable [60,61,62]. Therefore, it is remarkable that all catalysts yielded negligible amounts (≤1%) of C18—the primary HDO product—indicating that deoxygenation proceeds almost exclusively via deCOx. Parenthetically, most experiments also yielded small amounts (<1%) of stearyl stearate, an intermediate formed in the deoxygenation of lipids through esterification reactions involving fatty acid and alcohol intermediates [36]. Indeed, for some experiments involving Ni-Pt catalysts, the MS analysis of the product mixture (not shown) revealed small amounts of stearic acid, albeit neither fatty acids nor alcohols were detected in repeat experiments. Nevertheless, the stearic acid observed in some product mixtures suggests that the conversion of tristearin to hydrocarbons proceeds through a fatty acid intermediate, which is in line with previous reports [31,35] and explains the stearyl stearate detected [32,36]. Notably, the small amounts of intermediates observed suggest that deoxygenation occurs rapidly after intermediate formation, indicating that the latter represents the rate limiting step.

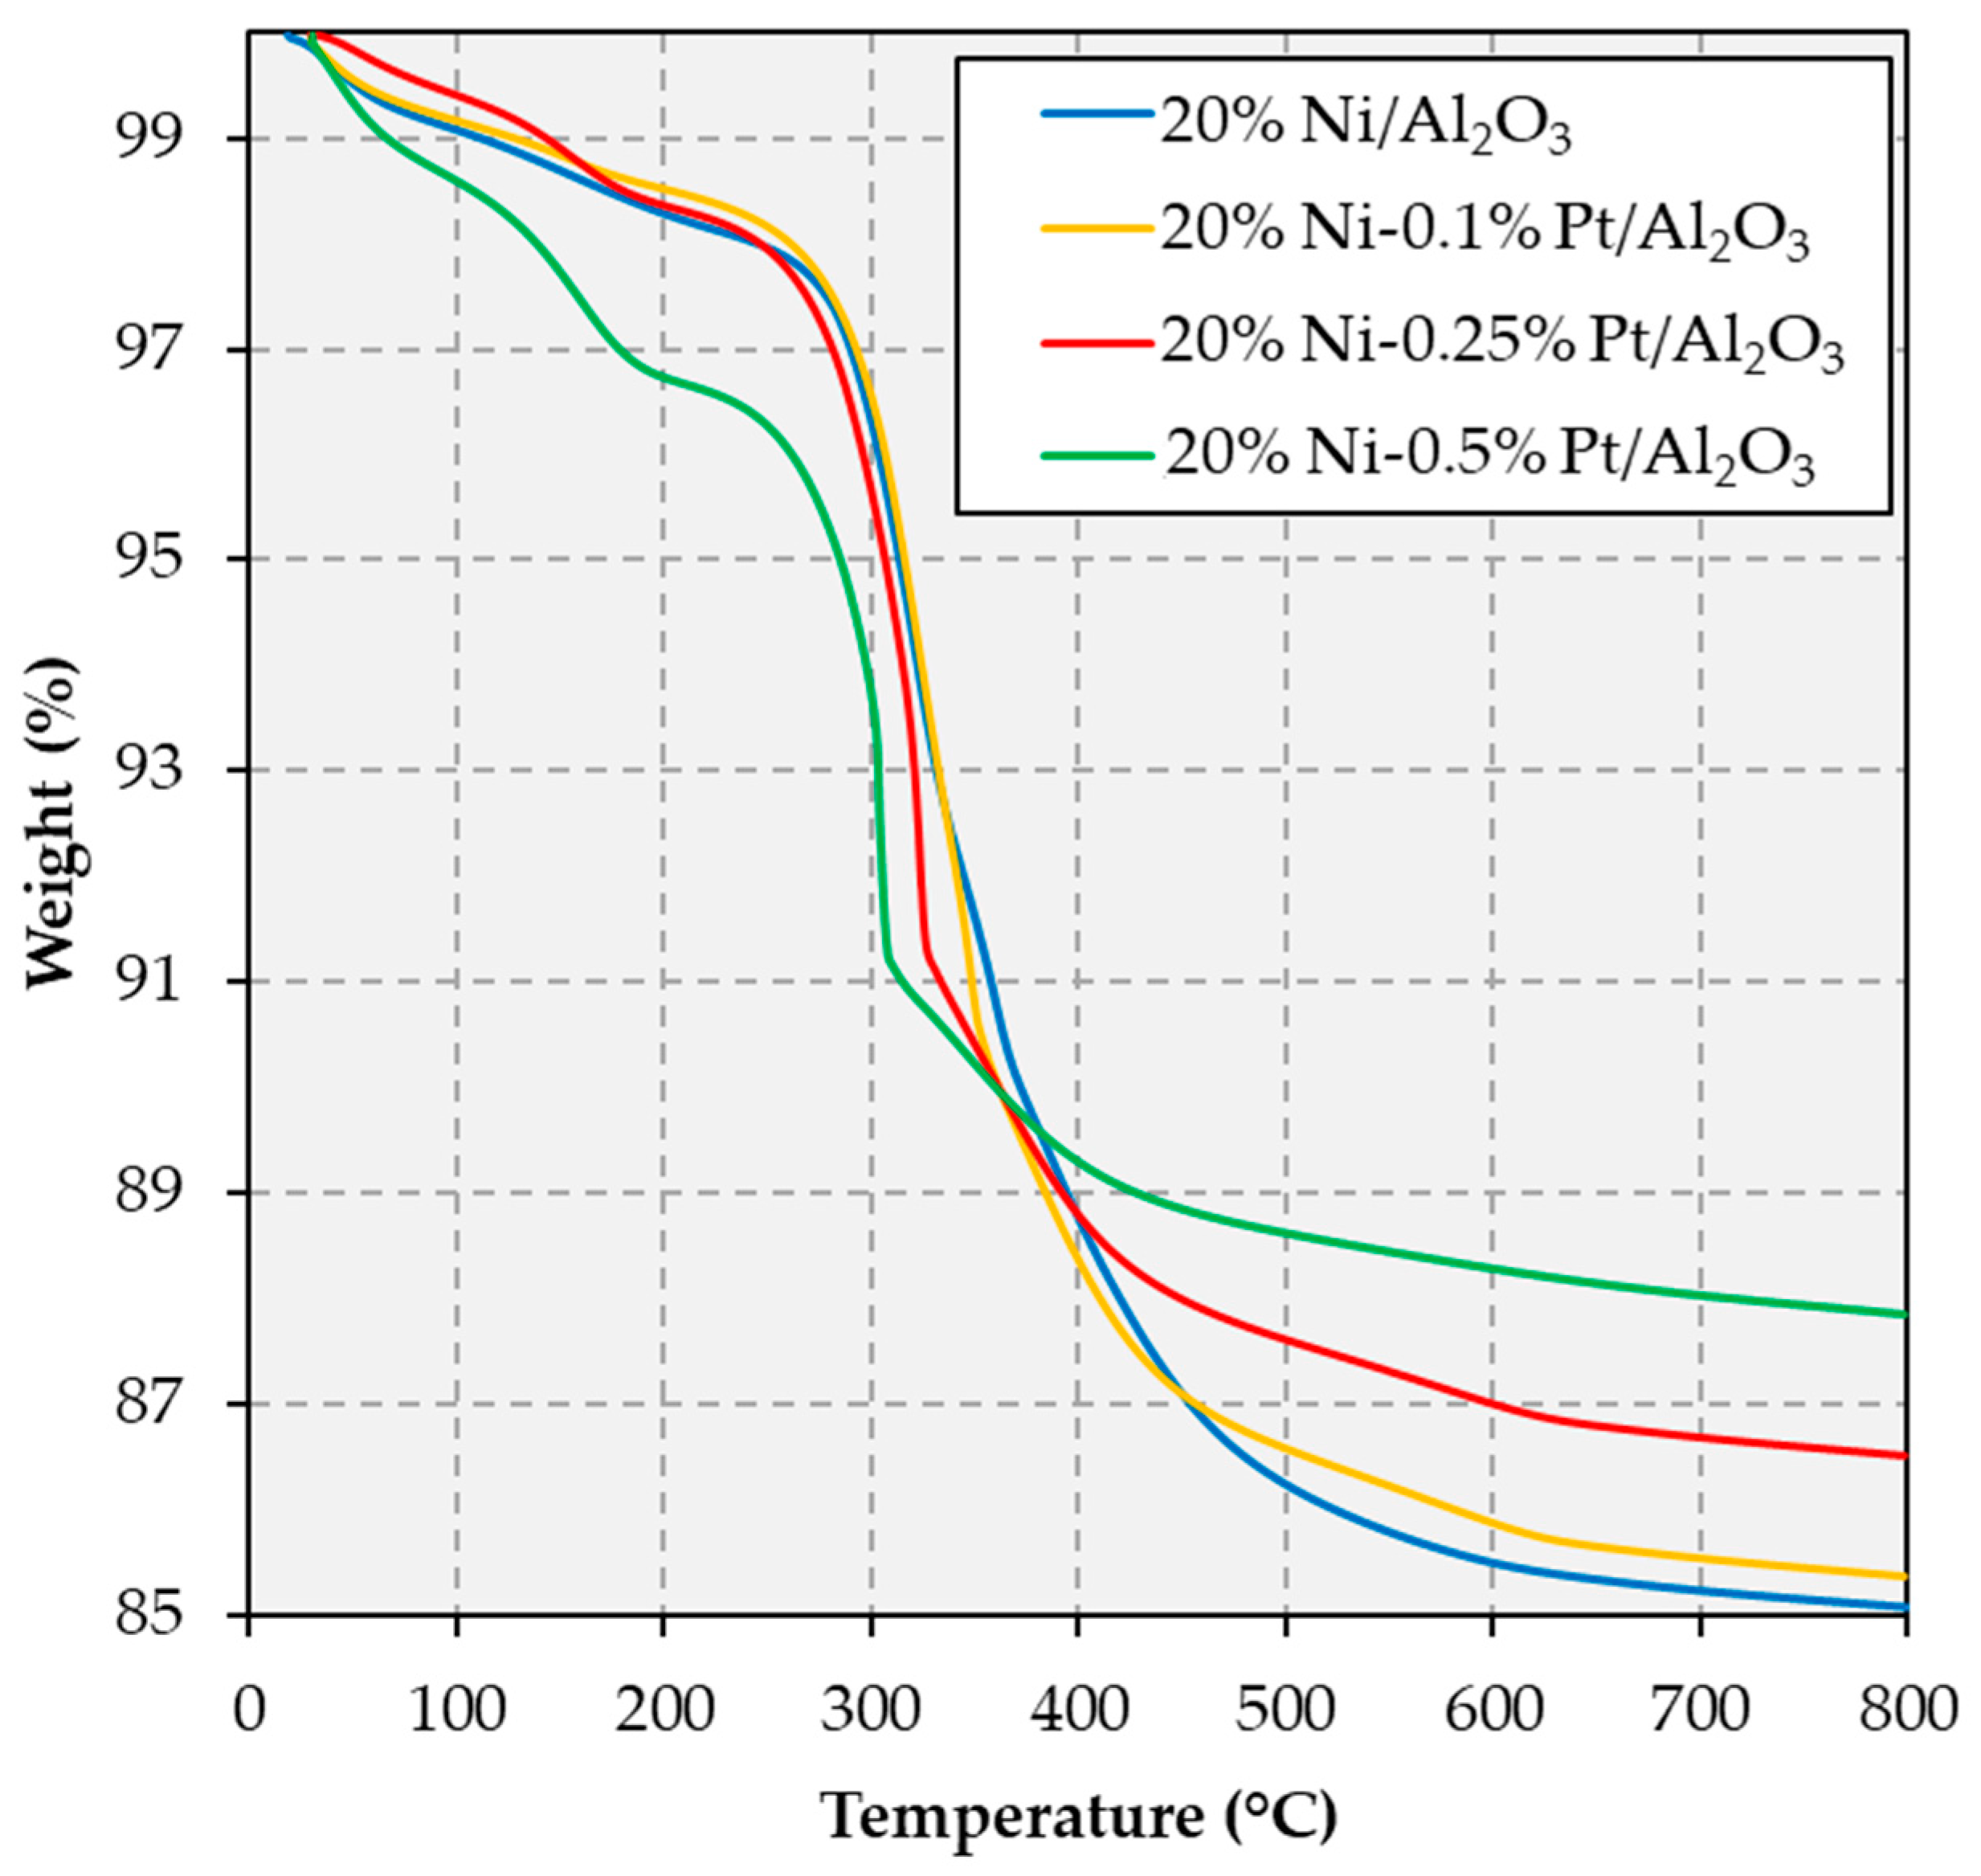
2.3. Spent Catalyst Characterization and Catalyst Stability

While coking represents the primary deactivation pathway of Ni catalysts, it has been suggested that the addition of Pt to Ni-based formulations can lessen deactivation by curbing coke formation [49]. Therefore, representative spent catalysts were subjected to thermogravimetric analysis (TGA) in air, with the resulting profiles being shown in Figure 7.
All TGA profiles show their major weight loss event below 400 °C, which is attributed to the desorption and/or combustion of residual reactants, intermediates, and products (or soft coke) [63]. Moreover, weight losses are relatively minor above 400 °C, indicating that minimal amounts of graphitic or hard coke are present [63]. Saliently, there is a clear inverse relationship between total weight loss and Pt metal loading. Indeed, the total weight loss is 14.9, 14.6, 13.5, and 12.2%, for 20% Ni/Al2O3, 20% Ni-0.1% Pt/Al2O3, 20% Ni-0.25% Pt/Al2O3, and 20% Ni-0.5% Pt/Al2O3, respectively. Similarly, there is also an inverse relationship between the extent of coking/fouling and catalytic activity, 20% Ni/Al2O3, and 20% Ni-0.5% Pt/Al2O3 affording negligible and quantitative conversion, respectively. Therefore, the improved activity obtained by increasing Pt loading may be attributed, at least in part, to reduced coking and fouling. This can be attributed to the ability of Pt to facilitate the spillover of atomic H onto the catalyst surface [49], thereby facilitating the desorption of unsaturated adspecies via hydrogenation, and hence the removal of coke precursors and material blocking pores and active sites [64]. However, given that the weight loss difference between the worst and best performing catalyst is only 2.7%, reduced coking and fouling does not appear to be the major promoting effect from Pt addition influencing catalyst performance, although it does appear to be a minor contributing factor.
In order to test the chemical stability of the catalysts, representative product mixtures were filtered to remove the spent solid catalysts before analyzing the filtrates via inductively-coupled plasma-atomic emission spectroscopy (ICP-AES) to test for Ni and Pt in solution. These leaching studies revealed <0.1 ppm of Ni and <0.5 ppm of Pt in the filtrates recovered from the reaction involving 20% Ni-0.5% Pt/Al2O3, which provides a first indication of the stability of this catalyst under the reaction conditions employed. Parenthetically, this is in agreement with the results of previous studies in which supported Ni catalysts (including 20% Ni/Al2O3) displayed similar chemical stability when tested under more stringent reaction conditions (≥350 °C, 4–6 h reaction time) [31,35]. In addition, in order to investigate the possibility of metal particle aggregation and/or transition metal redistribution, representative spent catalysts – namely, 20% Ni/Al2O3 and 20% Ni-0.5% Pt/Al2O3 – were analyzed via TEM-EDS (see Figure 8 and Figure A4 in Appendix A).
Albeit the vast majority of metal particles within both spent catalysts remained within the same narrow size range observed for the fresh formulations, i.e., between 5 and 13 nm (see Figure 2a), a relatively small amount of larger particles were formed during the reaction, this effect being slightly more pronounced for the Ni-only catalyst. Nevertheless, as shown in Figure 8a, the vast majority of metal particles in the spent monometallic formulation range between 5 and 8 nm, whereas the majority of metal particles in the spent bimetallic catalyst range between 6 and 13 nm, with these results being similar to those observed for the fresh formulations (see Figure 2a). The particle composition histogram of the spent 20% Ni-0.5% Pt/Al2O3 catalyst (Figure 8b) shows that the majority of metal particles display a Pt content between 0.5 and 3.4 wt.% and a slightly narrower Pt content distribution than that displayed by the fresh formulation (Figure 2b). As was also observed in the fresh bimetallic catalyst (see Figure A2 in Appendix A), the elemental maps for the spent Ni-Pt formulation (displayed in Figure A4 in Appendix A) show that Pt-rich regions coincide with the location of Ni particles. These results indicate that these catalysts only experience small changes in particle size and transition metal distribution during the reaction, which suggests that these formulations are stable under the reaction conditions employed in this study.
Admittedly, catalyst stability is better assessed in experiments performed using a more industrially relevant set of reaction conditions than those employed in this study. Indeed, in order to test the lifetime or stability of a catalyst, a continuous fixed-bed reactor should ideally be employed to upgrade a realistic and concentrated feed (as opposed to a model, dilute feed) in an experiment lasting multiple days—as reported in a recent publication [65]—in order to monitor how conversion changes with time on stream. Such an experiment was performed and 20% Ni-0.5% Pt/Al2O3 afforded excellent results, upgrading a solution of 75 wt.% yellow grease (used cooking oil) in dodecane at 375 °C, using 0.5 g of catalyst and 0.5 g of SiC as catalyst diluent and a feed solution flow rate of 0.75 mL/h (equivalent to a WHSV of 1 h−1). The liquid products recovered after 24, 48, and 72 hours consisted of 100% diesel-like (C10-C20) hydrocarbons, which suggests excellent catalyst stability. However, a detailed presentation and discussion of these results lies beyond the scope of the current article and will be the focus of a future contribution.

3. Materials and Methods

3.1. Catalyst Preparation

Catalysts were prepared by excess wetness impregnation using Ni(NO3)2·6H2O (Alfa Aesar, Haverhill, MA, USA) and/or Pt(NH3)4(NO3)2 (Sigma Aldrich, St. Louis, MO, USA) as the metal precursors. Beads of γ-Al2O3 (Sasol, Johannesburg, South Africa; surface area of 216 m2/g) used as the support were crushed to a particle size of <150 µm before impregnation. Each Ni-based catalyst contained 20 wt.% Ni, while Pt loading was varied at 0.0, 0.1, 0.25, and 0.5 wt.%. A monometallic 0.5 wt.% Pt/Al2O3 catalyst was also prepared for comparison purposes. After each impregnation, materials were dried overnight at 60 °C under vacuum prior to calcination for 3 h at 500 °C in static air. Ni-Pt catalysts were prepared using two sequential impregnation steps.

3.2. Catalyst Characterization

The surface area, pore volume, and average pore radius of the catalysts were determined by N2 physisorption using previously described instruments and methods [30]. The average NiO particle size was calculated by applying the Scherrer equation to the NiO peaks observed in powder X-ray diffractograms. The equipment and procedures for acquiring the X-ray diffractograms are described elsewhere [35]. TEM observations were conducted on the 20% Ni/Al2O3 and the 20% Ni-0.5% Pt/Al2O3 catalysts. The catalyst samples were loaded onto lacey carbon 400 mesh copper (C/Cu) grids through a sonication-assisted method in which a few milligrams of each catalyst were sonicated in 1 mL of ethanol for 20 min before placing one drop of the resulting suspension onto a blank C/Cu grid that was subsequently allowed to dry in air. Samples thus prepared were then introduced into a Thermo Scientific (Waltham, MA, USA) Talos F200X analytical electron microscope, operated at 200 keV and equipped with a 4 silicon drift detector (SDD)-based EDS system for quantitative chemical composition analysis and elemental distribution mapping. TPR and pulsed H2 chemisorption measurements were performed using calcined catalyst samples (150 mg). The catalyst was loaded in a quartz U-tube reactor connected to a Micromeritics (Norcross, GA, USA) Autochem II analyzer equipped with a thermal conductivity detector (TCD). The temperature was monitored using a thermocouple situated in the catalyst bed. TPR measurements were performed using a method previously described [35]. Prior to pulsed H2 chemisorption measurements, calcined catalysts were reduced in situ under flowing 10% H2/Ar at 350 °C for 1 h. The reactor was then purged with Ar (50 cm3/min) at 450 °C for 30 min and subsequently cooled to 50 °C under flowing Ar. After the TCD signal stabilized, 0.025 cm3 (STP) of 10% H2/Ar was pulsed into a flow of Ar carrier gas (50 cm3/min) directed to the reactor. Pulsing of 10% H2/Ar continued at 3 min intervals until the area of the H2 peaks remained constant. Samples were reduced prior to XPS measurements in a Lenton tube furnace under flowing 90% H2 in He (10 mL/min) using a heat ramp of 10 °C/min to reach a temperature of 400 °C, which was held for one hour. After reduction, the tube furnace was filled with pure He, sealed using Swagelok® caps, transported to a Kratos (Manchester, UK) AXIS Supra XPS instrument, and placed inside a front-loading glovebox, which was then evacuated and subsequently filled with N2. The samples were removed from the sealed tube furnace, affixed to a sample bar using double-sided carbon tape, and loaded into the flexi-lock sample analysis chamber (SAC). Once the pressure reached below 10−7 torr, XPS analysis was performed using an Al mono-chromatic X-ray source (1486.69 eV) and an electron flood gun for charge neutralization. Wide scans were performed at a pass energy of 160 eV and high-resolution scans were performed at a pass energy of 20 eV. Data was analyzed using CasaXPS v. 2.3.19PR1.0 and all peaks were fitted using a Shirley background. Ni fits were developed using model parameters adapted from the work of Grovesnor et al. [66]. CO-TPD measurements were performed using a Micromeritics (Norcross, GA, USA) AutoChem II analyzer equipped with a mass spectrometer—Pfeiffer (Annecy, France) ThermoStar GSD301—programmed to follow the main mass-over-charge (m/z) signals attributed to CO and CO2—namely m/z = 28 and m/z = 44, respectively—with the contribution to the former signal stemming from CO2 being subtracted to fully deconvolute CO and CO2. Catalysts were pre-reduced in situ at 350 °C for 3 h under a flow of 10% H2/Ar (60 mL/min). The catalysts were then purged at 450 °C for 30 min under flowing Ar (60 mL/min) prior to being cooled to room temperature and exposed to a flow (100 mL/min) of ultrapure CO for 1 h. The system was then flushed with Ar (100 mL/min) for 1 h to remove any trace of physisorbed CO. TPD measurements were then performed by raising the temperature from room temperature to 800 °C at a rate of 10 °C/min. TGA of the spent catalysts was performed under flowing air (50 mL/min) on a TA instruments Discovery Series thermogravimetric analyzer. The temperature was ramped from room temperature to 800 °C at a rate of 10 °C/min. DRIFTS was performed on the catalysts after CO adsorption using a Thermo Scientific (Waltham, MA, USA) Nicolette 6700 FTIR instrument fitted with a Harrick Scientific (Pleasantville, NY, USA) praying mantis DRIFTS cell equipped with a high temperature reaction chamber. Both the catalyst pretreatment and the CO adsorption methods used prior to spectra acquisition mirrored those employed for the CO TPD measurements described above, except gases were flowed at a rate of 50 mL/min due to limitations of the DRIFTS cell. For temperature-induced desorption studies coupled with DRIFTS measurements (results not shown), desorption was carried out in steps, pausing at each temperature at which spectra were acquired (50, 100, 150, 200, and 250 °C) for five minutes to allow for the temperature to stabilize and for a spectrum to be collected, and a ramp of 10 °C/min was used between these temperatures.

3.3. Deoxygenation Experiments

The calcined catalyst (<150 µm particle size) was dried overnight at 60 °C under vacuum before use. The dried catalyst (0.5 g) was then placed into a mechanically stirred 100 mL stainless steel autoclave (Parker, Cleveland, OH, USA), which was first purged with Ar and then pressurized to 70 psi with 10% H2/Ar and a gas flow (60 mL/min). This flow and pressure were maintained during a catalyst reduction step performed at 350 °C for 3 h. Temperature was measured by a K-type thermocouple placed inside a thermowell. The reactor was then cooled to room temperature and purged with Ar. After cooling, the liquid solvent (22 g) was added through an opening on the reactor head. The reactor was then opened to add the solid feed (1.8 g). Dodecane (99+%, from Alfa Aesar, Haverhill, MA, USA) and tristearin (95%, from City Chemical, West Haven, CT, USA) were used as the solvent and the model triglyceride feed, respectively. The reactor was resealed and purged three times with Ar prior to being pressurized with H2 to 580 psi. Once at this pressure, the reactor was heated to 260 °C under a constant flow of H2 (60 mL/min), while the contents were mechanically stirred (1000 rpm). Stirring and H2 gas flow were held constant through the duration of the experiment (3 h). Volatile liquid products were collected in a condenser placed downstream of the reactor and upstream from a backpressure regulator. At the end of the experiment, the reactor was cooled to room temperature (using forced air and an ice bath), depressurized, and opened. The liquid and solid products recovered were separated by gravity filtration. The solids were rinsed with chloroform to recover additional liquid product from the spent catalyst. Excess chloroform was removed from the combined filtrate and washings by rotatory evaporation prior to analysis.

3.4. Liquid Product Analysis

The liquid products were analyzed using a combined Simulated Distillation-GC and GC-MS method purposely devised to identify and quantify the reactants, intermediates, and products involved in the upgrading of fats and oils to hydrocarbons. Detailed information about the development and application of this method is available elsewhere [67]. The analyses were performed using an Agilent (Santa Clara, CA, USA) 7890B GC system equipped with an Agilent (Santa Clara, CA, USA) 5977A extractor MSD and a flame ionization detector (FID). The multimode inlet, which contained a helix liner, was run in split mode (15:1; split flow, 48 mL/min) with an initial temperature of 100 °C. He was used as the carrier gas and a 1 μL injection was employed. Upon injection, the inlet temperature was immediately increased to 380 °C at a rate of 8 °C/min, and the temperature was maintained for the course of the analysis. The oven temperature was increased upon injection from 40 °C to 325 °C at a rate of 4 °C/min, followed by a ramp of 10 °C/min to 400 °C, which was maintained for 12.5 min. The total analysis run time was 91.25 min. An Agilent (Santa Clara, CA, USA) J&W VF-5ht column (30 m × 250 µm × 0.1 µm) rated to 450 °C was used. Column eluents were directed to a Siltek MXT connector that split the flow into two streams, with one leading to the MSD (J&W Ultimetal Plus Tubing, 11 m × 0.25 mm i.d.) and one leading to the FID (J&W Ultimetal Plus Tubing, 5 m × 0.25 mm i.d.). The MS zone temperatures (MS source at 230 °C and quadrupole at 150 °C) were held constant for the duration of the analysis. A 1.75 min solvent delay was implemented and the MSD scanned from 10 to 700 Da. The FID was set to 390 °C with the following gas flow rates: H2 = 40 mL/min; air = 400 mL/min; He makeup = 25 mL/min. Quantification was performed using cyclohexanone as the internal standard. Agilent (Santa Clara, CA, USA) MassHunter Acquisition and SimDis Expert 9—purchased from Separation Systems Inc. (Gulf Breeze, FL, USA)—software packages were respectively used to perform chromatographic programming and to process the GC-FID data acquired. Solvents (i.e., chloroform and dodecane) were quenched and/or subtracted prior to data processing.

4. Conclusions

Results of catalyst screening tests in a semi-batch reactor show that Pt is an effective promoter of supported Ni catalysts in the deCOx of tristearin at 260 °C, with the conversion increasing from 2% over 20% Ni/Al2O3 to 100% over 20% Ni-0.5% Pt/Al2O3. In addition, 20% Ni-0.5% Pt/Al2O3 yielded a selectivity to diesel-like hydrocarbons (C10-C17) of 96% with a 65% selectivity to C17, the primary deCOx product. Notably, these improvements in the deCOx performance result from a synergistic effect of the two metals, as indicated by the fact that 20% Ni-0.5% Pt/Al2O3 displays a conversion significantly higher than the sum of the conversion values afforded by monometallic 20% Ni/Al2O3 and 0.5% Pt/Al2O3 catalysts. Catalyst characterization reveals that the superior activity of Ni-Pt relative to Ni-only catalysts is not a result of Ni particle size effects or surface area differences, but rather stems from several other phenomena, including the improved reducibility of NiO when Pt is present. Indeed, H2 pulsed chemisorption measurements identified 2.55 × 10¹⁸/g and 1.72 × 10¹⁹/g adsorption sites on 20% Ni/Al2O3 and 20% Ni-0.5% Pt/Al2O3, respectively. This suggests that the addition of a small amount of Pt to the supported Ni catalyst reduced at 350 °C dramatically increases the amount of reduced surface metal sites, which are believed to be the active sites for deCOx reactions. Moreover, CO-TPD measurements suggest that Pt addition curbs the adsorption of CO on the catalyst surface, which should decrease catalyst poisoning by any CO evolved via decarbonylation and make additional active sites available for deoxygenation reactions and/or prevent catalyst coking. Further, CO adsorption studies coupled with DRIFTS measurements indicate that Pt addition weakens the Ni-CO bond and lowers the binding strength of CO on surface Ni sites. Finally, TGA of the spent catalysts recovered from deCOx experiments suggests that the beneficial effect of Pt on catalyst performance can also be explained by decreased coking and fouling. The majority of the surface deposits observed corresponded to strongly adsorbed reactants, intermediates, and products (or soft coke), as only a small amount of hard coke was detected. The ability of Pt to chemisorb H2 and facilitate H migration across the surface of the catalyst presumably helps remove these adspecies via hydrogenation, which explains the inverse relationship between Pt loading and the extent of coking and fouling.

Author Contributions

Individual contributions are as follows: conceptualization, E.S.-J. and M.C.; methodology, R.L., E.S.-J., and M.C.; software, M.W.; validation, R.L., K.H., and M.W.; formal analysis, R.L., R.P., D.Q., M.I., and T.M.; investigation, R.L., T.M., K.H., and M.W.; resources, E.S.-J. and M.C.; data curation, R.L. and Y.S.; writing—original draft preparation, R.L.; writing—review and editing, E.S.-J. and M.C.; visualization, R.L.; supervision, R.L., E.S.-J., and M.C.; project administration, E.S.-J. and M.C.; funding acquisition, E.S.-J. and M.C.

Funding

This work was supported in part by the National Science Foundation (NSF) under grant Nos. 1437604, 1531637, and 1444779, as well as by a Research Support Grant from the University of Kentucky Office of the Vice President for Research and a Grant from the University of Kentucky Student Sustainability Council.

Conflicts of Interest

The authors declare no conflict of interest. The funders had no role in the design of the study; in the collection, analyses, or interpretation of data; in the writing of the manuscript, or in the decision to publish the results.

Appendix A

Figure A1. TEM micrographs of 20% Ni/Al2O3 (left) and 20% Ni-0.5% Pt/Al2O3 (right) showing the similar metal particle size of the monometallic and bimetallic formulations.
Catalysts 09 00200 g0a1
Figure A2. High-angle annular dark-field (HAADF) scanning transmission electron micrograph (top left) of a region within the 20% Ni-0.5% Pt/Al2O3 catalyst and the corresponding elemental maps of both Ni and Pt (top right), Ni only (bottom left), and Pt only (bottom right).
Catalysts 09 00200 g0a2
Figure A3. Nickel 2p X-ray photoelectron spectra of 20% Ni/Al2O3 and 20% Ni-0.5% Pt/Al2O3 after reduction under H2 at 400 °C.
Catalysts 09 00200 g0a3
Figure A4. High-angle annular dark-field (HAADF) scanning transmission electron micrograph (top left) of a region within the spent 20% Ni-0.5% Pt/Al2O3 catalyst and the corresponding elemental maps of both Ni and Pt (top right), Ni only (bottom left), and Pt only (bottom right).
Catalysts 09 00200 g0a4

References

  1. Fargione, J.; Hill, J.; Tilman, D.; Polasky, S.; Hawthorne, P. Land clearing and the biofuel carbon debt. Science 2008, 319, 1235–1238. [Google Scholar] [CrossRef] [PubMed]
  2. Tilman, D.; Hill, J.; Lehman, C. Carbon-negative biofuels from low-input high-diversity grassland biomass. Science 2006, 314, 1598–1600. [Google Scholar] [CrossRef] [PubMed]
  3. Berenblyum, A.S.; Podoplelova, T.A.; Shamsiev, R.S.; Katsman, E.A.; Danyushevsky, V.Y.; Flid, V.R. Catalytic chemistry of preparation of hydrocarbon fuels from vegetable oils and fats. Catal. Ind. 2012, 4, 209–214. [Google Scholar] [CrossRef]
  4. Benazzi, E.; Cameron, C. Boutique diesel in the on-road market. Hydrocarbon Process. 2006, 85, DD17–DD18. [Google Scholar]
  5. Kubičková, I.; Snåre, M.; Eränen, K.; Mäki-Arvela, P.; Murzin, D.Y. Hydrocarbons for diesel fuel via decarboxylation of vegetable oils. Catal. Today 2005, 106, 197–200. [Google Scholar] [CrossRef]
  6. Kordulis, C.; Bourikas, K.; Gousi, M.; Kordouli, E.; Lycourghiotis, A. Development of nickel based catalysts for the transformation of natural triglycerides and related compounds into green diesel: A critical review. Appl. Catal. B 2016, 181, 156–196. [Google Scholar] [CrossRef]
  7. Santillan-Jimenez, E.; Crocker, M. Catalytic deoxygenation of fatty acids and their derivatives to hydrocarbon fuels via decarboxylation/decarbonylation. J. Chem. Technol. Biotechnol. 2012, 87, 1041–1050. [Google Scholar] [CrossRef]
  8. Snåre, M.; Kubičková, I.; Mäki-Arvela, P.; Eränen, K.; Murzin, D.Y. Heterogeneous catalytic deoxygenation of stearic acid for production of biodiesel. Ind. Eng. Chem. Res. 2006, 45, 5708–5715. [Google Scholar] [CrossRef]
  9. Mäki-Arvela, P.; Kubickova, I.; Snåre, M.; Eränen, K.; Murzin, D.Y. Catalytic deoxygenation of fatty acids and their derivatives. Energy Fuels 2007, 21, 30–41. [Google Scholar] [CrossRef]
  10. Snåre, M.; Kubicková, I.; Mäki-Arvela, P.; Chichova, D.; Eränen, K.; Murzin, D.Y. Catalytic deoxygenation of unsaturated renewable feedstocks for production of diesel fuel hydrocarbons. Fuel 2008, 87, 933–945. [Google Scholar] [CrossRef]
  11. Simakova, I.; Simakova, O.; Mäki-Arvela, P.; Murzin, D.Y. Decarboxylation of fatty acids over Pd supported on mesoporous carbon. Catal. Today 2010, 150, 28–31. [Google Scholar] [CrossRef]
  12. Simakova, I.; Rozmysłowicz, B.; Simakova, O.; Mäki-Arvela, P.; Simakov, A.; Murzin, D.Y. Catalytic Deoxygenation of C18 Fatty Acids Over Mesoporous Pd/C Catalyst for Synthesis of Biofuels. Top. Catal. 2011, 54, 460–466. [Google Scholar] [CrossRef]
  13. Immer, J.G.; Lamb, H.H. Fed-batch catalytic deoxygenation of free fatty acids. Energy Fuels 2010, 24, 5291–5299. [Google Scholar] [CrossRef]
  14. Immer, J.G.; Kelly, M.J.; Lamb, H.H. Catalytic reaction pathways in liquid-phase deoxygenation of C18 free fatty acids. Appl. Catal. A 2010, 375, 134–139. [Google Scholar] [CrossRef]
  15. Hengst, K.; Arend, M.; Pfützenreuter, R.; Hoelderich, W.F. Deoxygenation and cracking of free fatty acids over acidic catalysts by single step conversion for the production of diesel fuel and fuel blends. Appl. Catal. B 2015, 174–175, 383–394. [Google Scholar] [CrossRef]
  16. Sari, E.; DiMaggio, C.; Kim, M.; Salley, S.O.; Ng, K.Y.S. Catalytic conversion of brown grease to green diesel via decarboxylation over activated carbon supported palladium catalyst. Ind. Eng. Chem. Res. 2013, 52, 11527–11536. [Google Scholar] [CrossRef]
  17. de Sousa, F.P.; Cardoso, C.C.; Pasa, V.M. Producing hydrocarbons for green diesel and jet fuel formulation from palm kernel fat over Pd/C. Fuel Process. Technol. 2016, 143, 35–42. [Google Scholar] [CrossRef]
  18. Shao, Y.; Xia, Q.; Liu, X.; Lu, G.; Wang, Y. Pd/Nb2O5/SiO2 Catalyst for the Direct Hydrodeoxygenation of Biomass-Related Compounds to Liquid Alkanes under Mild Conditions. ChemSusChem 2015, 8, 1761–1767. [Google Scholar] [CrossRef] [PubMed]
  19. Do, P.T.; Chiappero, M.; Lobban, L.L.; Resasco, D.E. Catalytic deoxygenation of methyl-octanoate and methyl-stearate on Pt/Al2O3. Catal. Lett. 2009, 130, 9–18. [Google Scholar] [CrossRef]
  20. Chiappero, M.; Do, P.T.M.; Crossley, S.; Lobban, L.L.; Resasco, D.E. Direct conversion of triglycerides to olefins and paraffins over noble metal supported catalysts. Fuel 2011, 90, 1155–1165. [Google Scholar] [CrossRef]
  21. Na, J.-G.; Yi, B.E.; Han, J.K.; Oh, Y.-K.; Park, J.-H.; Jung, T.S.; Han, S.S.; Yoon, H.C.; Kim, J.-N.; Lee, H.; et al. Deoxygenation of microalgal oil into hydrocarbon with precious metal catalysts: Optimization of reaction conditions and supports. Energy 2012, 47, 25–30. [Google Scholar] [CrossRef]
  22. Fu, J.; Lu, X.; Savage, P.E. Hydrothermal decarboxylation and hydrogenation of fatty acids over Pt/C. ChemSusChem 2011, 4, 481–486. [Google Scholar] [CrossRef] [PubMed]
  23. Yang, L.; Carreon, M.A. Deoxygenation of palmitic and lauric acids over Pt/ZIF-67 membrane/zeolite 5A bead catalysts. ACS Appl. Mater. Int. 2017, 9, 31993–32000. [Google Scholar] [CrossRef] [PubMed]
  24. Ahmadi, M.; Nambo, A.; Jasinski, J.B.; Ratnasamy, P.; Carreon, M.A. Decarboxylation of oleic acid over Pt catalysts supported on small-pore zeolites and hydrotalcite. Catal. Sci. Technol. 2015, 5, 380–388. [Google Scholar] [CrossRef]
  25. Ahmadi, M.; Macias, E.E.; Jasinski, J.B.; Ratnasamy, P.; Carreon, M.A. Decarboxylation and further transformation of oleic acid over bifunctional, Pt/SAPO-11 catalyst and Pt/chloride Al2O3 catalysts. J. Mol. Catal. A Chem. 2014, 386, 14–19. [Google Scholar] [CrossRef]
  26. Tian, Q.; Qiao, K.; Zhou, F.; Chen, K.; Wang, T.; Fu, J.; Lu, X.; Ouyang, P. Direct production of aviation fuel range hydrocarbons and aromatics from oleic acid without an added hydrogen donor. Energy Fuels 2016, 30, 7291–7297. [Google Scholar] [CrossRef]
  27. Kon, K.; Onodera, W.; Takakusagi, S.; Shimizu, K.-i. Hydrodeoxygenation of fatty acids and triglycerides by Pt-loaded Nb2O5 catalysts. Catal. Sci. Technol. 2014, 4, 3705–3712. [Google Scholar] [CrossRef]
  28. Kon, K.; Toyao, T.; Onodera, W.; Siddiki, S.M.A.H.; Shimizu, K.-i. Hydrodeoxygenation of Fatty Acids, Triglycerides, and Ketones to Liquid Alkanes by a Pt–MoOx/TiO2 Catalyst. ChemCatChem 2017, 9, 2822–2827. [Google Scholar] [CrossRef]
  29. Janampelli, S.; Darbha, S. Metal Oxide-Promoted Hydrodeoxygenation Activity of Platinum in Pt-MOx/Al2O3 Catalysts for Green Diesel Production. Energy Fuels 2018, 32, 12630–12643. [Google Scholar] [CrossRef]
  30. Morgan, T.; Grubb, D.; Santillan-Jimenez, E.; Crocker, M. Conversion of triglycerides to hydrocarbons over supported metal catalysts. Top. Catal. 2010, 53, 820–829. [Google Scholar] [CrossRef]
  31. Santillan-Jimenez, E.; Morgan, T.; Lacny, J.; Mohapatra, S.; Crocker, M. Catalytic deoxygenation of triglycerides and fatty acids to hydrocarbons over carbon-supported nickel. Fuel 2013, 103, 1010–1017. [Google Scholar] [CrossRef]
  32. Loe, R.; Santillan-Jimenez, E.; Morgan, T.; Sewell, L.; Ji, Y.; Jones, S.; Isaacs, M.A.; Lee, A.F.; Crocker, M. Effect of Cu and Sn promotion on the catalytic deoxygenation of model and algal lipids to fuel-like hydrocarbons over supported Ni catalysts. Appl. Catal. B 2016, 191, 147–156. [Google Scholar] [CrossRef] [Green Version]
  33. Santillan-Jimenez, E.; Morgan, T.; Shoup, J.; Harman-Ware, A.E.; Crocker, M. Catalytic deoxygenation of triglycerides and fatty acids to hydrocarbons over Ni–Al layered double hydroxide. Catal. Today 2014, 237, 136–144. [Google Scholar] [CrossRef]
  34. Santillan-Jimenez, E.; Morgan, T.; Loe, R.; Crocker, M. Continuous catalytic deoxygenation of model and algal lipids to fuel-like hydrocarbons over Ni–Al layered double hydroxide. Catal. Today 2015, 258, 284–293. [Google Scholar] [CrossRef]
  35. Morgan, T.; Santillan-Jimenez, E.; Harman-Ware, A.E.; Ji, Y.; Grubb, D.; Crocker, M. Catalytic deoxygenation of triglycerides to hydrocarbons over supported nickel catalysts. Chem. Eng. J. 2012, 189–190, 346–355. [Google Scholar] [CrossRef]
  36. Peng, B.; Zhao, C.; Kasakov, S.; Foraita, S.; Lercher, J.A. Manipulating catalytic pathways: Deoxygenation of palmitic acid on multifunctional catalysts. Chem. Eur. J. 2013, 19, 4732–4741. [Google Scholar] [CrossRef] [PubMed]
  37. Peng, B.; Yuan, X.; Zhao, C.; Lercher, J.A. Stabilizing catalytic pathways via redundancy: Selective reduction of microalgae oil to alkanes. J. Am. Chem. Soc. 2012, 134, 9400–9405. [Google Scholar] [CrossRef]
  38. Peng, B.; Yao, Y.; Zhao, C.; Lercher, J.A. Towards quantitative conversion of microalgae oil to diesel-range alkanes with bifunctional catalysts. Angew. Chem. 2012, 124, 2114–2117. [Google Scholar] [CrossRef]
  39. Ford, J.P.; Immer, J.G.; Lamb, H.H. Palladium catalysts for fatty acid deoxygenation: Influence of the support and fatty acid chain length on decarboxylation kinetics. Top. Catal. 2012, 55, 175–184. [Google Scholar] [CrossRef]
  40. Hollak, S.A.W.; de Jong, K.P.; van Es, D.S. Catalytic deoxygenation of fatty acids: Elucidation of the inhibition process. ChemCatChem 2014, 6, 2648–2655. [Google Scholar] [CrossRef]
  41. Song, W.; Zhao, C.; Lercher, J.A. Importance of size and distribution of Ni nanoparticles for the hydrodeoxygenation of microalgae oil. Chem. Eur. J. 2013, 19, 9833–9842. [Google Scholar] [CrossRef] [PubMed]
  42. Santillan-Jimenez, E.; Loe, R.; Garrett, M.; Morgan, T.; Crocker, M. Effect of Cu promotion on cracking and methanation during the Ni-catalyzed deoxygenation of waste lipids and hemp seed oil to fuel-like hydrocarbons. Catal. Today 2018, 302, 261–271. [Google Scholar] [CrossRef]
  43. Guo, Q.; Wu, M.; Wang, K.; Zhang, L.; Xu, X. Catalytic Hydrodeoxygenation of Algae Bio-oil over Bimetallic Ni–Cu/ZrO2 Catalysts. Ind. Eng. Chem. Res. 2015, 54, 890–899. [Google Scholar] [CrossRef]
  44. Pan, Z.; Wang, R.; Nie, Z.; Chen, J. Effect of a second metal (Co, Fe, Mo and W) on performance of Ni2P/SiO2 for hydrodeoxygenation of methyl laurate. J. Energy Chem. 2016, 25, 418–426. [Google Scholar] [CrossRef]
  45. Shi, Y.; Xing, E.; Cao, Y.; Liu, M.; Wu, K.; Yang, M.; Wu, Y. Tailoring product distribution during upgrading of palmitic acid over bi-functional metal/zeolite catalysts. Chem. Eng. Sci. 2017, 166, 262–273. [Google Scholar] [CrossRef]
  46. Chen, H.; Zhang, X.; Zhang, J.; Wang, Q. Tuning Decarboxylation Selectivity for Deoxygenation of Vegetable Oil over Pt-Ni Bimetal Catalysts via Surface Engineering. Catal. Sci. Technol. 2018. [Google Scholar] [CrossRef]
  47. Li, X.-F.; Luo, X.-G. Preparation of mesoporous activated carbon supported Ni catalyst for deoxygenation of stearic acid into hydrocarbons. Environ. Prog. Sustain. Energy 2015, 34, 607–612. [Google Scholar] [CrossRef]
  48. Lu, S.; Lonergan, W.W.; Bosco, J.P.; Wang, S.; Zhu, Y.; Xie, Y.; Chen, J.G. Low temperature hydrogenation of benzene and cyclohexene: A comparative study between γ-Al2O3 supported PtCo and PtNi bimetallic catalysts. J. Catal. 2008, 259, 260–268. [Google Scholar] [CrossRef]
  49. Tanksale, A.; Beltramini, J.; Dumesic, J.; Lu, G. Effect of Pt and Pd promoter on Ni supported catalysts—A TPR/TPO/TPD and microcalorimetry study. J. Catal. 2008, 258, 366–377. [Google Scholar] [CrossRef]
  50. Vizcaíno, A.; Carrero, A.; Calles, J. Hydrogen production by ethanol steam reforming over Cu–Ni supported catalysts. Int. J. Hydrogen Energy 2007, 32, 1450–1461. [Google Scholar] [CrossRef]
  51. Rynkowski, J.M.; Paryjczak, T.; Lenik, M. On the nature of oxidic nickel phases in NiO/γ-Al2O3 catalysts. Appl. Catal. A 1993, 106, 73–82. [Google Scholar] [CrossRef]
  52. Ko, E.-Y.; Park, E.D.; Seo, K.W.; Lee, H.C.; Lee, D.; Kim, S. Pt–Ni/γ-Al2O3 catalyst for the preferential CO oxidation in the hydrogen stream. Catal. Lett. 2006, 110, 275–279. [Google Scholar] [CrossRef]
  53. Jackson, S.; Glanville, B.; Willis, J.; McLellan, G.; Webb, G.; Moyes, R.; Simpson, S.; Wells, P.; Whyman, R. Supported metal catalysts: Preparation, characterization, and function: II. Carbon monoxide and dioxygen adsorption on platinum catalysts. J. Catal. 1993, 139, 207–220. [Google Scholar] [CrossRef]
  54. Dias, J.A.; Assaf, J.M. Autothermal reforming of methane over Ni/γ-Al2O3 catalysts: The enhancement effect of small quantities of noble metals. J. Power Sources 2004, 130, 106–110. [Google Scholar] [CrossRef]
  55. Parizotto, N.; Zanchet, D.; Rocha, K.; Marques, C.; Bueno, J. The effects of Pt promotion on the oxi-reduction properties of alumina supported nickel catalysts for oxidative steam-reforming of methane: Temperature-resolved XAFS analysis. Appl. Catal. A 2009, 366, 122–129. [Google Scholar] [CrossRef]
  56. Riguetto, B.A.; Damyanova, S.; Gouliev, G.; Marques, C.M.; Petrov, L.; Bueno, J.M.C. Surface behavior of alumina-supported Pt catalysts modified with cerium as revealed by X-ray diffraction, X-ray photoelectron spectroscopy, and Fourier transform infrared spectroscopy of CO adsorption. J. Phys. Chem. B 2004, 108, 5349–5358. [Google Scholar] [CrossRef]
  57. Xu, J.; White, T.; Li, P.; He, C.; Yu, J.; Yuan, W.; Han, Y.-F. Biphasic Pd−Au alloy catalyst for low-temperature CO oxidation. J. Am. Chem. Soc. 2010, 132, 10398–10406. [Google Scholar] [CrossRef]
  58. Fisk, C.A.; Morgan, T.; Ji, Y.; Crocker, M.; Crofcheck, C.; Lewis, S.A. Bio-oil upgrading over platinum catalysts using in situ generated hydrogen. Appl. Catal. A 2009, 358, 150–156. [Google Scholar] [CrossRef]
  59. Sugami, Y.; Minami, E.; Saka, S. Renewable diesel production from rapeseed oil with hydrothermal hydrogenation and subsequent decarboxylation. Fuel 2016, 166, 376–381. [Google Scholar] [CrossRef]
  60. Huber, G.W.; O’Connor, P.; Corma, A. Processing biomass in conventional oil refineries: Production of high quality diesel by hydrotreating vegetable oils in heavy vacuum oil mixtures. Appl. Catal. A 2007, 329, 120–129. [Google Scholar] [CrossRef]
  61. Berenblyum, A.S.; Danyushevsky, V.Y.; Katsman, E.A.; Podoplelova, T.A.; Flid, V.R. Production of engine fuels from inedible vegetable oils and fats. Pet. Chem. 2010, 50, 305–311. [Google Scholar] [CrossRef]
  62. Kikhtyanin, O.V.; Rubanov, A.E.; Ayupov, A.B.; Echevsky, G.V. Hydroconversion of sunflower oil on Pd/SAPO-31 catalyst. Fuel 2010, 89, 3085–3092. [Google Scholar] [CrossRef]
  63. Zhang, H.; Shao, S.; Xiao, R.; Shen, D.; Zeng, J. Characterization of coke deposition in the catalytic fast pyrolysis of biomass derivates. Energy Fuels 2013, 28, 52–57. [Google Scholar] [CrossRef]
  64. Chen, L.; Li, H.; Fu, J.; Miao, C.; Lv, P.; Yuan, Z. Catalytic hydroprocessing of fatty acid methyl esters to renewable alkane fuels over Ni/HZSM-5 catalyst. Catal. Today 2016, 259, 266–276. [Google Scholar] [CrossRef]
  65. Loe, R.; Lavoignat, Y.; Maier, M.; Abdallah, M.; Morgan, T.; Qian, D.; Pace, R.; Santillan-Jimenez, E.; Crocker, M. Continuous Catalytic Deoxygenation of Waste Free Fatty Acid-Based Feeds to Fuel-Like Hydrocarbons Over a Supported Ni-Cu Catalyst. Catalysts 2019, 9, 123. [Google Scholar] [CrossRef]
  66. Grosvenor, A.P.; Biesinger, M.C.; Smart, R.S.C.; McIntyre, N.S. New interpretations of XPS spectra of nickel metal and oxides. Surf. Sci. 2006, 600, 1771–1779. [Google Scholar] [CrossRef]
  67. Morgan, T.; Santillan-Jimenez, E.; Huff, K.; Javed, K.R.; Crocker, M. Use of dual detection in the gas chromatographic analysis of oleaginous biomass feeds and biofuel products to enable accurate simulated distillation and lipid profiling. Energy Fuels 2017, 31, 9498–9506. [Google Scholar] [CrossRef]
Figure 1. X-ray diffraction patterns for 20% Ni/Al2O3 (a), 20% Ni-0.1% Pt/Al2O3 (b), 20% Ni-0.25% Pt/Al2O3 (c), and 20% Ni-0.5% Pt/Al2O3 (d).
Catalysts 09 00200 g001
Figure 2. Particle size histograms for the 20% Ni-/Al2O3 and 20% Ni-0.5% Pt/Al2O3 catalysts (a) and metallic composition histograms for the 20% Ni-0.5% Pt/Al2O3 formulation (b).
Catalysts 09 00200 g002
Figure 3. Temperature programmed reduction profiles of the catalysts studied.
Catalysts 09 00200 g003
Figure 4. CO temperature programmed desorption profile of the catalysts studied. Catalysts were pre-reduced in situ at 350 °C for 3 h.
Catalysts 09 00200 g004
Figure 5. In situ DRIFTS spectra of 20% Ni/Al2O3 (a) and 20% Ni-0.5% Pt/Al2O3 (b) after CO adsorption.
Catalysts 09 00200 g005
Figure 6. Gas chromatograms and BPDPs of the liquid products collected from the deoxygenation of tristearin with 20% Ni/Al2O3 (a,b) and 20% Ni-0.5% Pt/Al2O3 (c,d).
Catalysts 09 00200 g006
Figure 7. Thermogravimetric analysis of the spent catalysts recovered from deoxygenation experiments.
Catalysts 09 00200 g007
Figure 8. Particle size histograms for the spent 20% Ni-/Al2O3 and 20% Ni-0.5% Pt/Al2O3 catalysts (a) and metallic composition histograms for the spent 20% Ni-0.5% Pt/Al2O3 formulation (b).
Catalysts 09 00200 g008
Table 1. Textural properties and metal dispersion of the catalysts studied.
CatalystN2 PhysisorptionAvg. NiO Particle Size (nm)
BET Surface Area (m2/g)Pore Vol. (cm3/g)Avg. Pore Diameter (nm)
20% Ni/Al2O31350.297.06.8
20% Ni-0.1% Pt/Al2O31290.277.07.4
20% Ni-0.25% Pt/Al2O31380.297.06.1
20% Ni-0.5% Pt/Al2O31340.296.98.7
0.5% Pt/Al2O31960.134.6-
Table 2. Pulsed H2 chemisorption results of the catalysts studied.
CatalystH2 Ads. (mL/g)H2 Ads. on Pt for 50% Pt Dispersion (mL/g) 1H2 Ads. on Pt for 100% Pt Dispersion (mL/g) 1H2 Ads. on Ni-Pt for 100% Pt Dispersion (mL/g) 2
20% Ni/Al2O30.095---
20% Ni-0.1% Pt/Al2O30.4610.0280.0570.152
20% Ni-0.25% Pt/Al2O30.5600.0710.1440.239
20% Ni-0.5% Pt/Al2O30.6390.1440.2870.382
0.5% Pt/Al2O30.3710.1440.2870.287
1 Values shown are calculated solely from the theoretical Pt metal dispersion. 2 Values shown are theoretical H2 adsorptions if Ni metal sites were unaffected by the addition of Pt.
Table 3. Semi-batch deoxygenation of tristearin (580 psi of H2, 260 °C, 3 h reaction time) 1.
CatalystConversion (%) 2Selectively to (Yield of) C10-C17 (%) 3,6Selectively to (Yield of) C17 (%) 4,6Selectively to (Yield of) C18 (%) 5,6
20% Ni/Al2O3283 (2)83 (2)3 (<1)
20% Ni-0.1% Pt/Al2O33296 (23)72 (15)0 (0)
20% Ni-0.25% Pt/Al2O36699 (65)72 (48)0 (0)
20% Ni-0.5% Pt/Al2O310096 (96)65 (65)2 (2)
0.5% Pt/Al2O3570 (4)65 (3)3 (<1)
1 All experiments for which results are shown were performed a minimum of two times and the values presented are the average of multiple experiments, with the average of the standard deviations obtained for all catalysts being 4.6, 1.8, and 2.8% for conversion, selectivity to C10-C17, and selectivity to C17, respectively. 2 Conversion = wt.% of product with bp < 375 °C. 3 Selectivity to C10-C17 = 100 × [(wt.% of product with bp < 314 °C – wt.% of product with bp < 177 °C)/(wt.% of product with bp < 375 °C)]. 4 Selectivity to C17 = 100 × [(wt.% of product with bp < 314 °C – wt.% of product with bp < 295 °C)/(wt.% of product with bp < 375 °C)]. 5 Selectivity to C18 = 100 × [(wt.% of product with bp < 325 °C – wt.% of product with bp < 314 °C)/(wt.% of product with bp < 375 °C)]. 6 The corresponding yield (conversion × selectivity) values are shown between parentheses.

