Article

Preparation of Visible Light Photocatalytic Graphene Embedded Rutile Titanium(IV) Oxide Composite Nanowires and Enhanced NOx Removal

by
Jun-Cheol Lee
1,†,
Anantha-Iyengar Gopalan
1,†,
Gopalan Sai-Anand
2,
Kwang-Pill Lee
1 and
Wha-Jung Kim
1,*
1
Daegyeong Regional Infrastructure Technology Development Center, Kyungpook National University, Daegu 41566, South Korea
2
Global Innovative Center for Advanced Nanomaterials, Faculty of Engineering and Built Environment, The University of Newcastle, Callaghan, NSW 2308, Australia
*
Author to whom correspondence should be addressed.
These authors contributed equally to this work.
Catalysts 2019, 9(2), 170; https://doi.org/10.3390/catal9020170
Submission received: 31 January 2019 / Accepted: 9 February 2019 / Published: 11 February 2019

Abstract

:
The quest for developing highly efficient TiO2-based photocatalysts is continuing and, in particular, evolving a new strategy is an important aspect in this regard. In general, much effort has been devoted to the anatase TiO2 modifications, despite there being only a few recent studies on rutile TiO2 (rTiO2). To the best of our knowledge, studies on the preparation and characterization of the photocatalysts based on the intentional inclusion of graphene (G) into rTiO2 nanostructures have not been reported yet. Herein, we develop a new type of TiO2-based photocatalyst comprising of G included pure rTiO2 nanowire (abbreviated as rTiO2(G) NW) with enhanced visible light absorption capability. To prepare rTiO2(G) NW, the G incorporated titanate electrospun fibers were obtained by electrospinning and subsequently heat treated at various temperatures (500 to 800 °C). Electrospinning conditions were optimized for producing good quality rTiO2(G) NW. The rTiO2(G) NW and their corresponding samples were characterized by appropriate techniques such as X-ray diffraction (XRD), scanning electron microscopy, high-resolution transmission electron microscopy and UV-vis diffuse reflectance spectroscopy to ascertain their material characteristics. XRD results show that the lattice strain occurs upon inclusion of G. We present here the first observation of an apparent bandgap lowering because of the G inclusion into TiO2 NW. While anatase TiO2 NW exhibited poor visible light photocatalysis towards NOx removal, the rTiO2(G) NW photocatalyst witnessed a significantly enhanced (~67%) photocatalytic performance as compared to anatase TiO2(G) NW. We concluded that the inclusion of G into rTiO2 nanostructures enhances the visible light photoactivity. A plausible mechanism for photocatalysis is suggested.

1. Introduction

Ever since Fujishima and Honda demonstrated the successful photoelectrochemical splitting of water, titanium dioxide (TiO2) has become one of the most widely studied semiconductor photocatalysts [1,2]. TiO2 has been fervently utilized as the photocatalyst and in other prime applications (such as photovoltaic devices, sensors, environmental remediation, etc.) due to its unique combination of low cost, chemical stability, non-toxicity, high reactivity, excellent stability against photocorrosion, and ease for further functionalization [3,4]. Generally, TiO2 exhibits varying photocatalytic activities which depend on its phase structure, crystallite size, specific surface areas, and pore structures. TiO2 exists in nature in any of the four polymorphs, anatase (tetragonal), rutile (tetragonal), brookite (orthorhombic), and TiO2 (monoclinic). Among the polymorphs, rutile is the most stable phase in a wide temperature and pressure ranges [5], while the other polymorphs are metastable phases. The polymorphs of TiO2 differ in the photocatalytic properties and mechanism of action, due to the differences in the energetic position of the conduction band, the distribution and density of trap states, electron mobility, and the rate constant for electron transfer rate [6].
It has been well demonstrated that the photocatalytic activity of anatase is superior than that of other polymorphs [7,8,9,10]. The main reasons for the superior photocatalytic activity of anatase are ascribed to the higher electron mobility, low dielectric constant, higher Fermi level, lower ability to adsorb oxygen, and higher degree of hydroxylation of the anatase [8]. In recent years, it has been identified that the other polymorphs of TiO2 (rutile, brookite) can also exhibit enhanced photocatalytic performances [11,12]. TiO2 photocatalyst can absorb more ultraviolet (UV) light near the visible region as compared to anatase due to its relative smaller band gap (3.0 eV for rutile and 3.2 eV for anatase). The general argument for the relatively higher photocatalytic activity of rutile over anatase, especially for water reduction is that the conduction band potential of rutile is more positive than that of anatase [13]. However, there is still disagreement on the lower photocatalytic property for rutile based on the band-edge potentials of anatase and rutile TiO2 [14]. The lower photocatalytic activity of rutile has also been correlated to the its larger grain size [15], lower specific surface areas and poor surface adsorption capacity [16]. In addition, it has also been suggested that the lifetime of photogenerated electrons and holes in anatase is about an order of magnitude larger than that of photogenerated electrons and holes in rutile [17]. The morphology and electronic structures of the respective polymorphs (anatase or rutile) can influence the charge transfer, separation of charges and mobility of photogenerated electron and hole pairs.
Very recently, a few studies on the utilization of rutile TiO2 (rTiO2) for the photocatalytic applications have been reported [18,19,20,21,22,23]. The rutile nanoparticles were embedded into the biopolymer (inulin) in order to minimize the agglomeration of rutile nanoparticles, and to improve the photoactivity [18]. For instance, the photocatalysts based on three-dimensional rutile micro-flowers have exhibited enhanced performances due to large surface area contributed by the highly dense spiky nanostructures [19]. In an another interesting study, rutile rods with exposed facets were reported to possess large specific surface area and exposed high active facets, which resulted in enhanced photocatalytic activities [20,21]. TiO2 powder modified with Pt nanoparticles was used as a stable photocatalyst to split water into H2 and O2 [22,23]. Similar studies have been reported to demonstrate the enhancement in the photocatalytic activities of rTiO2 due to the faceted lattices [24,25]. The effects of crystal lattice defects on the photocatalytic properties of rTiO2 have also been reported [26].
Surface sensitization can be effectively utilized for the modification of TiO2 without compromising the inherent material properties [27,28]. However, the judicious selection of a proper sensitizer is the key to fine tune the properties of TiO2. The special features that can be considered in the selection of the sensitizer include electronic structure, band-gap and the conduction band of the sensitizer. Also, the combination of the type of TiO2 phase (anatase or rutile) and the proportion or the loading amount and morphology of a sensitizer need to be optimized for achieving enhanced photocatalytic performances. However, to the best of our knowledge, this is the first report on the preparation of graphene (G) (sensitizer and electron sink) embedded rTiO2 nanowires, as the photocatalyst and demonstration of the enhanced photocatalytic activity we exemplify the utility of newly developed rTiO2(G) composite nanowire (CNW) towards the photocatalytic abatement of NOx.
G has been reported to exhibit a significant promotional effect on the photocatalytic activity of TiO2 [29]. Anatase TiO2 nanocrystals with exposed facets on G sheets, prepared via molecular grafting, exhibited enhanced photocatalytic activity [30]. When G is combined with TiO2, G serves as an effective electron sink and increases the rate of photogenerated charge carrier separation across the interface and enhances the redox reactions of the chemisorbed molecules [31]. Generally, the photocatalytic performance enhancement of G was examined on the anatase TiO2-G composites prepared via either physical mixing or one-pot hydrothermal synthesis [32]. In such cases, G encapsulates partially on the TiO2 surface. However, it becomes important to establish an intimate contact between G and TiO2 without blocking the active sites of TiO2. The TiO2-G composites prepared by mechanical mixing can hardly result in a uniform distribution of G onto the surface of TiO2 nanostructures and can have limited surface area for the photocatalytic activity. These factors can definitely weaken the effect of G for the improved photocatalytic activity of TiO2.
Motivated by the significant results obtained from our previous reports on the TiO2 based hybrid nanocomposites towards multitude of applications [33,34,35,36,37,38,39,40,41,42,43,44,45,46,47], we developed the electrospinning-thermal annealing (800 °C) based design strategy for the successful synthesis of rTiO2(G)-CNW (Scheme 1). A well-defined NW formation was achieved by employing the mixture of poly(vinyl pyrrolidone) (PVP) having different molecular weights (40,000 and 1.30 × 10⁶). For fair comparison, G embedded anatase TiO2 NW (simply aTiO2(G)-CNW) were also prepared by post annealing at 550 °C. The G proportions in rTiO2(G)-CNW were manipulated by incorporating different amounts of G in the electrospinning dope. Studies were performed to demonstrate the photocatalytic properties of rTiO2(G)-CNW by selecting photocatalytic removal of NOx under visible and UV-light irradiations. The results demonstrate that the fabricated rTiO2-CNW has markedly enhanced visible light photoactivity than the other studied photocatalysts in this work.

2. Results and Discussion

2.1. Synthetic Optimizations

The procedure for the fabrication of rTiO2(G)-CNW and the other studied photocatalysts are presented in Scheme 1. The typical procedure involves two steps; (i) preparation of G embedded titanate composite nanofibers (Titanate (G)-CNFs) and (ii) calcination of the Titanate (G)-CNFs. Our focus was to prepare high quality rTiO2 (G)-CNW having uniform diameters. Taking into account the morphology and diameter of the resultant electrospun Titanate (G)-CNFs (step i) and the temperature for hydrothermal treatment (step ii), we manipulated the various parameters involved in these two steps, namely, the recipe for the electrospinning dope and temperature for the calcination process. Typical experimental parameters that were selected for the electrospinning process towards the preparation of Titanate(G)-CNFs are listed in Table 1. For pure rTiO2(G)-CNW formation, the calcination temperature was chosen as 800 °C based on our knowledge obtained from the relevant literature [48]. The as-synthesized materials are designated based on these two steps and presented in Table 1.
In this study, our focus is to prepare G embedded TiO2 NWs rather the physical mixture between TiO2 NW and G. Hence, we designed the conditions at the electrospinning dope stage so as to chemically link the G moieties within the titanate framework. During the formation of titanate gel, carboxylated G was introduced. As a result, the condensation processes resulted in the formation of Ti-O-C-Ti- three dimensional networks. During the hydrolysis of titanium isopropoxide (TIIP), titanium hydroxides were formed by the nucleophilic substitution of the terminal isopropoxide groups. In addition, condensation between two hydroxyl groups in titanium hydroxides and the occurrence of cross reactions between titanium hydroxides and carboxylated G leads to Ti-O-C-Ti- three dimensional networks. Of course, the rate of condensation between two hydroxyl groups in titanium hydroxides is expected to be much higher than the condensation reaction between carboxyl or hydroxyl groups in G and hydroxyl groups in titanium hydroxide. By varying the G precursor in the electrospinning dope (Table 1), the titanate gel with different extents of G inclusion was successfully achieved.
Furthermore, it should be noted that molecular weight of the polymer (PVP in this case) can also influence the electrospun fiber morphologies. Generally, molecular weight of the polymer decides the entanglement of polymer chains in solutions and hence the solution viscosity. In the electrospinning process, electrospinning dope prepared with the low molecular weight polymers can result in beads as compared to the high molecular weight polymers. Relatively high molecular weight polymers can lead to smooth electrospun fibers. However, too high concentrations of the high molecular weight polymers would lead to micro-ribbon or belt or flattened fiber-like morphologies. In this work, we aim to obtain cylindrical Titanate(G)-CNFs with uniform diameters, which in turn can lead to the formation of uniform TiO2 NWs at the calcination stage. We employed a judicious selection of mixture of PVP with low (40,000) and high (1.30 × 10⁶) molecular weight towards achieving our goal. Table 1 details the electrospinning conditions (Table 1).
It must be noted that the calcination temperature influences the phase transformation among the main polymorphs of TiO2 (anatase, rutile and brookite) [49]. The main active crystallite phases of TiO2 are rutile and anatase. When the calcination temperature is set above 600 °C, the rutile phase predominantly results [50]. Keeping this in view, we kept the calcination temperature far above 600 °C to specifically induce rutile phases. (Table 1)

2.2. Characterizations
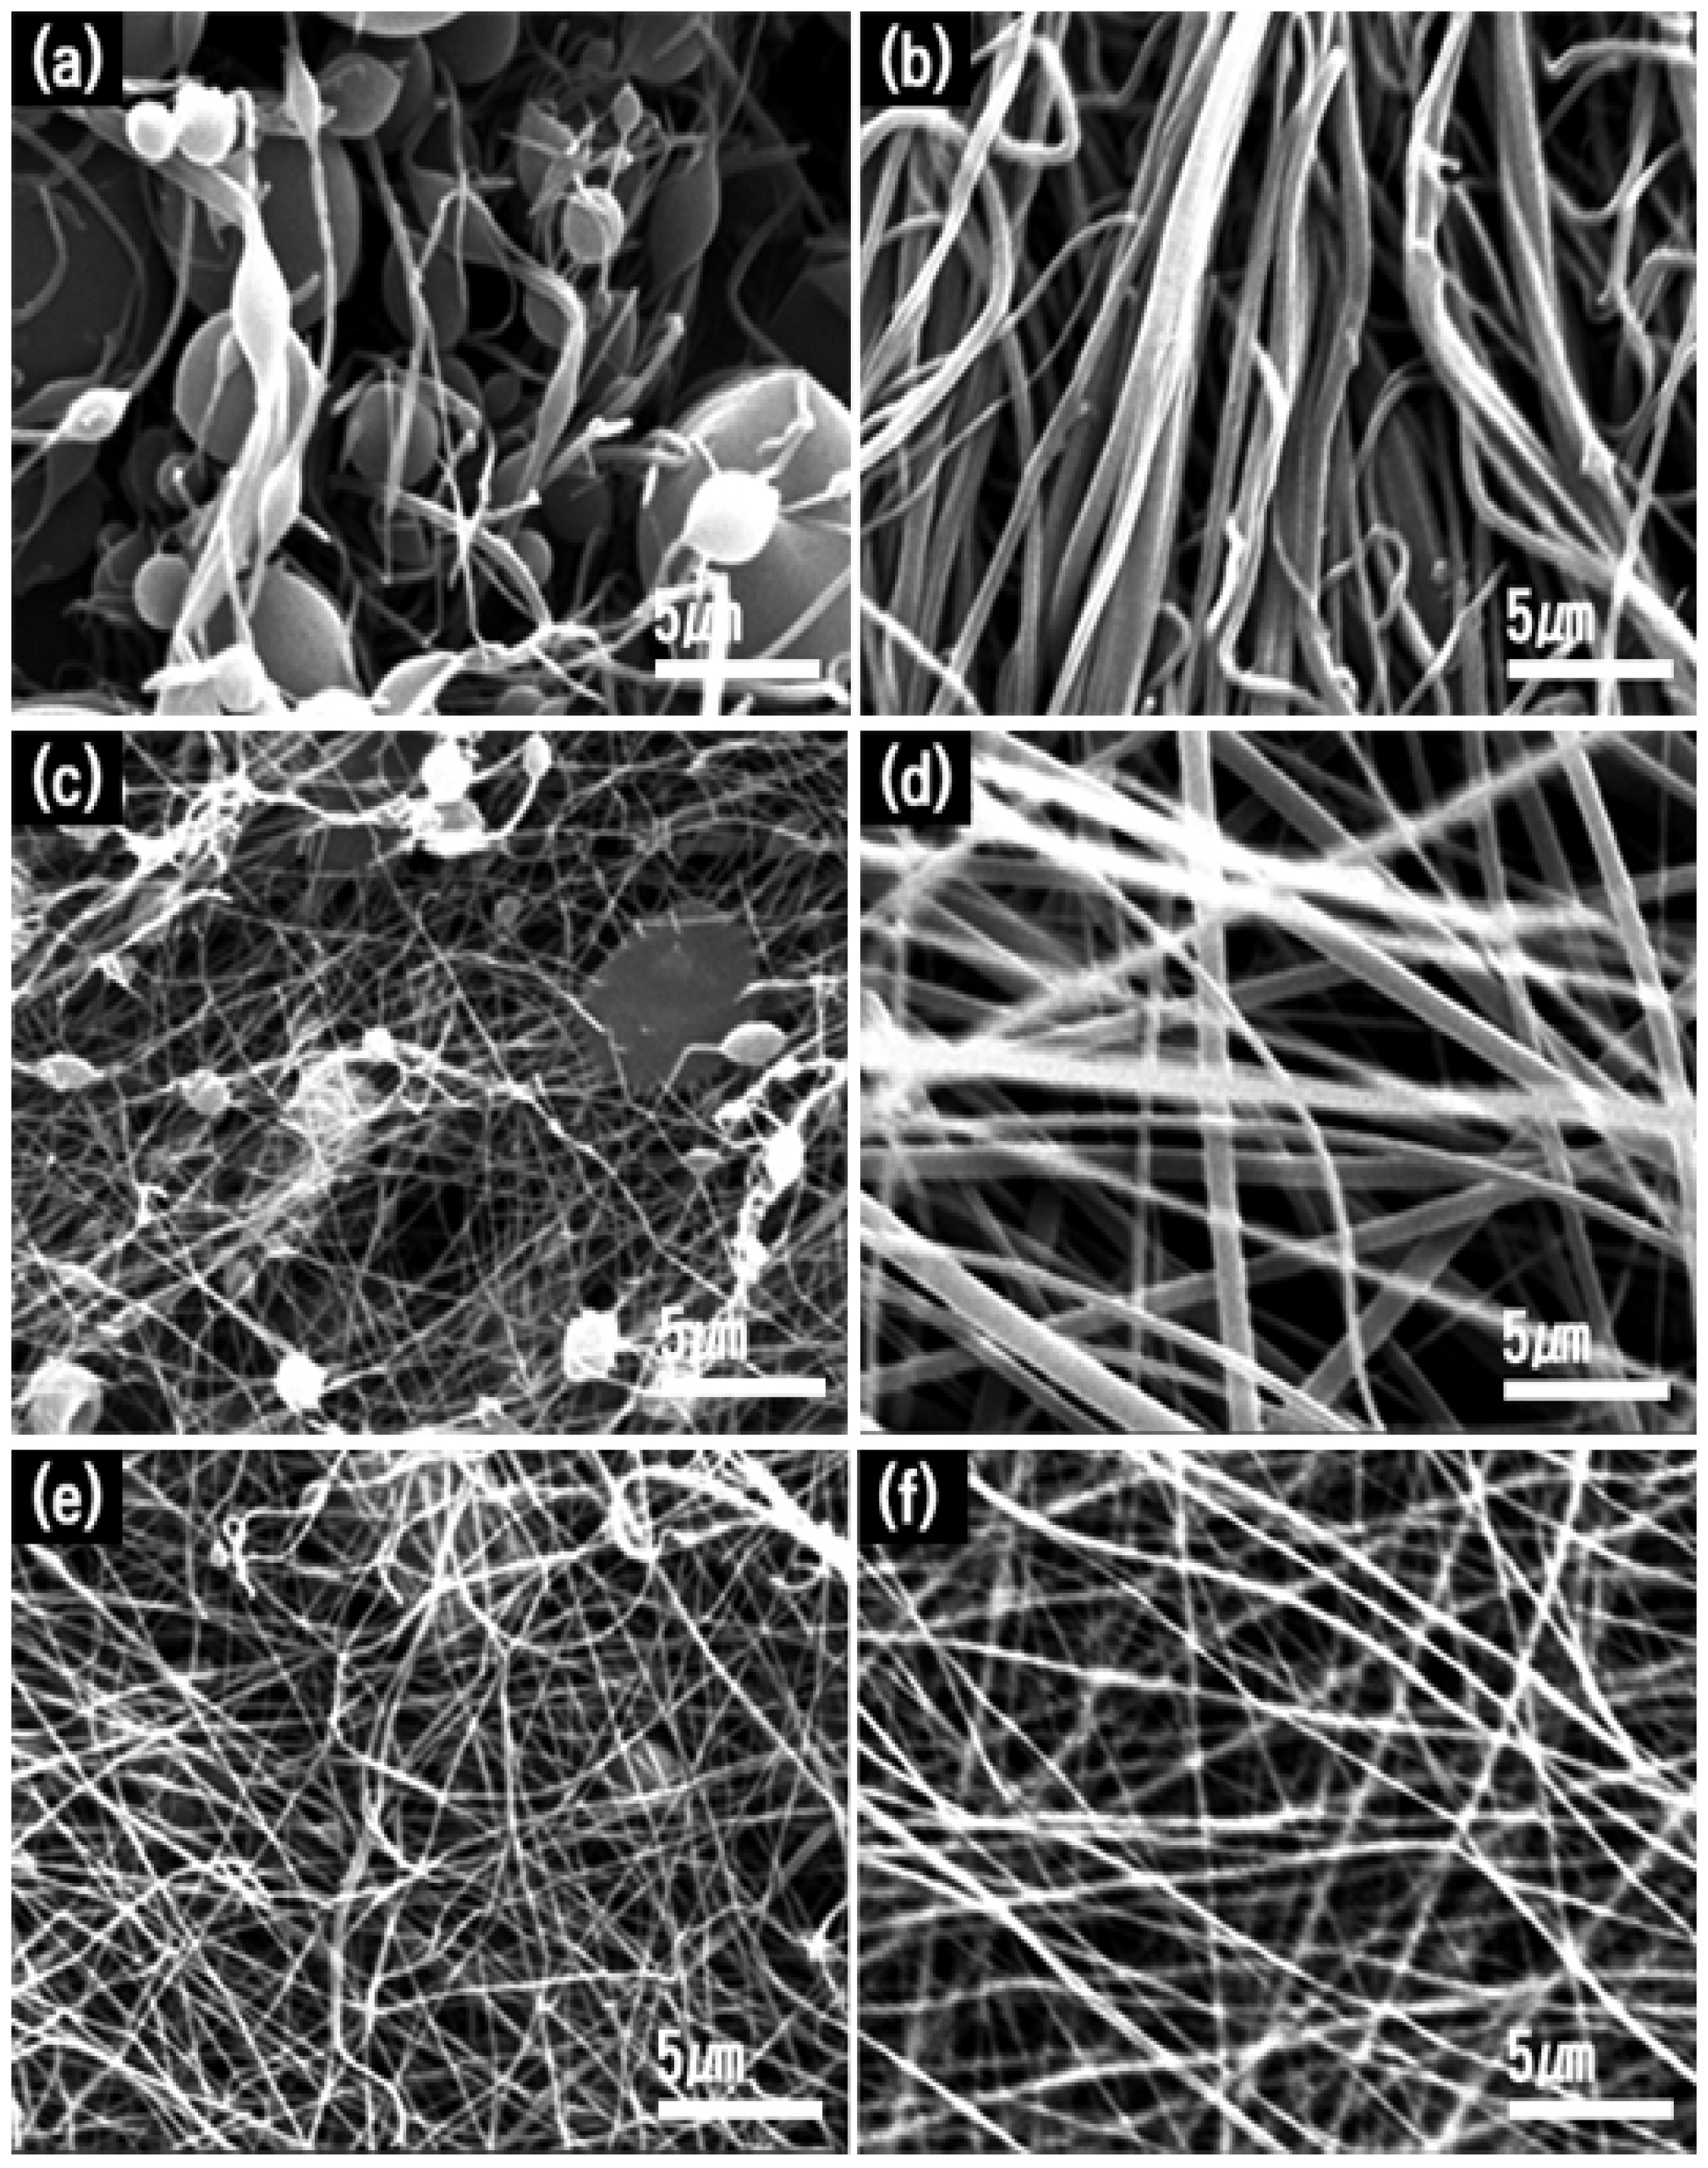
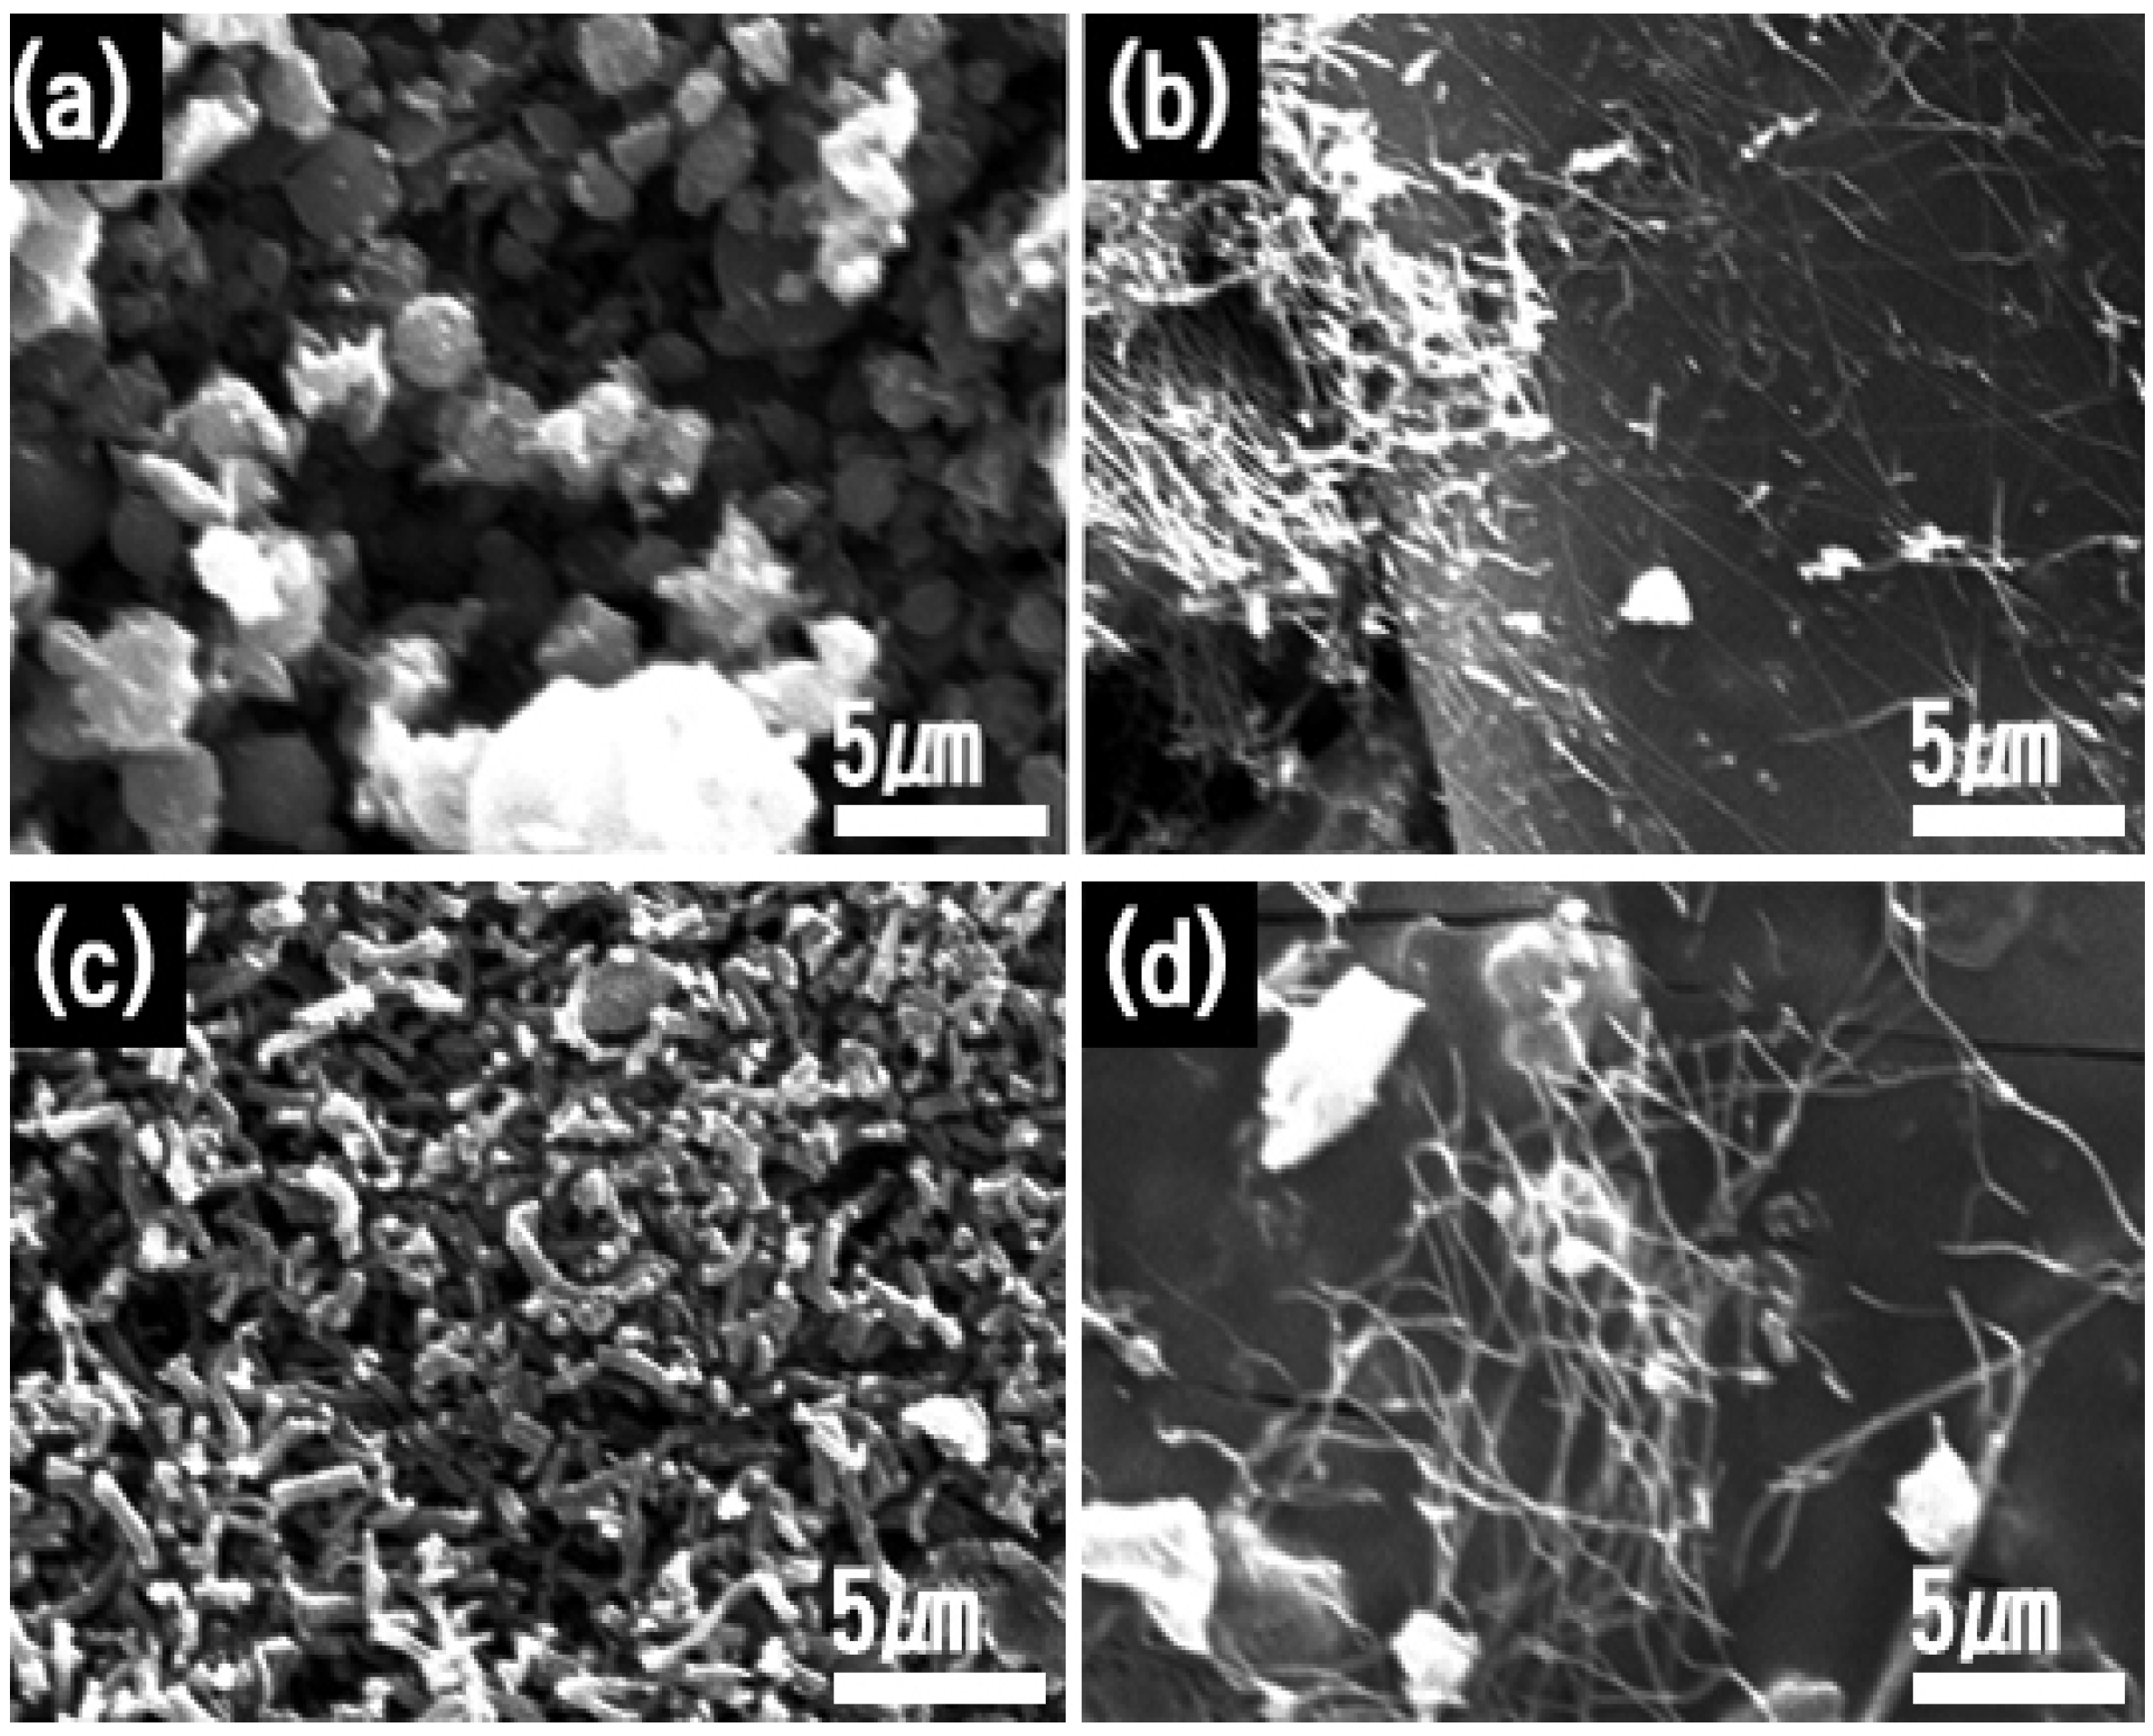
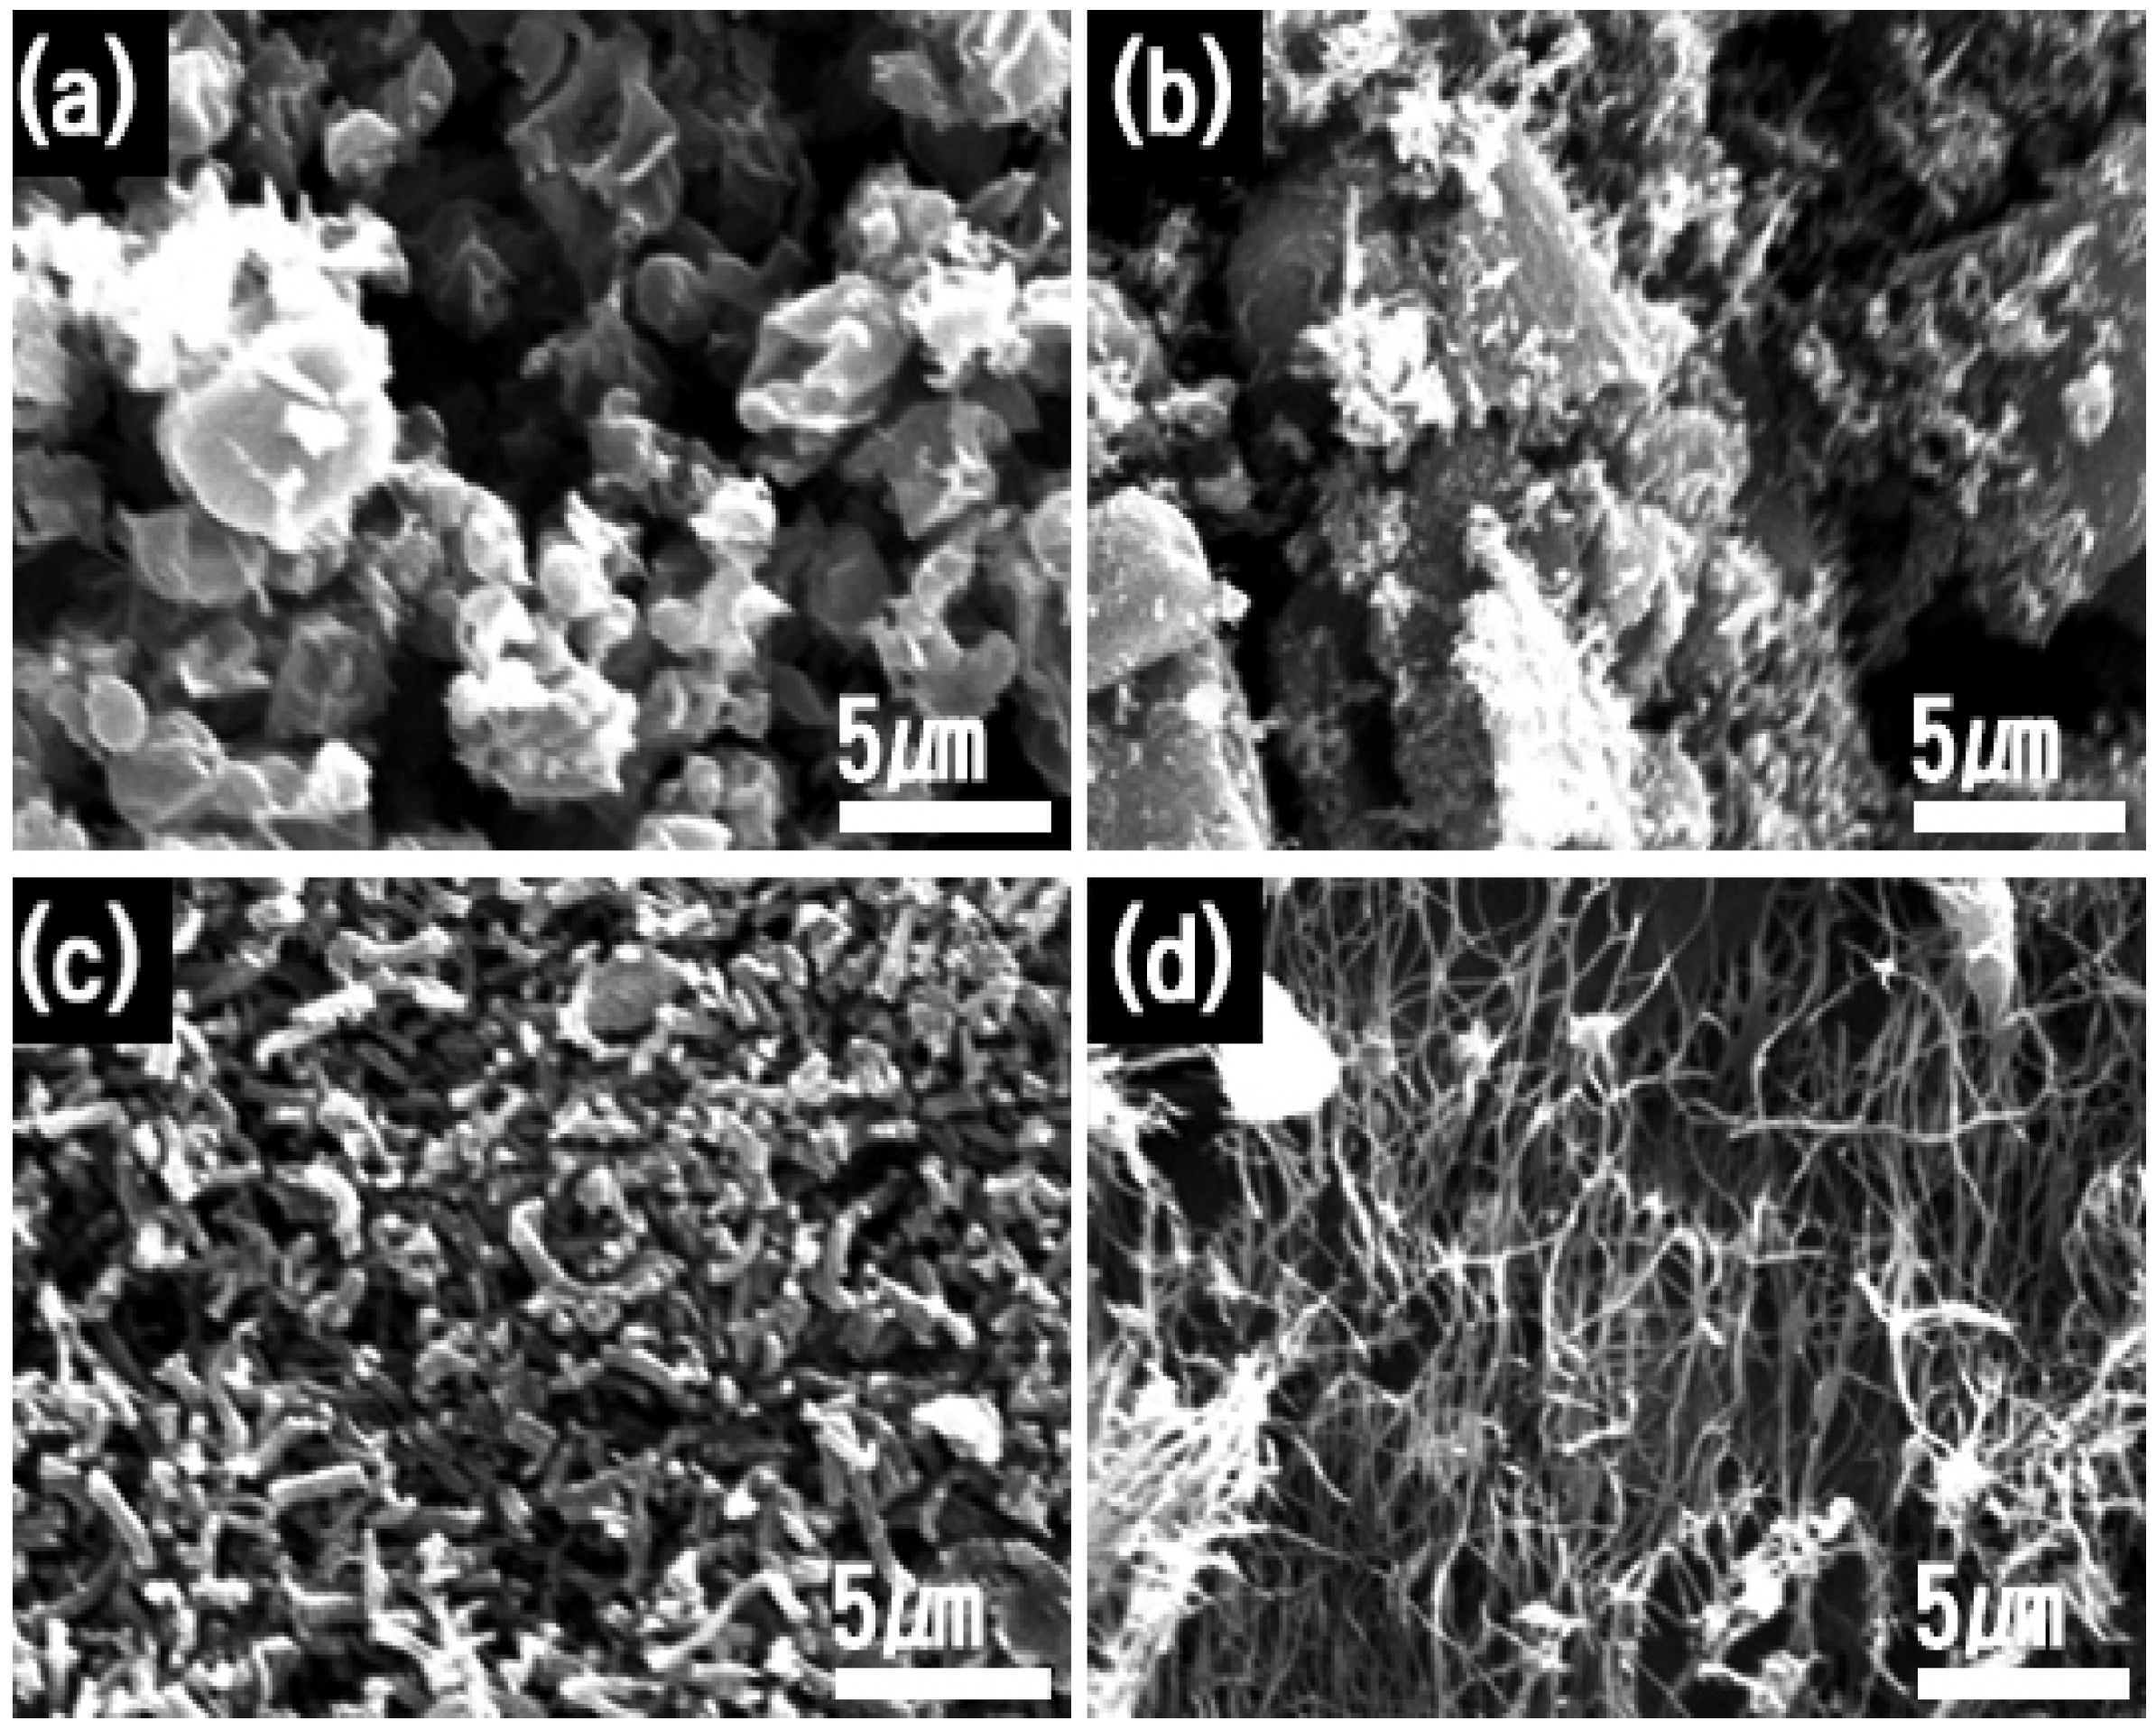
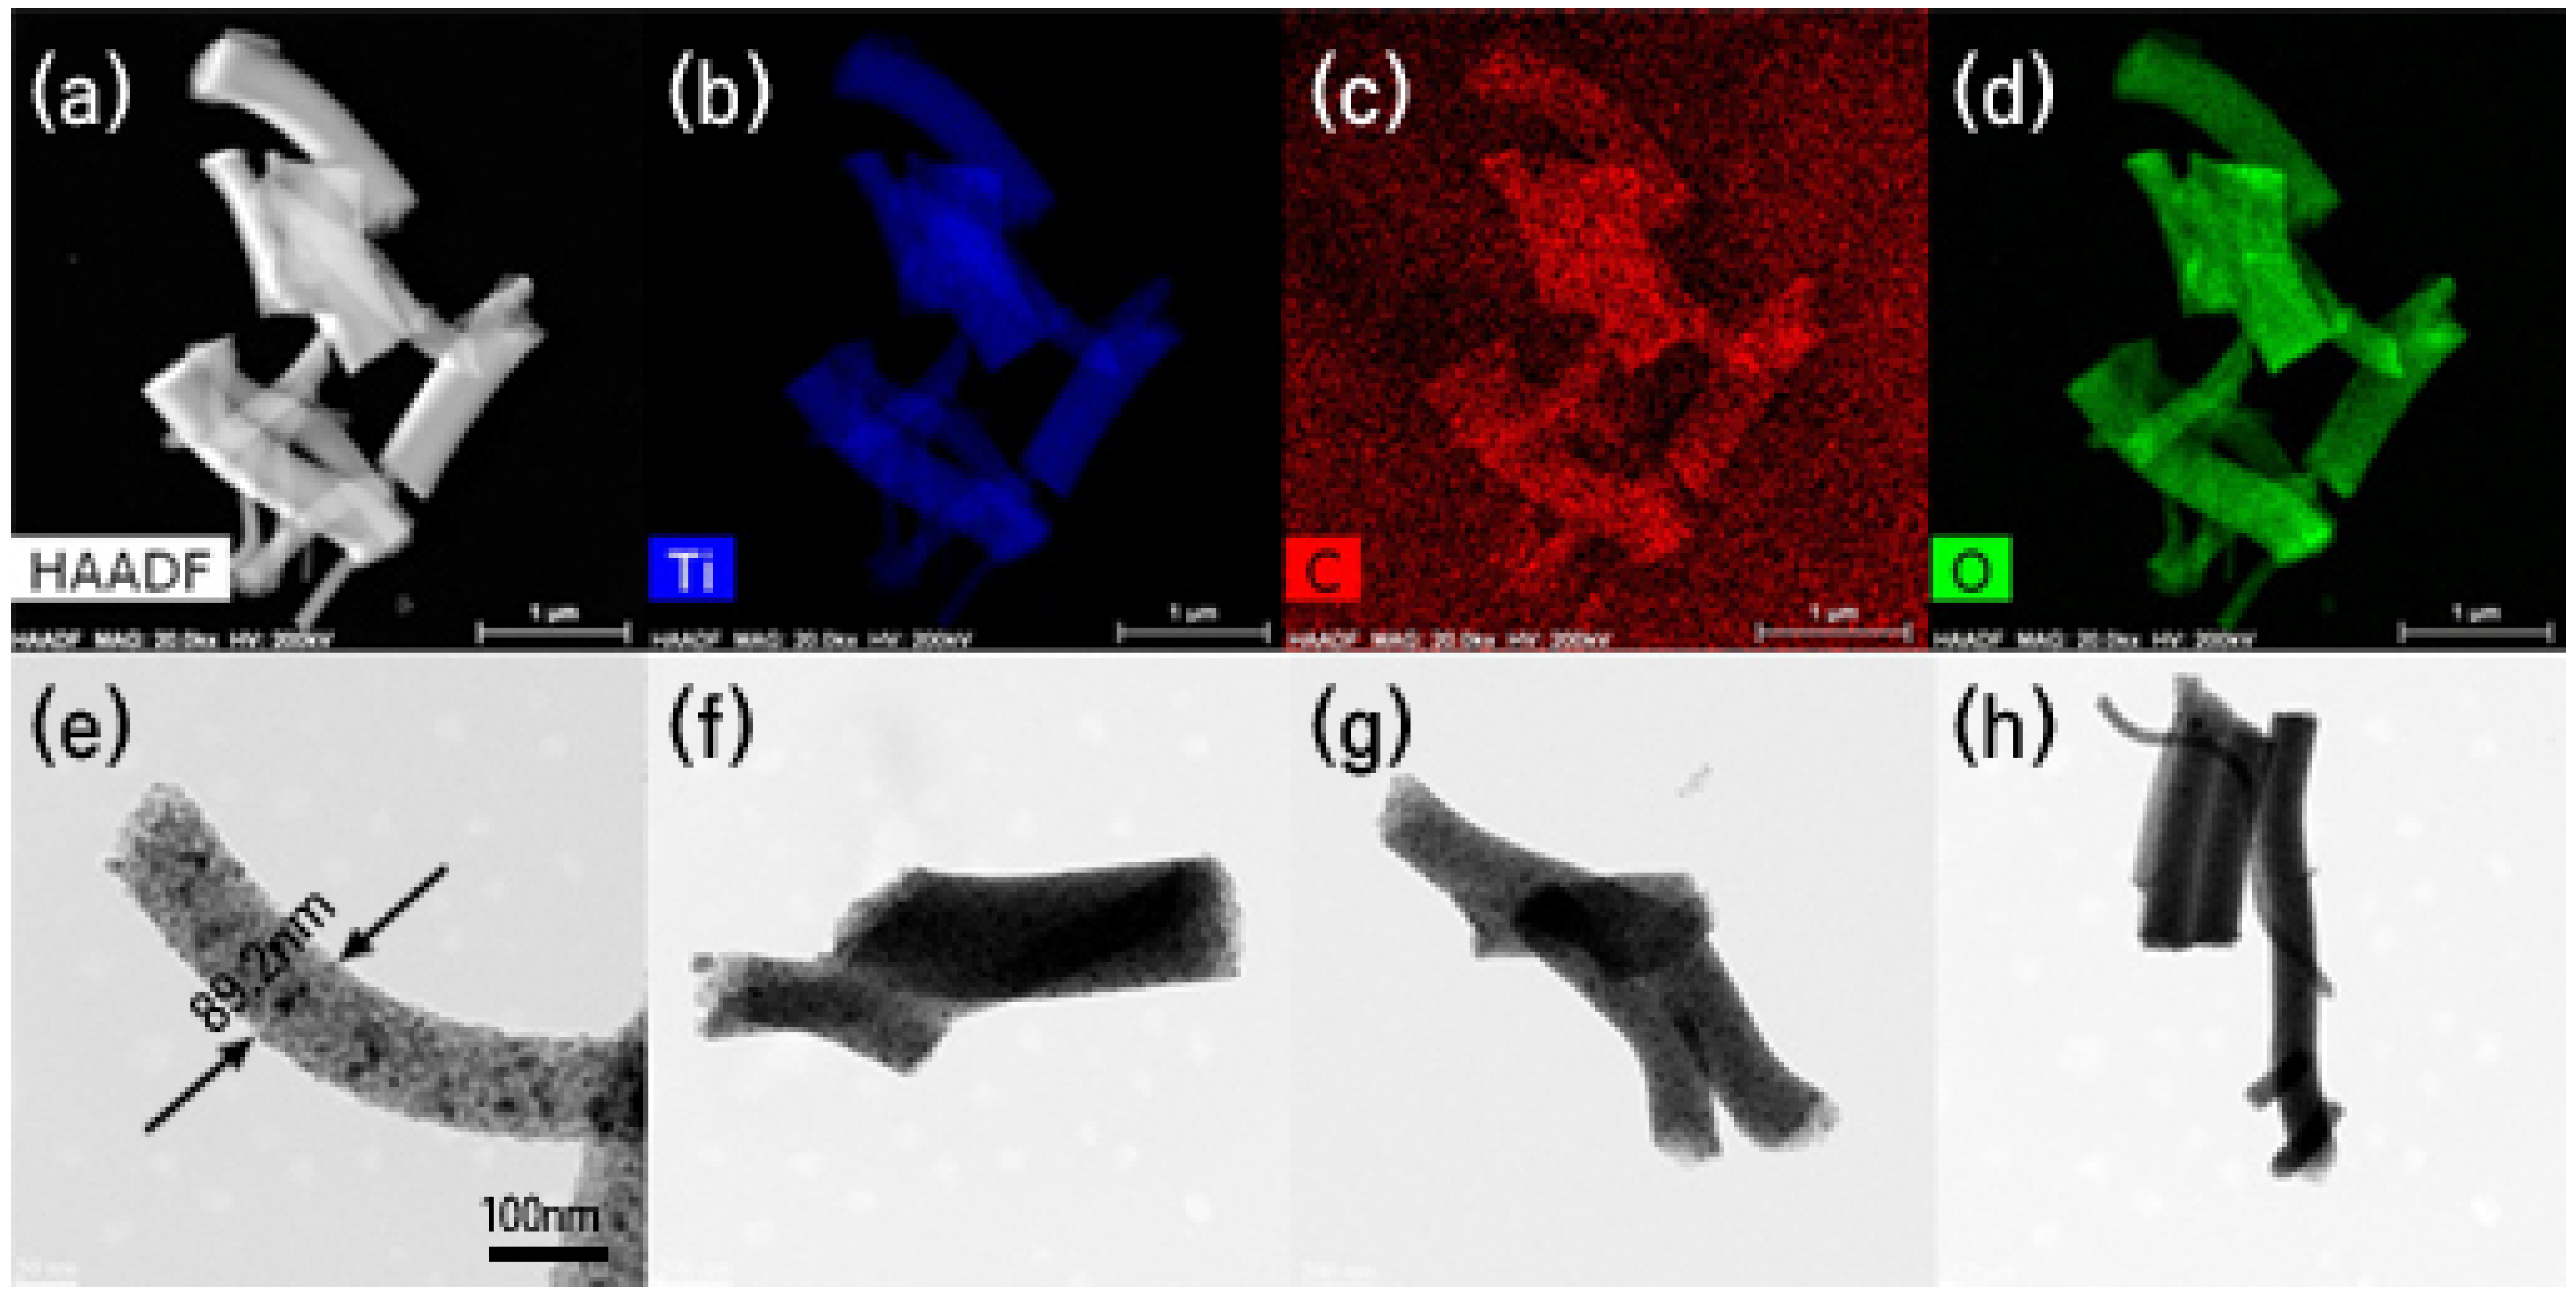
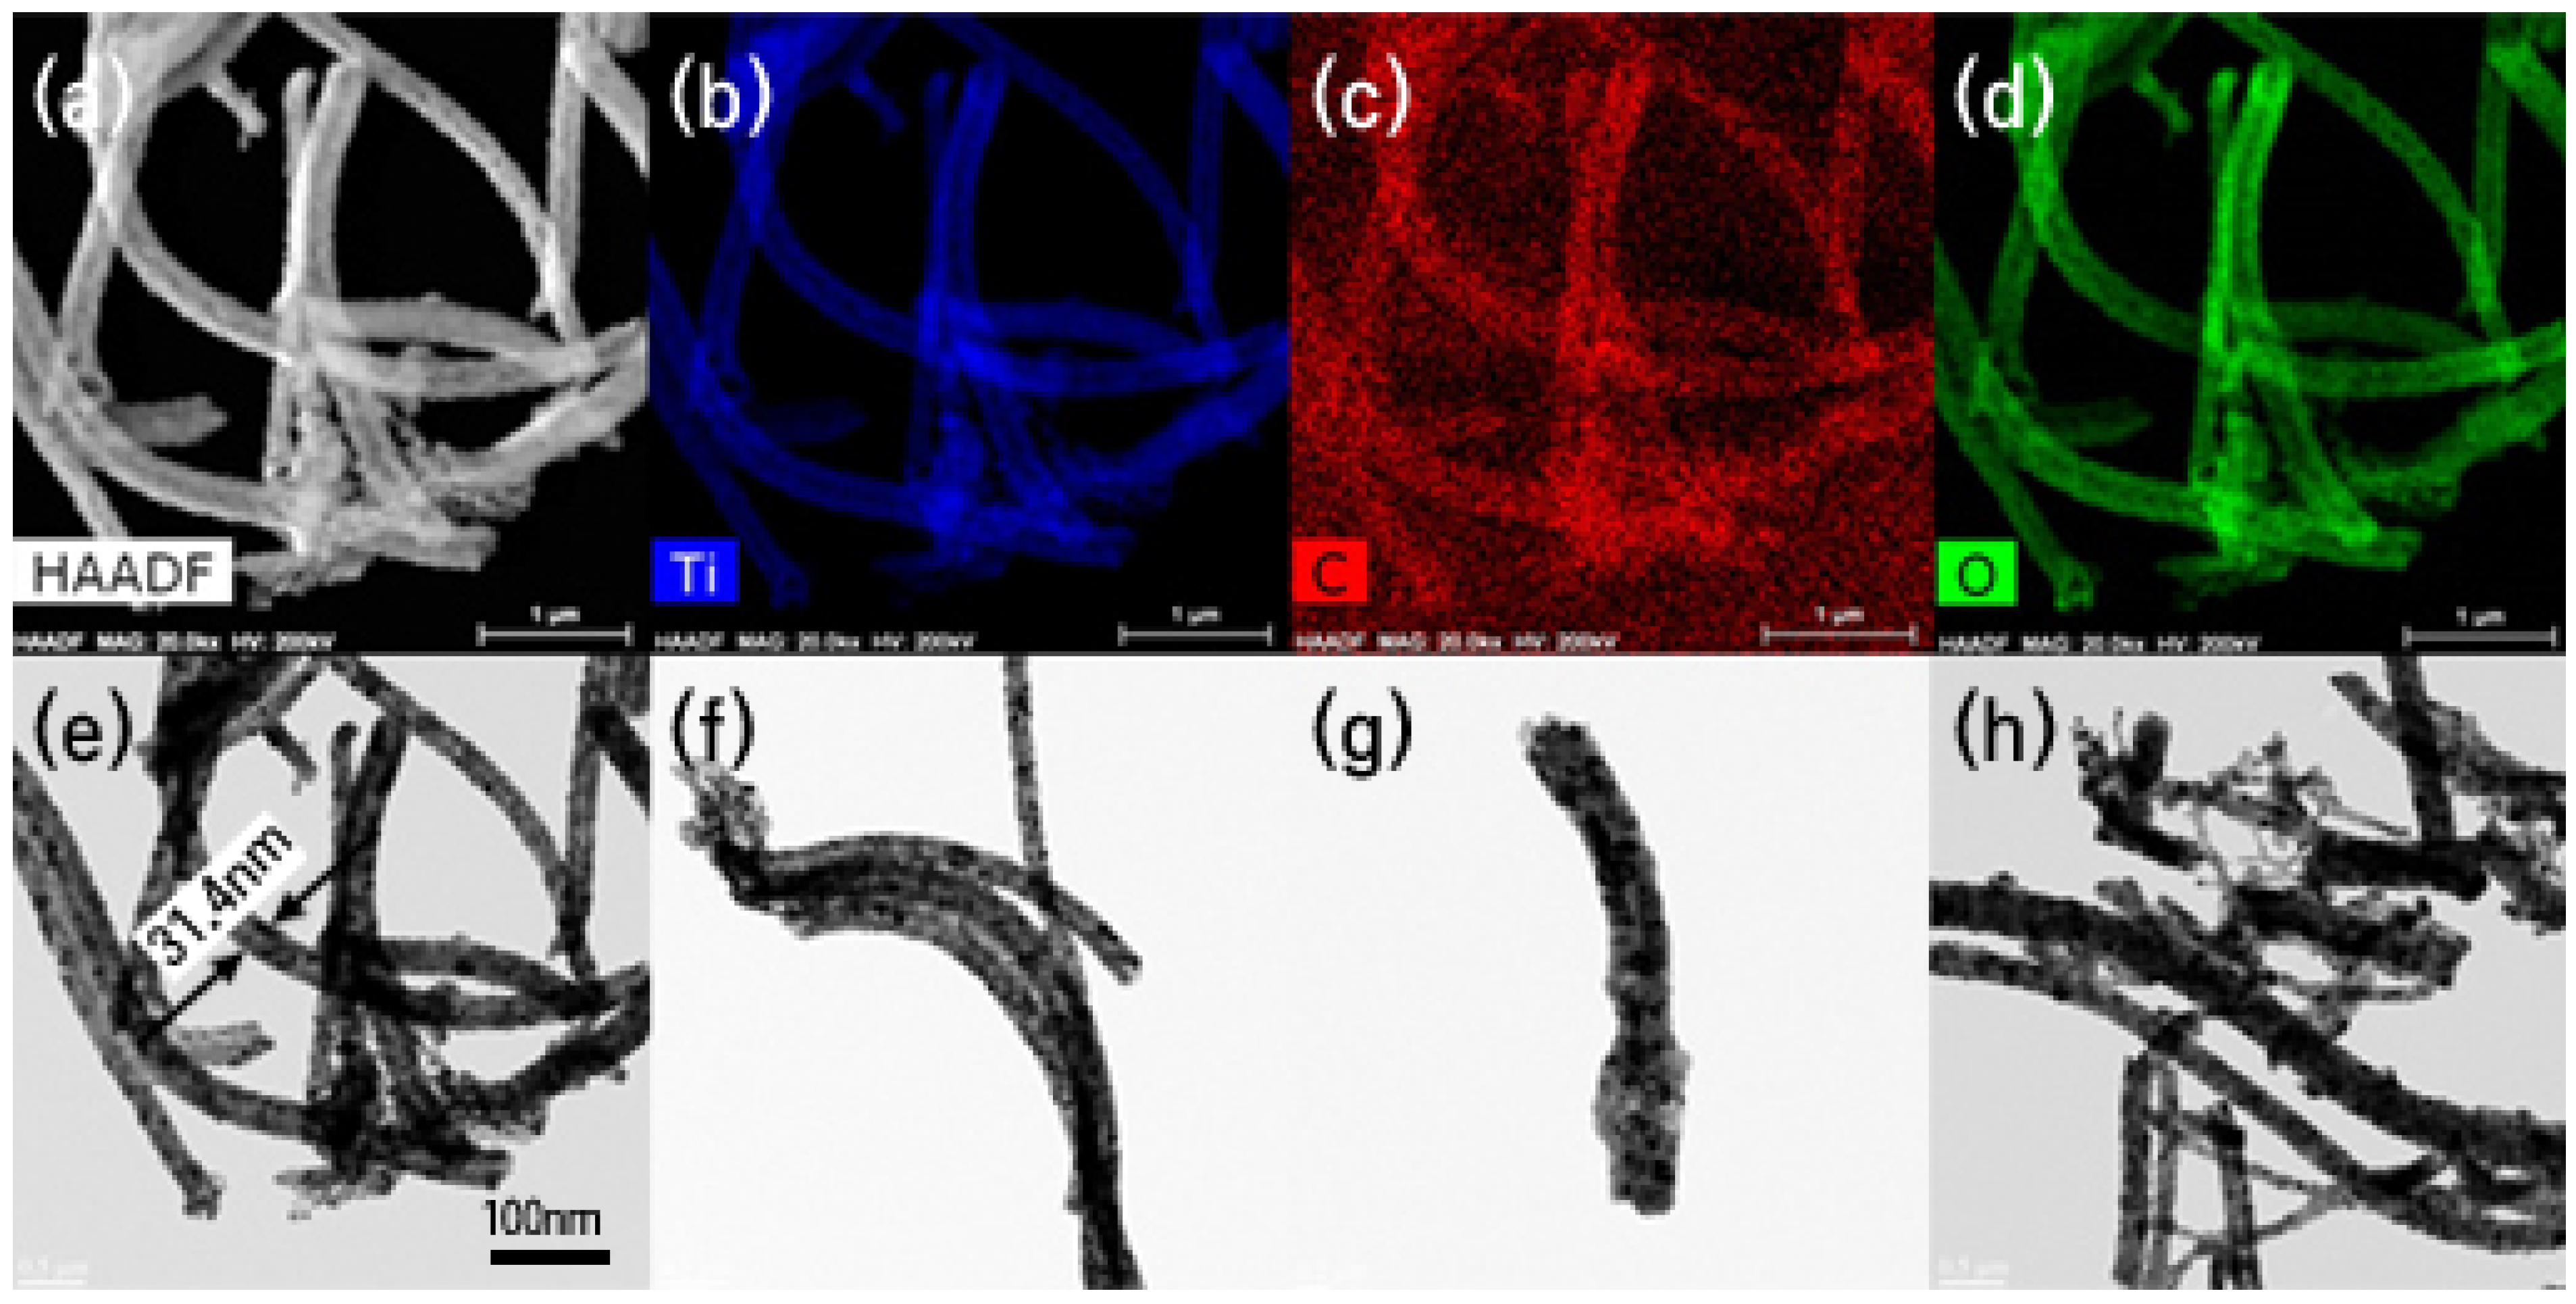
2.2.1. Morphology

FESEM has been utilized to investigate the morphology of the resultant electrospun fibers obtained from various conditions as in Table 1 (Figure 1). The SEM images of pristine Titanate NFs and Titanate(G)-CNFs are shown in Figure 1a–f. The as-spun titanate NFs (S1 and S2, Table 1) prepared with different molecular weight (40,000 and 1.30 × 10⁶) of PVP (Figure 1a,b) showed variations in the morphologies. Titanate NFs (S1) prepared with low molecular weight (40,000) PVP (Figure 1a) consisted of randomly distributed beads and a few NFs (having diameters in the range between 500 and 700 nm). On the other hand, mainly NFs could be seen for S2, the titanate NFs prepared with high molecular weight (1.30 × 10⁶) (Figure 1b) PVP. The diameters of fibers varied significantly (in the range of 200 nm to 720 nm) and a few flattened fibers could also be seen for S2 (Figure 1b). The titanate(G)-CNFs (S3) prepared with only 80 mg of G and the high molecular weight PVP (1.30 × 10⁶) had larger proportions of NFs with diameters in the range 80 to 100 nm and randomly distributed beads (Figure 1c). On the other hand, FESEM image of titanate(G)-CNFs (S4) (Figure 1d) prepared with 80 mg of G in a mixture of high and low molecular weight of PVP, showed the predominant existence of NFs (having an average diameter of 600 nm) with smooth surfaces (Figure 1d). Hence, it is concluded that the usage of mixture of PVP having low and high molecular weight in the presence of G resulted in Titanate (G)-CNFs without beads. FESEM images of S5 and S6 (prepared with different amount of G (40 mg and 120 mg) in a mixture solution containing low and high molecular weight of PVP show the presence of NFs without beads (Figure 1e,f). Hence, we have successfully optimized conditions for producing Titanate (G)-CNFs without beads.
It is observed that calcination (550 and 800 °C) of the as-electrospun Titanate NFs (S1 and S2) and Titanate (G)-CNFs (S4-S5) influences the morphology of the resultant composites (Figure 2a–d and Figure 3a–d). FESEM images of S1 (550) and S1 (800) (Figure 2a and Figure 3a) show the presence of randomly distributed micro/nanoparticles with smaller proportions of NWs. FESEM images of S2 (550) and S2 (800) (Figure 2b and Figure 3b) inform the presence of larger proportions of NWs as compared with the NF proportions in S1 (550) and S1 (800) (Figure 2a and Figure 3a). SEM images corresponding to S4 (550) (Figure 2c), S4 (800) (Figure 3c), S5 (550) (Figure 2d) and S5 (800) (Figure 3d) show the predominant presence of NWs. The TiO2(G)-CNWs have rougher surfaces (Figure 2c,d and Figure 3c,d) attribute to the excessive grain growth at elevated temperatures. The average diameter of the TiO2(G)-CNW showed dependency on two factors; (i) temperature of calcination and (ii) amount of G. Typically, increasing the temperature resulted in a decrease of the average diameters. The shortening of NWs informed that calcination could have caused the rupture of NWs. (Figure 2c and Figure 3c). The average diameter of S4 (550) and S4 (800) was found to be 380 nm and 260 nm, respectively. This observation is in accordance with the Ti-O-C-Ti- three dimensional networks generation during the titanate(G) CNF formation stage. On the other hand, SEM images of S5 (500) and S5 (800) (Figure 2d and Figure 3d) revealed the presence of longer NWs as compared to the length of S4 (550) and S4 (800) (Figure 2c and Figure 3c). The larger amount of G included in TiO2(G)-CNW is expected to prevent the dehydration of the inter-layered OH groups during the annealing process [51], resist the structural integrity of NWs and create, to a large extent, stable Ti-O-C-Ti- three dimensional networks in the titanate(G) CNF.
TEM images of S4 (550) (Figure 4a,e) and the elemental mapping of titanium (Figure 4b,e), carbon (Figure 4c,g) and oxygen (Figure 4d,h) are presented. TEM image of S4 (550) (Figure 4a,e) shows the NW diameter as ~90 nm and a length of up to few micrometers. The surface of NW is smooth. The presence of TiO2 and G can be identified by the contrast (bright and dark) in the TEM images (Figure 4e). The dark spots can be identified for G, which suggests that G is distributed randomly in the entire regions of NW. The TEM image of S4 (800) (Figure 5a,e) informs us that the NW diameter is significantly diminished as compared to the diameter of NW in S4 (550) and the surface is comparatively rougher than S4 (550). The TEM images of S4 (800) (Figure 5a,e) and the elemental mapping of titanium (Figure 5b,e), carbon (Figure 5c,g) and oxygen (Figure 5d,h) are presented in TEM elemental mapping of S4-550 (Figure 4b,d) and S4-800 (Figure 5b,d) confirmed the coexistence of the elements of titanium, oxygen and carbon in TiO2(G) NW. It should be pointed out that carbon exists only within the NW, while oxygen can be seen on the surface protrusions. The observation suggests that there can be surface hydroxyl groups on NWs. Figure 5 depicts the high resolution TEM (HRTEM) image of the S4 (550) (Figure 6a) and S4 (800) (Figure 6b) are used to infer the lattice fringes of the TiO2 polymorphs and G. While the HRTEM image of S4 (550) (Figure 6a) informs the existence of anatase, rutile and G having lattice spacing of 0.35 nm (anatase (101) plane), 0.32 nm rutile (110) plane) and 0.226 nm (100 facet of G hexagonal lattice) [9,10], HRTEM image of S4 (800) (Figure 6B) shows rutile and G lattice spacing.

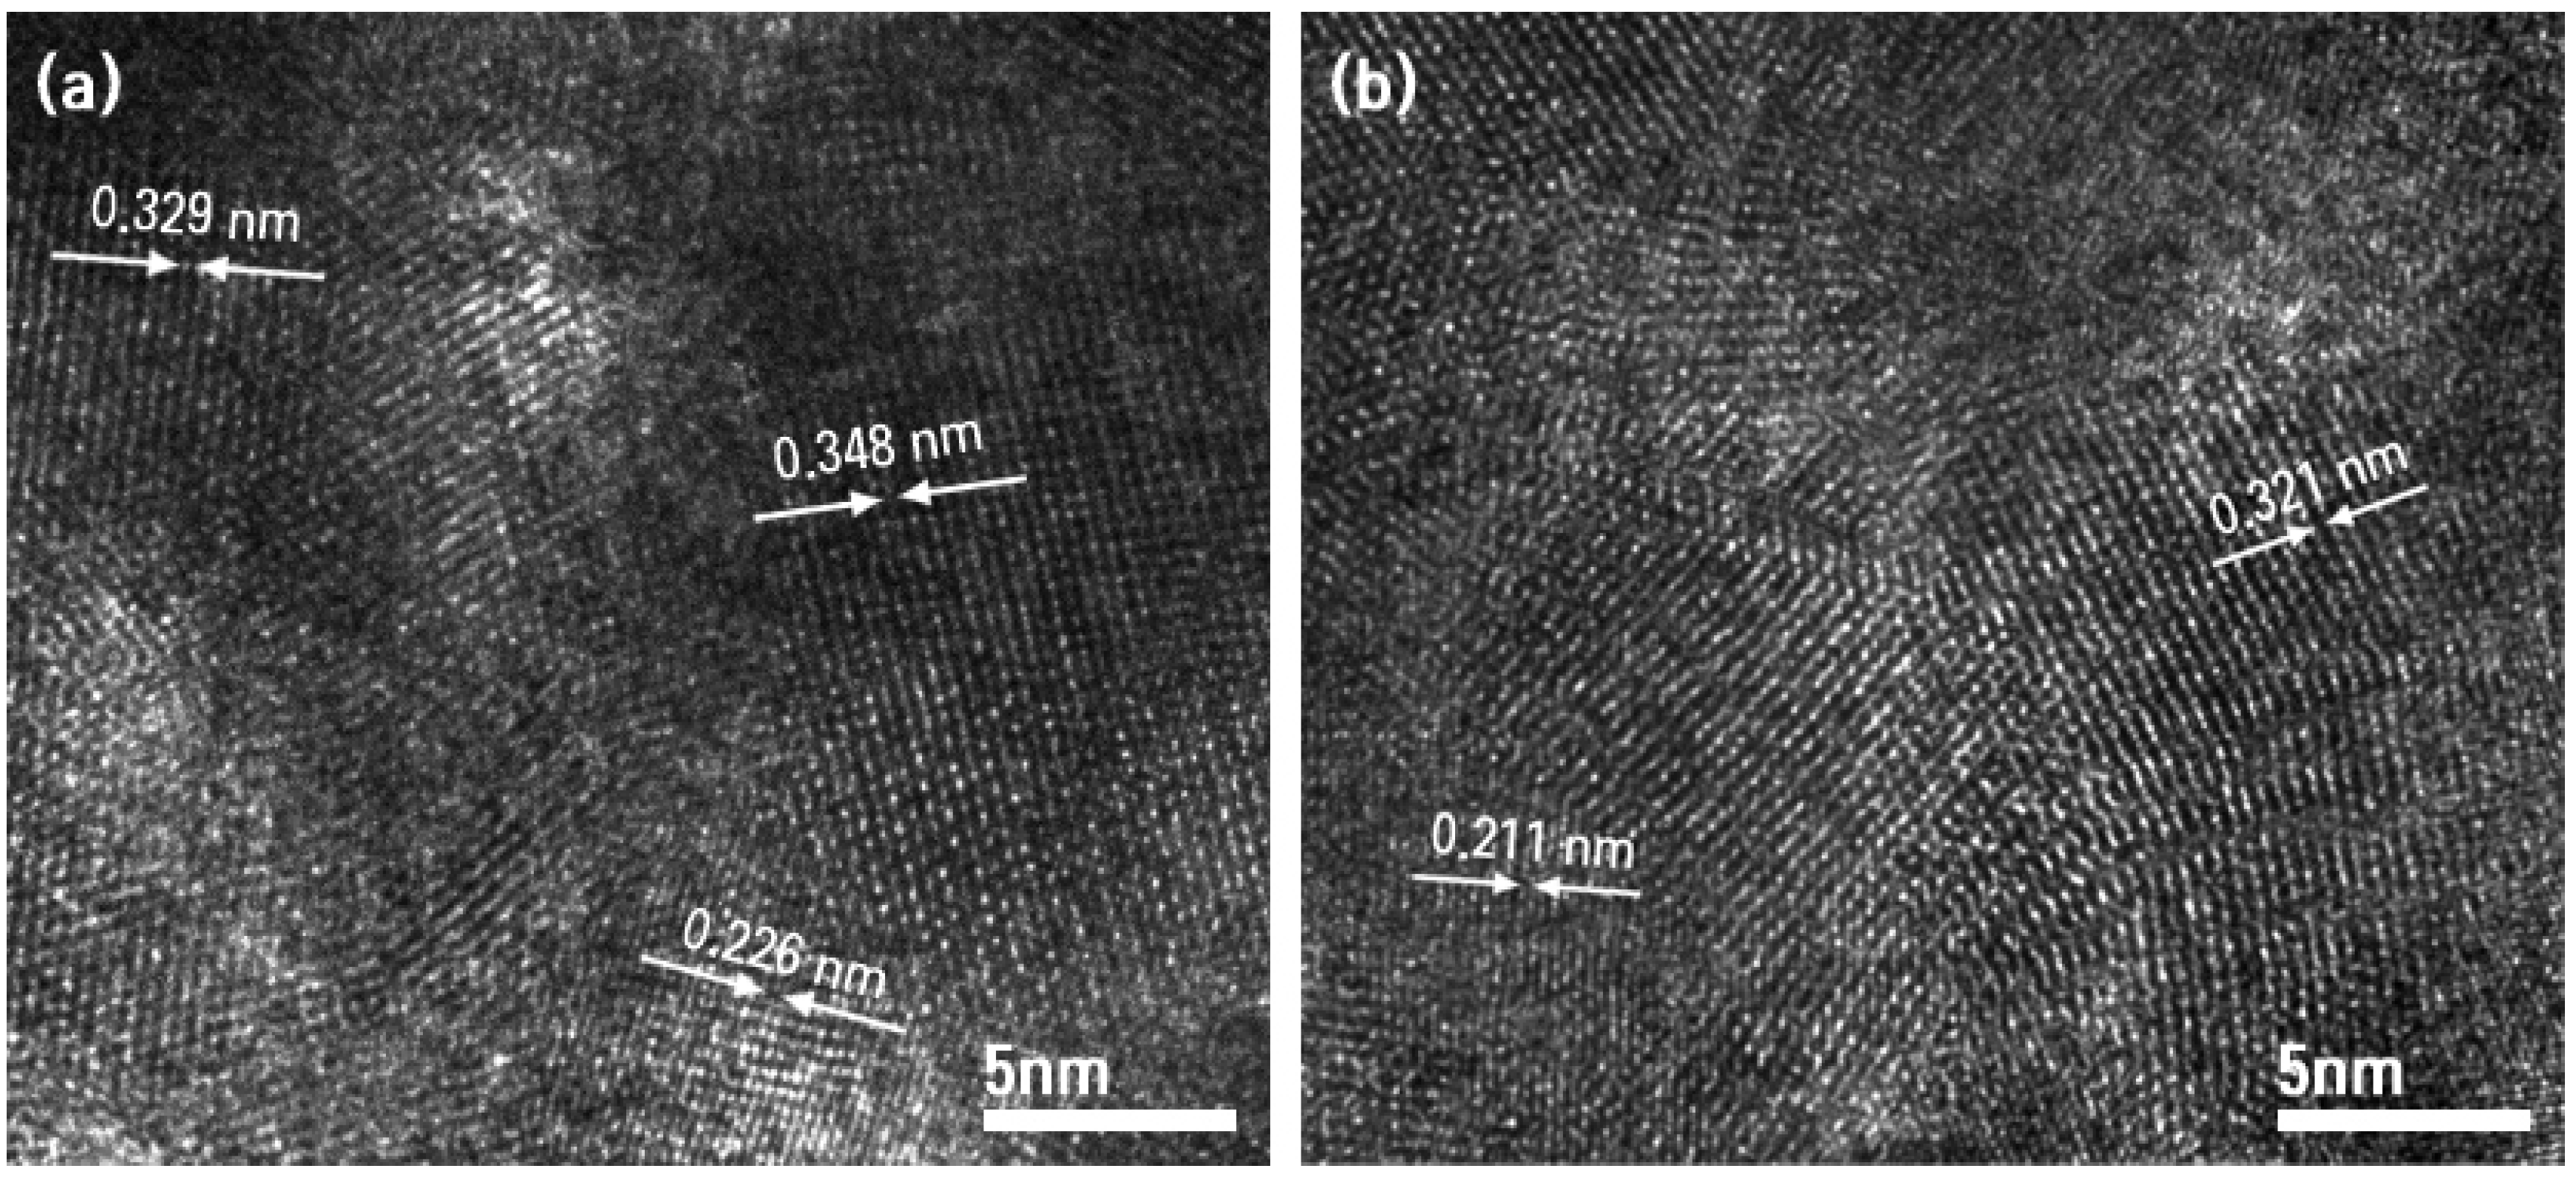
2.2.2. Microstructure

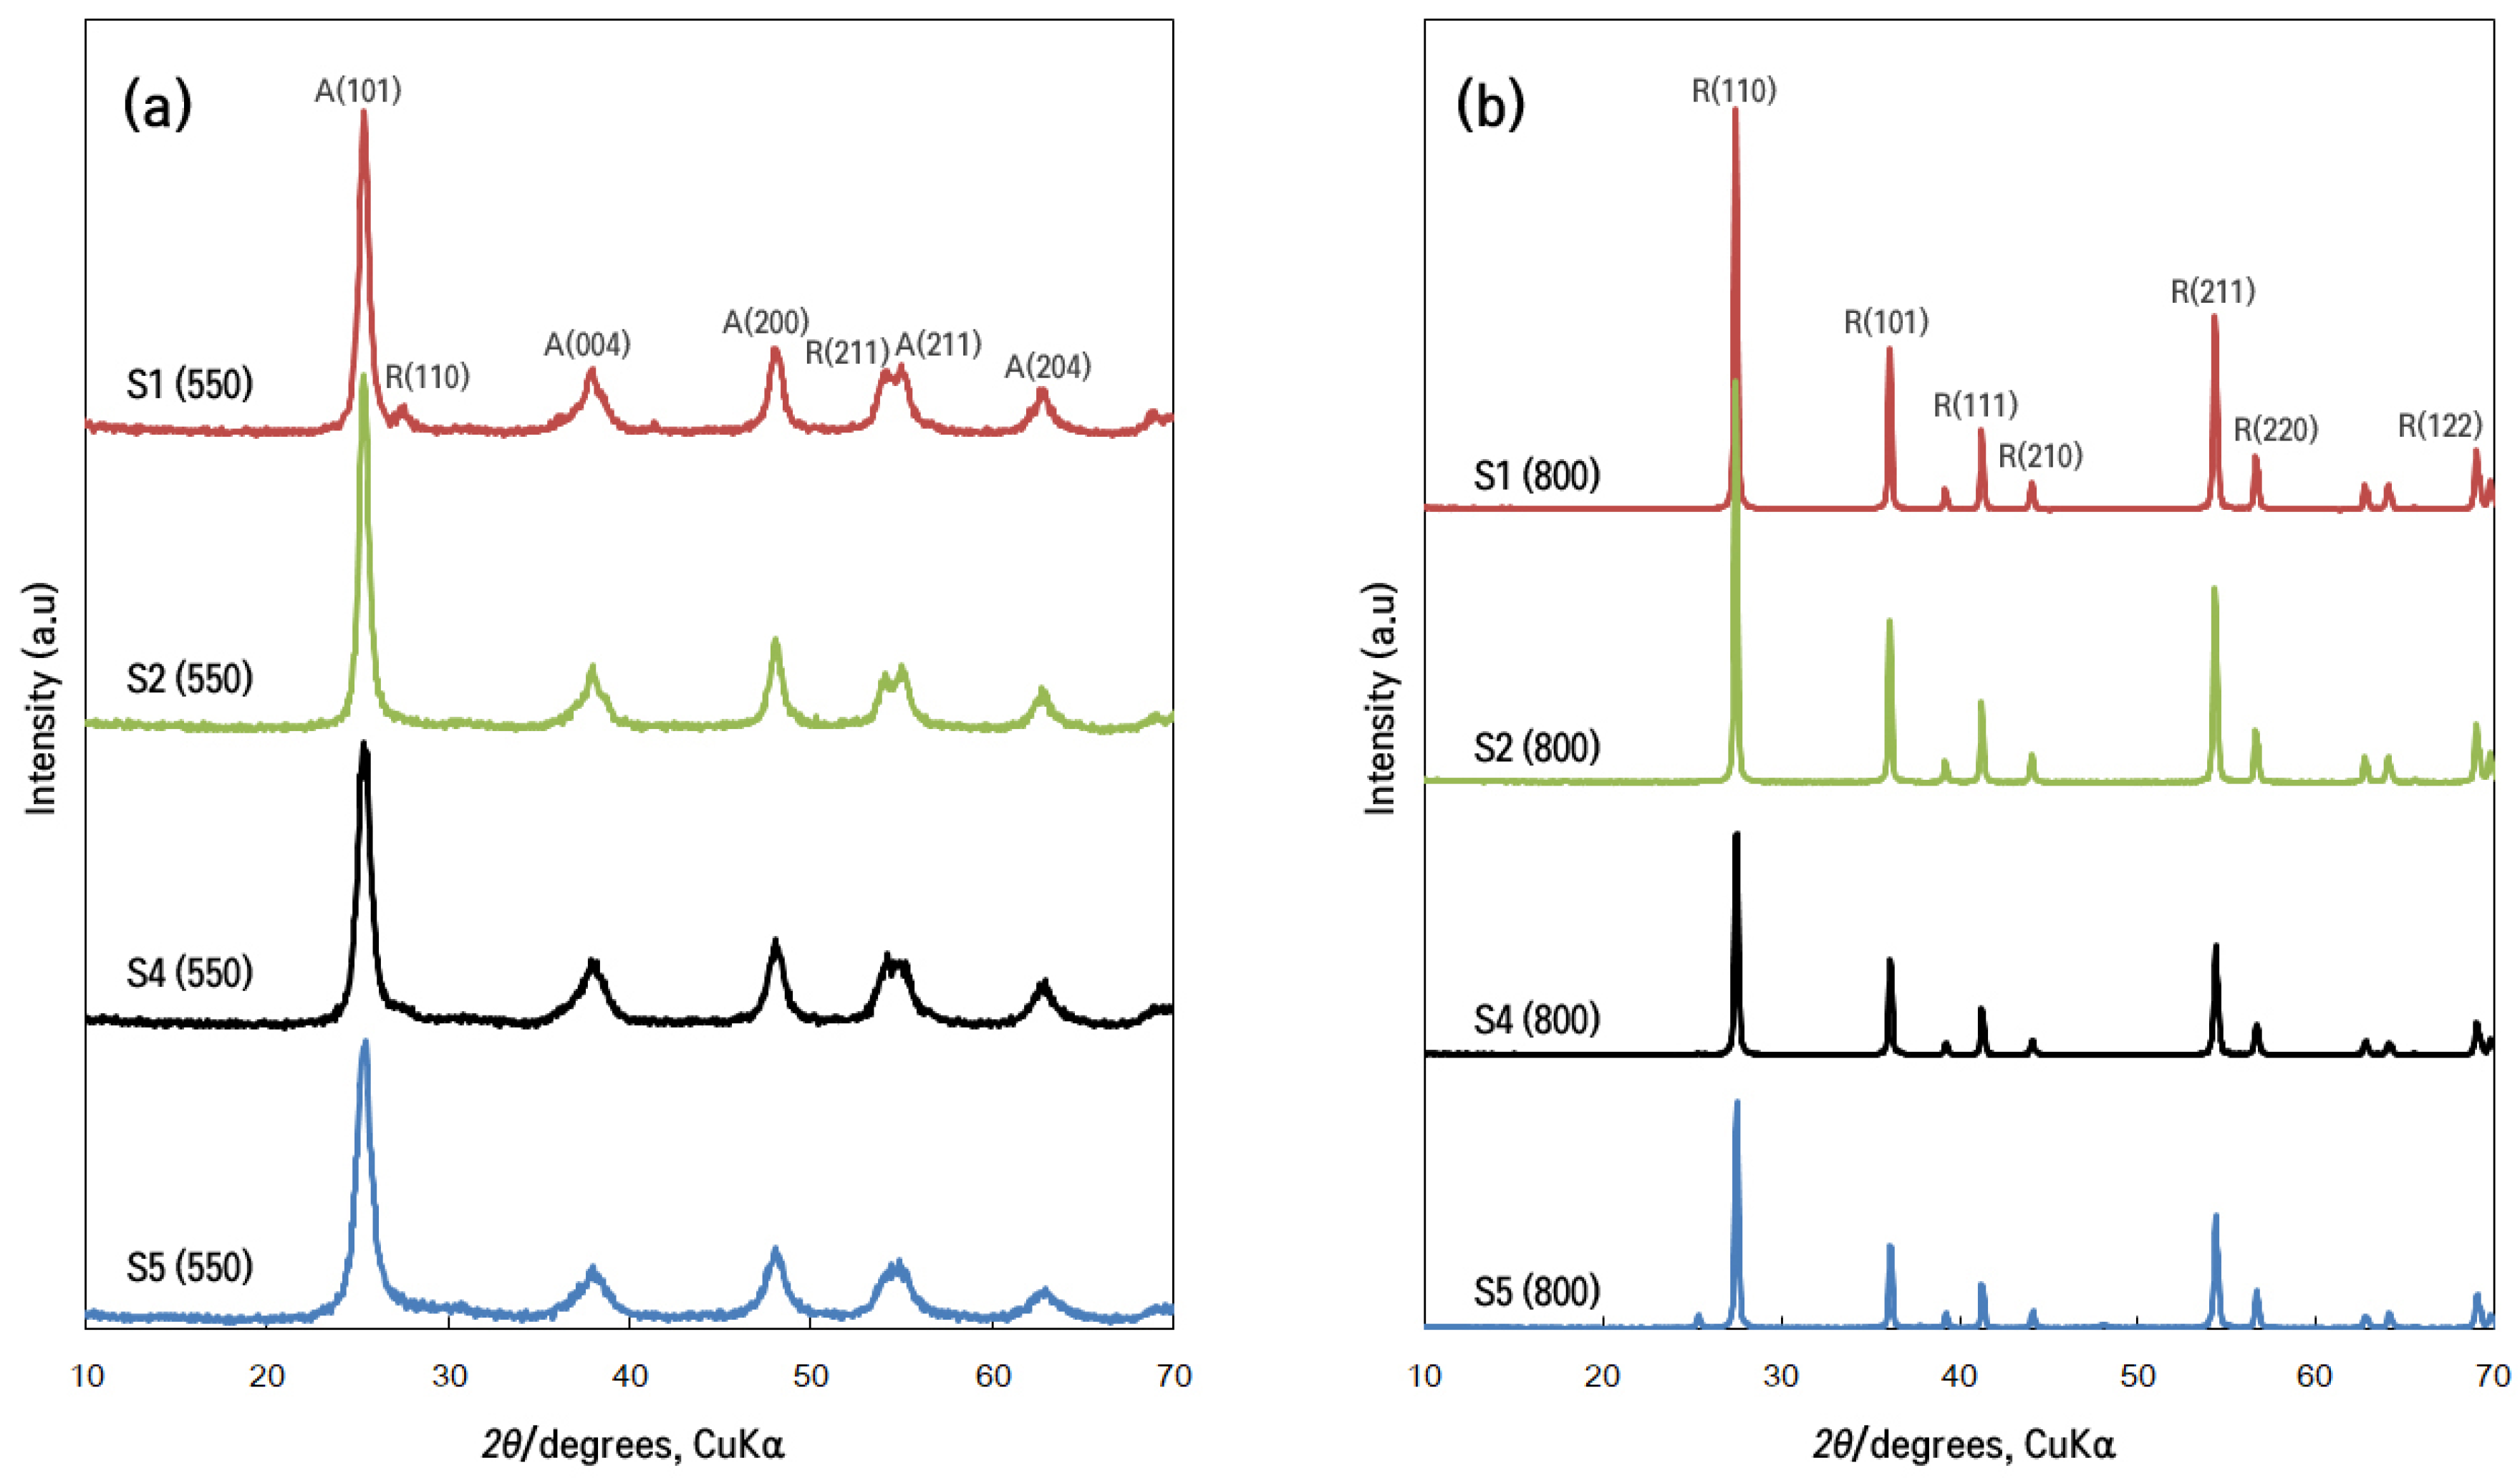
X-Ray Diffraction Analysis
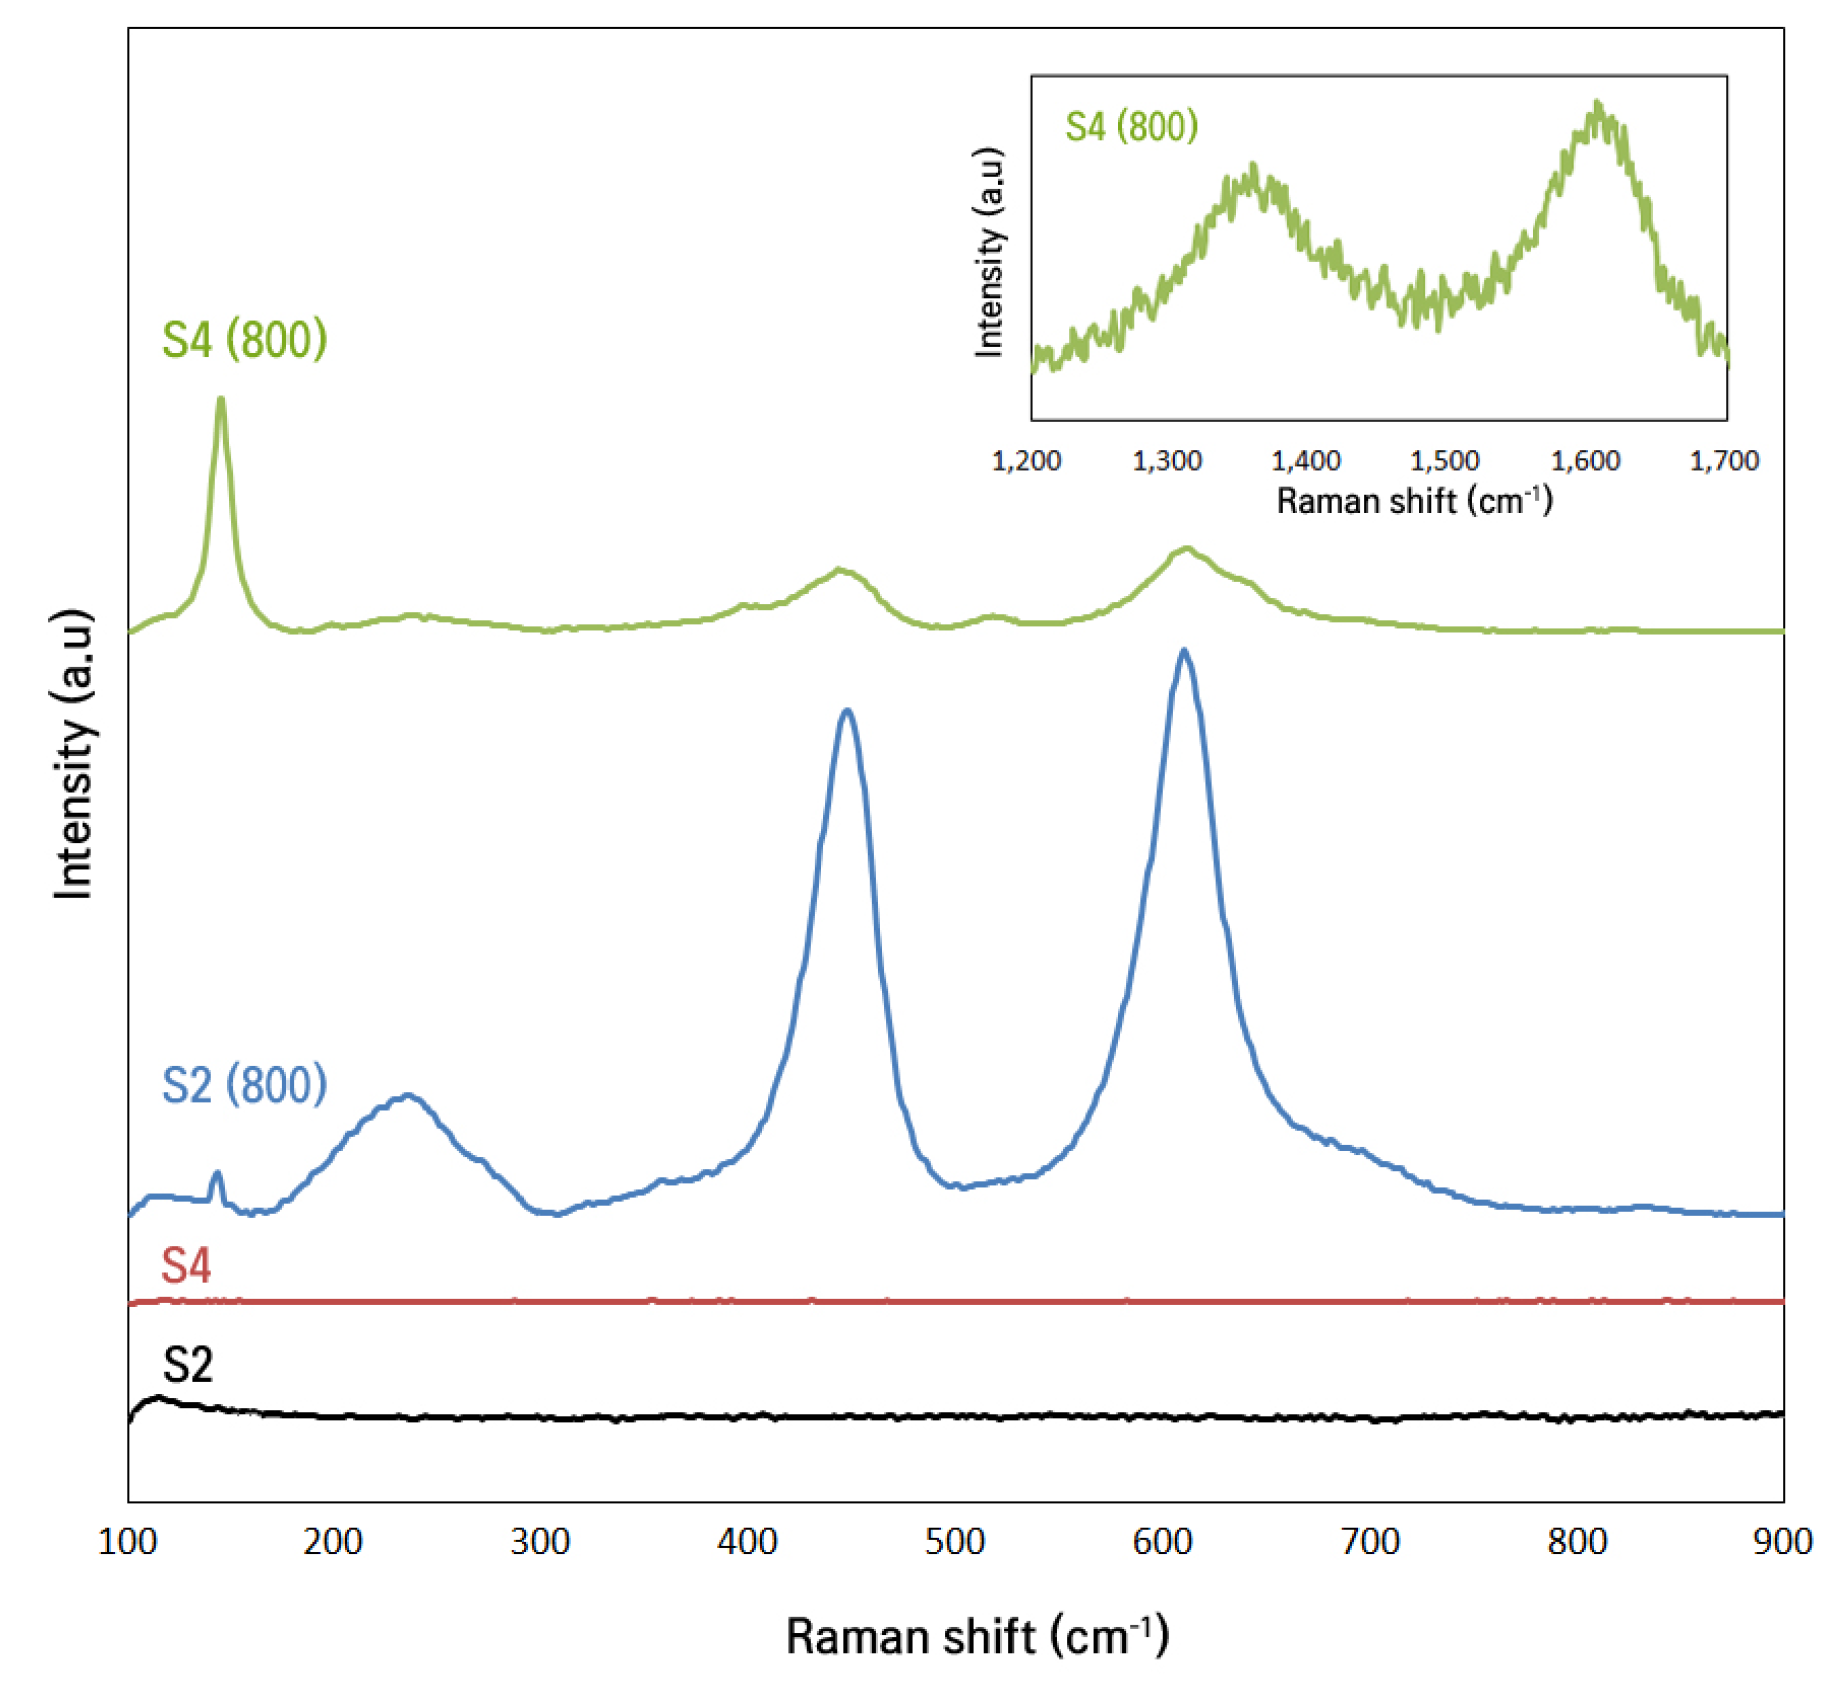
The TiO2 NWs and TiO2(G)-CNWs obtained through annealing of the respective titanate fibers at 550 and 800 °C were characterized by X-ray powder diffraction technique, and their XRD patterns are shown in Figure 7a,b. The peaks corresponding to the crystalline phases of TiO2, anatase and rutile, are identified in accordance with the references for these phases, JCPDS 21-1272 for anatase and JCPDS 21-1276 for rutile, in all the diffractograms, and labelled in Figure 7a,b. Several crystalline properties, such as the mass fraction percentage of anatase (XA) and rutile (XR) phases, the average crystallite size (t), the unit cell parameters (a, b and c) and the unit cell volume (V) are calculated and presented in Table 2 [52]. XRD patterns of 550 °C annealed samples (S1 (550), S2 (550), S4 (550) and S5 (550)) showed the predominant existence of peaks for the anatase phase, indexed as 2θ = 5.2 (101), 37.9 (004), 48.0 (200), 54.4 (105), 55.1 (221), 64.2 (310) and 68.9 (116) with a less intense rutile peaks 2θ = 27.5 (110) and 69.2 (112) (Figure 7a). The XRD peaks corresponding to rutile phases were very weakly intense in the 550 °C calcined TiO2 NWs and TiO2(G) CNWs than the commercial P25. Hence, the TiO2 NWs and TiO2(G) CNWs obtained from S1 (550), S2 (550), S4 (550) and S5 (550) were predominantly (~88%) having anatase phase structures. On the other hand, XRD patterns of 800 °C annealed samples (S1 (800), S2 (800), S4 (800) and S5 (800) (Figure 7b), exhibited peaks corresponding to the rutile phase, assigned as 27.5 (110), 36.0 (101), 39.2 (200), 41.0 (111), 44.0 (210), 54.0 (211), 57.0 (220), 64.2 (310) and 69.8 (112). The anatase peaks were virtually absent for 800 °C annealed samples (S1 (800), S2 (800), S4 (800) and S5 (800). Thus, the obtained TiO2(G) CNWs after calcination at 800 °C contain pure rutile TiO2 and confirmed the successful synthesis of pure rTiO2(G) CNWs. However, there are no separate peaks for G in the diffraction patterns of S4 (550), S5 (550), S4 (800) and S5 (800), possibly due to the low amount and low intensity of G peaks. Moreover, the characteristic peak of G at 24.5° may be superimposed or masked by the main peaks of TiO2 phases [53].
In order to understand the influences of calcination and G inclusion on the microstructures of the TiO2 with different phase structures, XRD patterns for all samples were carefully analyzed. One can see that the crystallite sizes for TiO2 increased upon increasing the calcination temperature (Table 2). The increased crystallite size is attributed to the thermally promoted crystallite growth at elevated temperatures. For the 550 °C calcined samples (S1 (550), S2 (550), S4 (550) and S5 (550)), the lattice parameters were in accordance with a=b≠c corresponding to the tetragonal crystal lattice with a, b, c values 3.78.3.78 and 9.50 A (Table 2), respectively. The 800 °C annealed samples (S1 (800), S2 (800), S4 (800) and S5 (800)) retained the tetragonal structure with distinctly different lattice parameters for a, b and c (Table 2). After 800 °C calcinations, the lattice parameters, especially a and b, increased from 3.78 Å to 4.94 Å. This observation is not normal since high temperature calcinations usually lead to lattice shrinkage due to the larger grain sizes. Also, the lattice parameter c significantly decreased from 9.50 to 2.96. Besides, the axial ratio, c/a, that represents the lattice symmetry, significantly decreased from 2.70 to 0.65 and, the unit cell volume decreased from ~136 to ~62. These alterations in lattice parameters observed upon high-temperature calcinations and G inclusions suggested the presence of defects [54]. Addition of a small amount of carbon impurity to TiO2 in a controlled manner can be referred to as C-doping of TiO2. There can be two possible doping carbon sites in TiO2; (i) carbon at an oxygen site anion doping and (ii) carbon at a titanium site cation doping. The density functional theory predicted that cation-doped carbon atoms can result in a carbonate-type structure, whereas anion-doped carbon atoms (substitution on the oxygen site) do not involve in any significant structural changes [54]. The G included in this work is expected to make carbonate type structural modifications. Due to carbon substitution on the oxygen, a visible-light response could be induced due to the appearance of an unoccupied impurity state occurring in the band gap, which can be beneficial in promoting photocatalytic degradation reactions. We invoked the possibility of energy level and optical property changes due to the calcination and G inclusion in the prepared rTiO2(G) CNW.

Raman Spectroscopy

The results from XRD characterizations (Figure 7) implied that the existence of G and annealing temperatures influence the crystal phase of TiO2 and also contribute to the inclusion of defects in crystal structure. To clarify these aspects, Raman spectra were recorded. Figure 8 shows the Raman spectra for S2, S4, S2 (800) and S4 (800) samples. Raman spectra of S2 and S4 did not show characteristic peaks for crystalline TiO2 phase due to the amorphous nature and the presence of large extent of polymers. Raman spectrum of S2 (800) and S4 (800) (Figure 8) shows predominant characteristic peaks around ~140 cm−1 (B1g), ~445 cm−1 (Eg), ~610 cm−1 (A1g), and a broad band around 240 cm−1 for second-order effect that correspond to the rutile phase [55]. There exists a blue shift for the first two modes (Eg(1), B1g(1)) in the Raman spectrum of S4 (800) as compared to the samples S2 (800) suggesting the formation of hybrid structure in the case of S4 (800) due to the inclusion of G in the TiO2 crystal lattice. It must be noted that Raman peaks of the S2 (800) correspond to pure rutile TiO2, whilst that of S4 (800) correspond to the G included rutile TiO2. We attribute the blue shifts in the Raman modes (Eg(1), B1g(1)) ) for S4 (800) to the oxygen vacancies as Eg(1) and B1g(1), modes are sensitive to O- O interactions [56]. As a result of possible sharing of oxygen at the interfaces between TiO2 nanocrystals and the TiO2/G, the TiO2 crystal structure includes defects.
Raman spectroscopy was also employed for molecular morphology characterization of carbon inclusion in TiO2 structure. As shown in Figure 8 (inset), two Raman peaks were located around ~1350 cm−1 and ~1600 cm−1 for the sample S4 (800) that are attributed to D and G bands [57]. While the G band is common to all sp2 carbon forms and provides information on the in-plane vibration of sp2 bonded carbon atoms, the D band indicates the presence of sp3 defects. This result confirms the inclusion of G in the S4 (800). The intensity ratio of the D and G bands (ID/IG) of was 0.757 for S4 (800). The significant intensity of D band in S4 (800) indicated that inclusion of G could result in chemical linking to TiO2 structure and the modify the sp2 carbon network. Raman results (Figure 8) are in good agreement with the results of XRD (Figure 7).

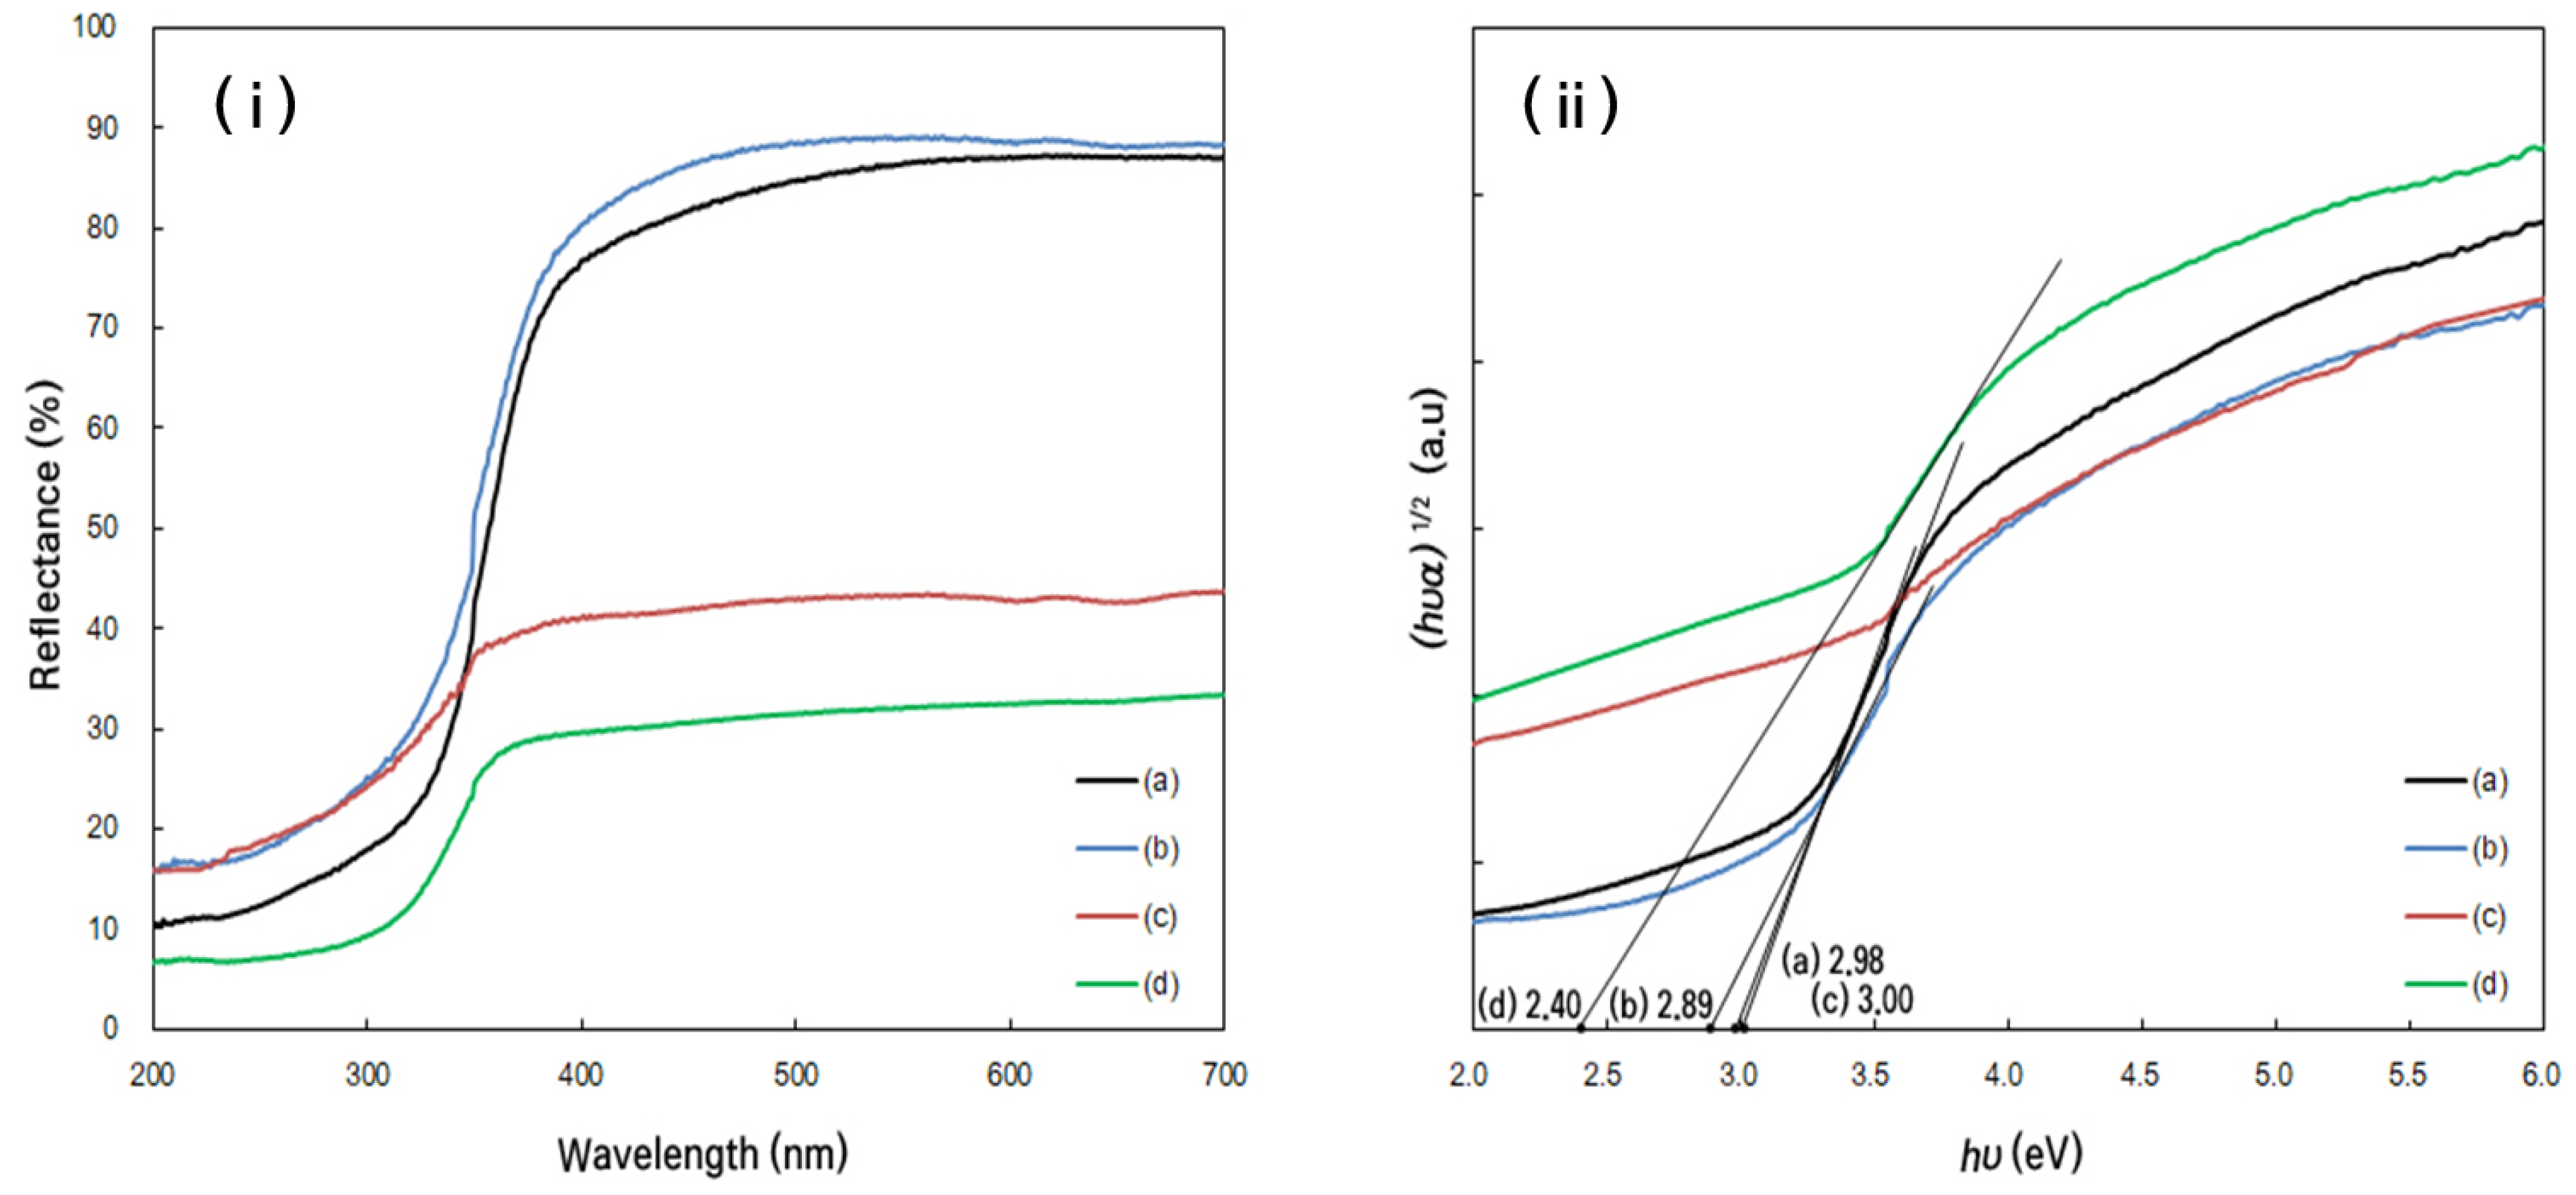
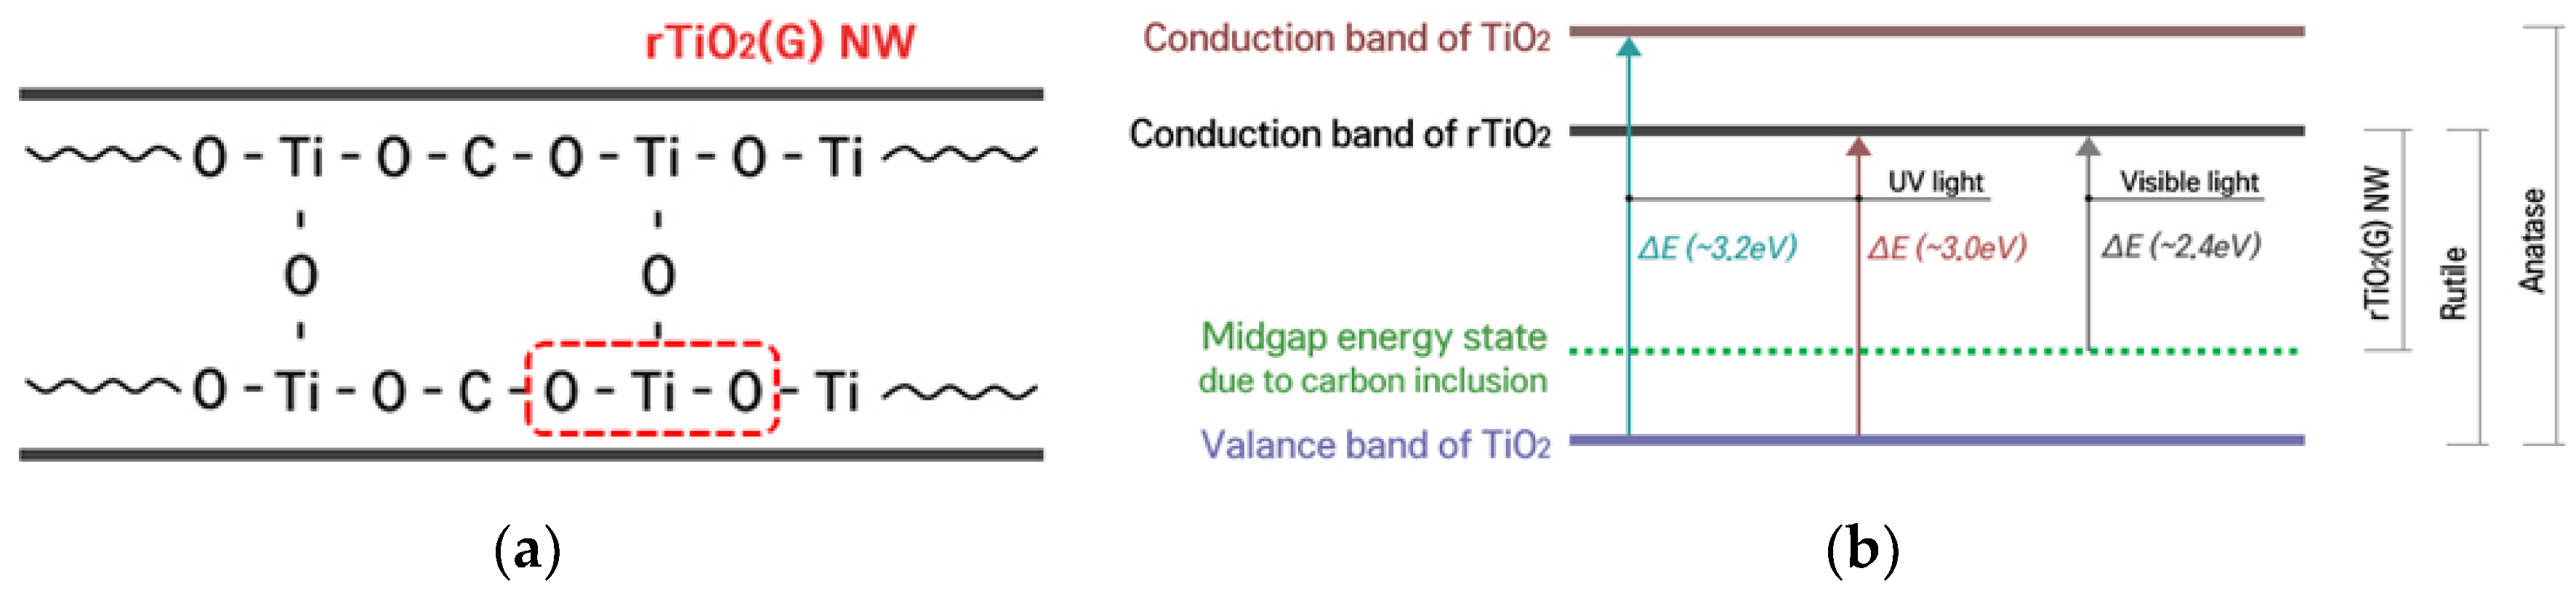
2.2.3. Optical Properties

Diffuse Reflectance Spectroscopy
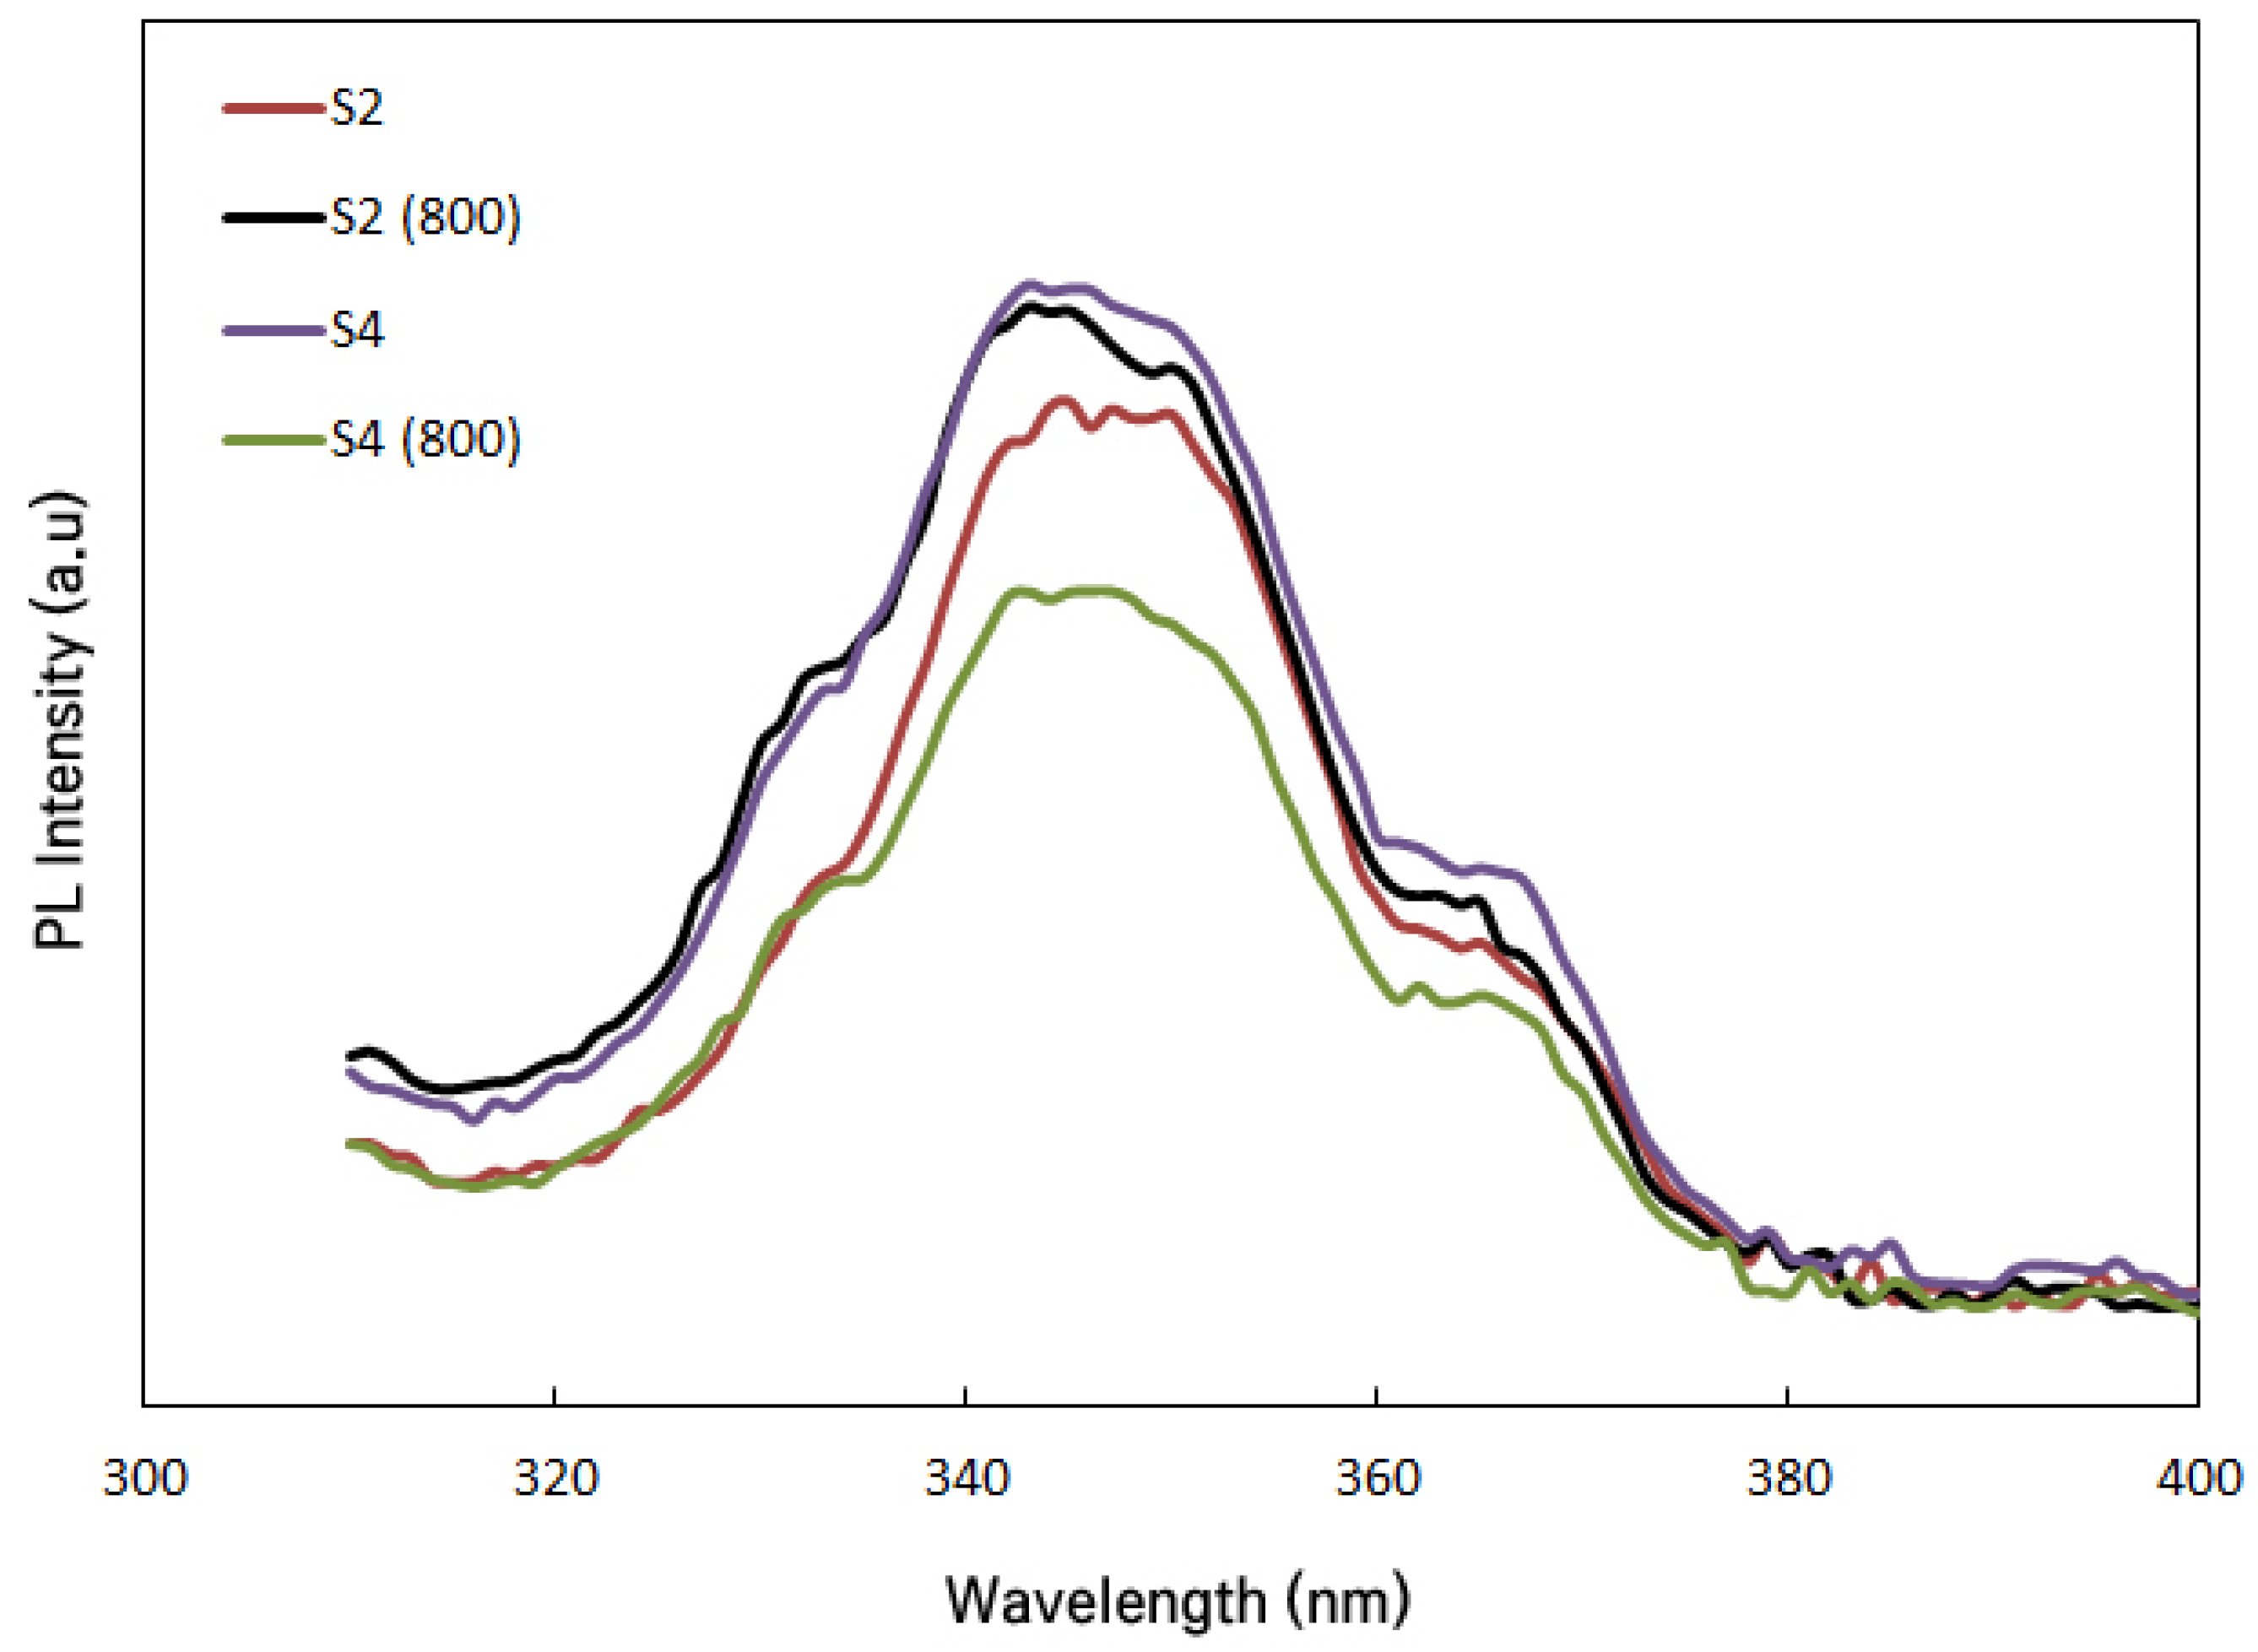
UV−vis diffuse reflectance spectra (DRS) measurements (Figure 9i) were used to infer the optical characteristics and to determine the optical band gap energy of the synthesized materials. Generally, the G included samples (S4 (550) and S4 (800)) samples exhibited broad absorbance in the visible region as compared to S2 (550) and S2 (800). The augmentation of absorbance in the visible light region up to 800 nm for (S4 (550) and S4 (800)) is attributed to the presence of G species, which act as a photosensitizer. In addition, the extent of visible region absorbance varied is higher for S4 (800) as compared to S4 (550). The results informed that the rutile transformation induces more visible light absorptions. The band gap of TiO2 was evaluated from the intercept of the straight-line portion of the Kubelka–Munk plots (Figure 9ii) [49].
The band gap energy of S2 (550), S2 (800), S4 (550) and S4 (800) was determined to be 2.98 eV, 2.89 eV, 3.00 eV and 2.40 eV. The trend in band gap shows that S4 (800) has the lowest band gap (2.40 eV, corresponding to a visible light wavelength ~520 nm) among the studied materials. The decrease in the bandgap is ascribed to the existence of defect states induced by the Ti−O−Ti-C-skeleton included in the frame works and the increased percentage of the rutile phase, which has a smaller bandgap than the anatase phase [7,8,50,51].

Photoluminescence

Photoluminescence (PL) emission spectroscopy was used to study the charge transfer behavior of photo-induced electrons and holes in the S2, S4, S2 (800) and S4 (800) samples (Figure 10) which reveal the surface structure and excited state of the TiO2 semiconductor and the TiO2-G hybrid samples. It must be noted that S2 (800) and S4 (800) are the pure rutile TiO2 and G included TiO2 materials. Hence, the analysis of PL spectral of the S2, S4, S2 (800) and S4 (800) samples could reveal changes in the photoemission characteristics due to the G inclusion and rutile transformation. In general, a decrease in the PL intensity indicates the lowering of photo-induced electron-hole pair recombination rate and suggests the increase in photo-generated charged separation and hence increased photocatalytic activity. The spectra of all samples show a peak centered around 356 nm. There is an increase in PL intensity upon conversion of S2 to pure rutile TiO2 (Figure 10) samples S2 and S2 (800). This is consistent with the literature that suggests that pure rutile TiO2 is less photoactive as compared to pure anatase and mixture of anatase and rutile TiO2. However, a significant decrease in PL intensity was observed between the samples S4 and S4 (800) (Figure 10). The lowering of PL emission intensity for S4 (800) as compared to S4 may be attributed to the role of G as an electron shuttle for rutileTiO2, preventing electron-hole recombination with a resulting higher photocatalytic activity. PL spectrum of S4 (800) has the lowest emission intensity, suggesting highest photo activity for rTiO2(G).

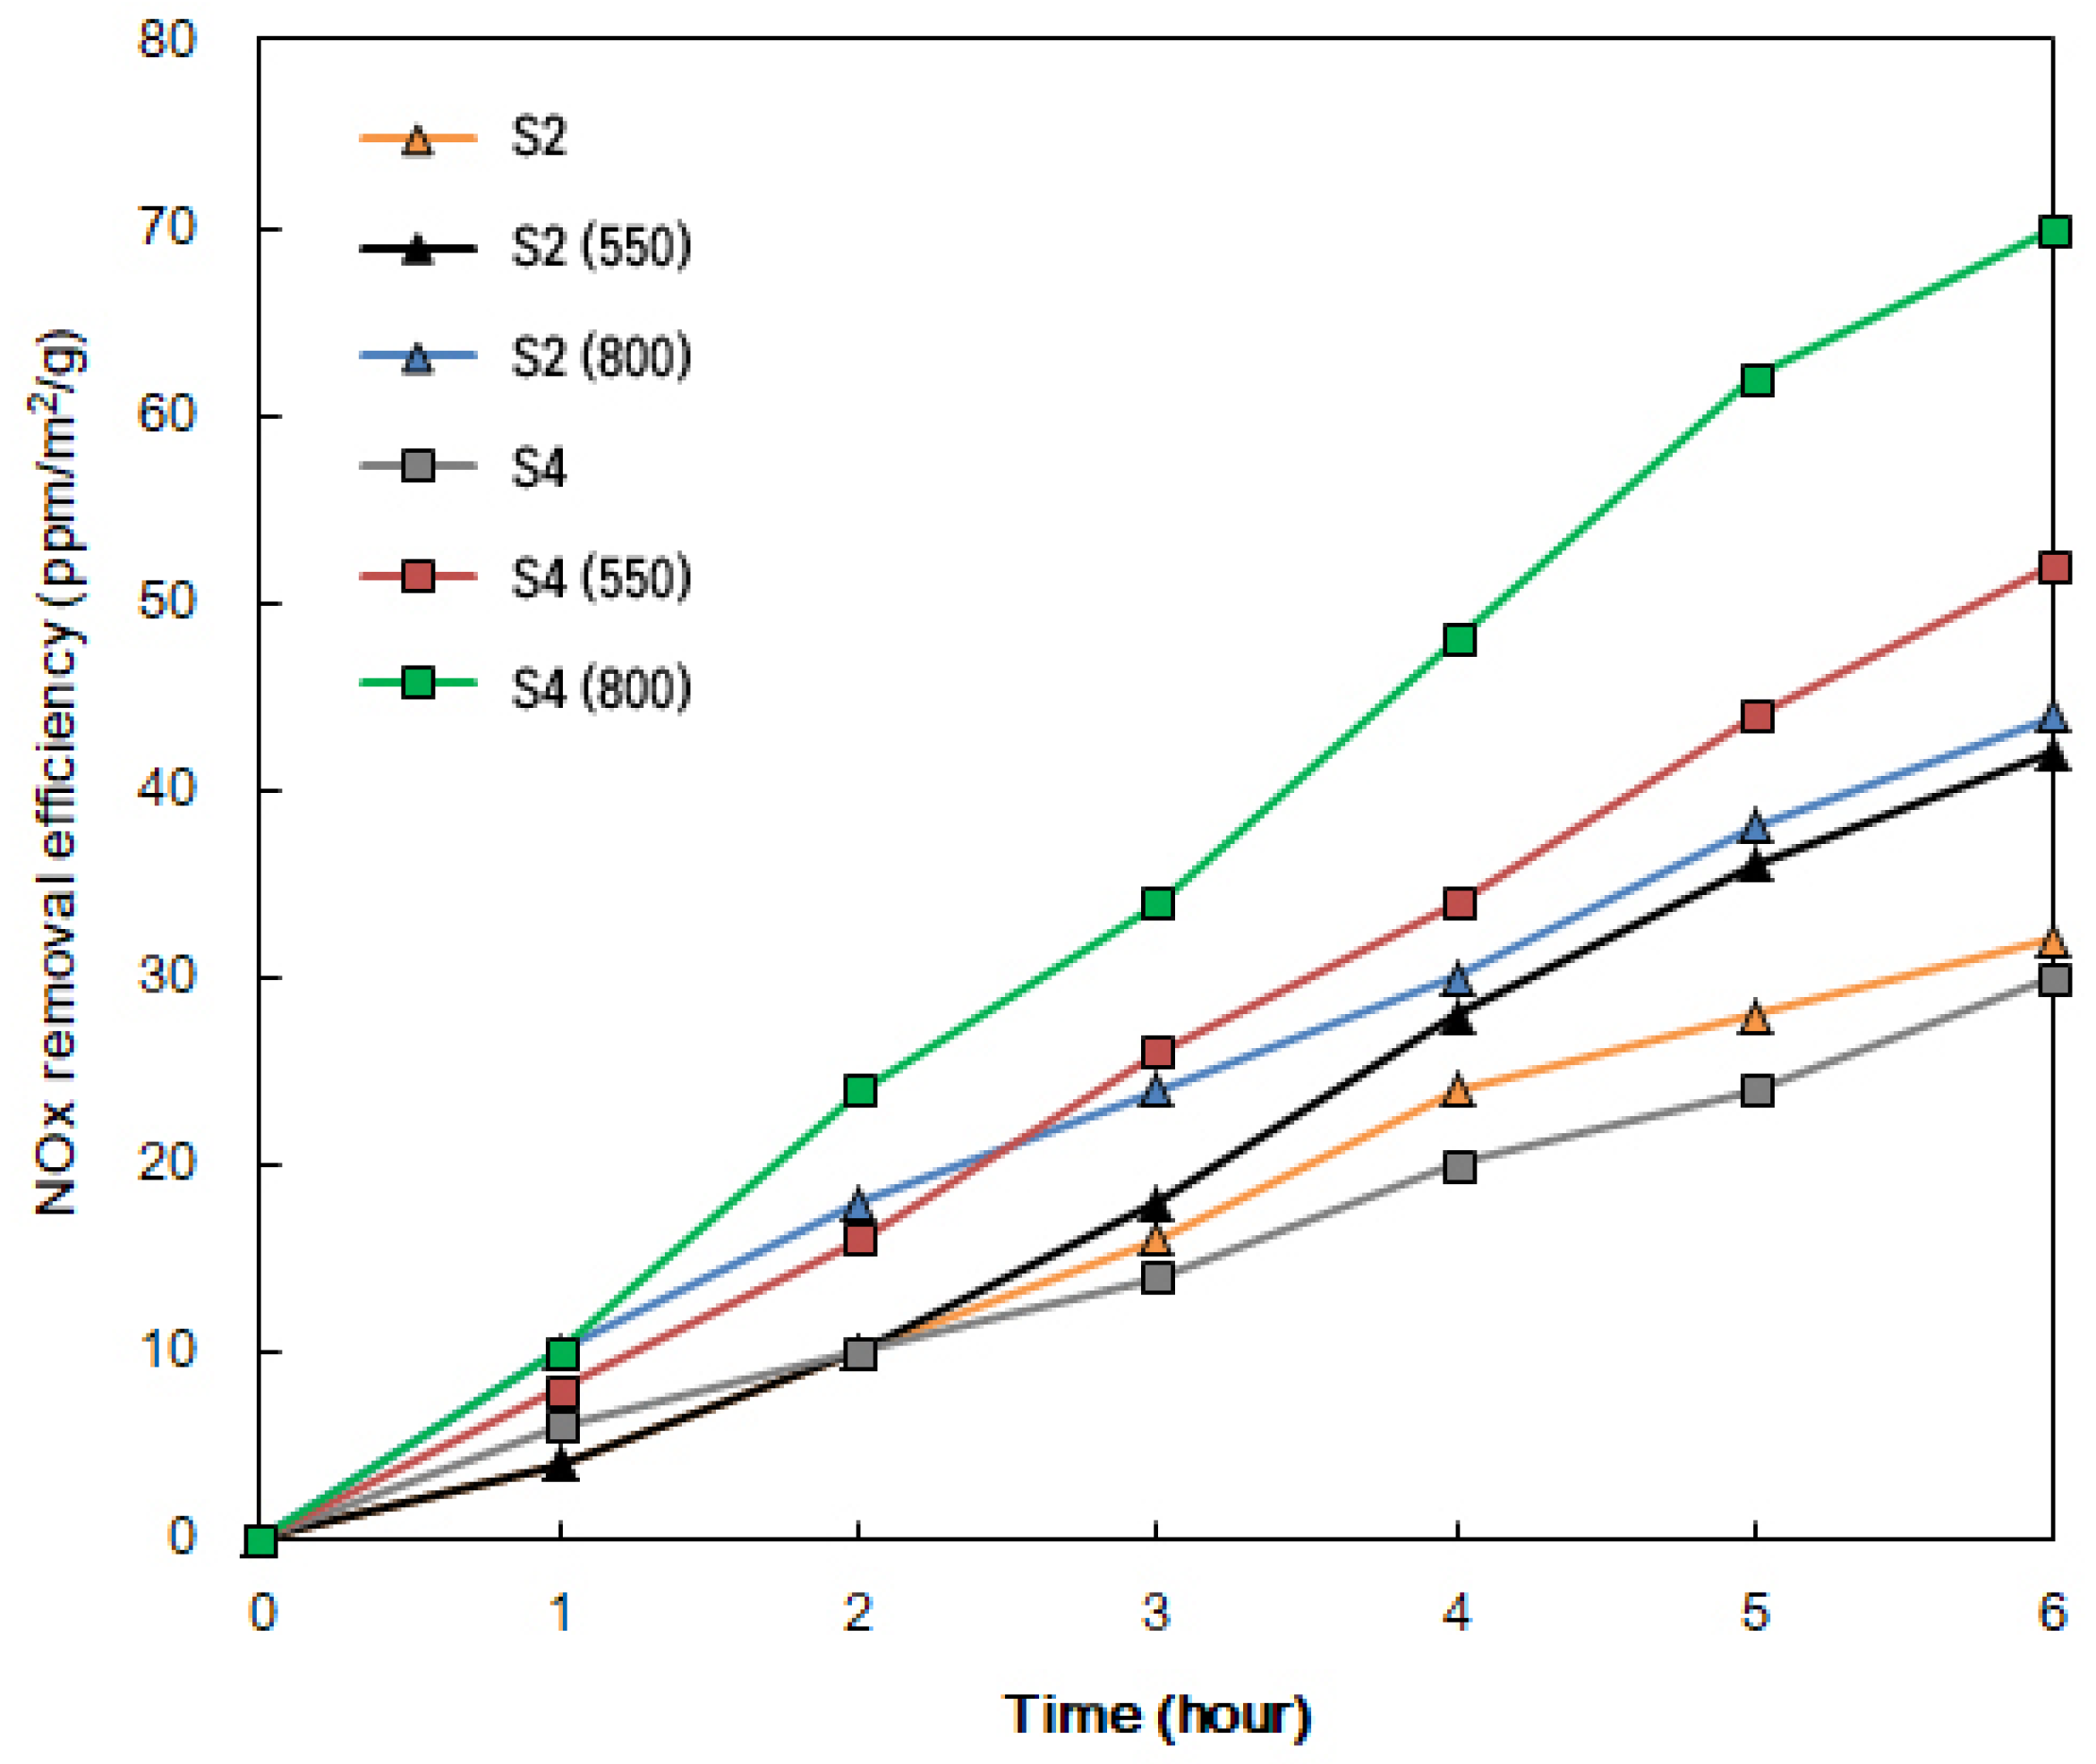
2.3. Photodegradation of NOX under Visible Light
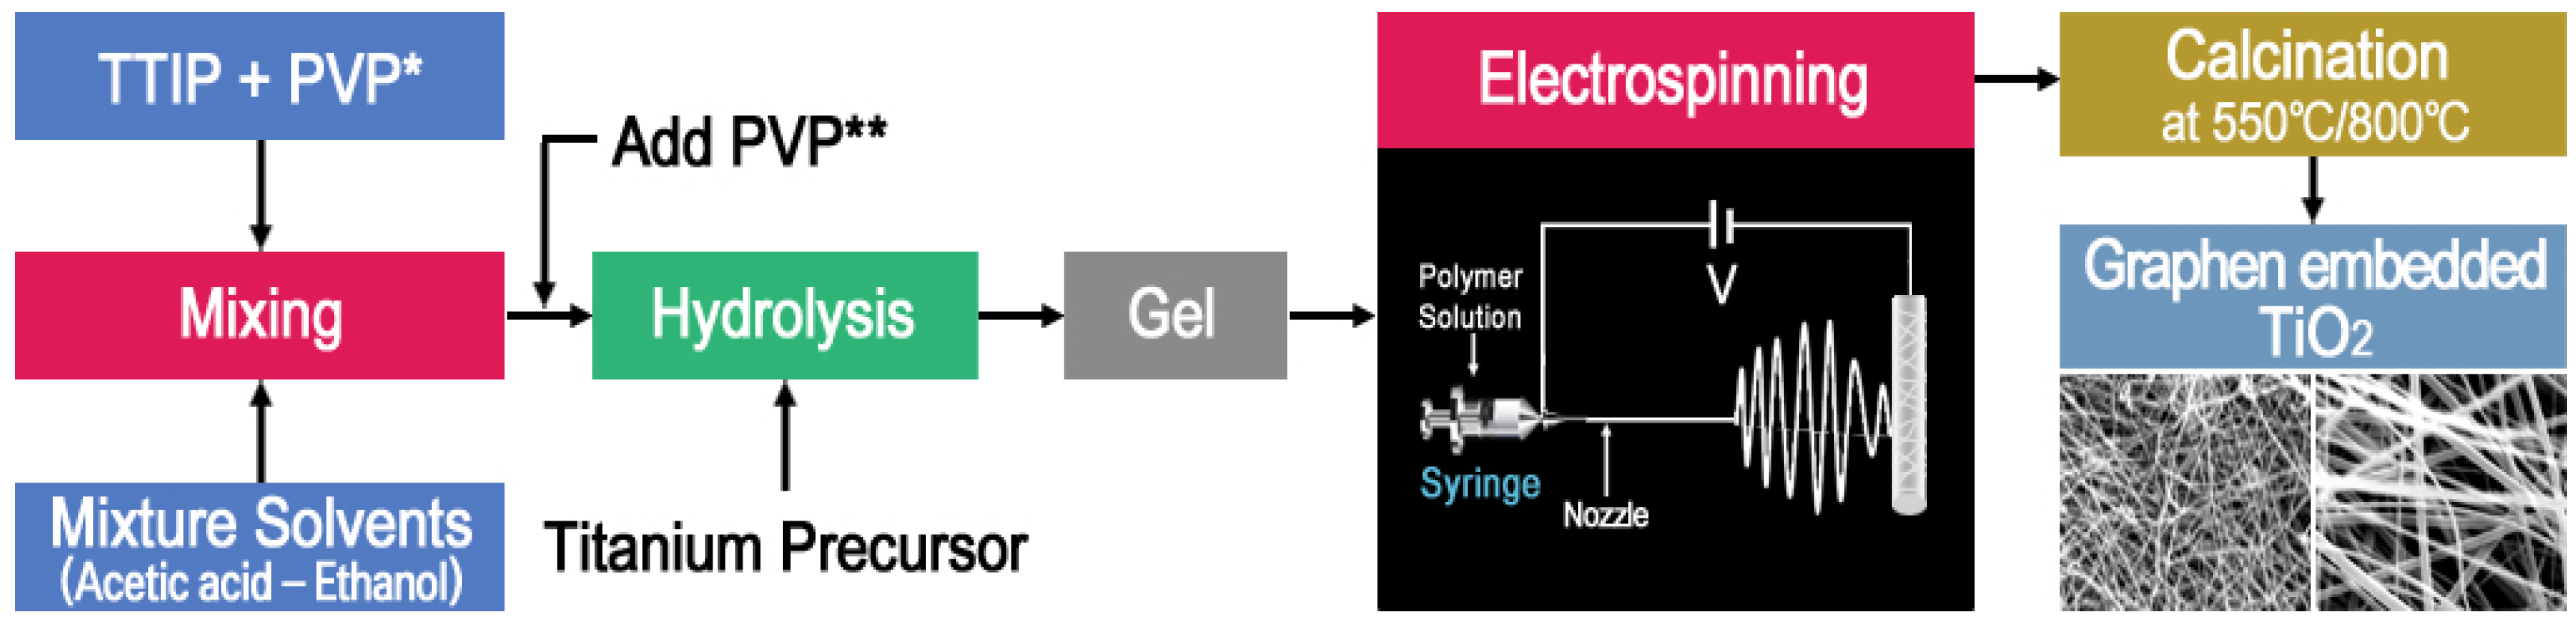
To compare the photodegradation of NOx between the samples (S2, S4, S2 (550), S2 (800), S4 (550) and S4 (800), the NOx removal measurements were monitored under visible light irradiation, and the results are shown in Figure 11. The NOx removal efficiency is normalized in terms of area of light exposure and amount of photocatalyst used. Continuous lowering NOx concentration was observed for uncalcined (S2, S4) and calcined S2 (550), S2 (800), S4 (550) and S4 (800) samples. In the first instance, the photocatalytic activities of the uncalcined samples (S2 and S4) were compared (Figure 9). S2 and S4 show similar NOx removal tendencies over the time. The results inform us that inclusion of G at the titanate gel forming stage did not influence the NOx removal. On comparing the photodegradation efficiency between S2 and S2 (550), it is clear that the NOx removal efficiency did not improve significantly even after the conversion of titanate to anatase TiO2 (as confirmed through XRD data (Figure 7a). The result is consistent with the assumption that anatase TiO2 cannot show visible light photo degradation of NOx because of its high optical band gap (3.40 eV). The visible light photo degradation of S4 (550) was significant compared to S2 (550). This clearly informs that inclusion of G in the anatase TiO2 NW causes increased visible light degradation. This result corroborates the lowering of TiO2 optical band gap because of the inclusion of G within the TiO2 NW. A very interesting observation was made by comparing the NOx photodegradation performances of S2 (550), S2 (800), S4 (550) and S4 (800). NOx removal efficiency of S2 (550) and S2 (800) are closer to each other. Hence, the conversion of anatase TiO2 NW to rutile TiO2 NW did not improve visible light photo degradation of NOx. However, strikingly significant photodegradation of NOx was witnessed for S4 (800). The rate of removal of NOx was much higher for S4 (800). Thus, through our results we demonstrated that rTiO2 (G)NW can be used for the visible light assisted removal NOx. It has been notified through several reports that photocatalytic activity of the anatase is superior compared with the rutile polymorph due to the higher electron mobility, low dielectric constant, higher Fermi level, lower ability to adsorb oxygen, and higher degree of hydroxylation of the anatase and indirect electronic transitions [9,10]. Rutile is the TiO2 polymorph that is most thermodynamically stable in a wide temperature range and at varied pressures and it is abundantly available; thus, there is need to evolve strategies to utilize a rutile polymorph for commercial and environmental applications. However, there are limited reports that focus on the photocatalytic activity of the rutile nanostructures.
Toma et al. [58] studied the removal of NOx using TiO2 Degussa P25 powder and reported a maximum NOx removal efficiency of 4 × 10⁻⁴ ppm/m2/mg. The modified TiO2 samples prepared in the present study (S2, S4, S2 (550), S2 (800), S4 (550), S4 (800)) showed extremely high photocatalytic NOx removal efficiencies (>5.0 ppm/m2/mg) (Figure 11) than TiO2 Degussa P25. Specifically, rTiO2(G) CNW samples (S2 (800) and S4 (800)) are highly efficient for the removal of NOx. Particularly, S4 (800) outperforms S2 (800) and other samples towards photocatalytic NOx removal. We ascribe the following reasons for the supreme performance of rTiO2(G) (800) (S4 (800)). Firstly, the TiO2 in the S4 (800) is nanostructured with wire like morphology (Figure 3c) and expected to possess the advantage of high surface area. Secondly, the inclusion of G within TiO2 structure (Figure 7b) modifies the optical band structure (Figure 9ii). It is to be noted that TiO2 Degussa P25 powder exhibited NOx removal only under UV light irradiation. However, S4 (800) exhibited excellent NOx removal efficiency under visible light irradiation [58]. The intentional inclusion of carbon impurities within TiO2 lattice has been reported to induce enhanced visible light photocatalytic activities [59,60]. The carbon dopant/impurity can exist as an anion by replacing the oxygen or as a cation occupying at interstitial lattice sites.
In the present work, the as-prepared rTiO2(G) CNW has three modifications in TiO2; (i) morphology (nanostructured as NW), (Figure 3) (ii) phase transformations (anatase to rutile) (Figure 7) and (iii) inclusion of foreign atom (inclusion of carbon) (Figure 5, Figure 7 and Figure 8). All the three modifications synergistically make rTiO2(G) CNW (S4 (800)) as the visible light active and efficient photocatalyst. While the nanostructuring provides large surface area, the other two modifications (anatase-rutile phase transformation and carbon inclusion) contribute to the alteration of optical bad gap (Figure 9) leading to extended visible light absorption [61]. The G inclusion extends the visible light absorption and improves the photocatalytic properties through the role of electron mediator/sink. A plausible mechanism is also suggested for the photocatalysis of rTiO2 (G) CNW based on the above considerations and experimental observations (Scheme 2). The bulk anatase and rutile materials could show UV light induced photocatalytic activities because of the wide band gaps (~3.20 eV for anatase and ~3.0 eV for rutile). On the other hand, the carbon inclusion in rTiO2(G) CNW generated mid gap energy states in between conduction and valence bands (Scheme 2) causing lower band gaps (~2.60 eV) (Figure 9). Besides, the included carbon framework extends the visible light absorption (Figure 9) and suppresses the hole-electron pair charge recombination. The excited electrons were effectively transferred for photochemical processes by the carbon mediation, which in turn increases the lifetime of hole-electron pairs and photocatalytic activities.
Until now, several fundamental studies on synthesis, modification and applications have been reported on 1D TiO2 nanostructured materials [52,53,54]. However, our present study is the first kind to demonstrate the visible light photoactivity of G composited rTiO2 nanostructures. We attribute the following reason for the visible light activity of rTiO2 (G)NW. The possible creation of oxygen vacancy in the TiO2 lattice lowers the band gap [62]. In the present case, the chemical interaction of carboxylated G precursor during the in-situ growth of TiO2 from titanium alkoxides can generate a loosely packed polymeric Ti−O−Ti-C- skeleton. Such Ti−O−Ti-C- skeleton formation makes the disturbed crystal growth can result in depletion of lattice oxygen. Therefore, the presence of G in the rTiO2(G) NW can possibly induce crystal disorder, and to create oxygen vacancies, resulting in the remarkably enhanced visible light activity. Extensive studies are underway to gain deeper insight on the mechanism of photodegradation and visible light augmentation for TiO2 based nanostructures.

3. Experimental

3.1. Materials and Methods

Acetone (94.0%) and ethanol (99.5%) were purchased from OCI, Korea. Titanium isopropoxide (97%), polyvinylpyrrolidone (molecular weight: 40,000 and 1.30 × 10⁶) and graphene oxide (15–20 sheets, 40–10% edge oxidized) were obtained from Sigma Aldrich, Korea and used as received.

3.2. Characterization

The morphology of the samples was examined by field-emission scanning electron microscopy (FE-SEM, SU8200, Hitachi, Japan) and field-emission transmission electron microscopy (FE-TEM, Titan G2 ChemiSTEM Cs Probe, FEI Company). The crystal phases of the samples were examined by X-ray diffraction analyzer (D/Max-2500, Rigaku, Japan). The scanning angle 2θ was varied from 5° to 70° with a step size of 0.02 and a dwell time of 1.5 sec. The working voltage, applied electric current and Cu Kα radiation were 40 kV, 200 mA and 1.5406 Å, respectively. The band gaps of the samples were determined using adsorption data of thin films recorded by UV-Vis-NIR diffuse reflectance spectroscopy (Cary 5000, Agilent, Santa Clara, CA, USA) in the wavelength region 200 to 700nm. Raman spectra of samples were obtained in the range 100 to 2700 cm−1 using a Raman spectrometer (inVia reflex, Reinshaw, Wotton-under-Edge, Glos, England), equipped with a 536 nm laser. Photoluminescence (PL) spectra of samples were obtained using a photoluminescence Spectrophotometer (Spectra Pro 2150i, Acton Research, Lakewood Ranch, FL, USA) under an excitation line of 280 nm.

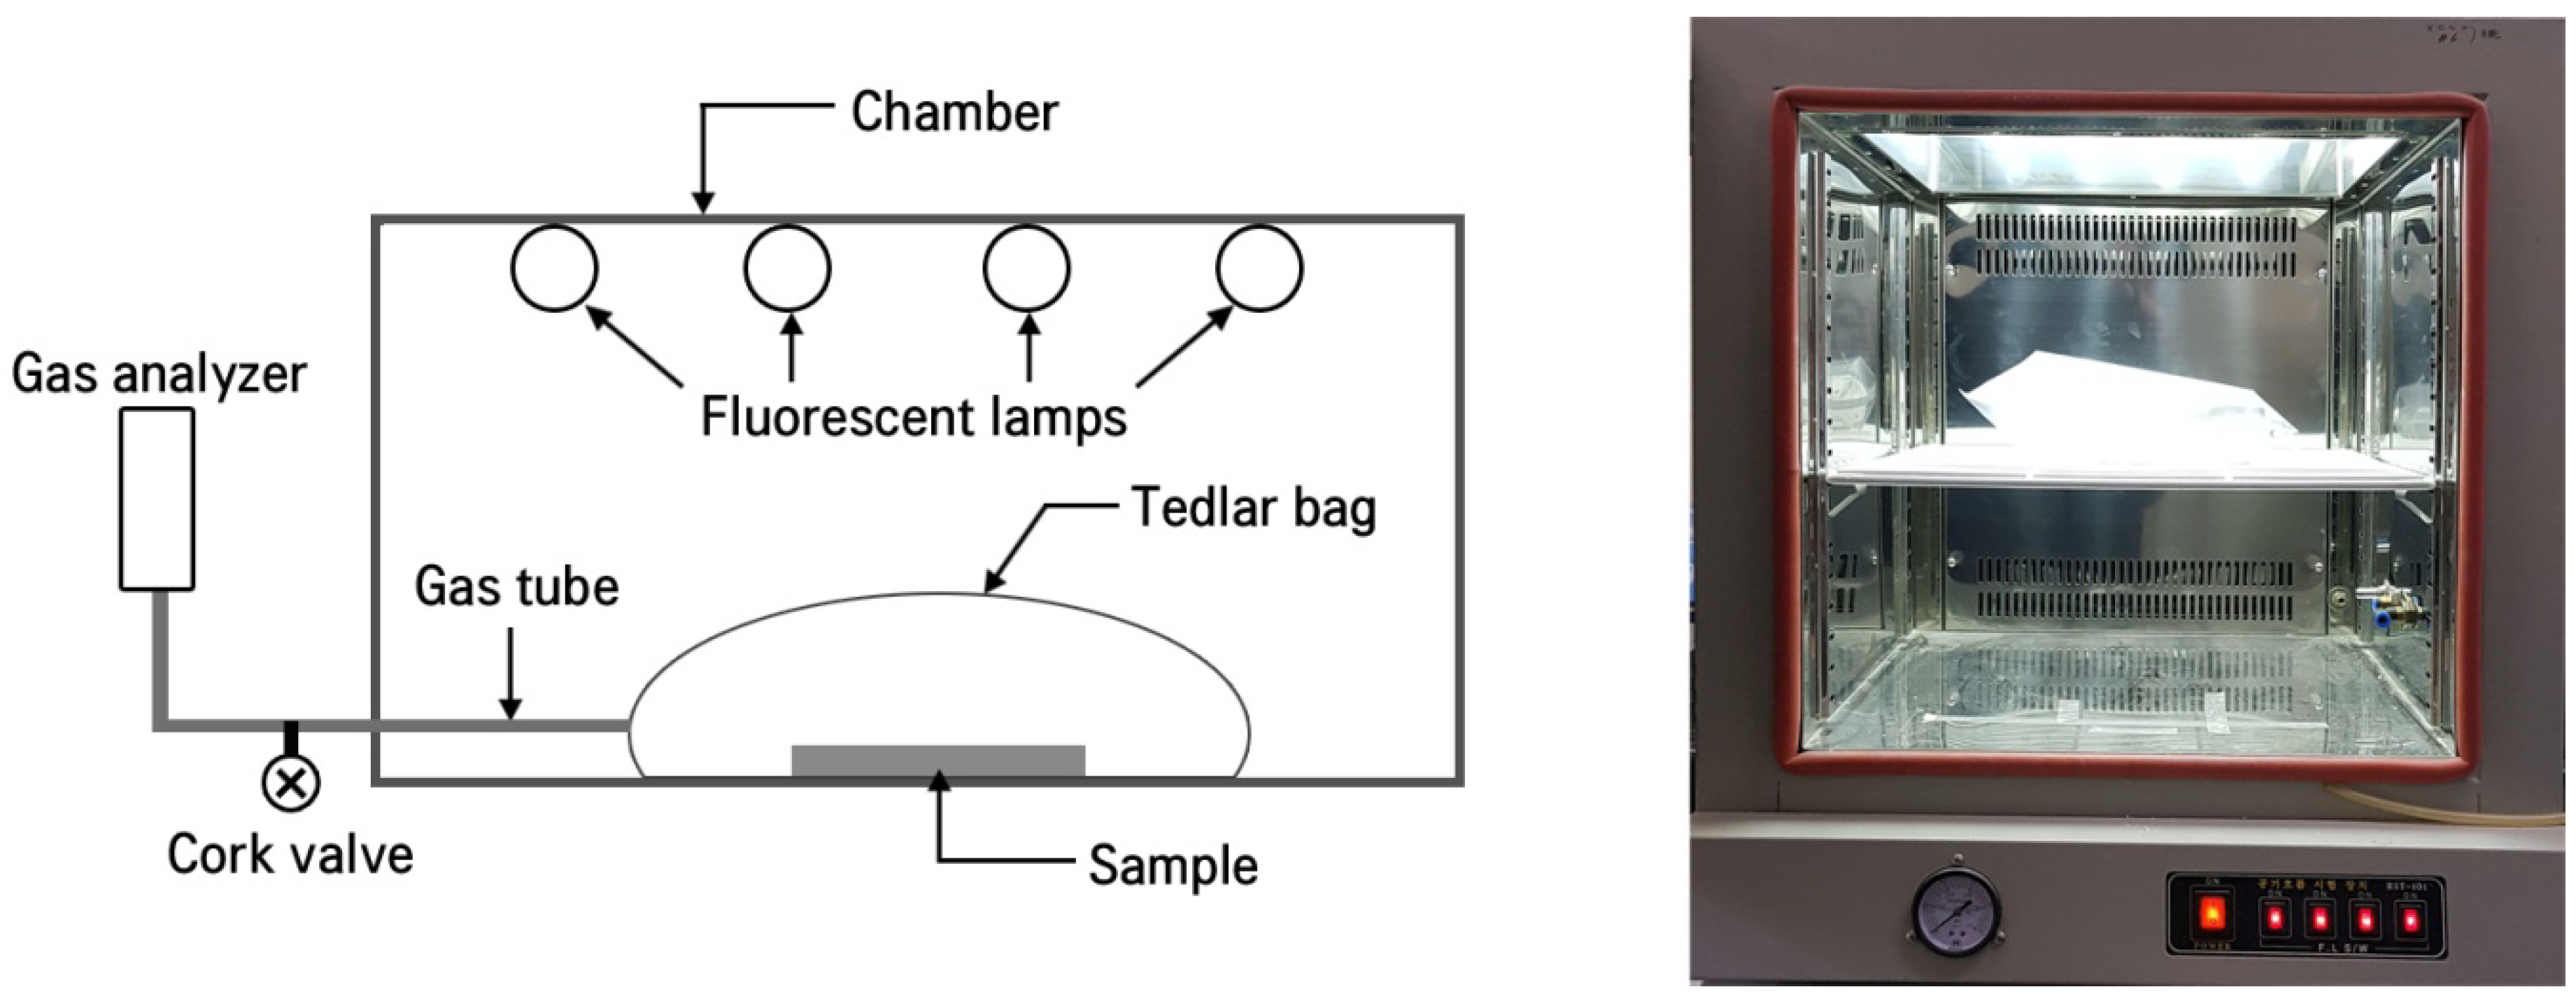
3.3. Visible LightPphotodegradation of NOx

The experiment for the photodegradation of NOx was carried out by the gas-bag A method (standardized by the Korea Photocatalyst Association). The experimental is schematically presented along with the practical set up (Scheme 3). Distilled water was added to 0.5 g of the prepared photocatalyst to sufficiently disperse the photocatalyst. The photocatalyst was coated on a 10 cm × 10 cm glass plate and dried at 100 °C for 1 hour. Then, the photocatalyst coated glass plate was placed in a Tedlar bag having 3L volume. The standard nitrogen oxide gas was diluted with ordinary air to make 3L at a concentration of 1 vol ppm and the diluted nitrogen oxide gas was injected into the Tedlar bag. The Tedlar bag with the sample and the gas was placed in a stainless steel box. The sample was irradiated using the fluorescent lamp (Kumho Electric INC, three wavelength day light color, 17W) placed 30cm above the sample. The illuminance of the fluorescent lamp was 3,450 lm/m2 on the sample surface. The concentration of NOx was monitored with a NOX analyzer (GV-100s, Gastec) every hour over a period of 6 hours.

4. Conclusions

In conclusion, the graphene (G) included rutile TiO2 nanowires (rTiO2 NW) of uniform diameters were fabricated by electrospinning of a polymeric solution prepared with low and high molecular weights and subsequent calcination at 800 °C. The pure rutile phase transformation occurred and the inclusion of G into rTiO2 NW resulted in lattice strain and optical band gap narrowing. We attribute that the inclusion of G in titanate network and subsequent high temperature calcination (800 °C) resulted in the production of new energy states and narrowing the band gap. G with its electron accepting capability can suppress the recombination effectively. As a consequence, the visible light absorption and photoactivity greatly enhanced. Thus, our results provide a new insight into the improvement of photoactivity of rutile TiO2. We believe that our study would provide the basis for developing promising visible light photocatalysts based on rutile TiO2 and to explore the utility of commercially available and cheaper rutile TiO2 for prospective applications.

Author Contributions

J.-C.L.—Conceptualization, experimentation, writing: A.-I.G.—Conceptualization, methodology evolution, data interpretation and writing; G.S.-A.—data interpretation, writing; K.-P.L.—Materials management, supervision; W.-J.K.—Supervision, logical interpretation, visualization and constructive suggestions.

Funding

This work was supported by the National Research Foundation of Korea (NRF) grant funded by the Korea government (No. NRF-2018R1A2B2003832).

Conflicts of Interest

The authors declare no conflict of interest.

References

  1. Fujishima, A.; Honda, K. Electrochemical photolysis of water at a semiconductor electrode. Nature 1972, 238, 37. [Google Scholar] [CrossRef] [PubMed]
  2. Fujishima, A.; Rao, T.N.; Tryk, D.A. Titanium dioxide photocatalysis. J. Photochem. Photobiol. C Photochem. Rev. 2000, 1, 1–21. [Google Scholar] [CrossRef]
  3. Dahl, M.; Liu, Y.; Yin, Y. Composite titanium dioxide nanomaterials. Chem. Rev. 2014, 114, 9853–9889. [Google Scholar] [CrossRef] [PubMed]
  4. Schneider, J.; Matsuoka, M.; Takeuchi, M.; Zhang, J.; Horiuchi, Y.; Anpo, M.; Bahnemann, D.W. Understanding TiO2 photocatalysis: Mechanisms and materials. Chem. Rev. 2014, 114, 9919–9986. [Google Scholar] [CrossRef] [PubMed]
  5. Navrotsky, A.; Jamieson, J.C.; Kleppa, O.J. Enthalpy of transformation of a high-pressure polymorph of titanium dioxide to the rutile modification. Science 1967, 158, 388–389. [Google Scholar] [CrossRef] [PubMed]
  6. Choi, M.; Lim, J.; Baek, M.; Choi, W.; Kim, W.; Yong, K. Investigating the unrevealed photocatalytic activity and stability of nanostructured brookite TiO2 film as an environmental photocatalyst. ACS Appl. Mater. Interfaces 2017, 9, 16252–16260. [Google Scholar] [CrossRef] [PubMed]
  7. Li, J.-G.; Ishigaki, T.; Sun, X. Anatase, brookite, and rutile nanocrystals via redox reactions under mild hydrothermal conditions: Phase-selective synthesis and physicochemical properties. J. Phys. Chem. C 2007, 111, 4969–4976. [Google Scholar] [CrossRef]
  8. Luévano-Hipólito, E.; Martínez-de la Cruz, A. Enhanced Photocatalytic Activity of TiO2 Rutile by Coupling with Fly Ashes for the Removal of NO Gases. Ind. Eng. Chem. Res. 2016, 55, 11512–11519. [Google Scholar] [CrossRef]
  9. Coronado, J.M.; Fresno, F.; Hernández-Alonso, M.D.; Portela, R. Design of Advanced Photocatalytic Materials for Energy and Environmental Applications; Springer: Berlin/Heidelberg, Germany, 2013. [Google Scholar]
  10. Luttrell, T.; Halpegamage, S.; Tao, J.; Kramer, A.; Sutter, E.; Batzill, M. Why is anatase a better photocatalyst than rutile?—Model studies on epitaxial TiO2 films. Sci. Rep. 2014, 4, 4043. [Google Scholar] [CrossRef]
  11. Ozawa, K.; Yamamoto, S.; Yukawa, R.; Liu, R.-Y.; Terashima, N.; Natsui, Y.; Kato, H.; Mase, K.; Matsuda, I. Correlation between Photocatalytic Activity and Carrier Lifetime: Acetic Acid on Single-Crystal Surfaces of Anatase and Rutile TiO2. J. Phys. Chem. C 2018, 122, 9562–9569. [Google Scholar] [CrossRef]
  12. Pourjafari, D.; Reyes-Coronado, D.; Vega-Poot, A.; Escalante, R.; Kirkconnell-Reyes, D.; García-Rodríguez, R.; Anta, J.A.; Oskam, G. Brookite-Based Dye-Sensitized Solar Cells: Influence of Morphology and Surface Chemistry on Cell Performance. J. Phys. Chem. C 2018, 122, 14277–14288. [Google Scholar] [CrossRef]
  13. Maruska, H.P.; Ghosh, A.K. Photocatalytic decomposition of water at semiconductor electrodes. Solar Energy 1978, 20, 443–458. [Google Scholar] [CrossRef]
  14. Scanlon, D.O.; Dunnill, C.W.; Buckeridge, J.; Shevlin, S.A.; Logsdail, A.J.; Woodley, S.M.; Catlow, C.R.A.; Powell, M.J.; Palgrave, R.G.; Parkin, I.P. Band alignment of rutile and anatase TiO2. Nat. Mater. 2013, 12, 798. [Google Scholar] [CrossRef] [PubMed]
  15. Zhang, Q.; Gao, L.; Guo, J. Effects of calcination on the photocatalytic properties of nanosized TiO2 powders prepared by TiCl4 hydrolysis. Appl. Catal. B Environ. 2000, 26, 207–215. [Google Scholar] [CrossRef]
  16. Fox, M.A.; Dulay, M.T. Heterogeneous photocatalysis. Chem. Rev. 1993, 93, 341–357. [Google Scholar] [CrossRef]
  17. Xu, M.; Gao, Y.; Moreno, E.M.; Kunst, M.; Muhler, M.; Wang, Y.; Idriss, H.; Wöll, C. Photocatalytic activity of bulk TiO2 anatase and rutile single crystals using infrared absorption spectroscopy. Phys. Rev. Lett. 2011, 106, 138302. [Google Scholar] [CrossRef] [PubMed]
  18. Kalaivani, G.J.; Suja, S. TiO2 (rutile) embedded inulin—A versatile bio-nanocomposite for photocatalytic degradation of methylene blue. Carbohydr. Polym. 2016, 143, 51–60. [Google Scholar] [CrossRef]
  19. Nair, R.V.; Jijith, M.; Gummaluri, V.S.; Vijayan, C. A novel and efficient surfactant-free synthesis of Rutile TiO2 microflowers with enhanced photocatalytic activity. Opt. Mater. 2016, 55, 38–43. [Google Scholar] [CrossRef]
  20. Truong, Q.D.; Kato, H.; Kobayashi, M.; Kakihana, M. Hierarchical structures of rutile exposing high-index facets. J. Cryst. Growth 2015, 418, 86–91. [Google Scholar] [CrossRef]
  21. Zhang, J.; Liu, P.; Lu, Z.; Xu, G.; Wang, X.; Qian, L.; Wang, H.; Zhang, E.; Xi, J.; Ji, Z. One-step synthesis of rutile nano-TiO2 with exposed {1 1 1} facets for high photocatalytic activity. J. Alloys Compd. 2015, 632, 133–139. [Google Scholar] [CrossRef]
  22. Maeda, K. Direct splitting of pure water into hydrogen and oxygen using rutile titania powder as a photocatalyst. Chem. Commun. 2013, 49, 8404–8406. [Google Scholar]
  23. Maeda, K. Photocatalytic properties of rutile TiO2 powder for overall water splitting. Catal. Sci. Technol. 2014, 4, 1949–1953. [Google Scholar] [CrossRef]
  24. Murakami, N.; Ono, A.; Nakamura, M.; Tsubota, T.; Ohno, T. Development of a visible-light-responsive rutile rod by site-selective modification of iron (III) ion on {1 1 1} exposed crystal faces. Appl. Catal. B Environ. 2010, 97, 115–119. [Google Scholar] [CrossRef]
  25. Sosnowchik, B.D.; Chiamori, H.C.; Ding, Y.; Ha, J.-Y.; Wang, Z.L.; Lin, L. Titanium dioxide nanoswords with highly reactive, photocatalytic facets. Nanotechnology 2010, 21, 485601. [Google Scholar] [CrossRef] [PubMed]
  26. Maeda, K.; Murakami, N.; Ohno, T. Dependence of activity of rutile titanium (IV) oxide powder for photocatalytic overall water splitting on structural properties. J. Phys. Chem. C 2014, 118, 9093–9100. [Google Scholar] [CrossRef]
  27. Ansari, M.O.; Khan, M.M.; Ansari, S.A.; Cho, M.H. Electrically conductive polyaniline sensitized defective-TiO2 for improved visible light photocatalytic and photoelectrochemical performance: A synergistic effect. New J. Chem. 2015, 39, 8381–8388. [Google Scholar] [CrossRef]
  28. Subramanian, V.; Wolf, E.E.; Kamat, P.V. Catalysis with TiO2/gold nanocomposites. Effect of metal particle size on the Fermi level equilibration. J. Am. Chem. Soc. 2004, 126, 4943–4950. [Google Scholar] [CrossRef]
  29. Zhang, H.; Lv, X.; Li, Y.; Wang, Y.; Li, J. P25-graphene composite as a high performance photocatalyst. ACS Nano 2009, 4, 380–386. [Google Scholar] [CrossRef]
  30. Sun, L.; Zhao, Z.; Zhou, Y.; Liu, L. Anatase TiO2 nanocrystals with exposed {001} facets on graphene sheets via molecular grafting for enhanced photocatalytic activity. Nanoscale 2012, 4, 613–620. [Google Scholar] [CrossRef]
  31. Long, R.; Casanova, D.; Fang, W.-H.; Prezhdo, O.V. Donor–acceptor interaction determines the mechanism of photoinduced electron injection from graphene quantum dots into TiO2: π-stacking supersedes covalent bonding. J. Am. Chem. Soc. 2017, 139, 2619–2629. [Google Scholar] [CrossRef]
  32. Zhang, Y.; Pan, C. TiO2/graphene composite from thermal reaction of graphene oxide and its photocatalytic activity in visible light. J. Mater. Sci. 2011, 46, 2622–2626. [Google Scholar] [CrossRef]
  33. Yurdakal, S.; Palmisano, G.; Loddo, V.; Augugliaro, V.; Palmisano, L. Nanostructured rutile TiO2 for selective photocatalytic oxidation of aromatic alcohols to aldehydes in water. J. Am. Chem. Soc. 2008, 130, 1568–1569. [Google Scholar] [CrossRef] [PubMed]
  34. Atitar, M.F.; Ismail, A.A.; Al-Sayari, S.; Bahnemann, D.; Afanasev, D.; Emeline, A. Mesoporous TiO2 nanocrystals as efficient photocatalysts: Impact of calcination temperature and phase transformation on photocatalytic performance. Chem. Eng. J. 2015, 264, 417–424. [Google Scholar] [CrossRef]
  35. Chen, Y.-F.; Lee, C.-Y.; Yeng, M.-Y.; Chiu, H.-T. The effect of calcination temperature on the crystallinity of TiO2 nanopowders. J. Cryst. Growth 2003, 247, 363–370. [Google Scholar] [CrossRef]
  36. Seo, H.-K.; Kim, G.-S.; Ansari, S.; Kim, Y.-S.; Shin, H.-S.; Shim, K.-H.; Suh, E.-K. A study on the structure/phase transformation of titanate nanotubes synthesized at various hydrothermal temperatures. Solar Energy Mater. Solar Cells 2008, 92, 1533–1539. [Google Scholar] [CrossRef]
  37. Biedermann, L.B.; Bolen, M.L.; Capano, M.A.; Zemlyanov, D.; Reifenberger, R.G. Insights into few-layer epitaxial graphene growth on 4 H-SiC (000 1¯) substrates from STM studies. Phys. Rev. B 2009, 79, 125411. [Google Scholar] [CrossRef]
  38. Hu, Y.; Li, C.; Gu, F.; Zhao, Y. Facile flame synthesis and photoluminescent properties of core/shell TiO2/SiO2 nanoparticles. J. Alloys Compd. 2007, 432, L5–L9. [Google Scholar] [CrossRef]
  39. Xu, L.; Garrett, M.P.; Hu, B. Doping effects on internally coupled seebeck coefficient, electrical, and thermal conductivities in aluminum-doped TiO2. J. Phys. Chem. C 2012, 116, 13020–13025. [Google Scholar] [CrossRef]
  40. Xu, Y.-J.; Zhuang, Y.; Fu, X. New insight for enhanced photocatalytic activity of TiO2 by doping carbon nanotubes: A case study on degradation of benzene and methyl orange. J. Phys. Chem. C 2010, 114, 2669–2676. [Google Scholar] [CrossRef]
  41. Anantha-Iyengar, G.; Shanmugasundaram, K.; Nallal, M.; Lee, K.-P.; Whitcombe, M.J.; Lakshmi, D.; Sai-Anand, G. Functionalized conjugated polymers for sensing and molecular imprinting applications. Prog. Polym. Sci. 2019, 88, 1–129. [Google Scholar] [CrossRef]
  42. Muthuchamy, N.; Gopalan, A.; Lee, K.-P. Highly selective non-enzymatic electrochemical sensor based on a titanium dioxide nanowire–poly(3-aminophenyl boronic acid)–gold nanoparticle ternary nanocomposite. RSC Adv. 2018, 8, 2138–2147. [Google Scholar] [CrossRef]
  43. Nallal, M.; Anantha Iyengar, G.; Pill-Lee, K. New Titanium Dioxide-Based Heterojunction Nanohybrid for Highly Selective Photoelectrochemical–Electrochemical Dual-Mode Sensors. ACS Appl. Mater. Interfaces 2017, 9, 37166–37183. [Google Scholar] [CrossRef]
  44. Shanmugasundaram, K.; Sai-Anand, G.; Gopalan, A.-I.; Lee, H.-G.; Yeo, H.K.; Kang, S.-W.; Lee, K.-P. Direct electrochemistry of cytochrome c with three-dimensional nanoarchitectured multicomponent composite electrode and nitrite biosensing. Sens. Actuators B Chem. 2016, 228, 737–747. [Google Scholar] [CrossRef]
  45. Lee, K.-P.; Gopalan, A.-I.; Lee, C.-J.; Jeon, K.-Y.; Kim, W.-J. Characterization and Photocatalytic Activity of Heat Treated Zinc Doped Titanium Dioxide. Adv. Porous Mater. 2013, 1, 279–285. [Google Scholar] [CrossRef]
  46. Lee, H.-G.; Gopalan, A.-I.; Sai-Anand, G.; Lee, B.-C.; Kang, S.-W.; Lee, K.-P. Facile synthesis of functionalized graphene-palladium nanoparticle incorporated multicomponent TiO2 composite nanofibers. Mater. Chem. Phys. 2015, 154, 125–136. [Google Scholar] [CrossRef]
  47. Lee, H.-G.; Gopalan, A.-I.; Sai-Anand, G.; Kang, S.-W.; Lee, K.-P. New Heterojunction Titanium Dioxide Nanowire as Photocatalyst. J. Nanosci. Nanotechnol. 2015, 15, 7421–7425. [Google Scholar] [CrossRef] [PubMed]
  48. Santara, B.; Giri, P.; Imakita, K.; Fujii, M. Microscopic origin of lattice contraction and expansion in undoped rutile TiO2 nanostructures. J. Phys. D Appl. Phys. 2014, 47, 215302. [Google Scholar] [CrossRef]
  49. Murphy, A. Band-gap determination from diffuse reflectance measurements of semiconductor films, and application to photoelectrochemical water-splitting. Solar Energy Mater. Solar Cells 2007, 91, 1326–1337. [Google Scholar] [CrossRef]
  50. Pei, Z.; Ding, L.; Lin, H.; Weng, S.; Zheng, Z.; Hou, Y.; Liu, P. Facile synthesis of defect-mediated TiO2−x with enhanced visible light photocatalytic activity. J. Mater. Chem. A 2013, 1, 10099–10102. [Google Scholar] [CrossRef]
  51. Naldoni, A.; Allieta, M.; Santangelo, S.; Marelli, M.; Fabbri, F.; Cappelli, S.; Bianchi, C.L.; Psaro, R.; Dal Santo, V. Effect of nature and location of defects on bandgap narrowing in black TiO2 nanoparticles. J. Am. Chem. Soc. 2012, 134, 7600–7603. [Google Scholar] [CrossRef]
  52. Ge, M.; Cao, C.; Huang, J.; Li, S.; Chen, Z.; Zhang, K.-Q.; Al-Deyab, S.; Lai, Y. A review of one-dimensional TiO2 nanostructured materials for environmental and energy applications. J. Mater. Chem. A 2016, 4, 6772–6801. [Google Scholar] [CrossRef]
  53. Nunes, D.; Pimentel, A.; Santos, L.; Barquinha, P.; Fortunato, E.; Martins, R. Photocatalytic TiO2 nanorod spheres and arrays compatible with flexible applications. Catalysts 2017, 7, 60. [Google Scholar] [CrossRef]
  54. Truppi, A.; Petronella, F.; Placido, T.; Striccoli, M.; Agostiano, A.; Curri, M.L.; Comparelli, R. Visible-light-active TiO2-based hybrid nanocatalysts for environmental applications. Catalysts 2017, 7, 100. [Google Scholar] [CrossRef]
  55. Xiang, Q.; Yu, J.; Jaroniec, M. Enhanced photocatalytic H2-production activity of graphene-modified titania nanosheets. Nanoscale 2011, 3, 3670–3678. [Google Scholar] [CrossRef] [PubMed]
  56. Eder, D.; Motta, M.S.; Windle, A.H. Nanoengineering with residual catalyst from CNT templates. Acta Mater. 2010, 58, 4406–4413. [Google Scholar] [CrossRef]
  57. Naumenko, D.; Snitka, V.; Snopok, B.; Arpiainen, S.; Lipsanen, H. Graphene-enhanced Raman imaging of TiO2 nanoparticles. Nanotechnology 2012, 23, 465703. [Google Scholar] [CrossRef] [PubMed]
  58. Toma, F.; Bertrand, G.; Klein, D.; Coddet, C. Photocatalytic removal of nitrogen oxides via titanium dioxide. Environ. Chem. Lett. 2004, 2, 117–121. [Google Scholar] [CrossRef]
  59. Khan, S.U.; Al-Shahry, M.; Ingler, W.B. Efficient photochemical water splitting by a chemically modified n-TiO2. Science 2002, 297, 2243–2245. [Google Scholar] [CrossRef]
  60. Ren, W.; Ai, Z.; Jia, F.; Zhang, L.; Fan, X.; Zou, Z. Low temperature preparation and visible light photocatalytic activity of mesoporous carbon-doped crystalline TiO2. Appl. Catal. B Environ. 2007, 69, 138–144. [Google Scholar] [CrossRef]
  61. Di Valentin, C.; Pacchioni, G.; Selloni, A. Theory of carbon doping of titanium dioxide. Chem. Mater. 2005, 17, 6656–6665. [Google Scholar] [CrossRef]
  62. Long, M.; Qin, Y.; Chen, C.; Guo, X.; Tan, B.; Cai, W. Origin of visible light photoactivity of reduced graphene oxide/TiO2 by in situ hydrothermal growth of undergrown TiO2 with graphene oxide. J. Phys. Chem. C 2013, 117, 16734–16741. [Google Scholar] [CrossRef]
Scheme 1. Preparation of rTiO2(G)-CNW through electrospinning-calcination processes.
Catalysts 09 00170 sch001
Figure 1. FESEM images of electrospun samples; (a) S1, (b) S2, (c) S3, (d) S4, (e) S5, (f) S6.
Catalysts 09 00170 g001
Figure 2. FESEM images of calcined samples; (a) S1 (550), (b) S2 (550), (c) S4 (550) and (d) S5 (550).
Catalysts 09 00170 g002
Figure 3. FESEM images of calcined samples; (a) S1 (800), (b) S2 (800), (c) S4 (800) and (d) S5 (800).
Catalysts 09 00170 g003
Figure 4. Typical high resolution TEM (HRTEM) images of the S4 (550) (a,e) and elemental mapping patterns of titanium (b,f), carbon (c,g) and oxygen (d,h).
Catalysts 09 00170 g004
Figure 5. Typical HRTEM images of the S4 (800) (a,e) and elemental mapping patterns of titanium (b,f), carbon (c,g) and oxygen (d,h).
Catalysts 09 00170 g005
Figure 6. HRTEM images showing the lattice fringes of anatase, rutile and graphene components in S4 (550) (a) and S4 (800) (b).
Catalysts 09 00170 g006
Figure 7. X-ray diffraction patterns of the samples calcined at different temperatures; (a) S1 (500), S2 (500), S4 (500) and S5 (500) and (b) S1 (800), S2 (800), S4 (800) and S5 (800).
Catalysts 09 00170 g007
Figure 8. Raman spectrum of S2, S4, S2 (800) and S4 (800).
Catalysts 09 00170 g008
Figure 9. (i) UV-visible diffuse reflectance spectrum and (ii) Kubelka–Munk plots of the calcined samples; (a) S2 (550) (b) S2 (800) (c) S4 (550) and (d) S4 (800).
Catalysts 09 00170 g009
Figure 10. Photoluminescence spectrum of S2, S4, S2 (800) and S4 (800).
Catalysts 09 00170 g010
Figure 11. NOX removal efficiency under visible light irradiation.
Catalysts 09 00170 g011
Scheme 2. A plausible mechanism for the visible light photocatalytic activities for rTiO2(G) composite nanowire (CNW) comprising of (a) carbon inclusion in the TiO2 structure and (b) band energy modification due to carbon inclusion for the visible light photocatalytic activities for rTiO2(G) CNW.
Catalysts 09 00170 sch002
Scheme 3. Pictorial and practical photodegradation of NOx set-up.
Catalysts 09 00170 sch003
Table 1. Electrospun dope compositions and sample designations.
TIIP (g)Electrospun ProductsPVP (g)Graphene Precursor(g)Designation of Calcined Samples Based on Temperature of Calcination
DesignationMolecular Weight (40,000)Molecular Weight (1,300,000)550 °C800 °C
1.5S12.4--S1 (550)S1 (800)
S2-0.4-S2 (550)S2 (800)
S3-0.40.080S3 (550)S3 (800)
S42.40.40.080S4 (550)S4 (800)
S52.40.40.120S5 (550)S5 (880)
S62.40.40.040S6 (550)S6 (800)
Table 2. Lattice parameters, unit cell volume, average crystallite size and anatase/rutile mass fraction obtained from XRD patterns of the samples in column 1.
SampleLattice ParameterUnit Cell Volume (A3)Crystallite Size (t)(nm)Mass Fraction (%)
d-Spacinga(Å )b(Å)c(Å)Anatase XARutile XR
S1 (550)3.5153.7823.7829.499136.7820.9590.149.86
S2 (550)3.5183.7813.7819.495136.4315.6493.766.24
S4 (550)3.4883.7763.7769.486135.2520.9587.8212.18
S5 (550)3.4933.7713.7719.430134.1031.8697.722.28
S1 (800)3.2504.5944.5942.95962.45049.521.0099.0
S2 (800)3.5094.5934.5932.95762.1231.851.0199.0
S4 (800)3.5074.5934.5932.95962.4231.85Trace100
S5 (800)3.5134.5924.5922.95862.3738.64Trace100

