Article

Tuning the Catalytic Properties of Copper-Promoted Nanoceria via a Hydrothermal Method

by
Konstantinos Kappis
1,
Christos Papadopoulos
1,
Joan Papavasiliou
1,2,
John Vakros
3,
Yiannis Georgiou
4,
Yiannis Deligiannakis
4 and
George Avgouropoulos
1,*
1
Department of Materials Science, University of Patras, GR-26504 Patras, Greece
2
Foundation for Research and Technology-Hellas (FORTH), Institute of Chemical Engineering Sciences (ICE-HT), P.O. Box 1414, GR-26504 Patras, Greece
3
Department of Chemistry, University of Patras, GR-26504 Patras, Greece
4
Department of Physics, University of Ioannina, GR-45110 Ioannina, Greece
*
Author to whom correspondence should be addressed.
Catalysts 2019, 9(2), 138; https://doi.org/10.3390/catal9020138
Submission received: 8 January 2019 / Revised: 20 January 2019 / Accepted: 21 January 2019 / Published: 1 February 2019
(This article belongs to the Special Issue Emissions Control Catalysis)

Abstract

:
Copper-cerium mixed oxide catalysts have gained ground over the years in the field of heterogeneous catalysis and especially in CO oxidation reaction due to their remarkable performance. In this study, a series of highly active, atomically dispersed copper-ceria nanocatalysts were synthesized via appropriate tuning of a novel hydrothermal method. Various physicochemical techniques including electron paramagnetic resonance (EPR) spectroscopy, X-ray diffraction (XRD), N2 adsorption, scanning electron microscopy (SEM), Raman spectroscopy, and ultraviolet-visible diffuse reflectance spectroscopy (UV-Vis DRS) were employed in the characterization of the synthesized materials, while all the catalysts were evaluated in the CO oxidation reaction. Moreover, discussion of the employed mechanism during hydrothermal route was provided. The observed catalytic activity in CO oxidation reaction was strongly dependent on the nanostructured morphology, oxygen vacancy concentration, and nature of atomically dispersed Cu2+ clusters.

1. Introduction

Carbon monoxide (CO) is a harmful, toxic gas that is present in many industrial processes. Due to its negative impact for both humans and the environment, the catalytic oxidation of CO into CO2 has always been a research topic of great interest [1,2,3]. Moreover, the catalytic oxidation of CO is an important reaction in the technological fields of fuel cells [4,5,6], gas sensors [7], and CO2 lasers [8].
Cerium oxide or ceria (CeO2) has been thoroughly studied as a catalyst or support in CO oxidation reaction due to its defective structure enriched with oxygen vacancies and high oxygen storage capacity (OSC) resulting from the interaction between Ce3+ and Ce4+ [9,10,11,12]. In the case of ceria synthesized in a nanosized form, more remarkable functions can be obtained due to the nanosize effects. For this reason, research has focused on the understanding of the properties of nanoceria as well as improving its OSC, surface to volume ratio, and redox properties [13,14,15,16]. Computational studies have shown that the catalytic activity of nanoceria is strongly associated with the exposed surface plane. Sayle et al. [17] predicted that the (110) and (100) surfaces are catalytically more active for CO oxidation than the (111) surface, due to more oxygen vacancies located in the former. According to Conesa [18], the formation of oxygen vacancies on the (110) and (100) surfaces requires less energy than the (111) surface. It is noteworthy that the exposition of the reactive surface plane is dependent on the morphology of the material at the nanoscale. Zhou et al. [19] have shown that CeO2 nanorods, which exposed the (110) and (100) planes achieved higher catalytic activity for CO oxidation than nanoparticles exposing the (111) planes. Wu et al. [20] studied the morphology dependence of CO oxidation over ceria nanocrystals. They discovered that the activity for CO oxidation of those CeO2 nanostructures follows the order: Rods > cubes > octahedra, whereas the activity of different planes follows the order: (110) > (100) > (111). These results were also confirmed by Tana et al. [21]. In order to prepare various shapes of nanoceria, a number of methods have been applied, such as sol-gel [22], precipitation [23], hydrothermal or solvothermal methods [24,25,26,27], and electrochemical deposition [28]. Among these methods, the hydrothermal method has attracted great interest because a desired morphology can be obtained via appropriate control of the hydrothermal parameters such as reaction time, temperature, and concentration [29,30,31].
Despite the attractive physicochemical properties of ceria, poor catalytic activity of pure ceria [32] can by highly promoted via doping with a series of metal ions, in order to change its surface chemistry and promote the active oxygen content [33]. It is well known that the reduction behavior of ceria can be rapidly altered by the addition of a minimal amount of Au, Pd, and Pt precious metals and/or transition metals [34,35,36,37,38]. While the activity of the catalysts is improved by the addition of precious metals, their high cost prohibits their application. Numerous reports have indicated that the activity of ceria in oxidation reactions is enhanced by transition metals like copper. The copper–ceria system presents a cost-effective material with unique catalytic properties, comparable to noble metal catalysts, in many catalytic reactions and especially in the CO oxidation and in the preferential oxidation of CO in excess of hydrogen [39,40,41,42,43,44]. The superiority of CuCeOx catalytic system has been attributed to a synergistic effect. Reports on the mechanism of CO oxidation reaction over these catalysts have demonstrated the significance of both copper and ceria species in the adsorption of CO and CO2 production, as the former takes place in the copper-ceria interface [45]. Particularly, the main reasons that trigger the highly catalytic performance of these Cu-Ce catalysts are the large amount of well-dispersed copper species in the ceria support, the creation of oxygen vacancies due to incorporation of Cu2+ ions into the ceria structure and the presence of high concentration of active lattice oxygen [45,46,47]. Several Cu2+ entities (e.g., amorphous clusters, isolated ions, dimers, and discrete crystallites) have been detected, which can take part in the catalytic mechanism, displaying high levels of activity [5,39,48,49,50]. In order to form these entities, conventional preparation methods have been used such as the deposition of Cu2− species onto pre-synthesized ceria support or the coprecipitation of Cu and Ce precursors. The obtained materials are calcined at high temperatures, which enable the dispersion of copper species and the chemical bonding between the Cu and Ce components. For example, Harrison et al. [39] prepared CuO/CeO2 catalysts via coprecipitation and impregnation routes, and tested in CO oxidation. After thermal pretreatment of materials at 400 °C, the copper content on the surface of ceria consisted of amorphous clusters of Cu2+ ions, which presented high catalytic activity for CO oxidation. In several cases, the high temperatures required for the activation of copper component (>600 °C for 4 h) may lead to particle sintering and phase segregation, which facilitates the formation of tenorite particles of CuO, which are inactive for CO oxidation [51].
In the present work, copper clusters were atomically dispersed in ceria nanostructures via a novel hydrothermal route, yielding highly active catalysts in CO oxidation reaction. Tuning of the physicochemical and catalytic properties was studied by varying the hydrothermal parameters (temperature and concentration). A set of analytical techniques such as electron paramagnetic resonance (EPR) spectroscopy, X-ray diffraction (XRD), N2 adsorption-desorption, scanning electron microscopy (SEM), Raman spectroscopy, and ultraviolet-visible diffuse reflectance spectroscopy (UV-Vis DRS) was used to assess the physicochemical characteristics of the materials and correlate with the catalytic performance.

2. Results

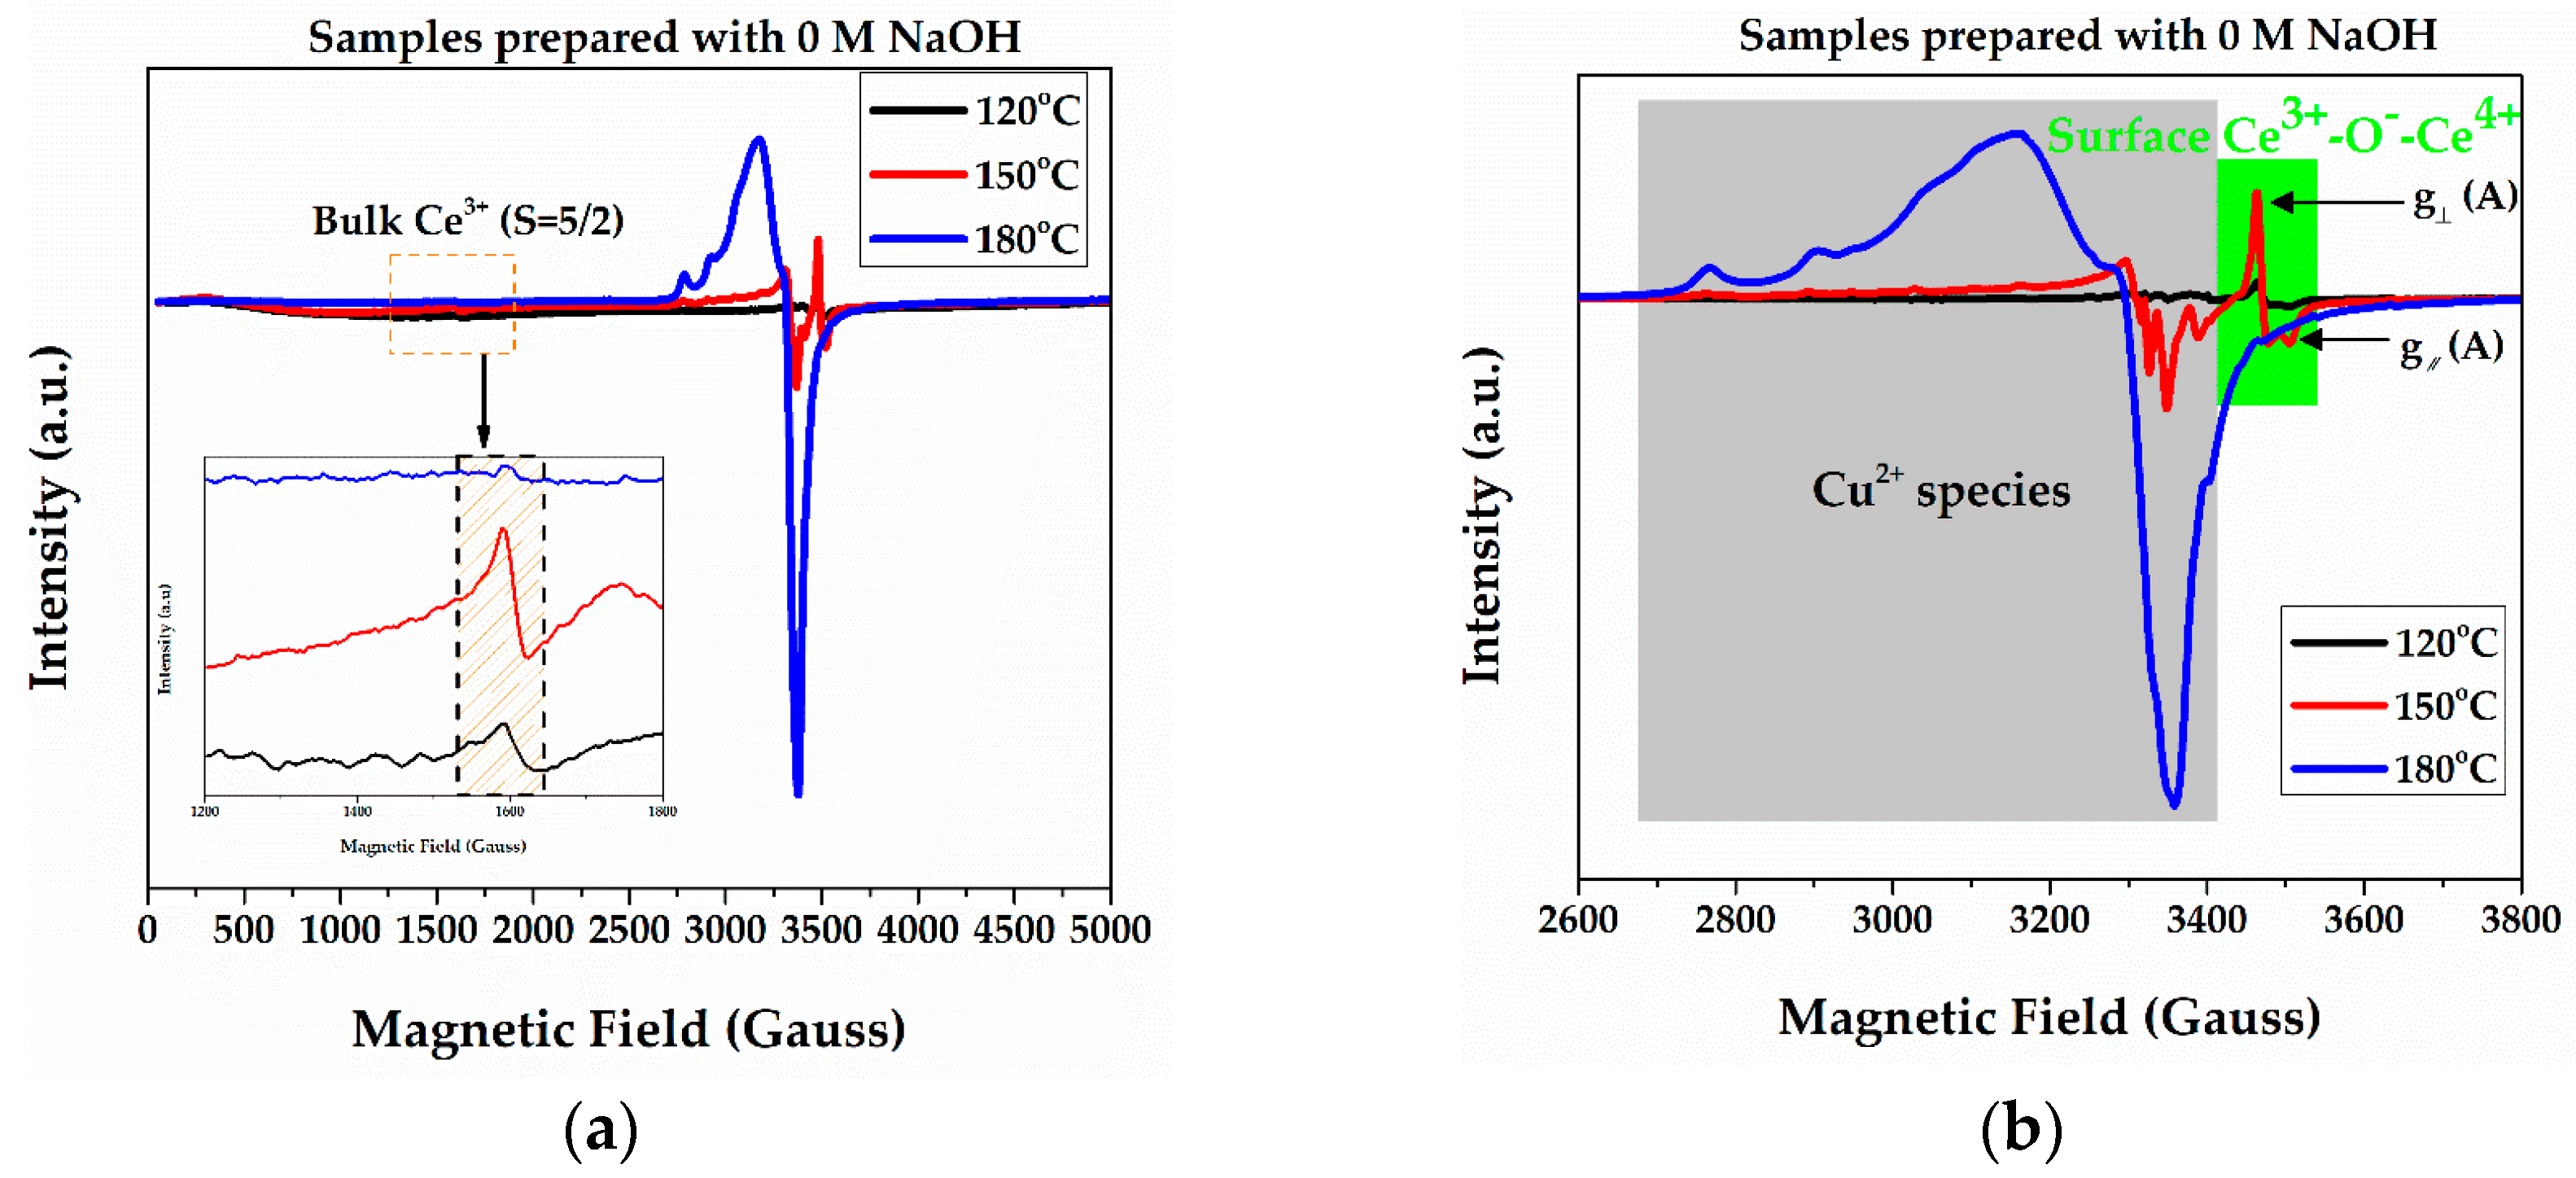
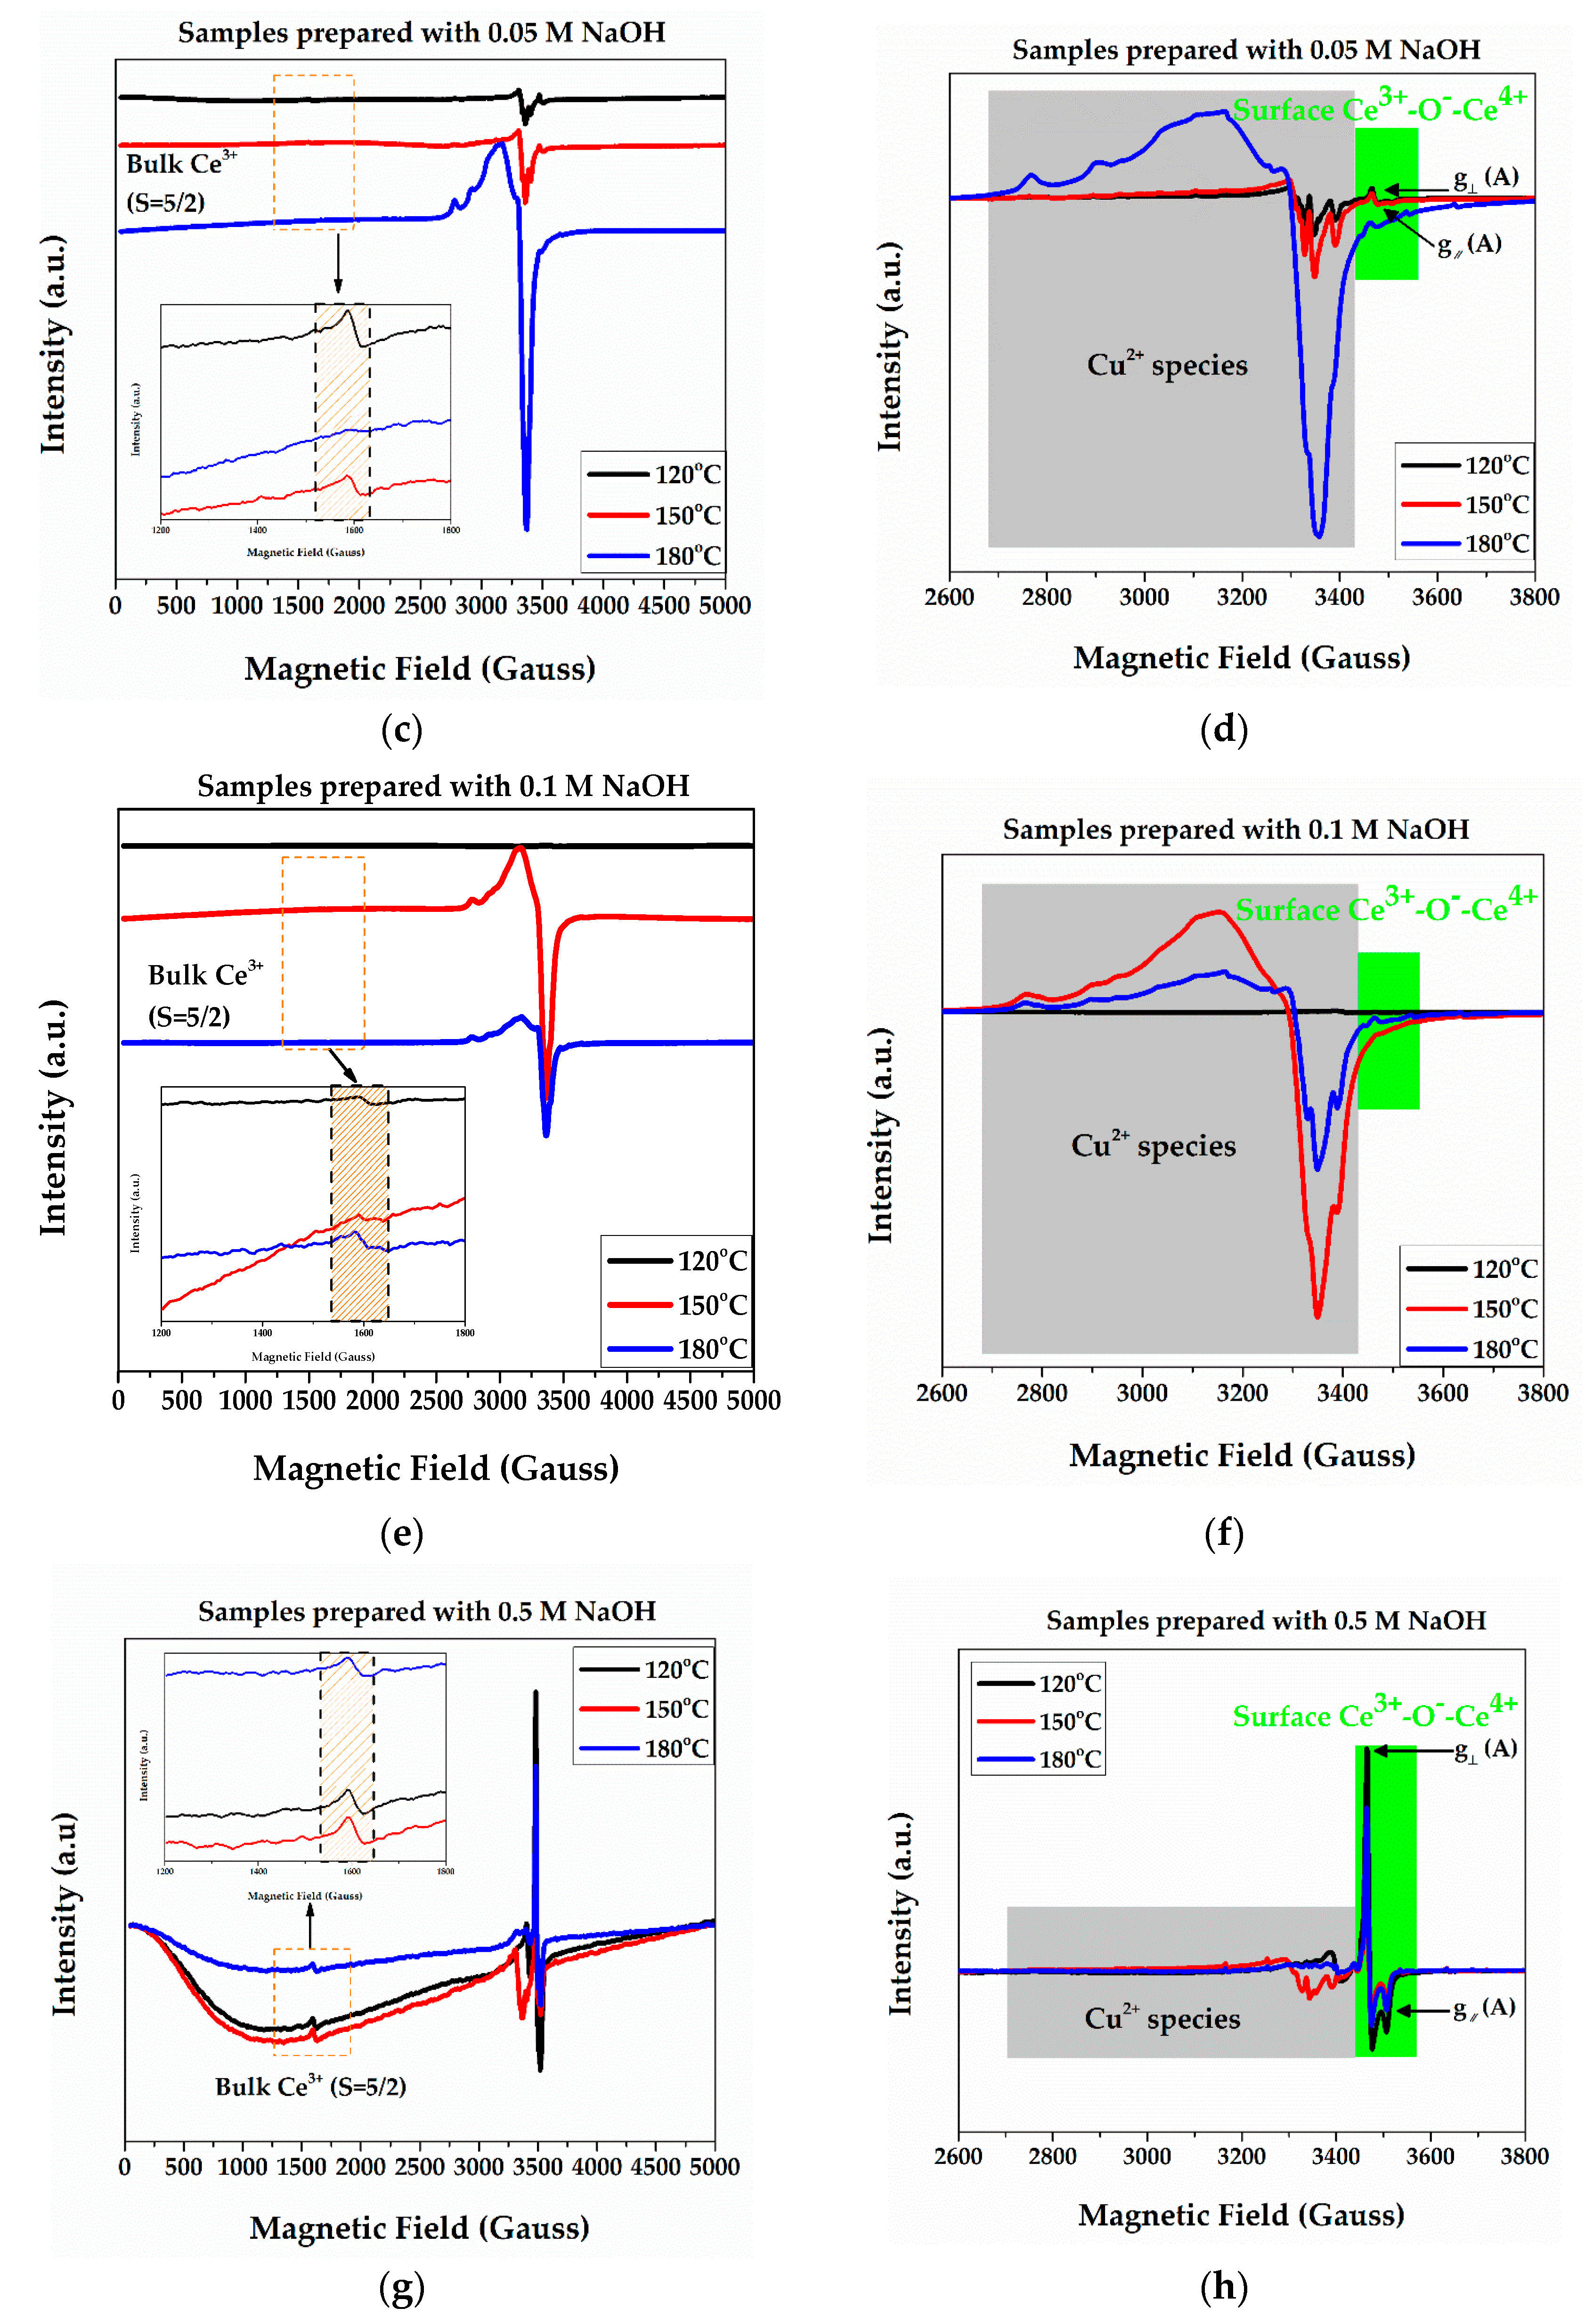
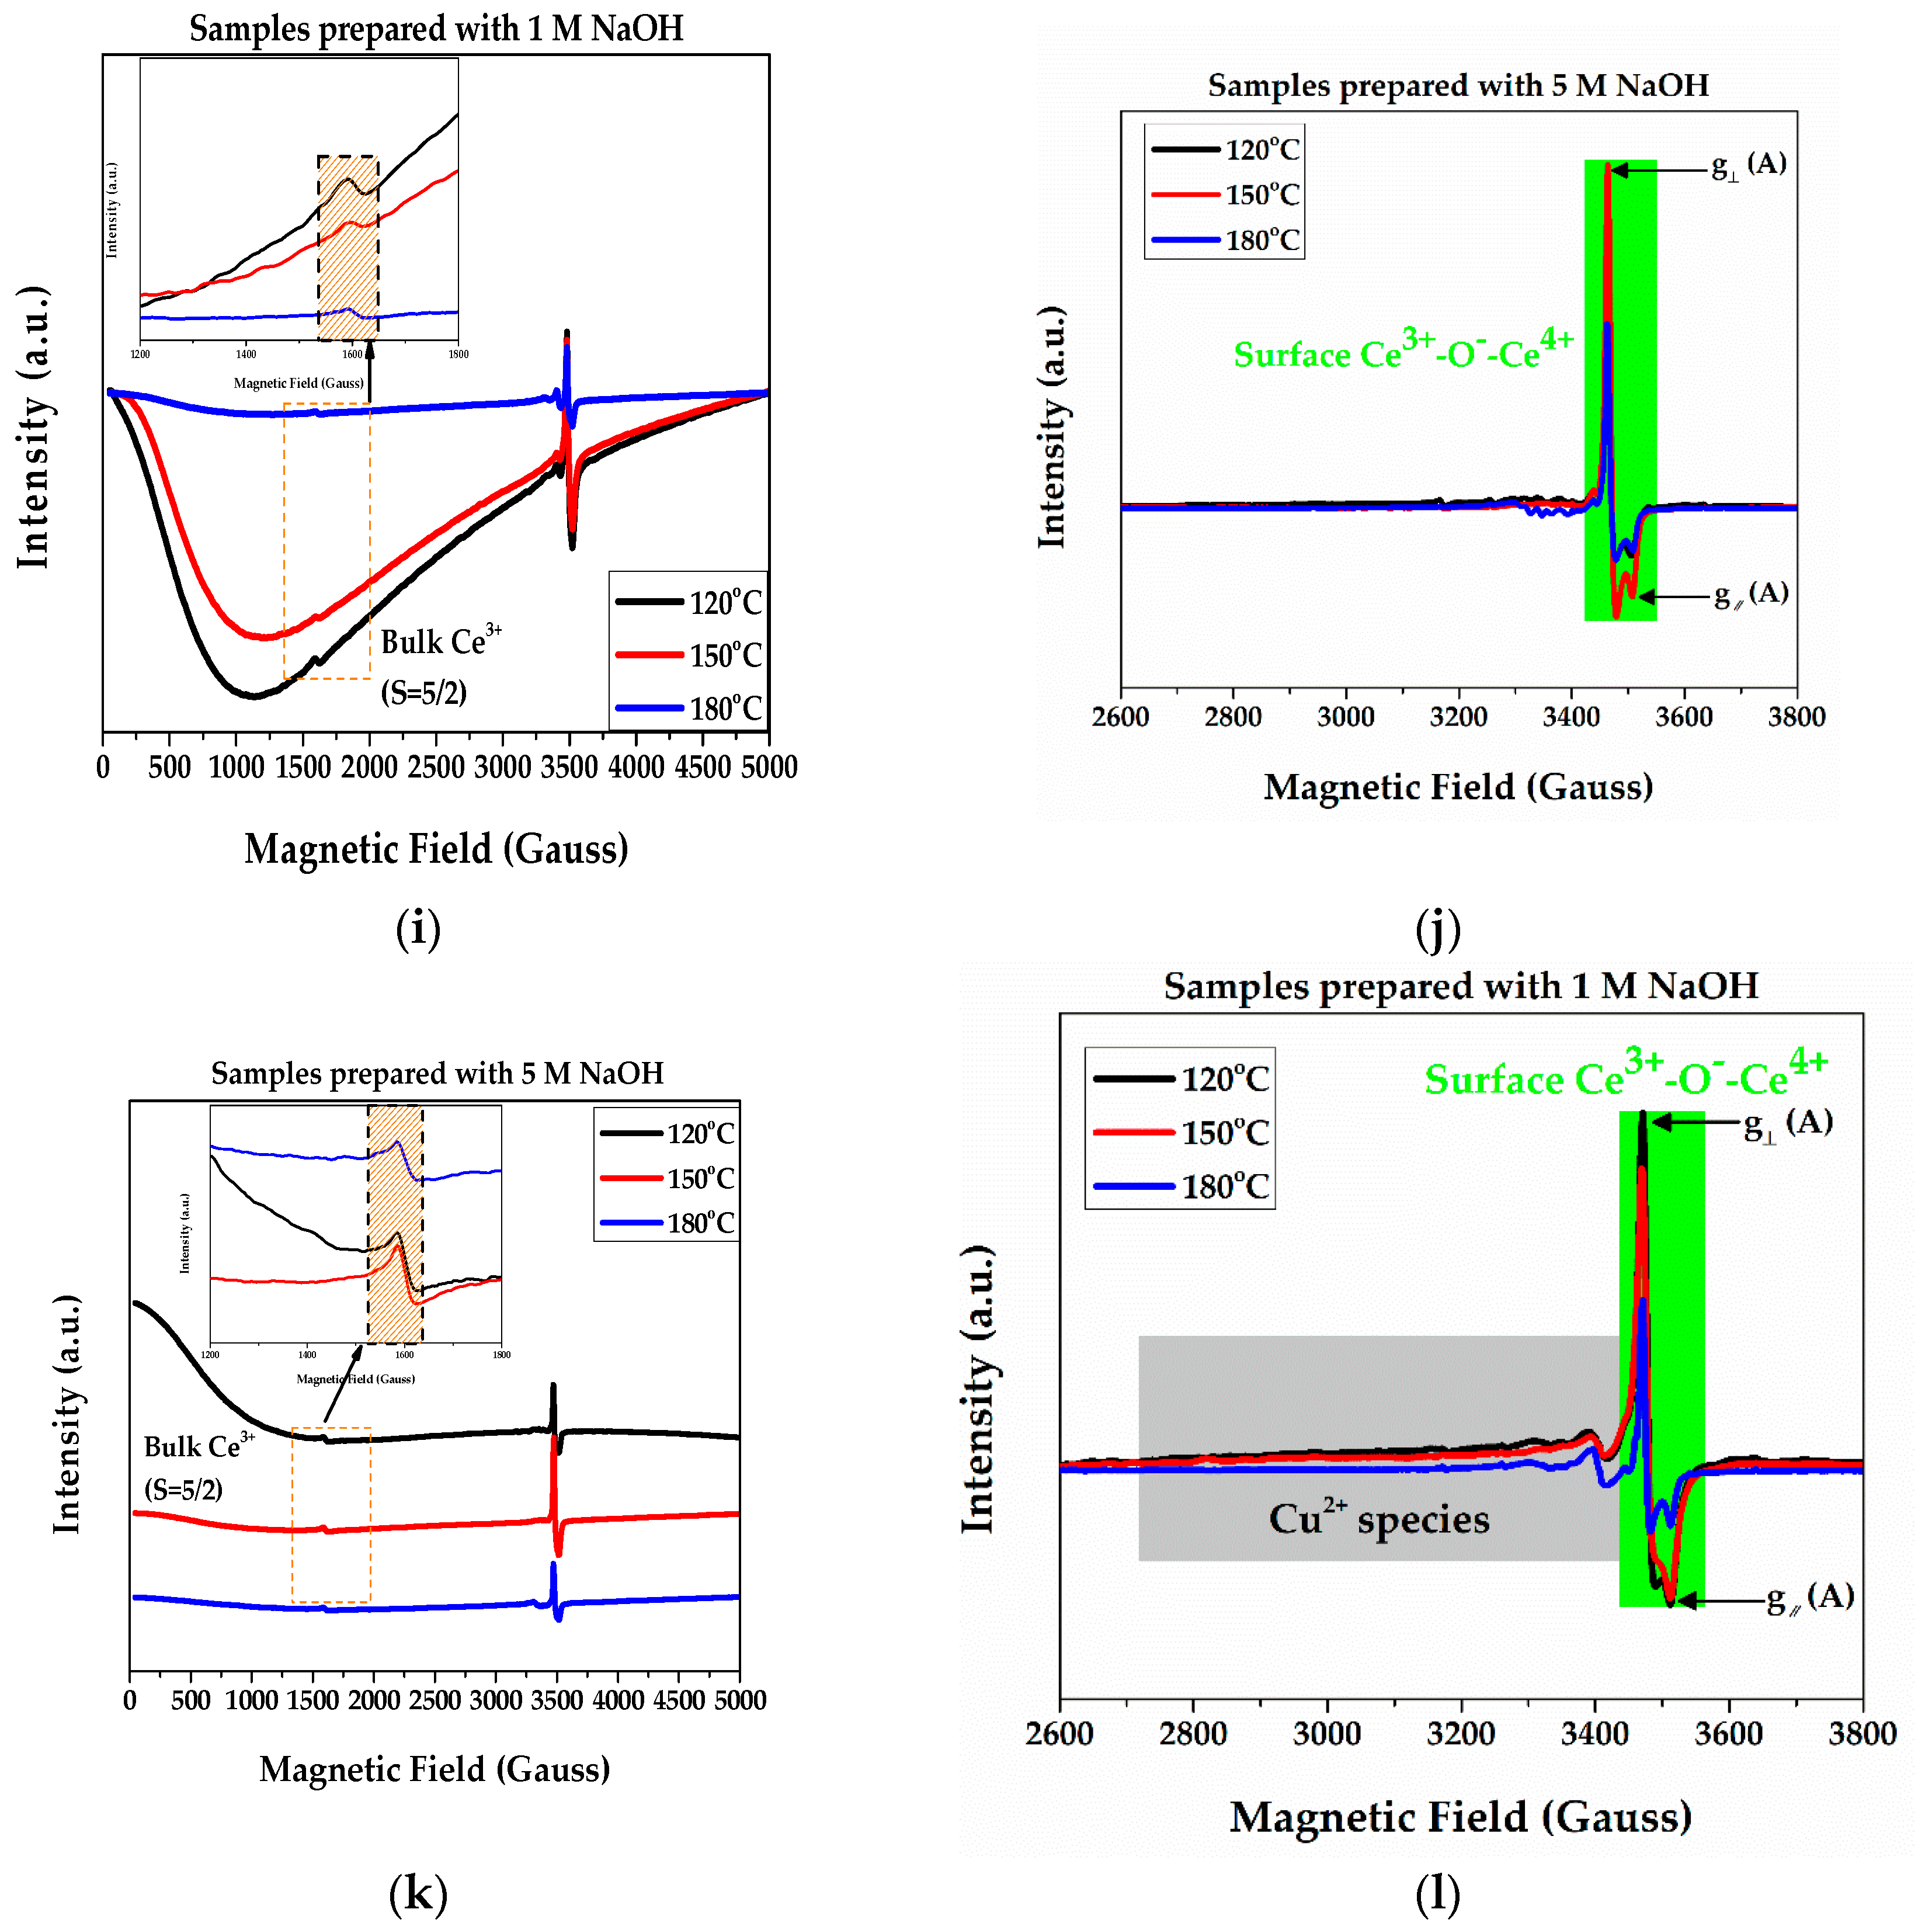
2.1. EPR Measurements

Figure 1 illustrates the EPR spectra of the hydrothermally prepared ceria-based catalysts, using various concentrations of NaOH. The concentrations of the detected species are shown in Table 1. In general, the EPR spectra present three characteristic signals; A signal at ca. 1580 Gauss (g = 4) is attributed to Ce3+ ions in high spin (S = 5/2) state, corresponding to reduced Ce3+ ceria centers located inside the lattice of ceria particles [15,52]. The sharp signal at around 3400 Gauss (visualized better in the right column spectra of Figure 1) is ascribed to [Ce3+-O-Ce4+] (S = 1/2) units localized on the surface of the ceria particles [5,53,54]. According to the geometrical disposition of the two types of Ce3+ centers—lattice and surface—it is considered that surface Ce3+ ions can be correlated with high catalytic activity, i.e., since they may result to the formation of oxygen vacancies [55,56,57]. Regarding the Cu2+ signals, the EPR signals of the sample treated at 180 °C show a strong signal at 2600–3300 Gauss, which is attributed to Cu2+ (S = 1/2, I = 3/2) ions. The line shape of this EPR spectrum indicates that the copper atoms show dipolar Cu-Cu interactions, i.e., the Cu2+ is clustered within 10 ± 3 Angstroms from each other [58]. The g-and A values of Cu2+, (g= 2.035, g//= 2.305, A= 15, A//=150) suggest that the Cu2+ ions are located in the octahedral sites in ceria with a tetragonal distortion [39,49,55,56,59,60,61].
Quantitate data on the Ce3+ and Cu2+, estimated from the EPR spectra, are listed in Table 1. Copper loading was also confirmed via XRF measurements (within an experimental error of ±10%; not shown here), in line with EPR results. Concerning the surface Ce3+ ions, there is a clear trend vs. the NaOH concentration: Their concentrations increases when concentrated solutions of sodium hydroxide were employed in the hydrothermal route. With regard to the copper entities, the combination of low concentrations of NaOH and high hydrothermal temperatures caused the formation of a high amount of copper species (especially Cu2+ clusters). On the other hand, the high concentrations of NaOH halted the dispersion of copper species in the ceria phase, due to the high basicity of NaOH resulting in Cu(OH)n clusters’ formation in the CeO2 phase.

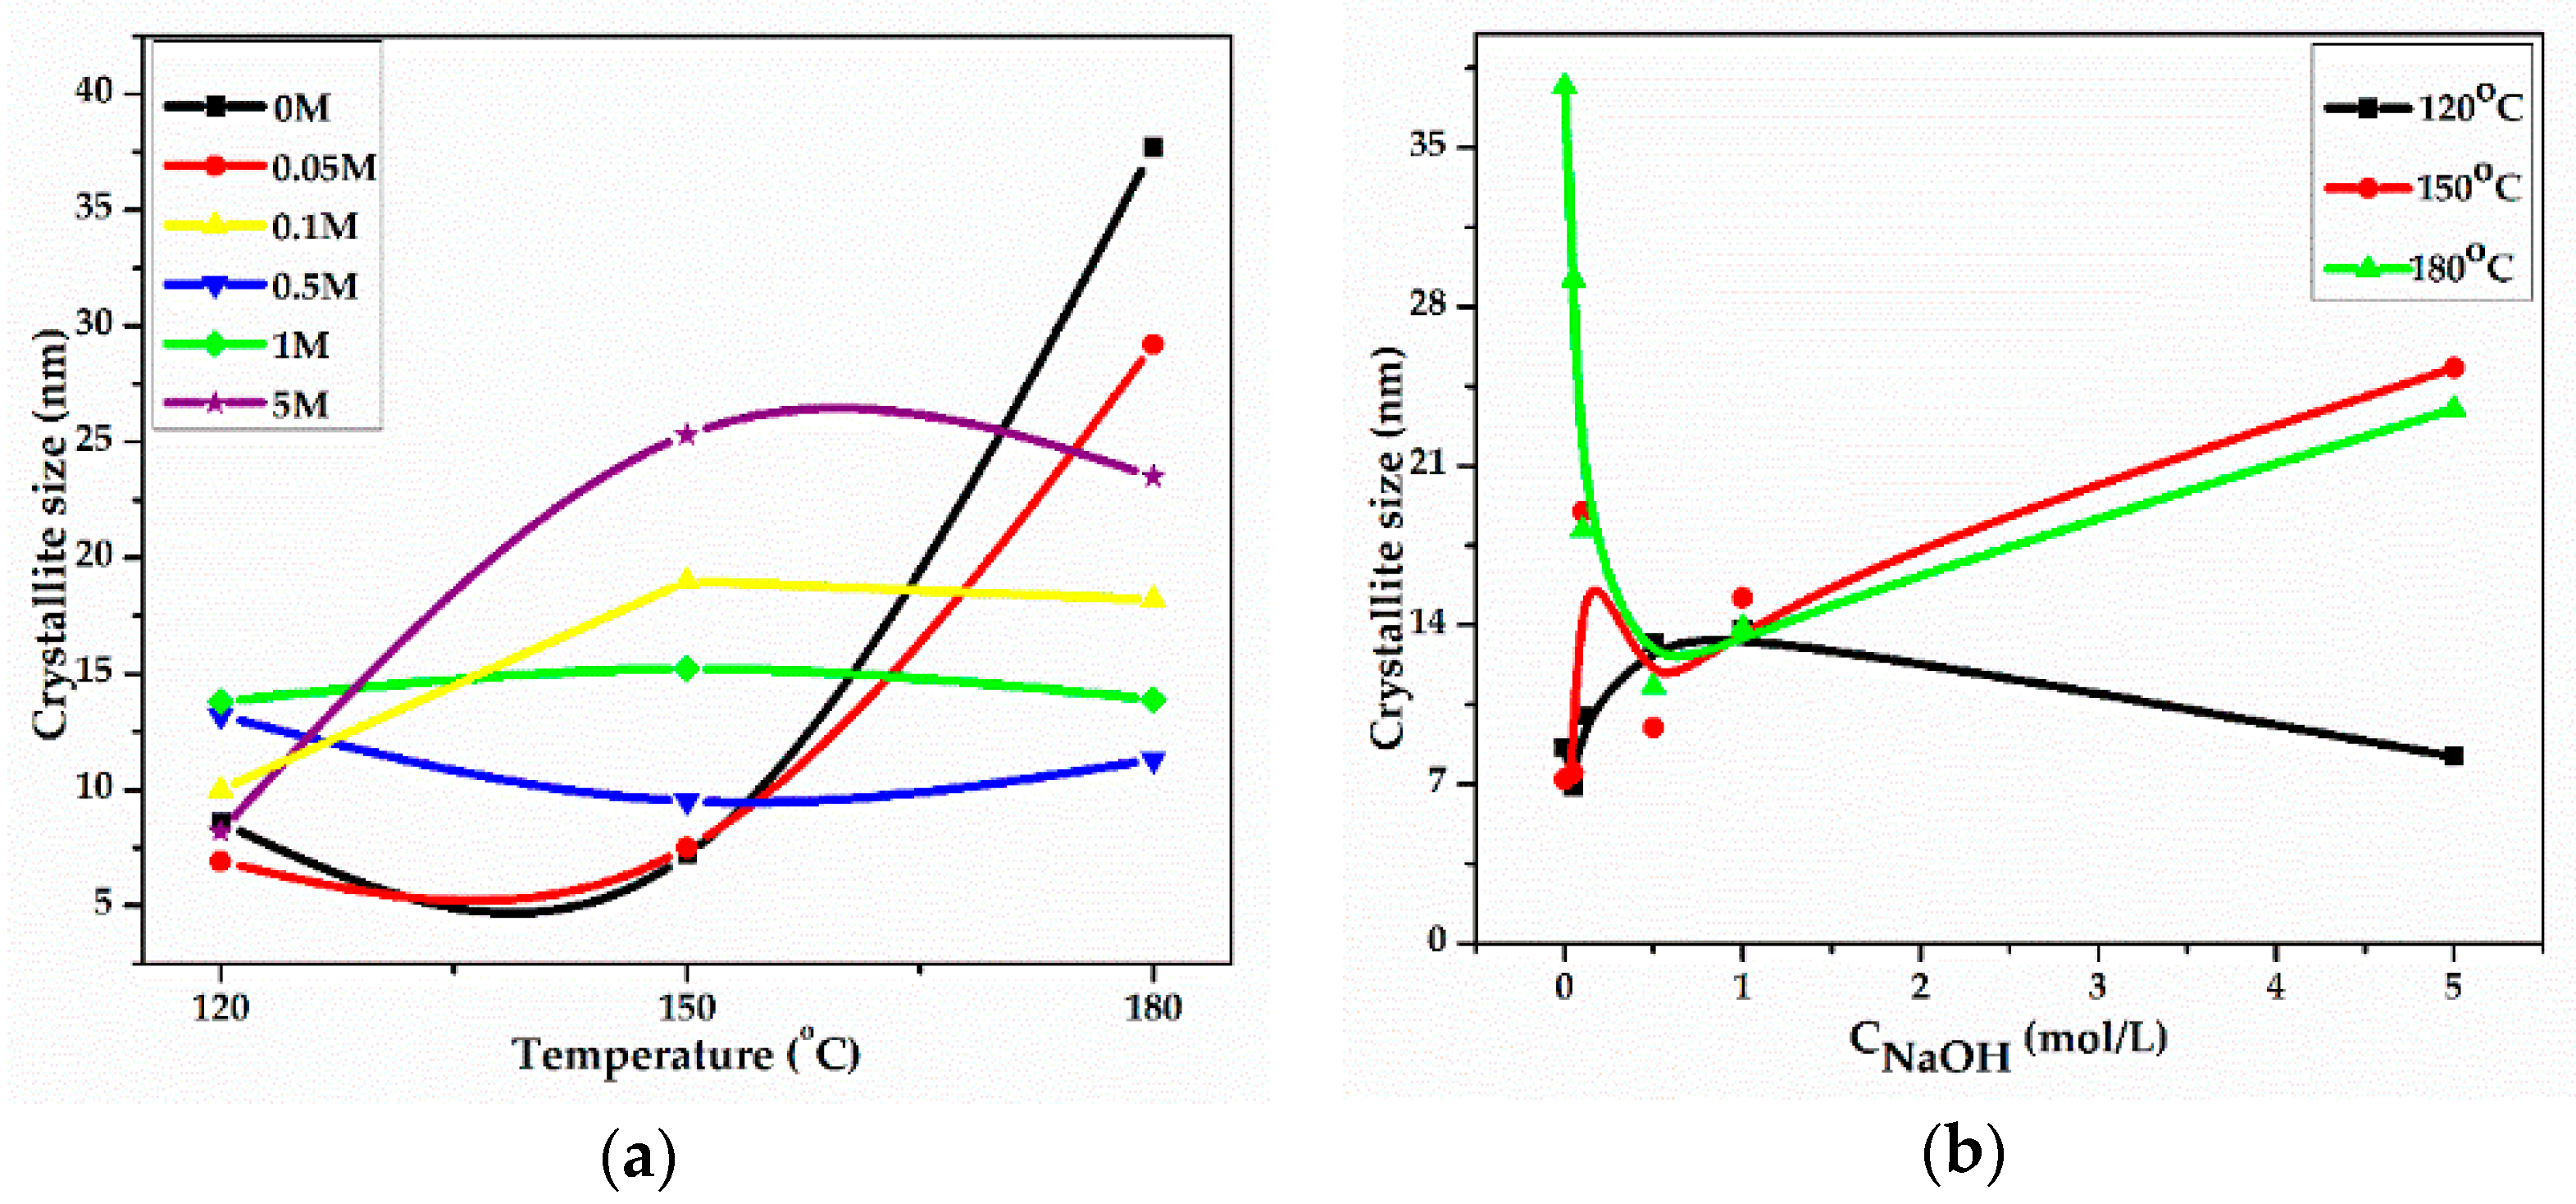
2.2. XRD Measurements

The XRD diffractograms of all the samples are shown in Figure S1. Noticeably, all peaks can be indexed to (111), (200), (220), (331), (222), (400), (331), (420), and (422) planes corresponding to the pure cubic phase [space group: Fm-3m, JCPDS: 00-043-1002, α = 0.54113 nm] of CeO2 [30]. No diffraction peaks of crystalline copper species can be observed, due to the presence of highly dispersed amorphous copper species or/and the low copper loading, which can be hardly detected at XRD [62,63]. However, as it was discussed in EPR section, the copper species might be atomically dispersed in the ceria matrix. The calculated average crystallite size and the lattice parameter of the ceria-based materials are presented in Table 2. It has to be noted that there is no clear relationship between Cu content (see Table 1) and crystallite size or lattice parameter of the catalysts.
The dependence of the crystallite size from the hydrothermal parameters is depicted in Figure 2. It can be seen in Figure 2a that, for concentrations of NaOH ≤0.05 M, small-size crystallites were formed at temperatures of 120–150 °C, while at 180 °C, a dramatic increase of their size can be observed. A more rapid increase of crystallites size was obtained in the case of 0.1 M NaOH. For instance, the sample Ce-120-0.1 presents an average crystallite size at 10 nm, while at 150 °C, the average size is ca. 20 nm. In the range of 0.5–1 M NaOH, the crystallites size varies from ~10 to 15 nm following an increase in the hydrothermal temperature. Finally, for 5 M NaOH, the combination of high concentration and high temperatures caused the formation of large crystallites. In Figure 2b, at 120 and 150 °C, a fluctuation of the crystallites size is indicated as the concentration of NaOH increases. At 180 °C, a decrease of the crystallite size is observed for concentrations ≤0.5 M. Further increase of the concentration caused the rise of the crystallites size.
Concerning the lattice parameter, the vast majority of the samples present higher values of lattice parameter than the pure ceria, suggesting the lattice expansion for the obtained materials. According to several studies, the lattice expansion is closely correlated with the presence of Ce3+ ions in the crystal lattice because the radius of Ce3+ ions (0.114 nm) is higher than the radius of Ce4+ ions (0.097 nm), inducing the lattice expansion [27,64,65,66]. On the other hand, only two samples (Ce-120-0 and CuCe-150-0) presented a smaller value of lattice parameter than the pure ceria. According to Pan et al. [30], the hydroxyl groups may stabilize the smaller nanoparticles resulting in the smaller value of lattice parameter.

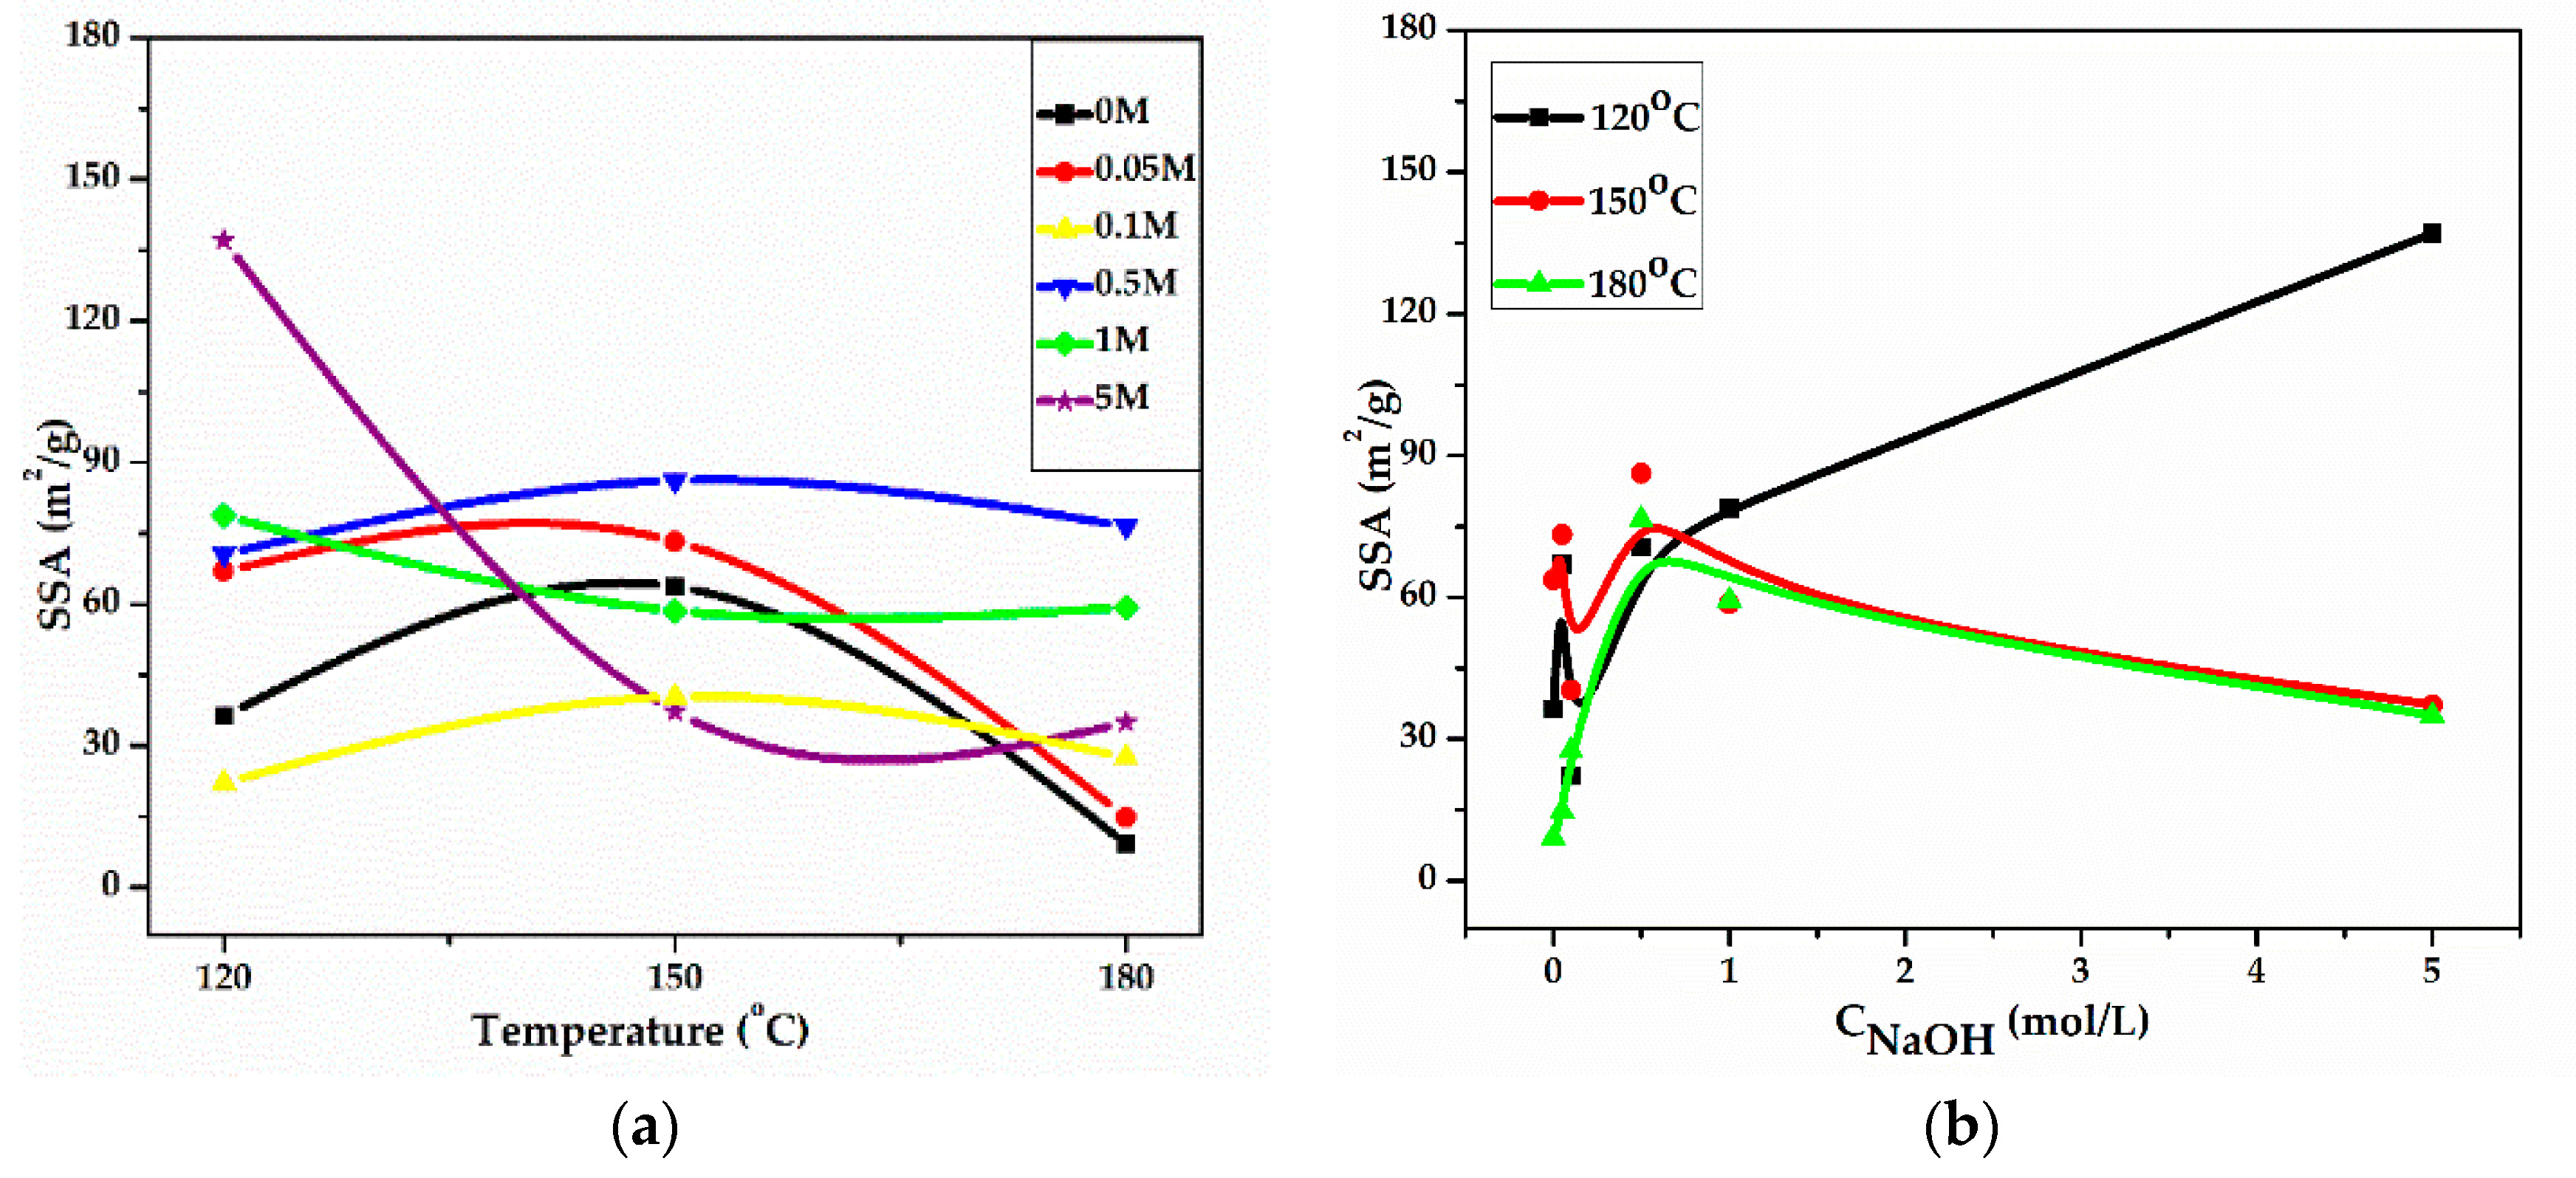
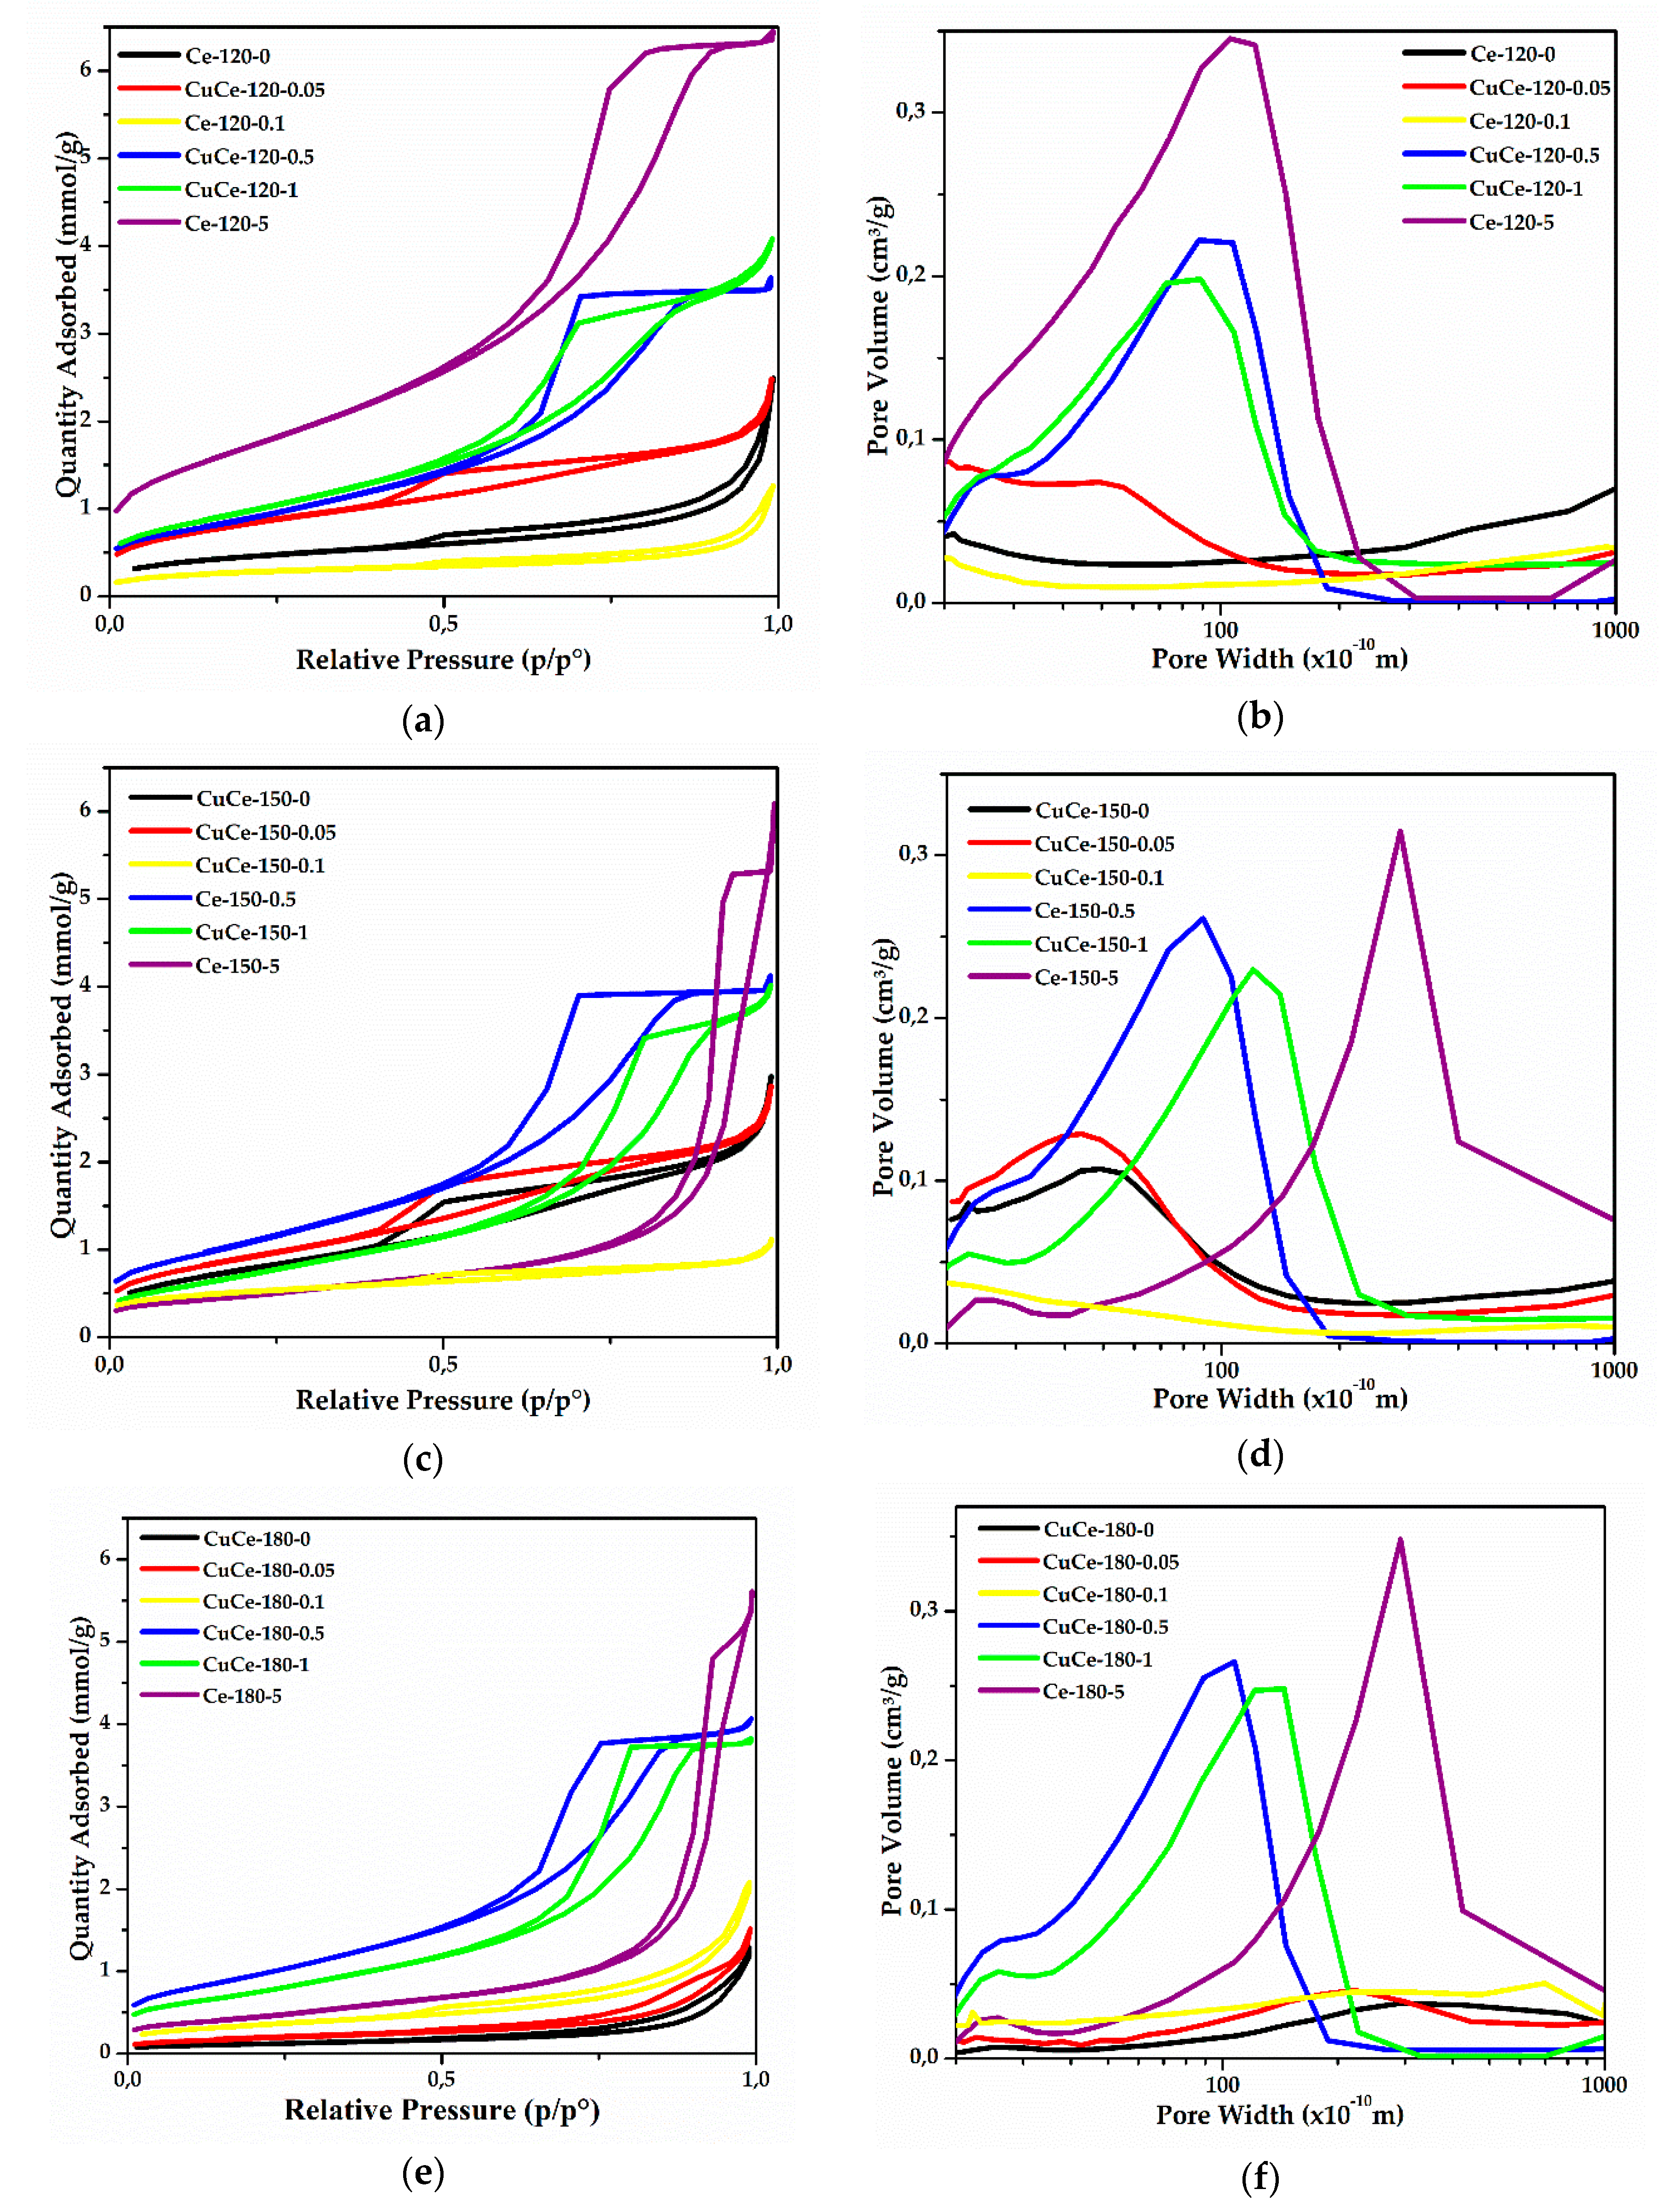
2.3. N2 Adsorption Measurements

The N2 adsorption/desorption isotherms and the pore size distribution for the ceria-based materials are illustrated in Figure 3. Additionally, the specific surface areas (SSA), the pore volume and the pore size of all samples are shown in Table 3. For hydrothermal solutions of NaOH ≤0.1 M, the materials present type II isotherms with type H2 hysteresis loops, independently of the hydrothermal temperature. Materials that present type H2 hysteresis loops are often disordered without well-defined pore distribution. However, for NaOH concentrations ≥0.5 M, it can observed that the type of isotherm becomes type IV, which is characteristic of mesoporous materials [67] with type H2 hysteresis loops. It is worth mentioning that a different type of hysteresis loops is revealed for Ce-150-5 and Ce-180-5 samples. Specifically, the type of hysteresis loop is type H1, which is associated with well-defined cylindrical pores.
The pore size distribution diagrams (Figure 3) denote that these ceria-based catalysts have not got a well-defined pore size. Indeed, the combination of hydrothermal parameters affected this distribution. Pores ranging in the mesoporous region were formed in the case of NaOH concentration ≥0.5 M, while different distributions can be observed with NaOH concentrations ≤0.1 M. For example, the CuCe-150-0 catalyst mainly presents mesopores, whereas the CuCe-180-0 sample mainly consists of macroporous.
The effect of the hydrothermal parameters on the specific surface area (SSA) of the obtained materials is illustrated in Figure 4. It can be seen in Figure 4a that an increase of the hydrothermal temperature from 120 to 150 °C resulted in higher SSA when the NaOH concentration was ≤0.5 M. Further increase of the temperature lowered the surface area of the catalysts. On the other hand, for higher NaOH concentration (≥1 M), the highest surface area was obtained at 120 °C. The highlight of this trend was the SSA of the Ce-120-5 catalyst (137.1 m2 g−1). A general trend depicted in Figure 4b, suggests that for elevated concentration of NaOH, higher surface areas can be obtained for the catalysts prepared hydrothermally at 120 °C. A similar trend can be seen at 150 and 180 °C, however a maximum of SSA corresponds to NaOH concentration of 0.5 M. Therefore, it can be concluded that the combination of high concentrations and high hydrothermal temperatures favors the formation of catalysts with poor surface area.

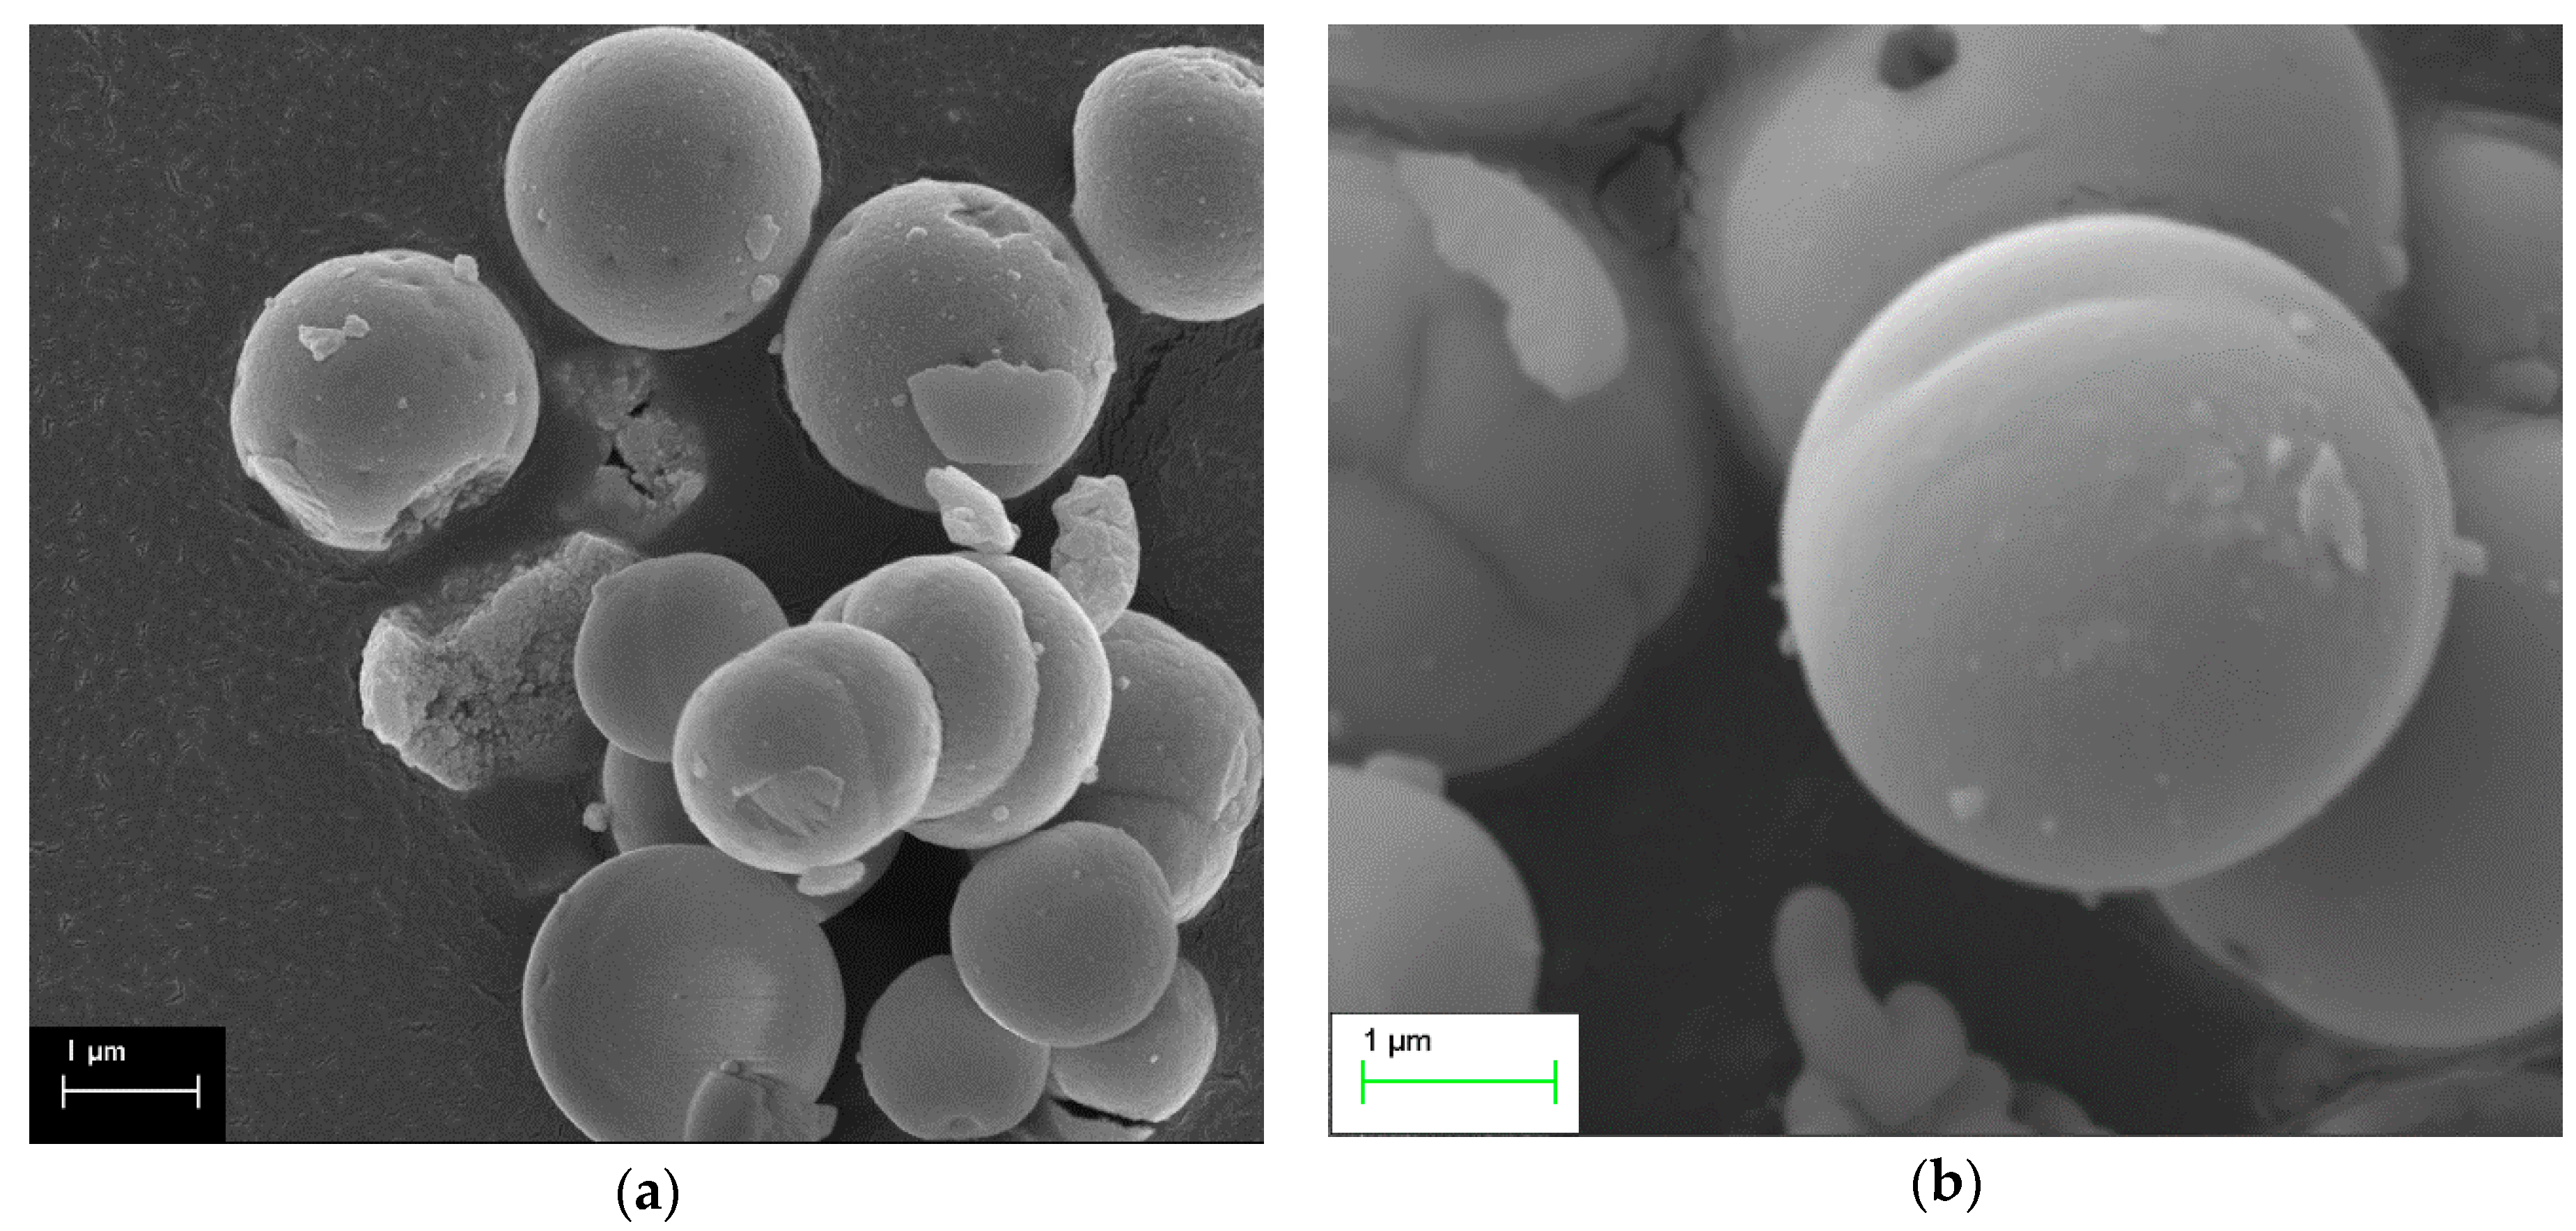
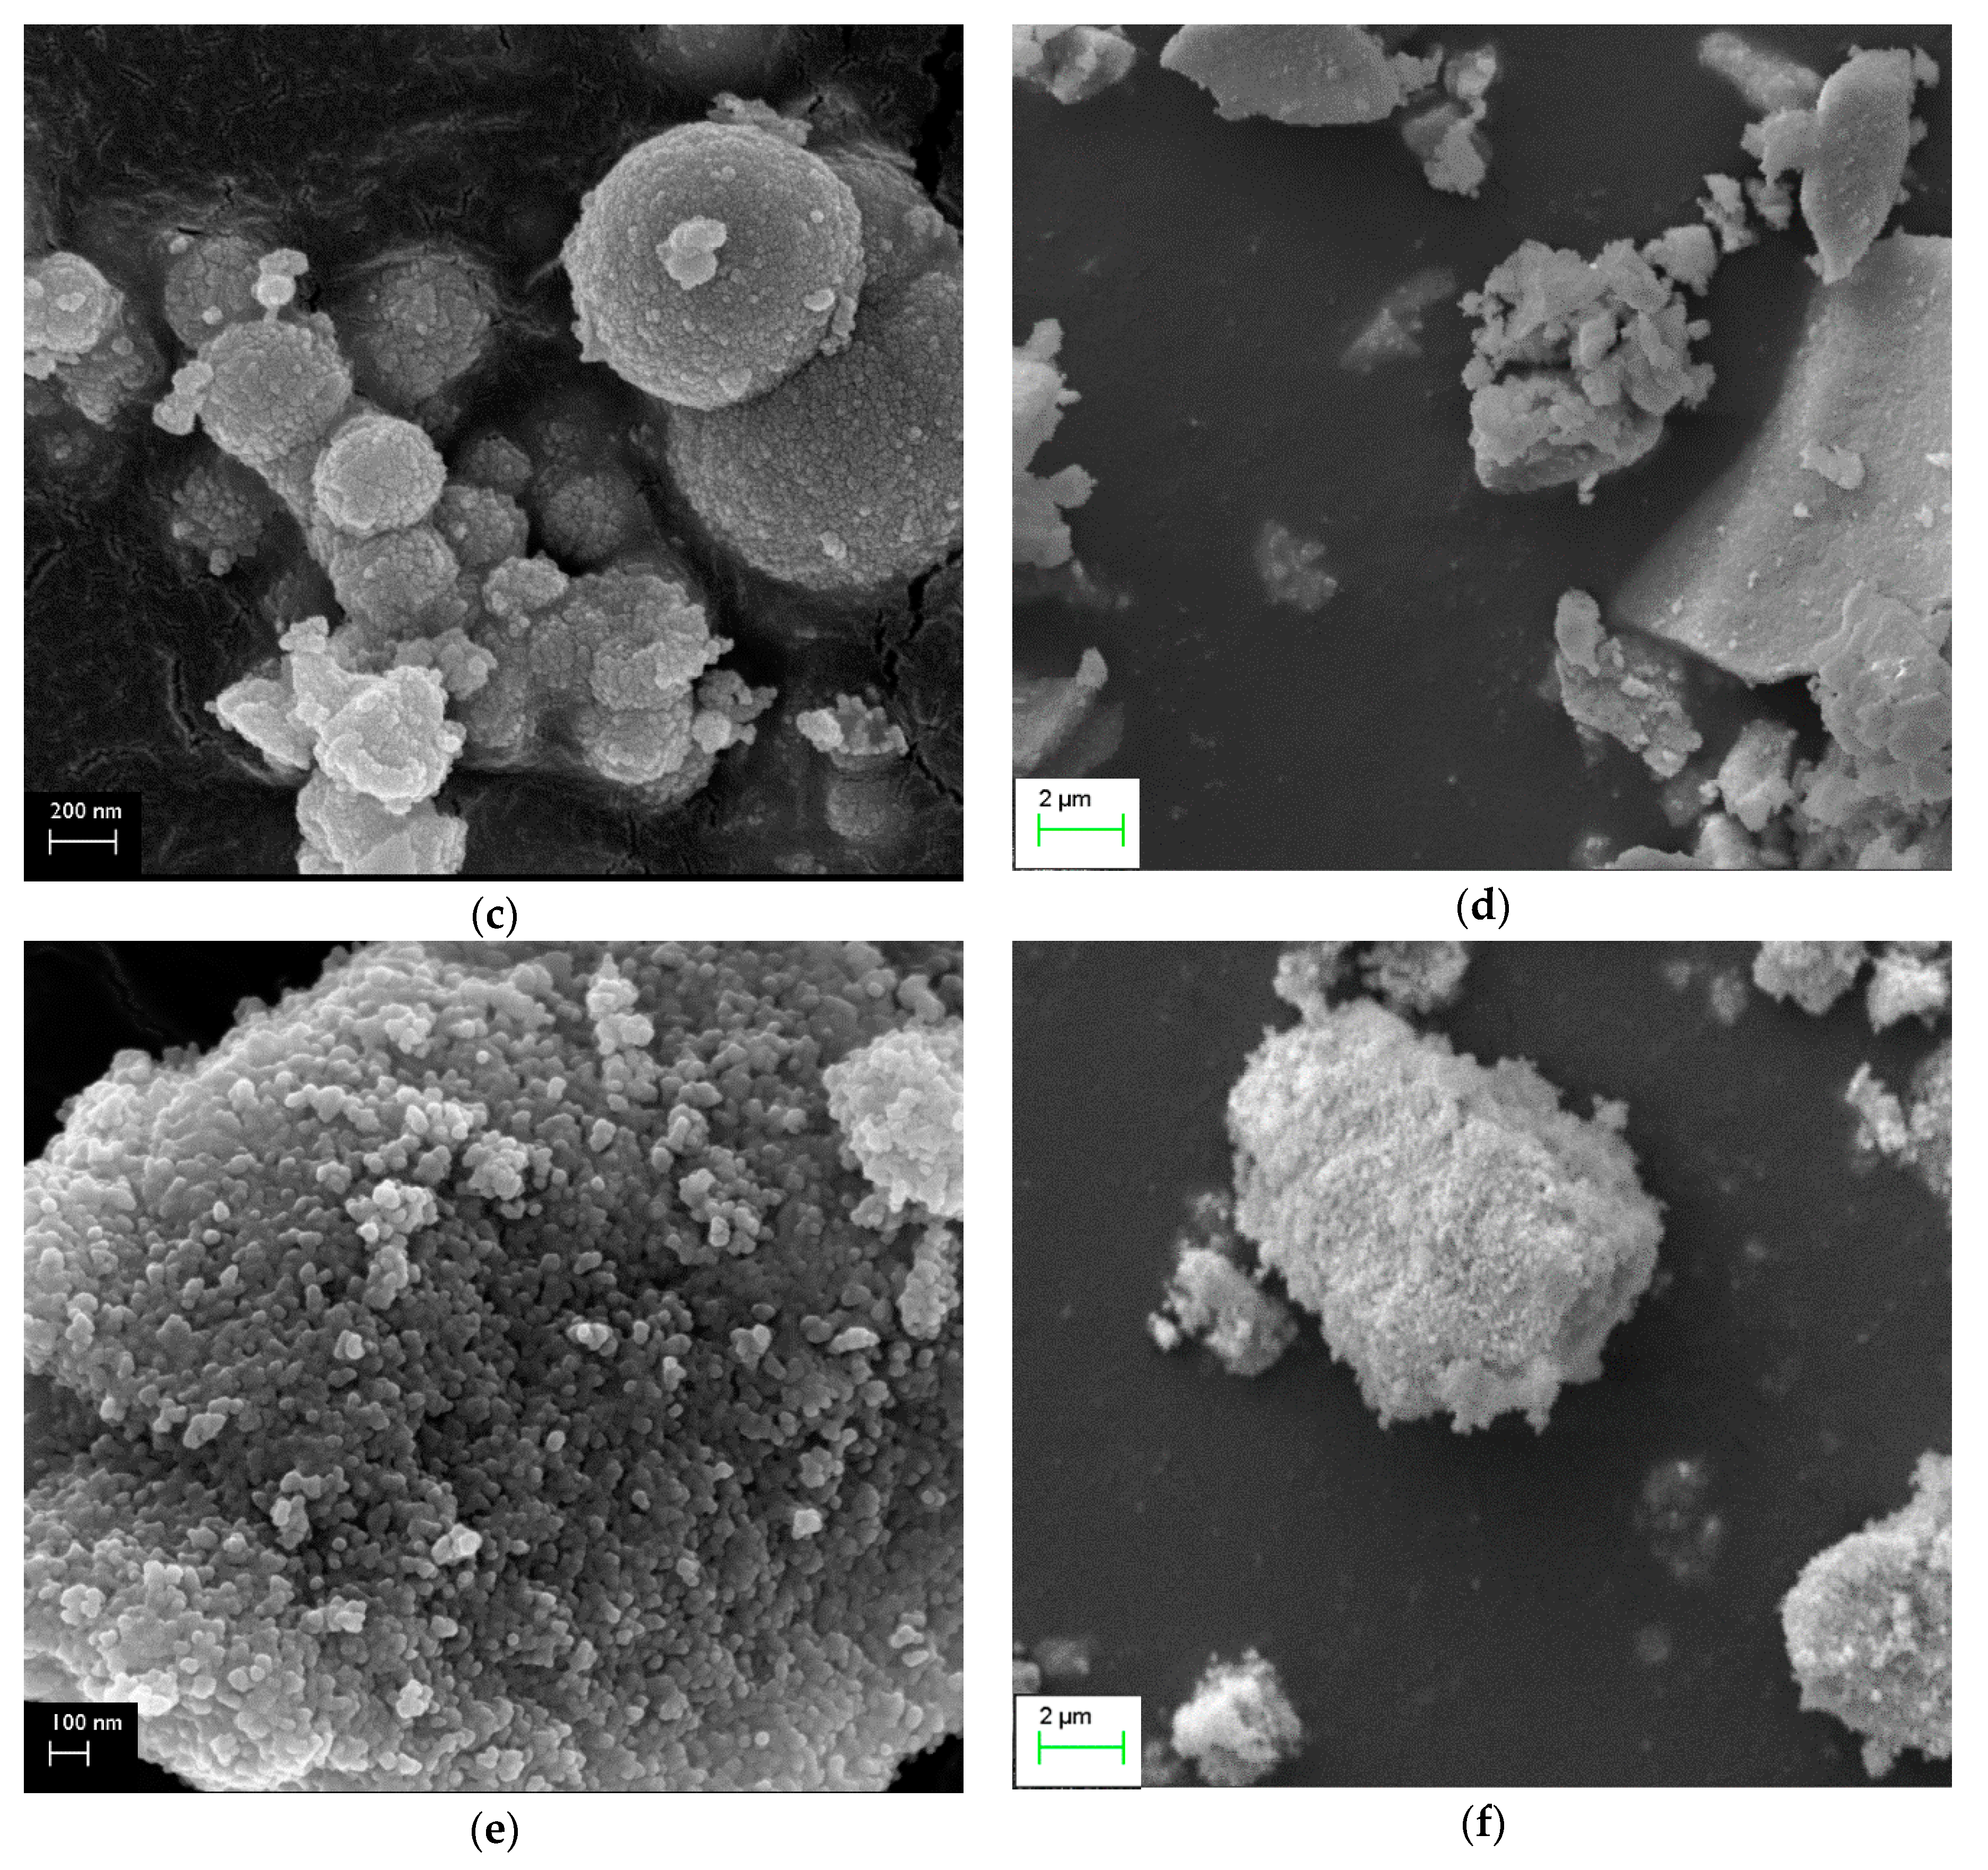
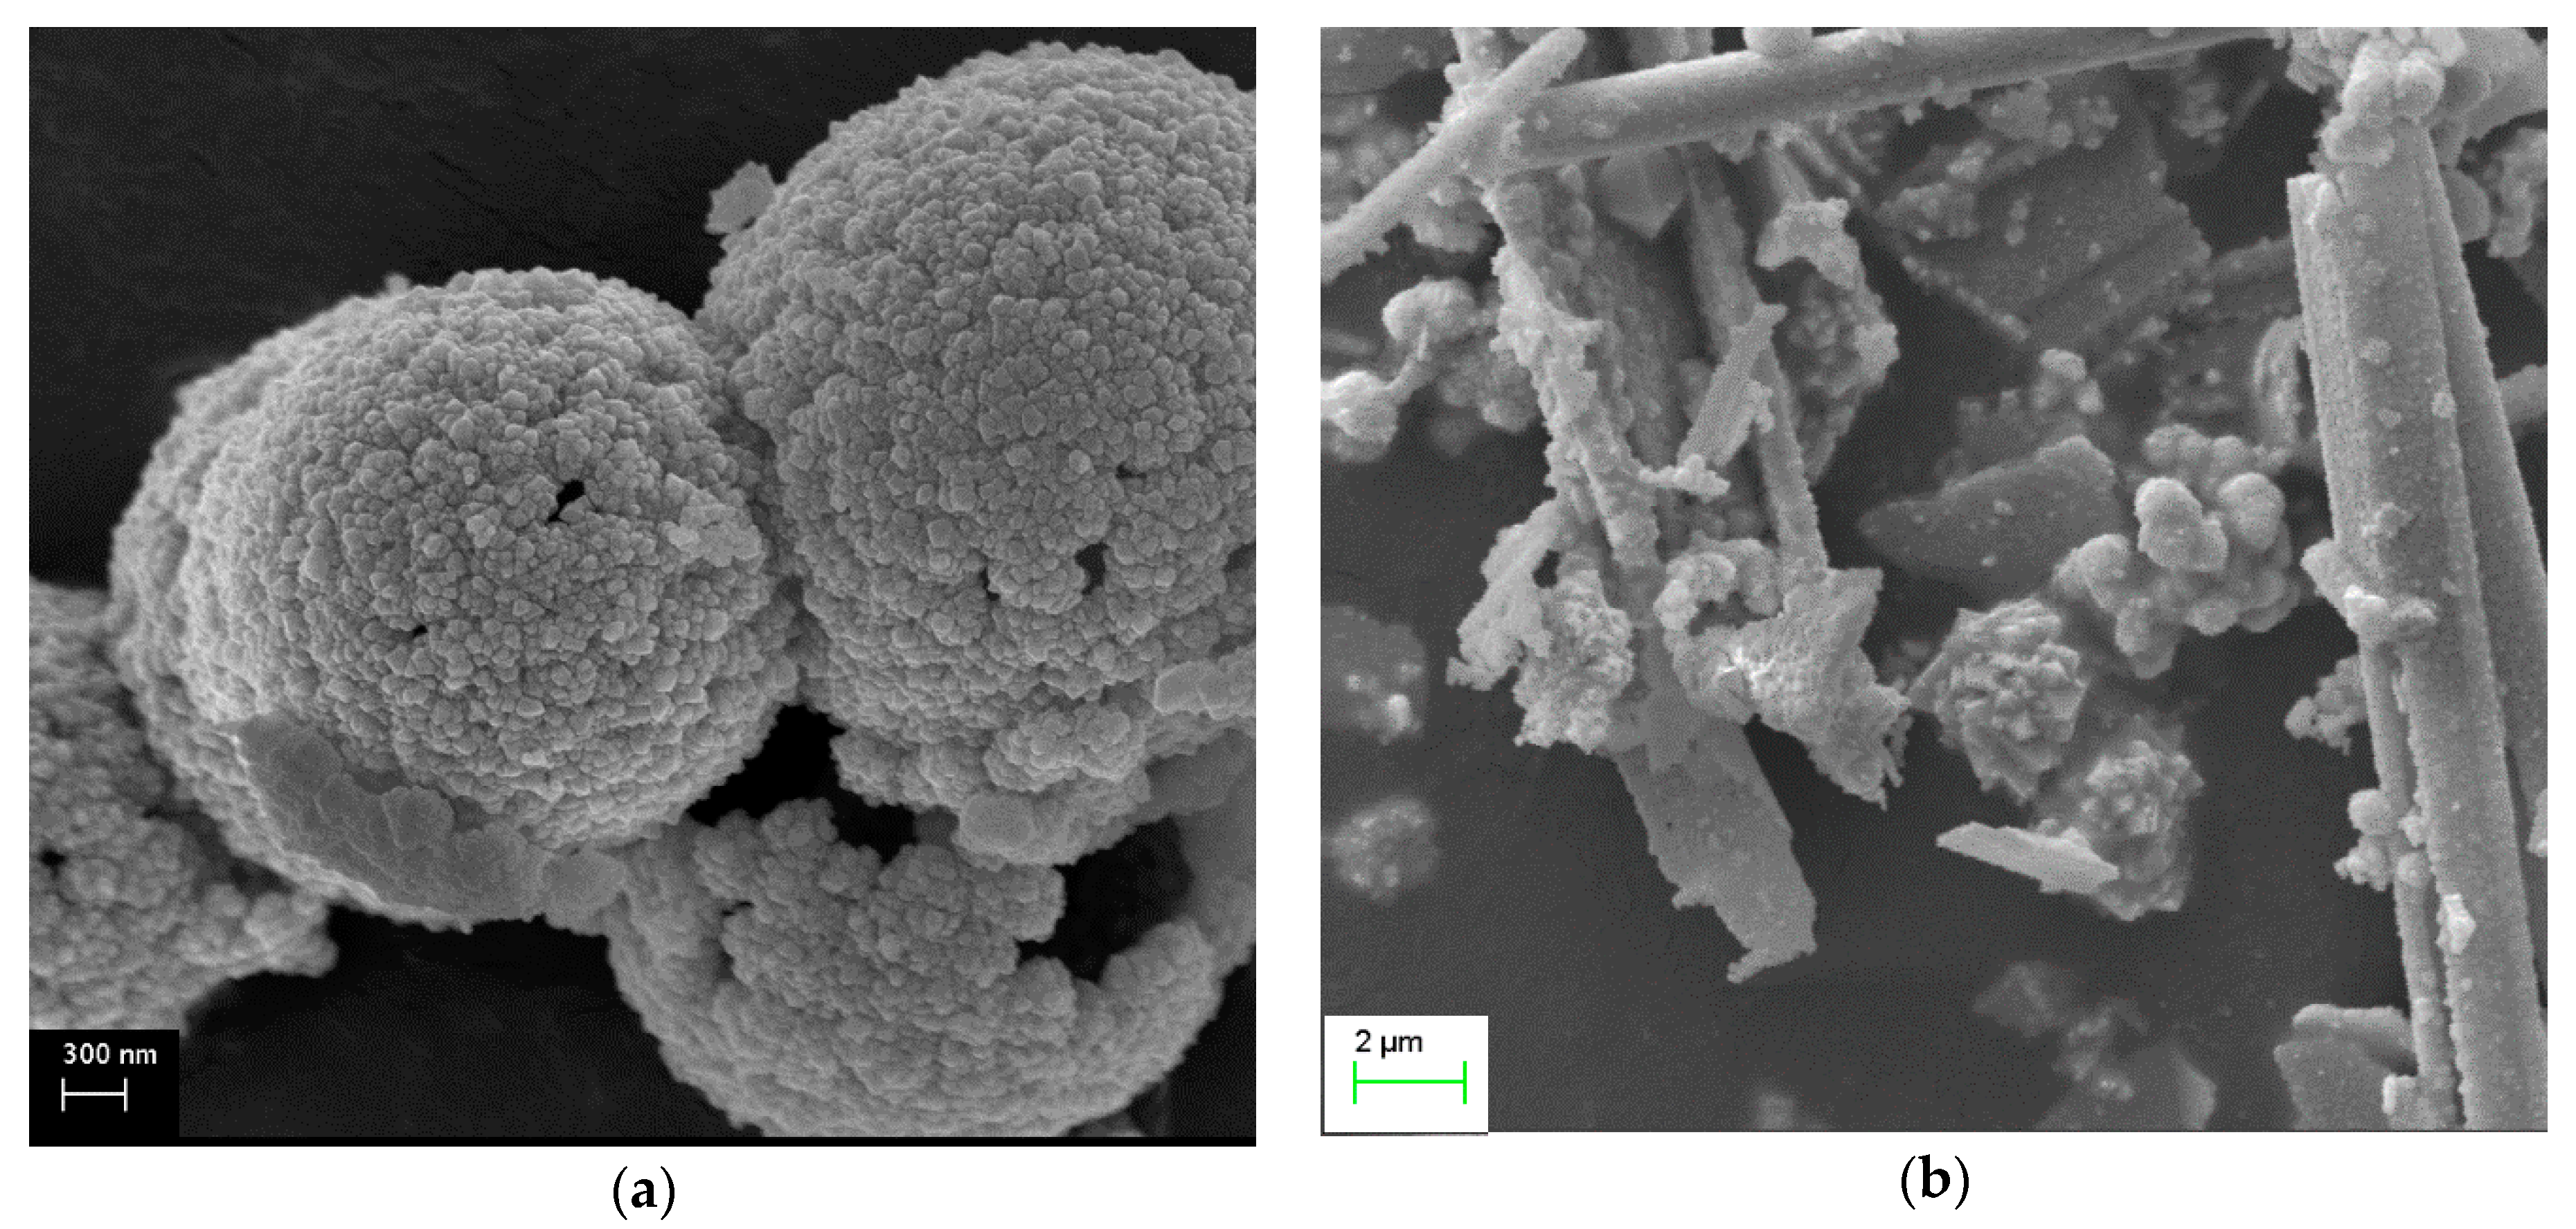
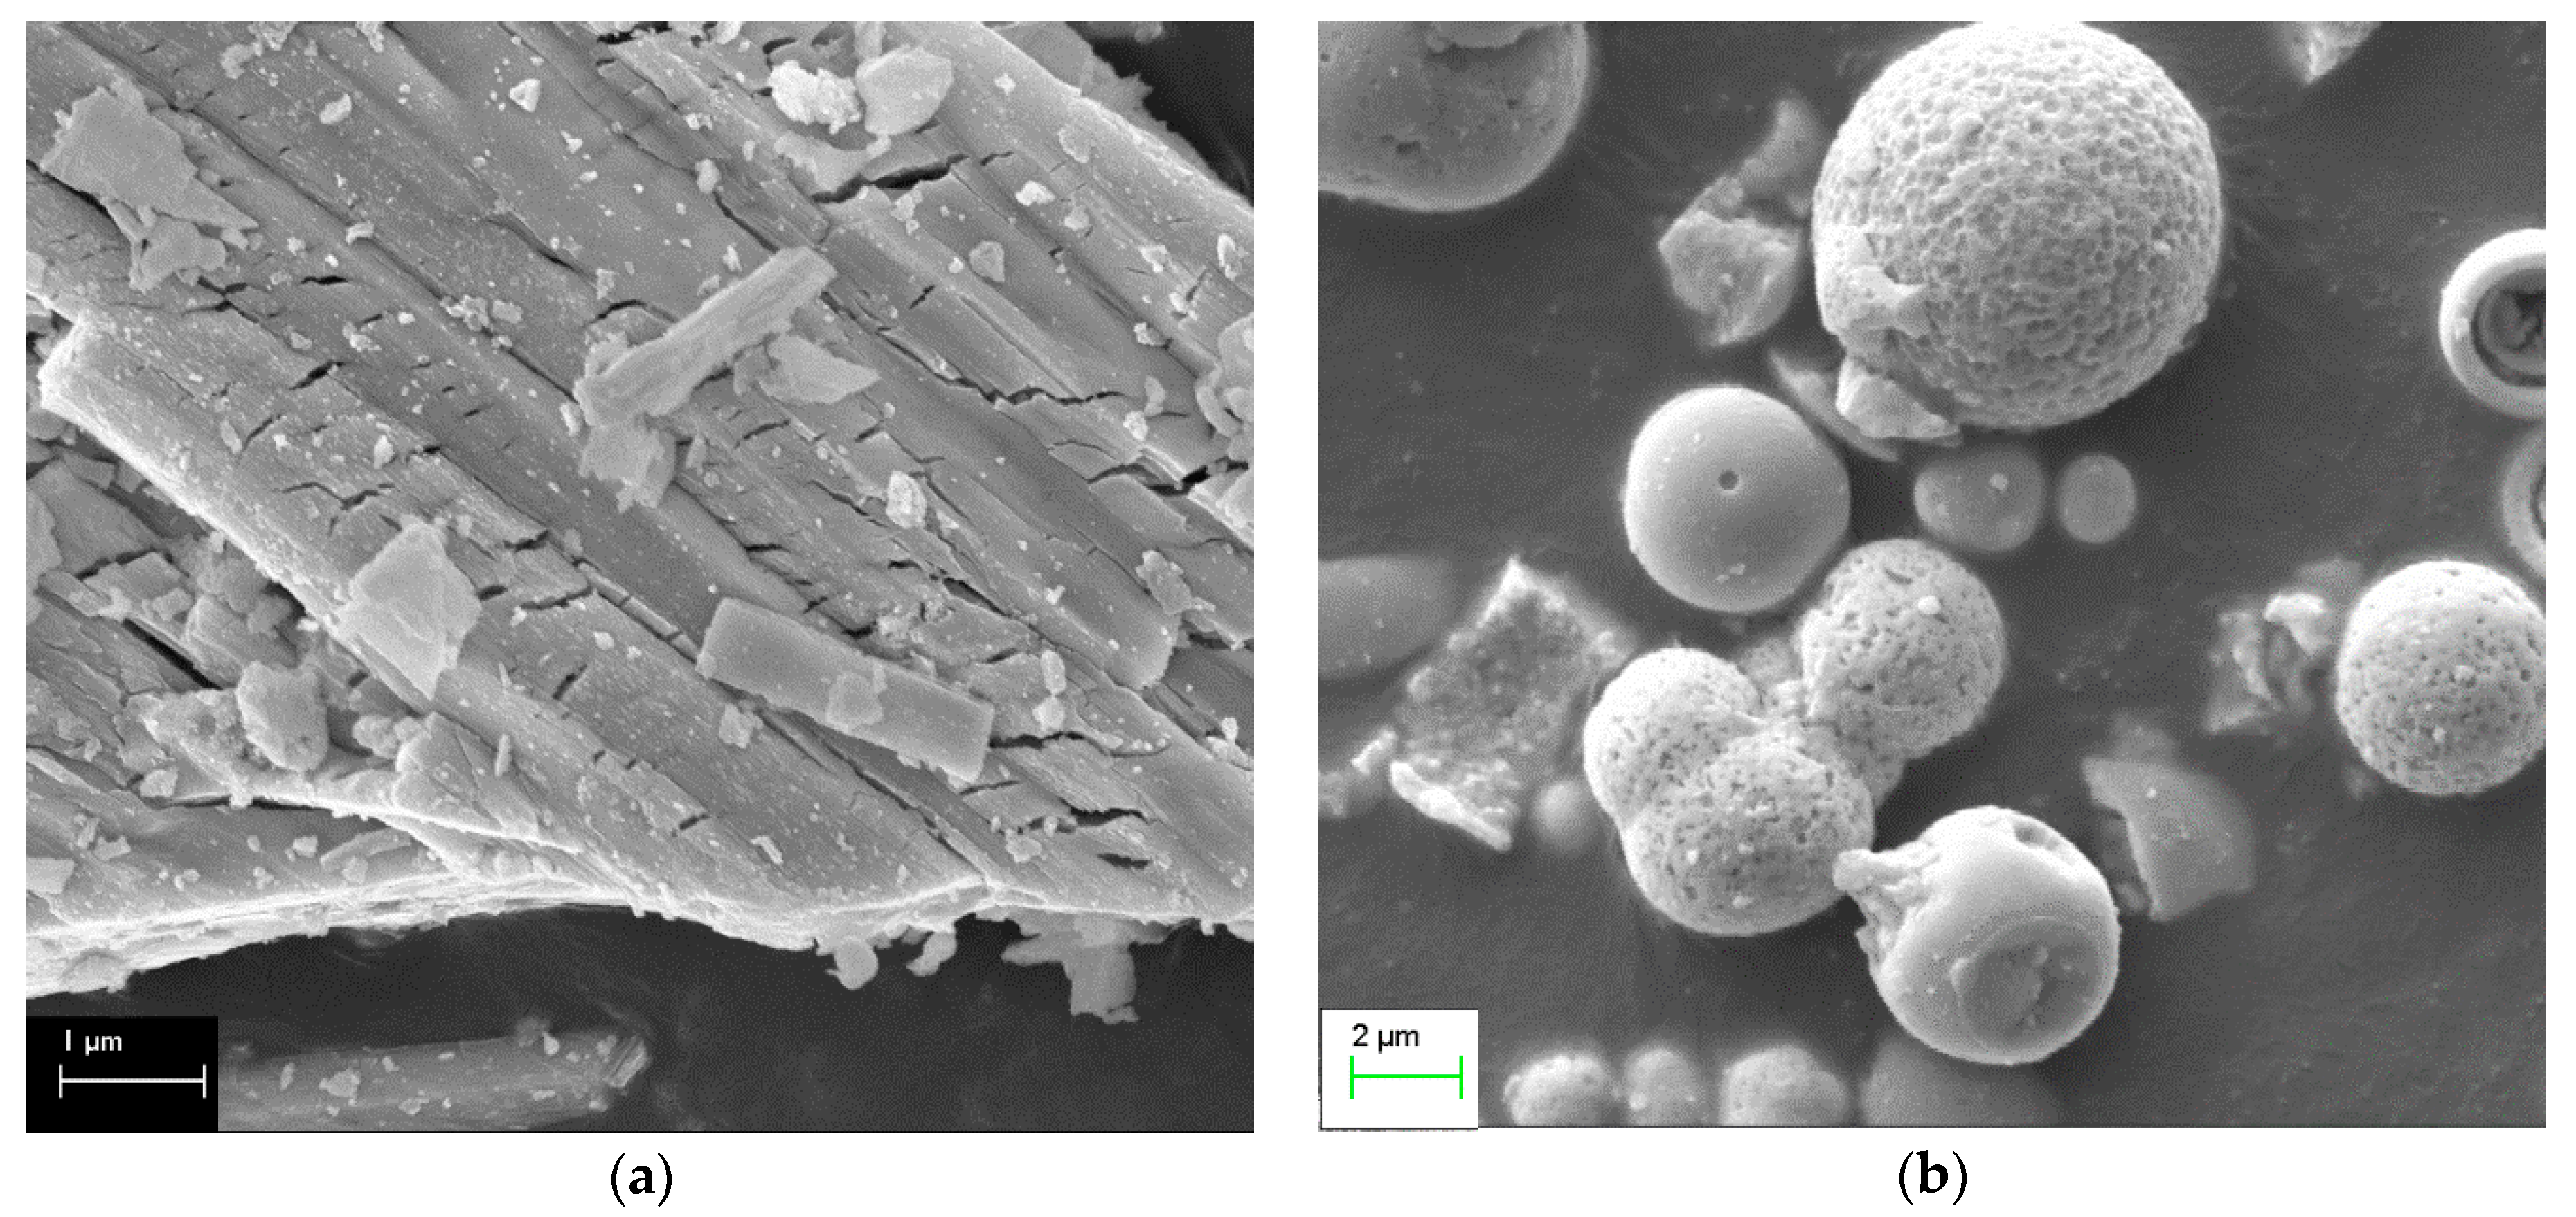
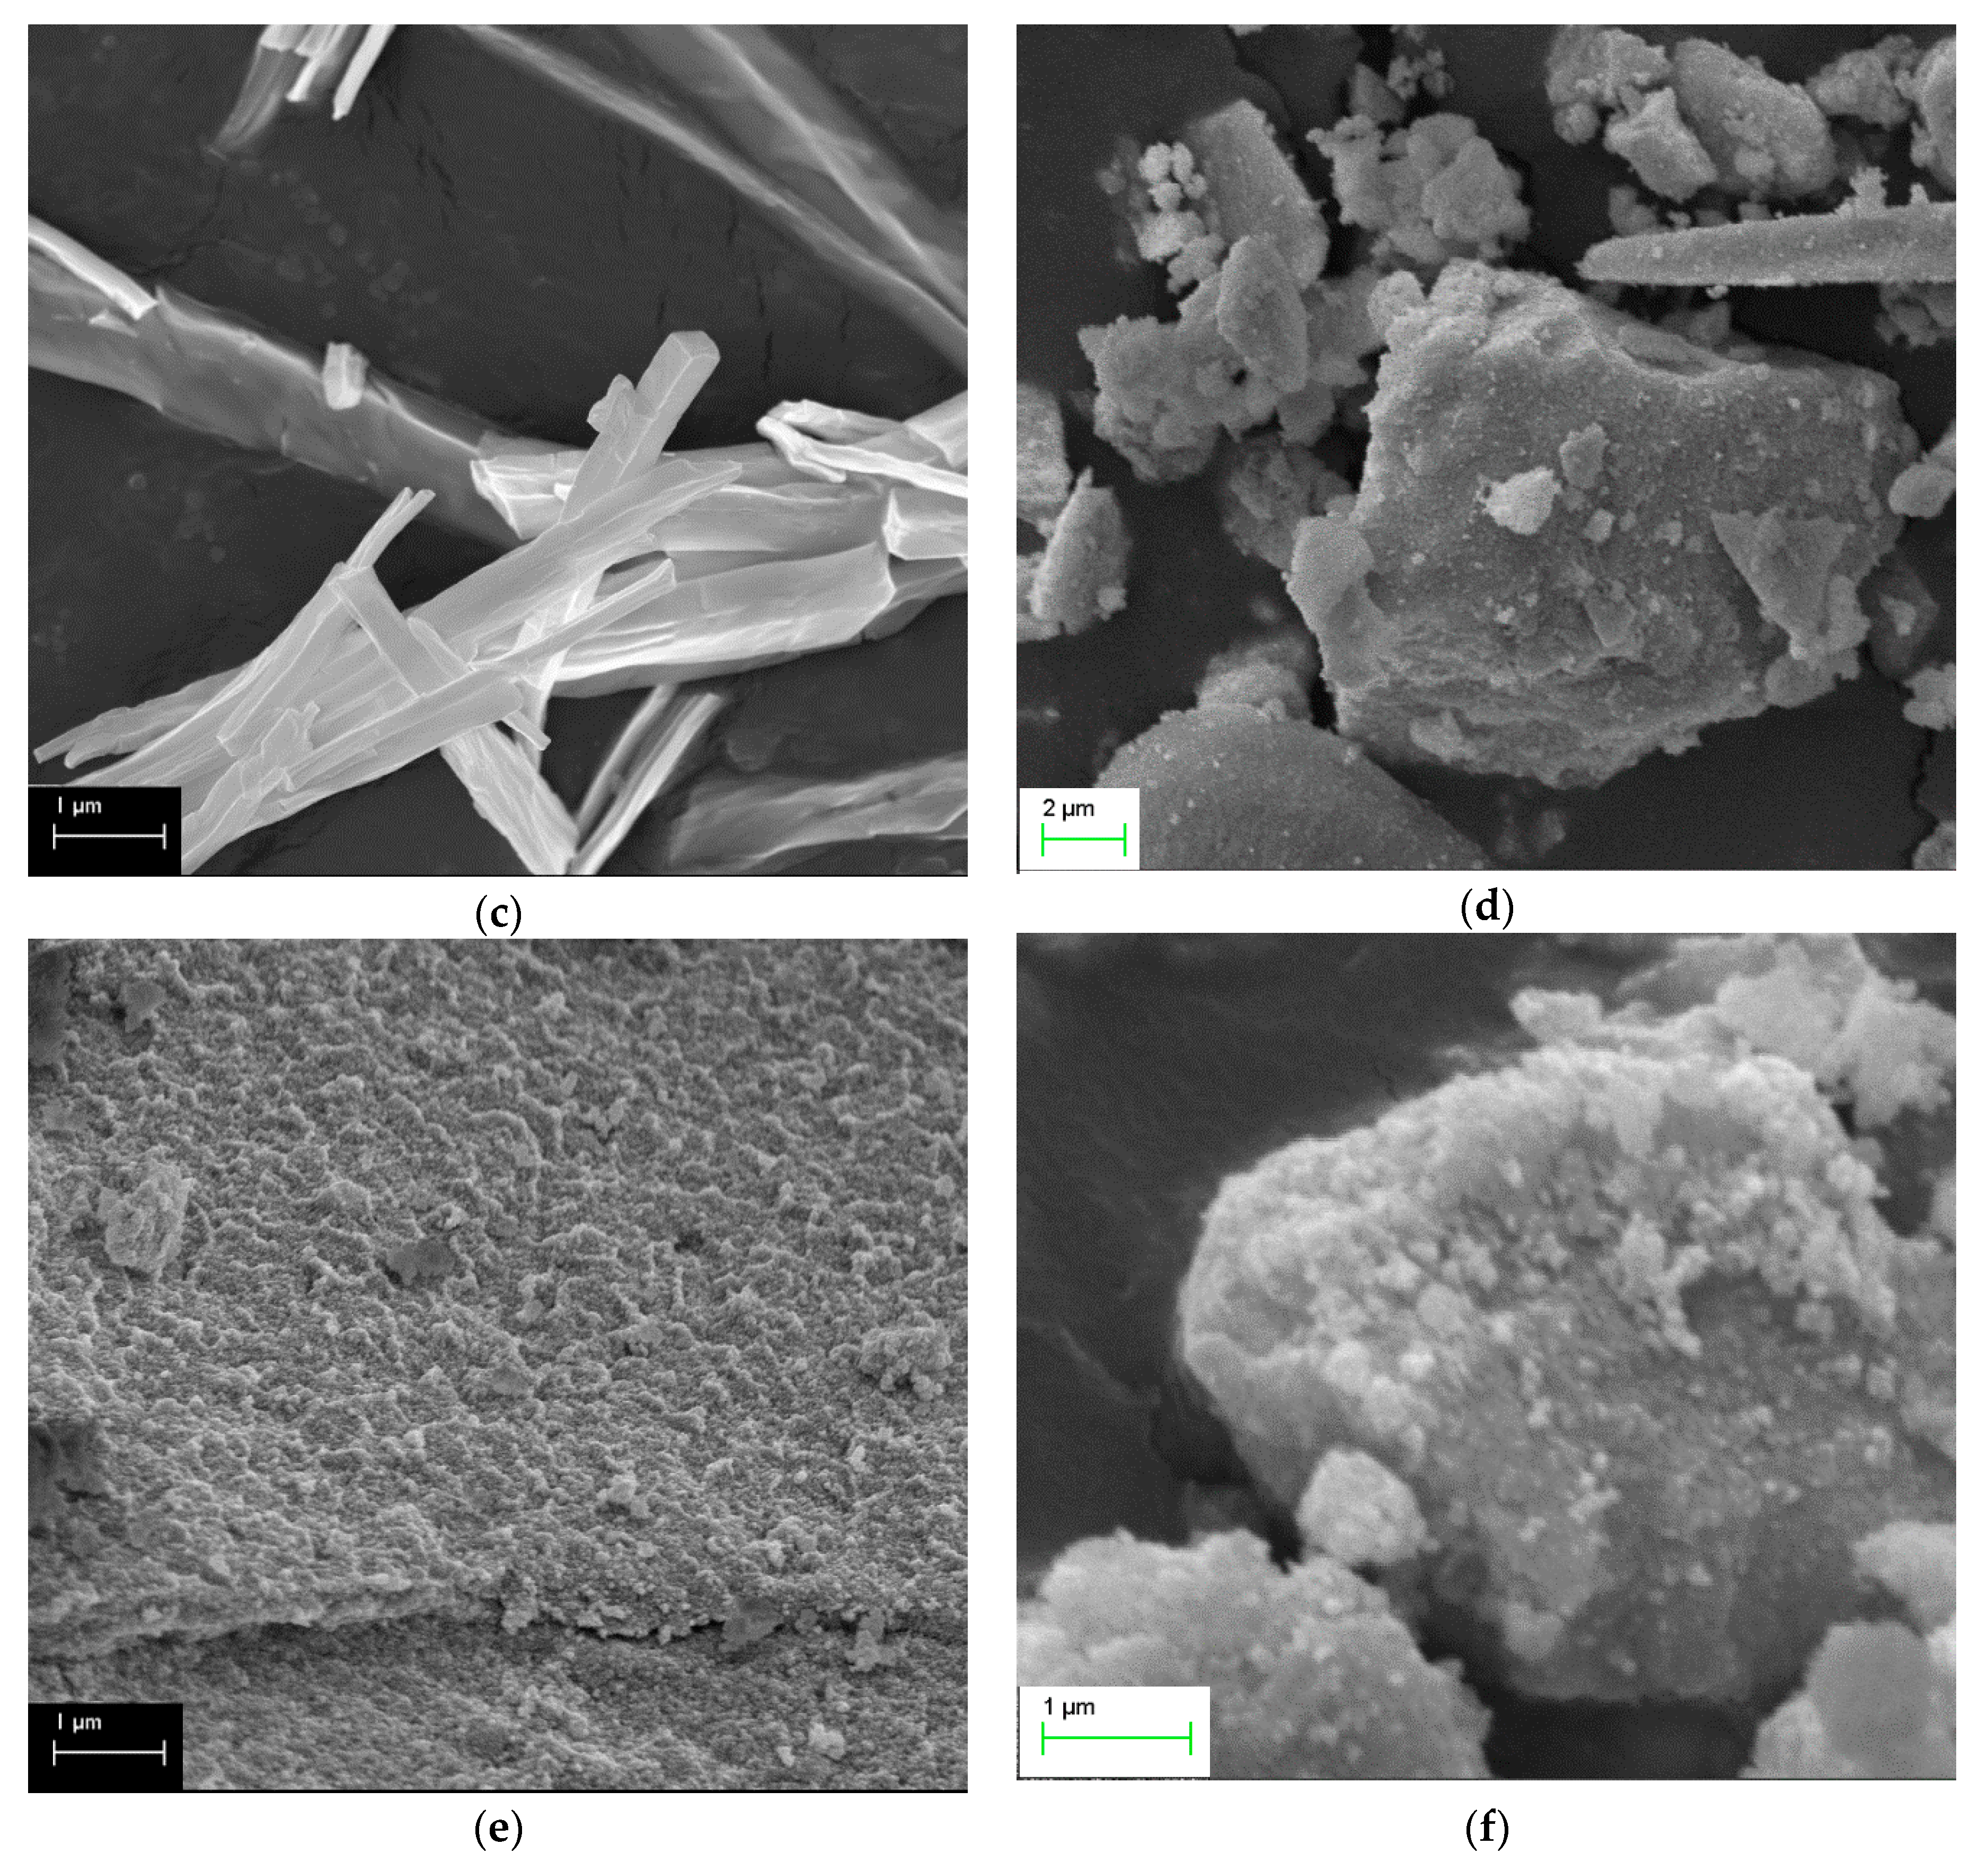
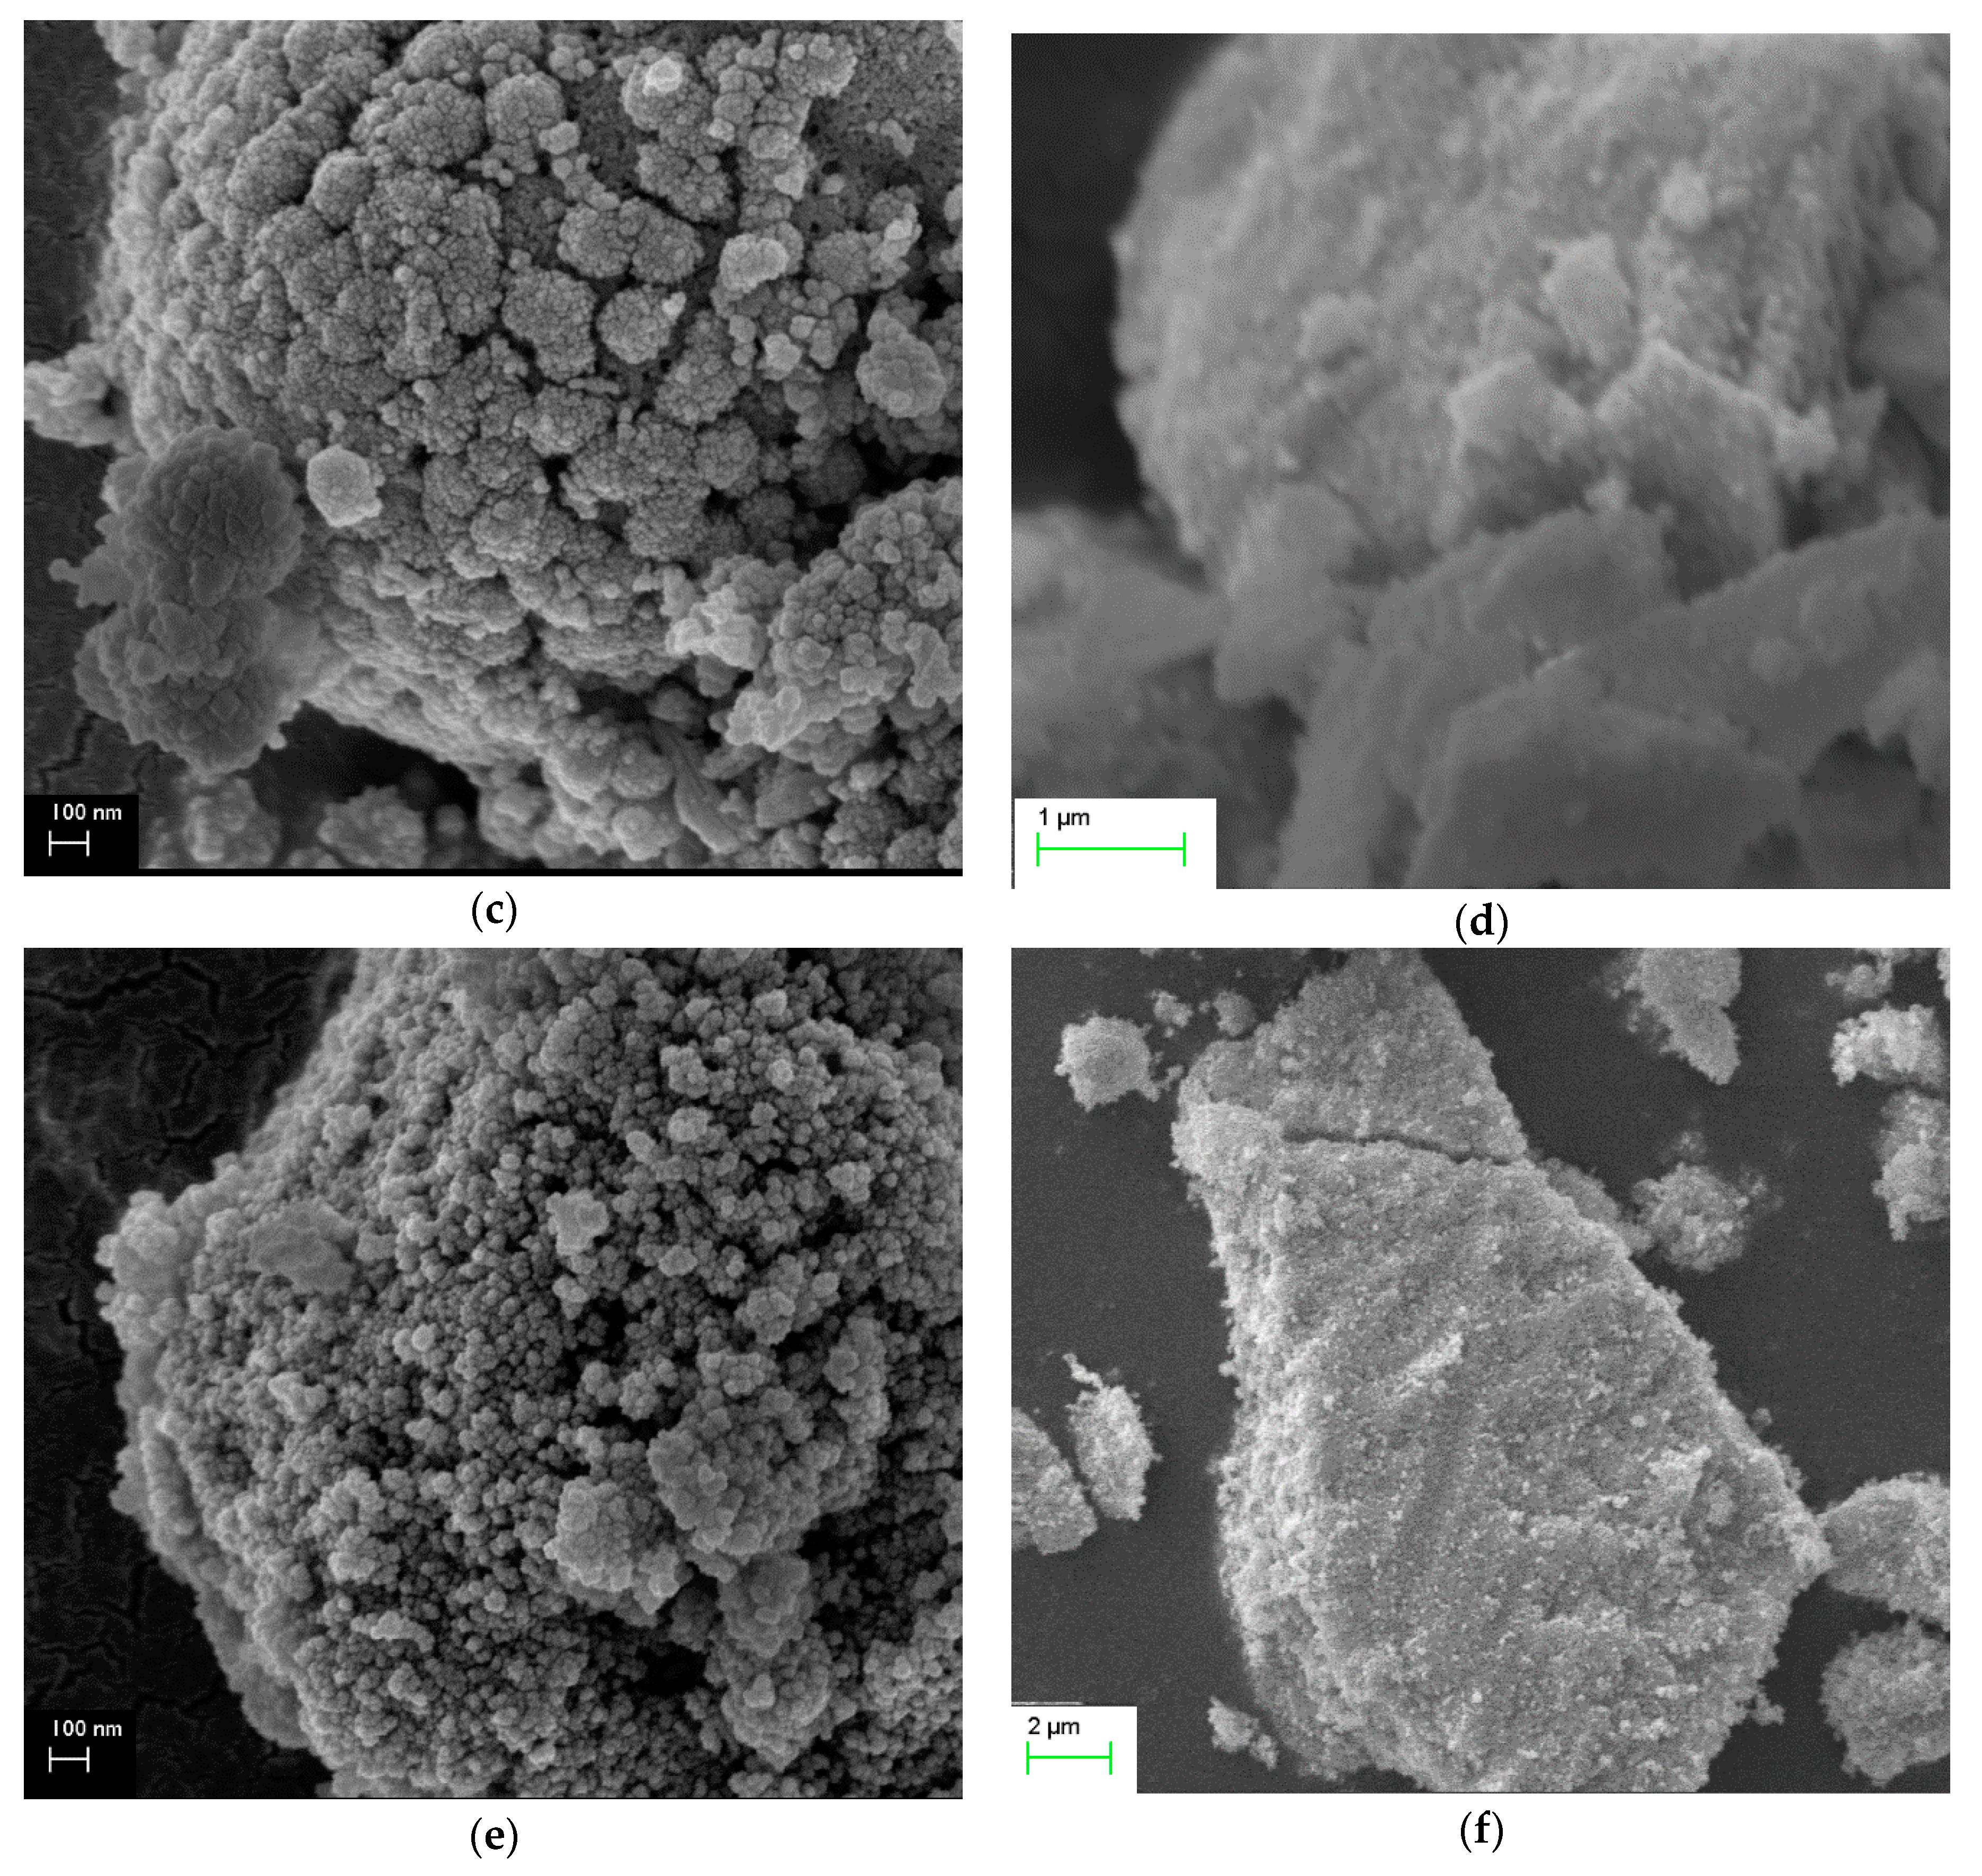
2.4. SEM Measurements

Figure 5 illustrates representatives SEM images of the materials which were hydrothermally synthesized at 120 °C. A morphology of bulk rods with various aggregates onto their surface was obtained for the Ce-120-0 sample. In the presence of NaOH, the morphology changed and spheres with a diameter of 4–8 μm were formed for the CuCe-120-0.05 sample. Spherical aggregates with a size of few hundred nanometers were formed onto this material surface. Further increases of the NaOH concentration resulted in rods with various lengths (2–10 μm) for the Ce-120-0.1 sample. No particles or aggregates can be observed on the surface of these rods, a fact that confirms the high crystallinity of the rods. These rods disappeared at elevated concentrations of NaOH, and very big aggregates with non-defined morphology were formed. In the case of hydrothermal synthesis at 150 °C, a spherical morphology dominates (Figure 6), while at high NaOH concentrations (≥ 0.5 M), bulky aggregates with particles without well-defined geometry, were formed. Figure 7 illustrates representative SEM images of the materials, which were treated hydrothermally at 180 °C. The CuCe-180-0 sample maintained the spherical morphology. The spheres composed of particles without well-defined geometry with size of ca. 70 nm. Adding low amounts of NaOH (0.05 M) resulted in a mixed morphology with rods of few micrometers, spheres and to a smaller extent sheets. All these structures contained irregular particles with an average size of a few dozen nanometers. The CuCe-180-0.1 sample appears to possess a spherical morphology, while similar structures with the lower hydrothermal temperatures were obtained at elevated NaOH concentrations (≥0.5 M).

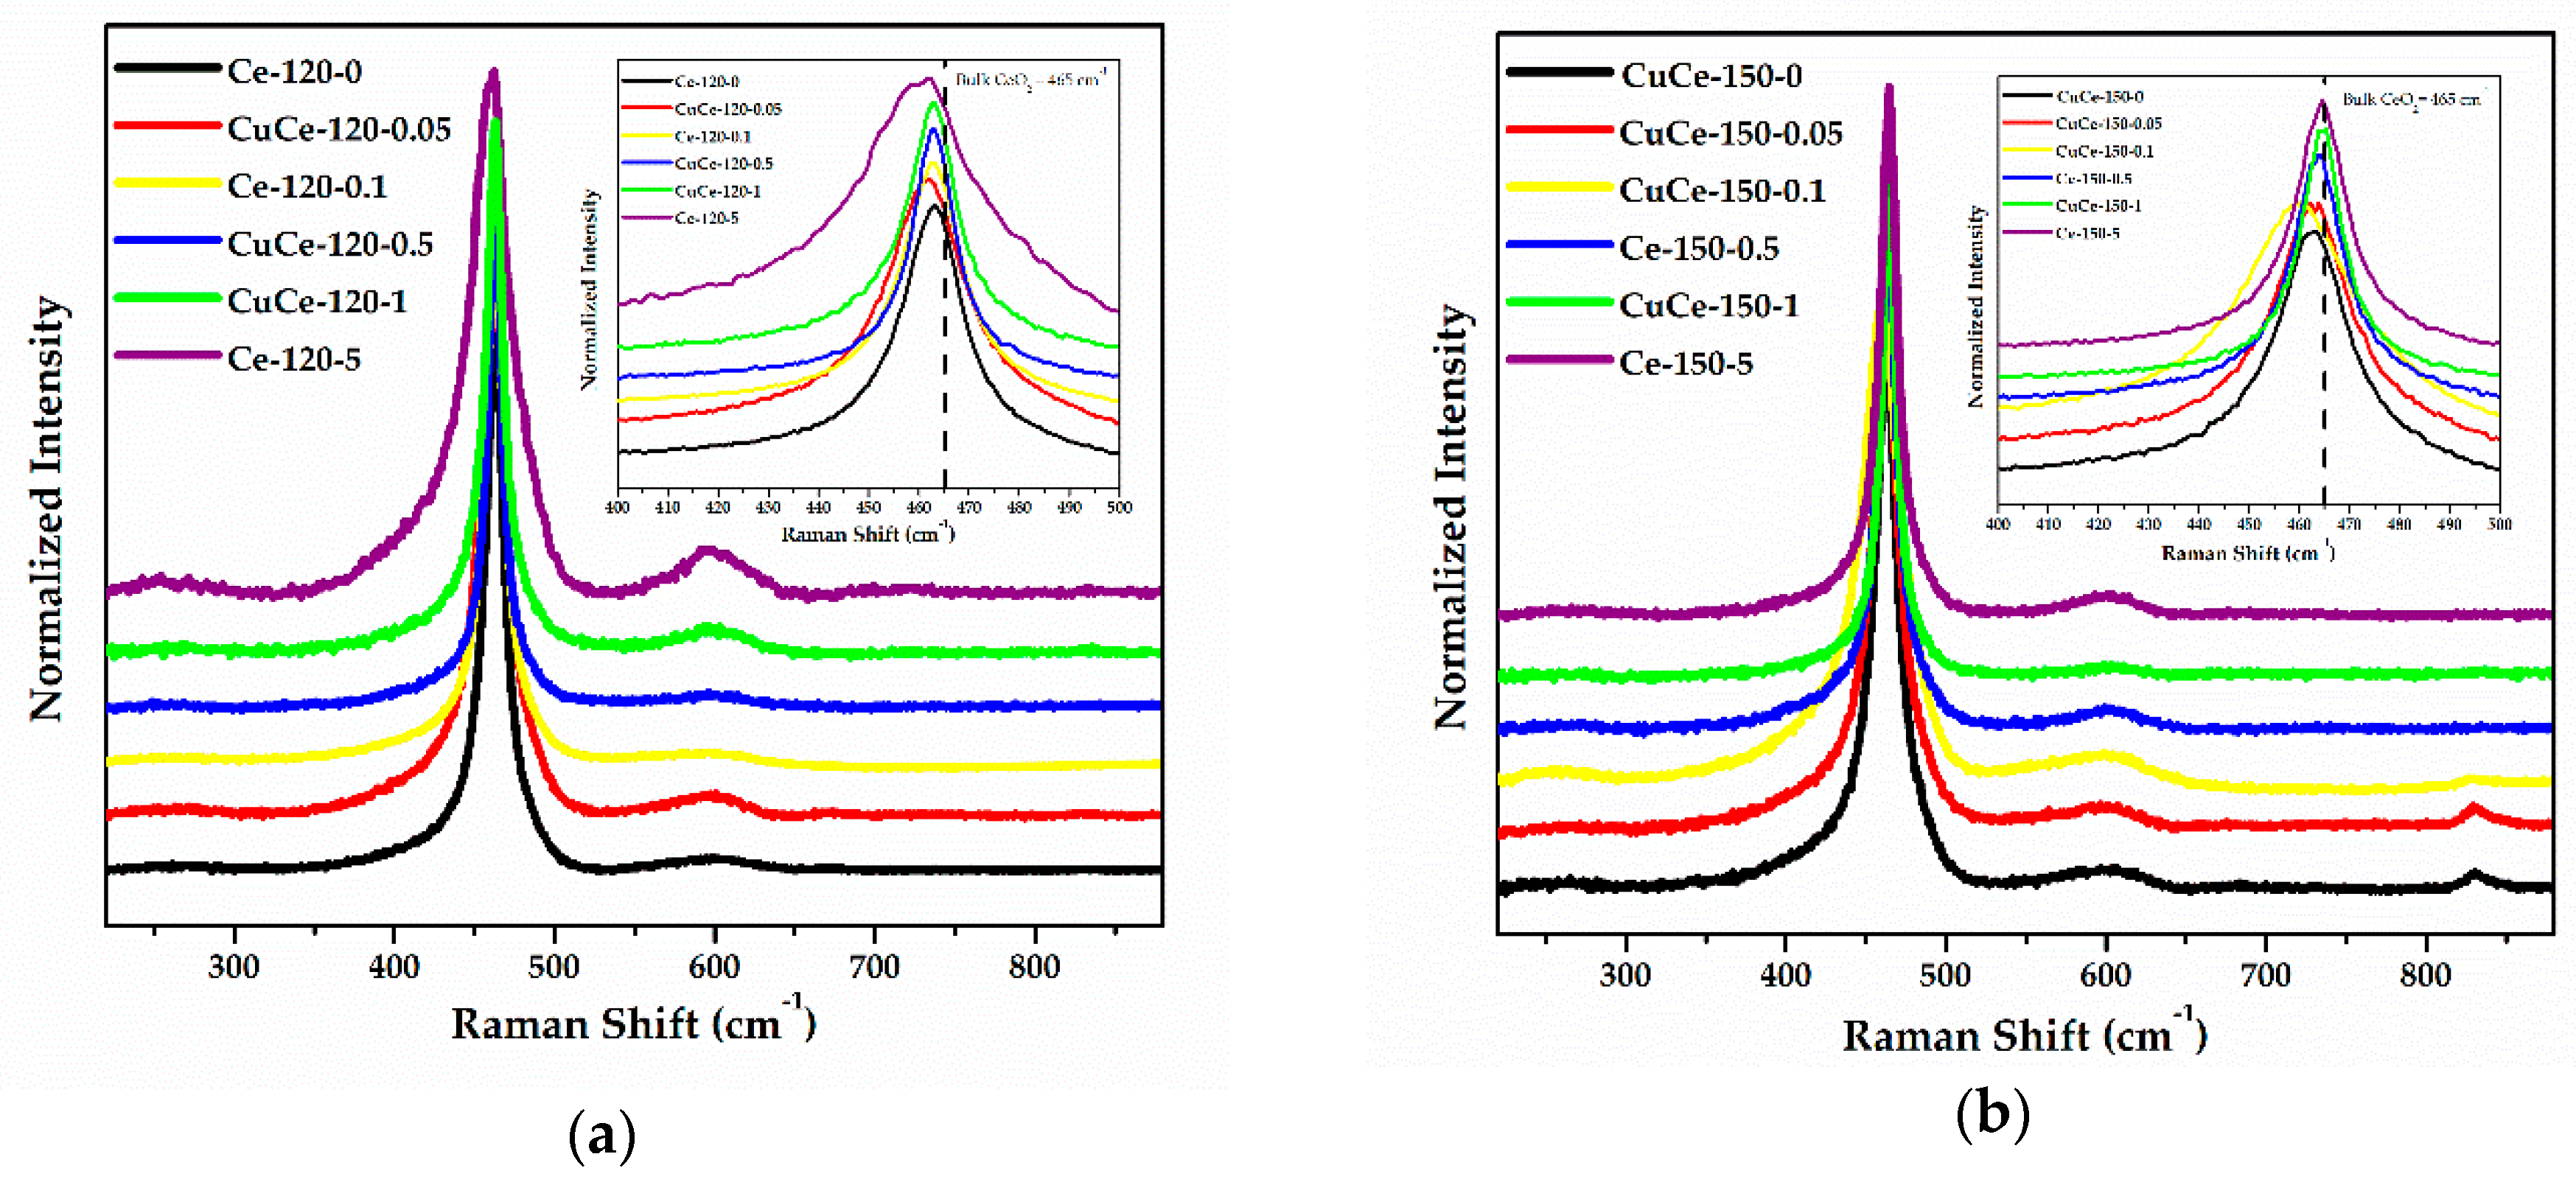
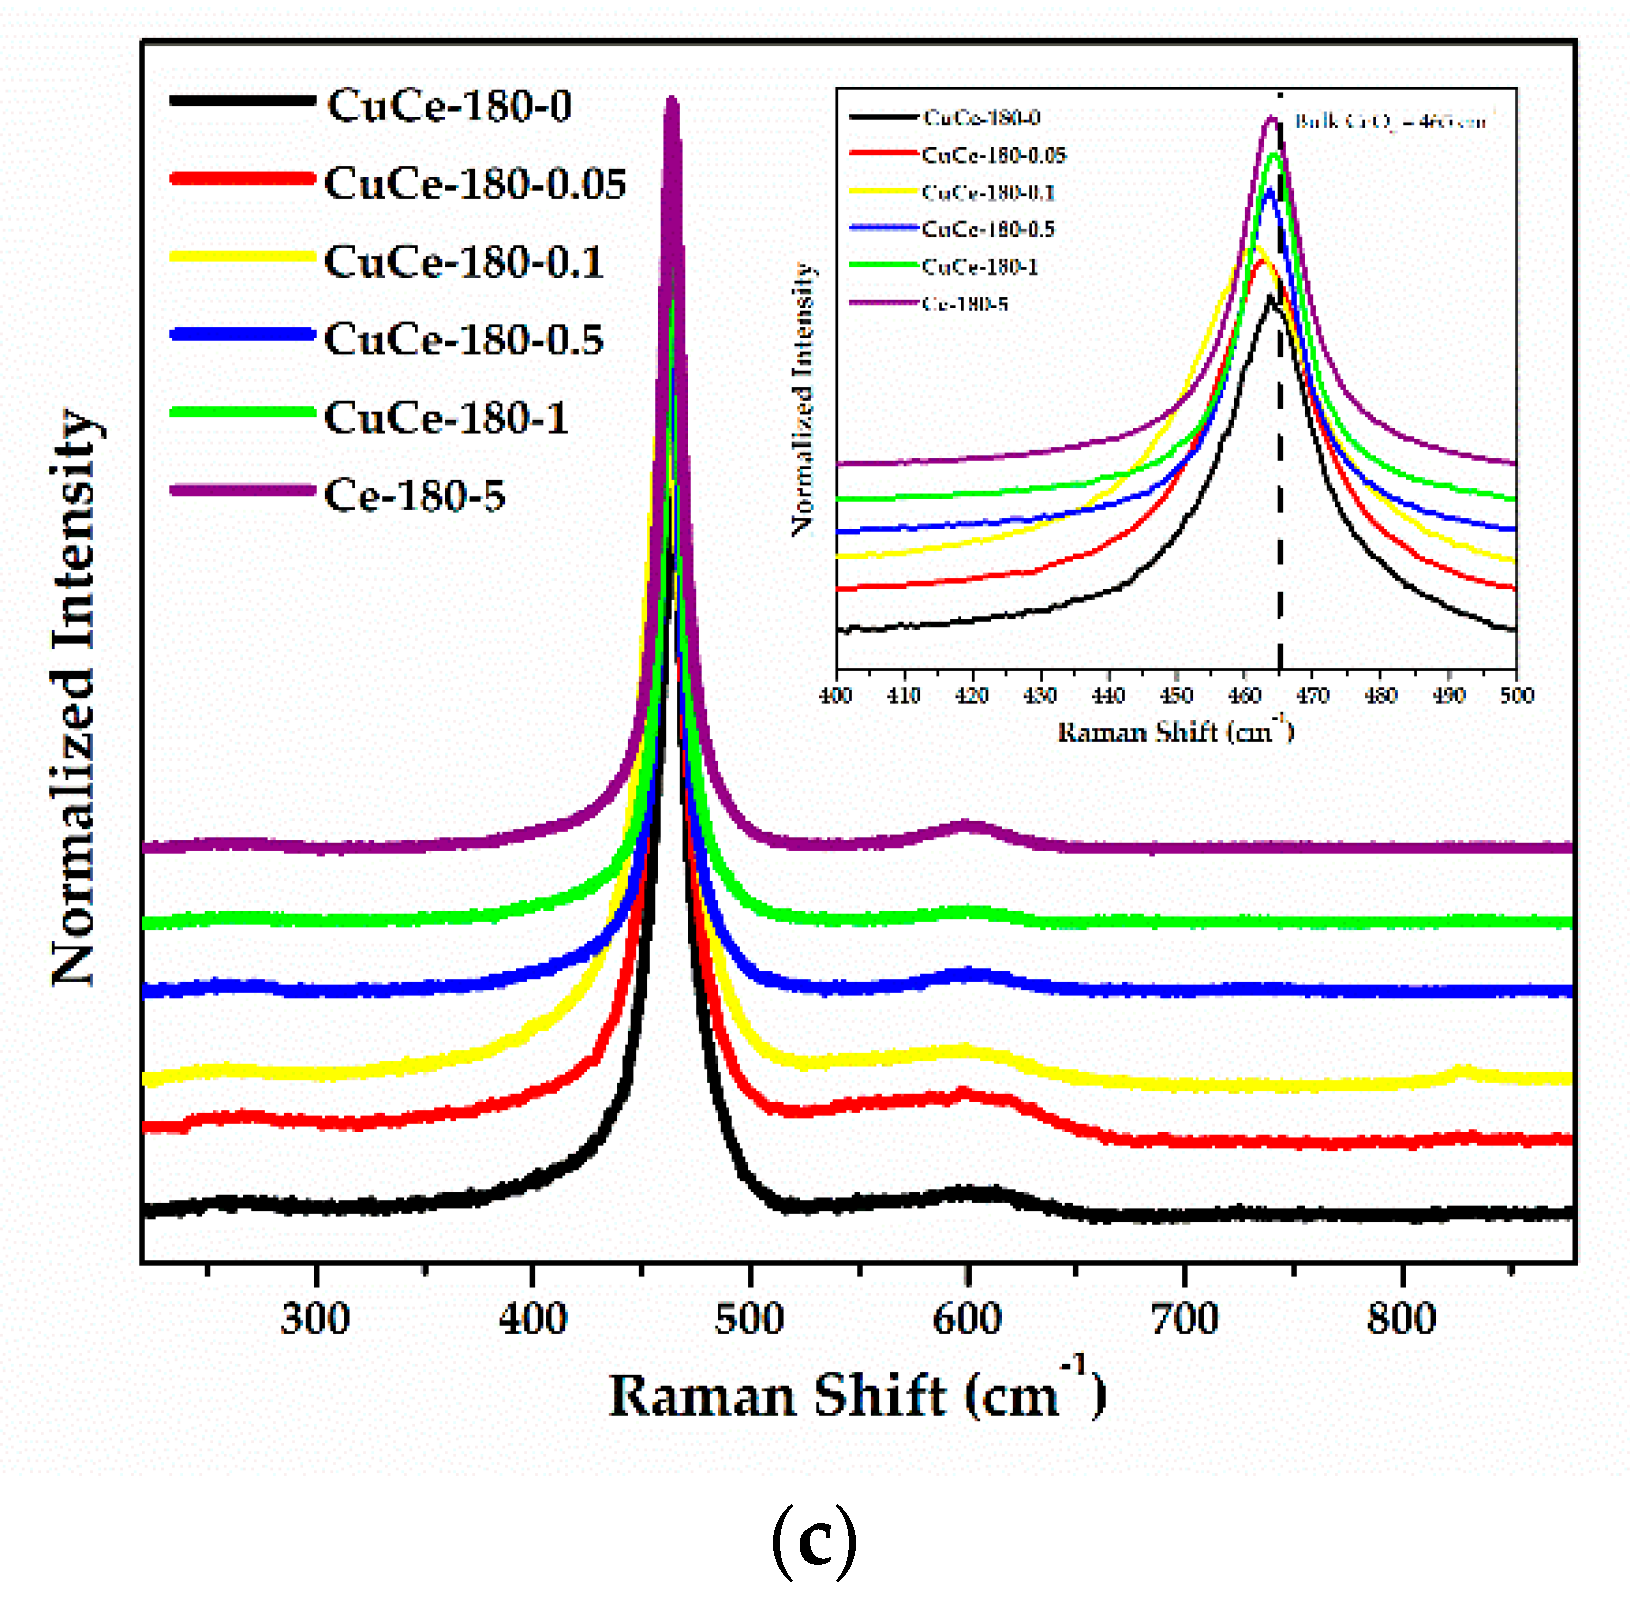
2.5. Raman Measurements

Raman spectra of all the catalysts are shown in Figure 8. Ceria presents a fluorite structure with only one allowed Raman mode, which has an F2g symmetry and can be viewed to the symmetrical stretching mode of oxygen ions around Ce4+ ions [68,69,70]. For bulk ceria, this band appears at 465 cm−1. However, a shift to lower frequencies (Table 4), together with a non-linear linewidth, can be viewed for all the samples. According to Spanier et al. [71], a large number of factors can contribute to the changes in the Raman peak position and linewidth of the 465 cm−1 peak, including phonon confinement, broadening associated with size distribution, defects, strain, and variations in phonon relaxation as a function of particle size. Apart from this main band, several other bands can be clearly distinguished in the corresponding spectra. The band at ca. 265 cm−1 is attributed to the tetrahedral displacement of oxygen from the ideal fluorite lattice [25,69,72]. The band at ca. 600 cm−1 is assigned to the defect-induced mode (D), related to the presence of lattice defects, mostly oxygen vacancies [5,42,68,73]. Noticeably, the samples synthesized at 150 °C with low concentration of NaOH (CuCe-150-0, CuCe-150-0.05, and CuCe-150-0.1) exhibit one additional band at ca. 830 cm−1. According to Choi et al. [72], this band is associated with peroxo-like oxygen species adsorbed on the oxygen vacancies, in close relation with reduced ceria species. No separated copper phase (CuO) can be confirmed via the appearance of the corresponding Raman peaks at ca. 295 cm−1 and ca. 350 cm−1. Therefore, both the XRD and Raman results clearly indicate that Cu species onto ceria are highly dispersed.
The position and the FWHM for the F2g band, and the relative intensity ratio of ID/IF2g for the ceria-based catalysts are shown in Table 4. In general, the ratio of ID/IF2g, where IF2g and ID correspond to the maximum intensity of F2g and D bands, respectively, can roughly reflect the amount of lattice defects (oxygen vacancies) in the obtained materials [72,74,75]. With appropriate tuning of the employed hydrothermal parameters, materials with high concentration of oxygen vacancies are obtained. For instance, the Ce-120-5 sample presents the highest value of this ratio, i.e., 0.106, suggesting a material with high perspectives in catalytic CO oxidation reaction. According to previous studies, the FWHM of the F2g band is influenced to a great extent by the crystallite size of ceria and the concentration of oxygen vacancies [75,76,77]. However, there is no specific trend in this work and mainly the high FWHM may be closely correlated with the high concentration of oxygen vacancies, since more factors might also play a role in these features.

2.6. UV-Vis DRS Measurements

Figure S2 presents the UV-Vis DRS spectra of the materials. Each spectrum indicates three different bands, which according to the literature correspond to different electronic transitions between cerium and oxygen ions. The band at ca. 360 nm is ascribed to the O2− Ce4+ interband-transfer transition. The bands at ca. 270 and ca. 230 nm are attributed to the O2− Ce4+ and O2− Ce3+ charge-transition, respectively [25,78]. Interestingly, the CuCe-180-0, CuCe-180-0.05, CuCe-180-0.1, and CuCe-150-0.1 samples present one extra wide band at 670 nm. It is important to mention that there is a lot of controversy about this band. According to Rakai et al. [79], this band is correlated with a surface redox couple of cerium ions (Ce3+/Ce4+). A similar band was found from Bensalem et al. [80] and Binet et al. [81]. However, there is a number of studies which ascribe this band to d-d transitions of Cu2+ in an octahedral environment [2,82,83]. It also has to be noted that, for the CuCe-150-0.1, CuCe-180-0, CuCe-180-0.05, and CuCe-180-0.1, catalysts a shoulder appears in the spectra at ca. 400–500 nm. This feature represents the charge transfer between “Support ← Oxygen—Active Phase”, suggesting strong interactions between the copper species and ceria [43,44].
The energy band gap (Eg) of the catalysts, calculated via the Tauc plots method, is summarized in Table 4. Taking into account the reference value for the bulk CeO2 as a direct band gap semiconductor (Eg = 3.19 eV), the obtained values of the ceria-based materials, especially the ones synthesized with low concentrations of NaOH (≤0.1 M), are smaller than the energy band gap of bulk ceria. On the other hand, the catalysts prepared with higher concentrations of NaOH (≥0.5 M) resulted in a higher value of Eg. The former values indicate the presence of defects and especially oxygen vacancies [26,84], while the latter values of Eg are closely related to the quantum confinement effect [77,85].

2.7. Formation Mechanism

Over the years, the utilization of organic additives such as polyvinylpyrrolidone (PVP) [86], cetyltrimethylammonium bromide (CTAB) [87] and oleic acid [88] has been established in the hydrothermal method in order to obtain well-defined particles and morphologies. However, due to adsorption effects on the surface of particles these additives lead to quenching because of their high-energy vibration [89]. Compared with the above surfactants, citric acid (CA) presents weaker morphology control ability. Therefore, when the citric acid is used as a chelating agent, products with various morphologies and sizes can be obtained [90,91].
According to Levien [92], citric acid separates into different ionic species:
H 3 cit   ( citric   acid ) H + +   H 2 cit ,   ( pK α =   3.2 ) ,
H 2 cit   H + +   Hcit 2 ,   ( pK α =   4.9 ) ,
Hcit 2   H + +   cit 3 ,   ( pK α =   6.4 ) ,
The concentrations of these ionic species are closely depended on the pH value. In an acid solution (ca. pH = 2) the citric acid is not effectively dissociated to citric ions. Further increase of pH at values of 4, 6, and 8, the main citric species are the H2cit, Hcit2− and cit3−, respectively. The citric ions can form complexes with the cerium ions, which are depended on the pH of solution [93].
The pH values from each step of synthesis route are illustrated in Table 5. It can be observed that the low concentrations of NaOH (≤0.1 M) did not increase the pH of the final solution (acid solution). As a result, the citric acid was not effectively dissociated, as there were H3cit and H2cit species in the final solution. Concerning the partial dissociation of citric acid, it is not possible to form several and stable complexes with the cerium ions under ambient conditions. On the other hand, the high concentrations of NaOH (≥0.5 M) caused the formation of an alkaline solution. Under these conditions, the citric acid has been completely dissociated and can form several and stable complexes with the cerium ions, even under ambient conditions.
It is believed that the increase of the temperature (from room temperature to the desired hydrothermal temperature) ensures the complete complexation of citric ions with the cerium ions [93,94,95], while the formed complex is polymerized and becomes stable in the solution. As the hydrothermal treatment proceeds the elevated pressure and temperature triggers the appearance of two events:
  • The weakening of the complex stability and precipitation of the latter as hydroxide into the solution.
  • Depending on the hydrothermal parameters, the leaching and migration of copper species from the copper ring to the solution where their deposition in the ceria phase is taking place.
The final catalyst is obtained after the steps of filtration, drying, and calcination.
Concerning the various morphologies which are illustrated in Figure 5, Figure 6 and Figure 7, it is proposed that the successful combination of hydrothermal parameters (temperature and concentration of NaOH) is the main reason behind these morphologies. It has been mentioned in Section 2.4 that the combination of low concentrations (≤0.1 M) and hydrothermal temperatures caused the formation spheres and/or rods. Given that the pH of the solution at these specific concentration was acidic, Ostwald Ripening seems to be the most dominant particle’s formation mechanism [96,97,98]. Once the particles have been formed, a process of self-organization starts to happen, which results in a spherical and/or rod-like morphology depending on the hydrothermal parameters. On the other hand, the high concentrations of NaOH (≥0.5 M) and the hydrothermal temperatures resulted in the formation of bulky aggregates consisting of particles with a spherical and/or irregular geometry. At these conditions, the pH of the solution was alkaline and so the proposed formation mechanism of particles appears to be the oriented attachment [87,99]. Once the formation of particles has been completed, self-organization process initiates, but simultaneously the excess of OH groups and the hydrothermal temperatures cause the formation of bulky aggregates.

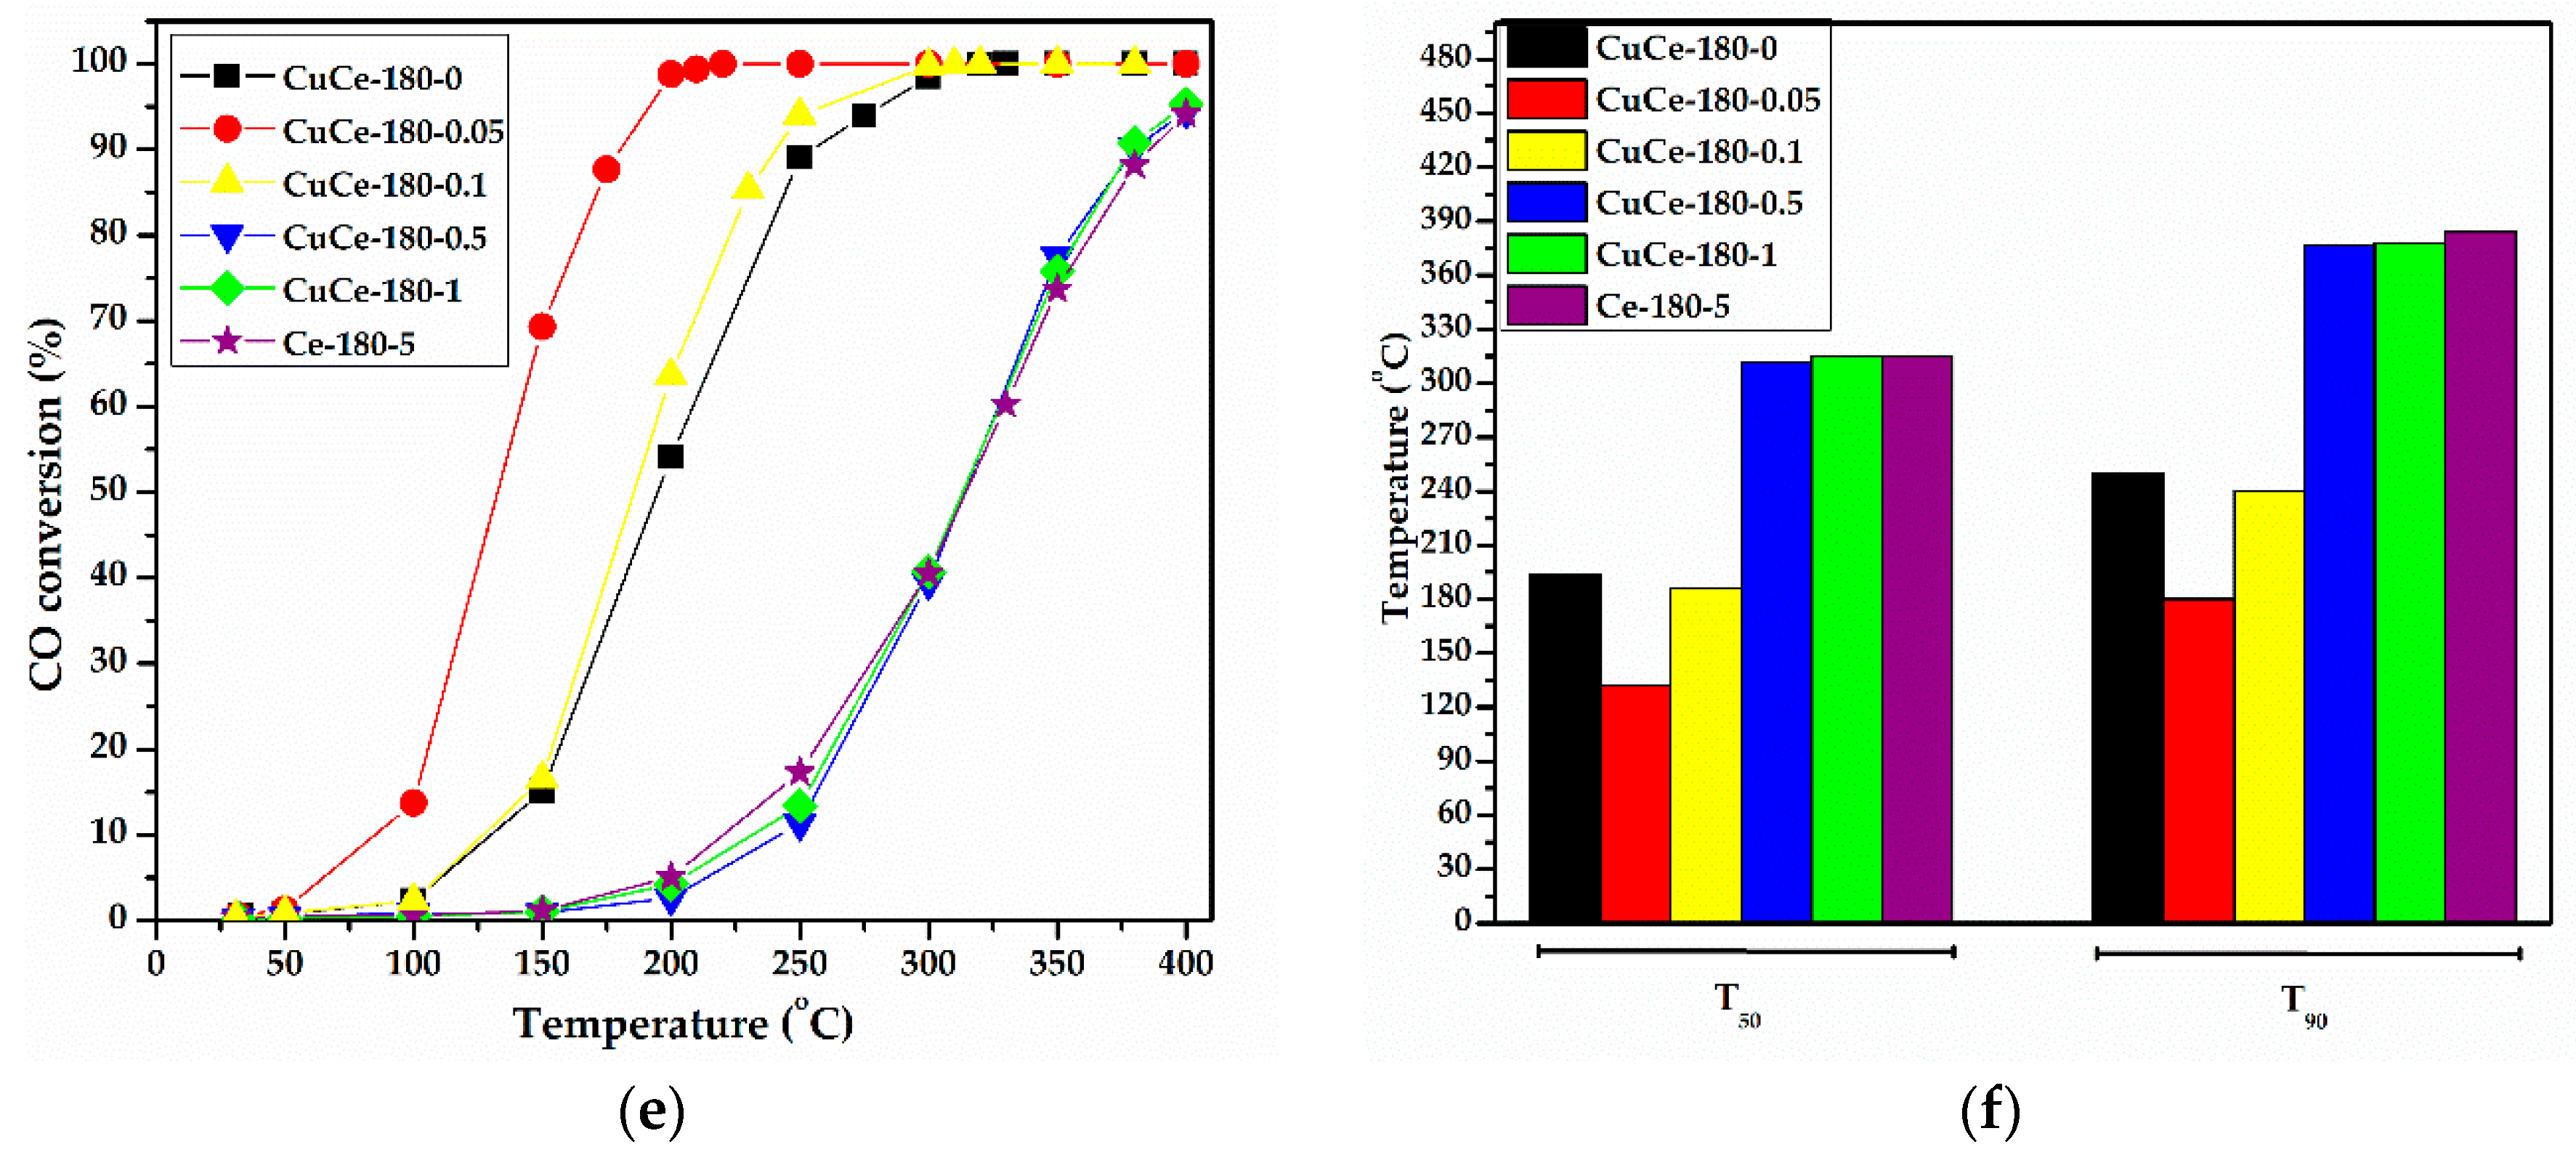
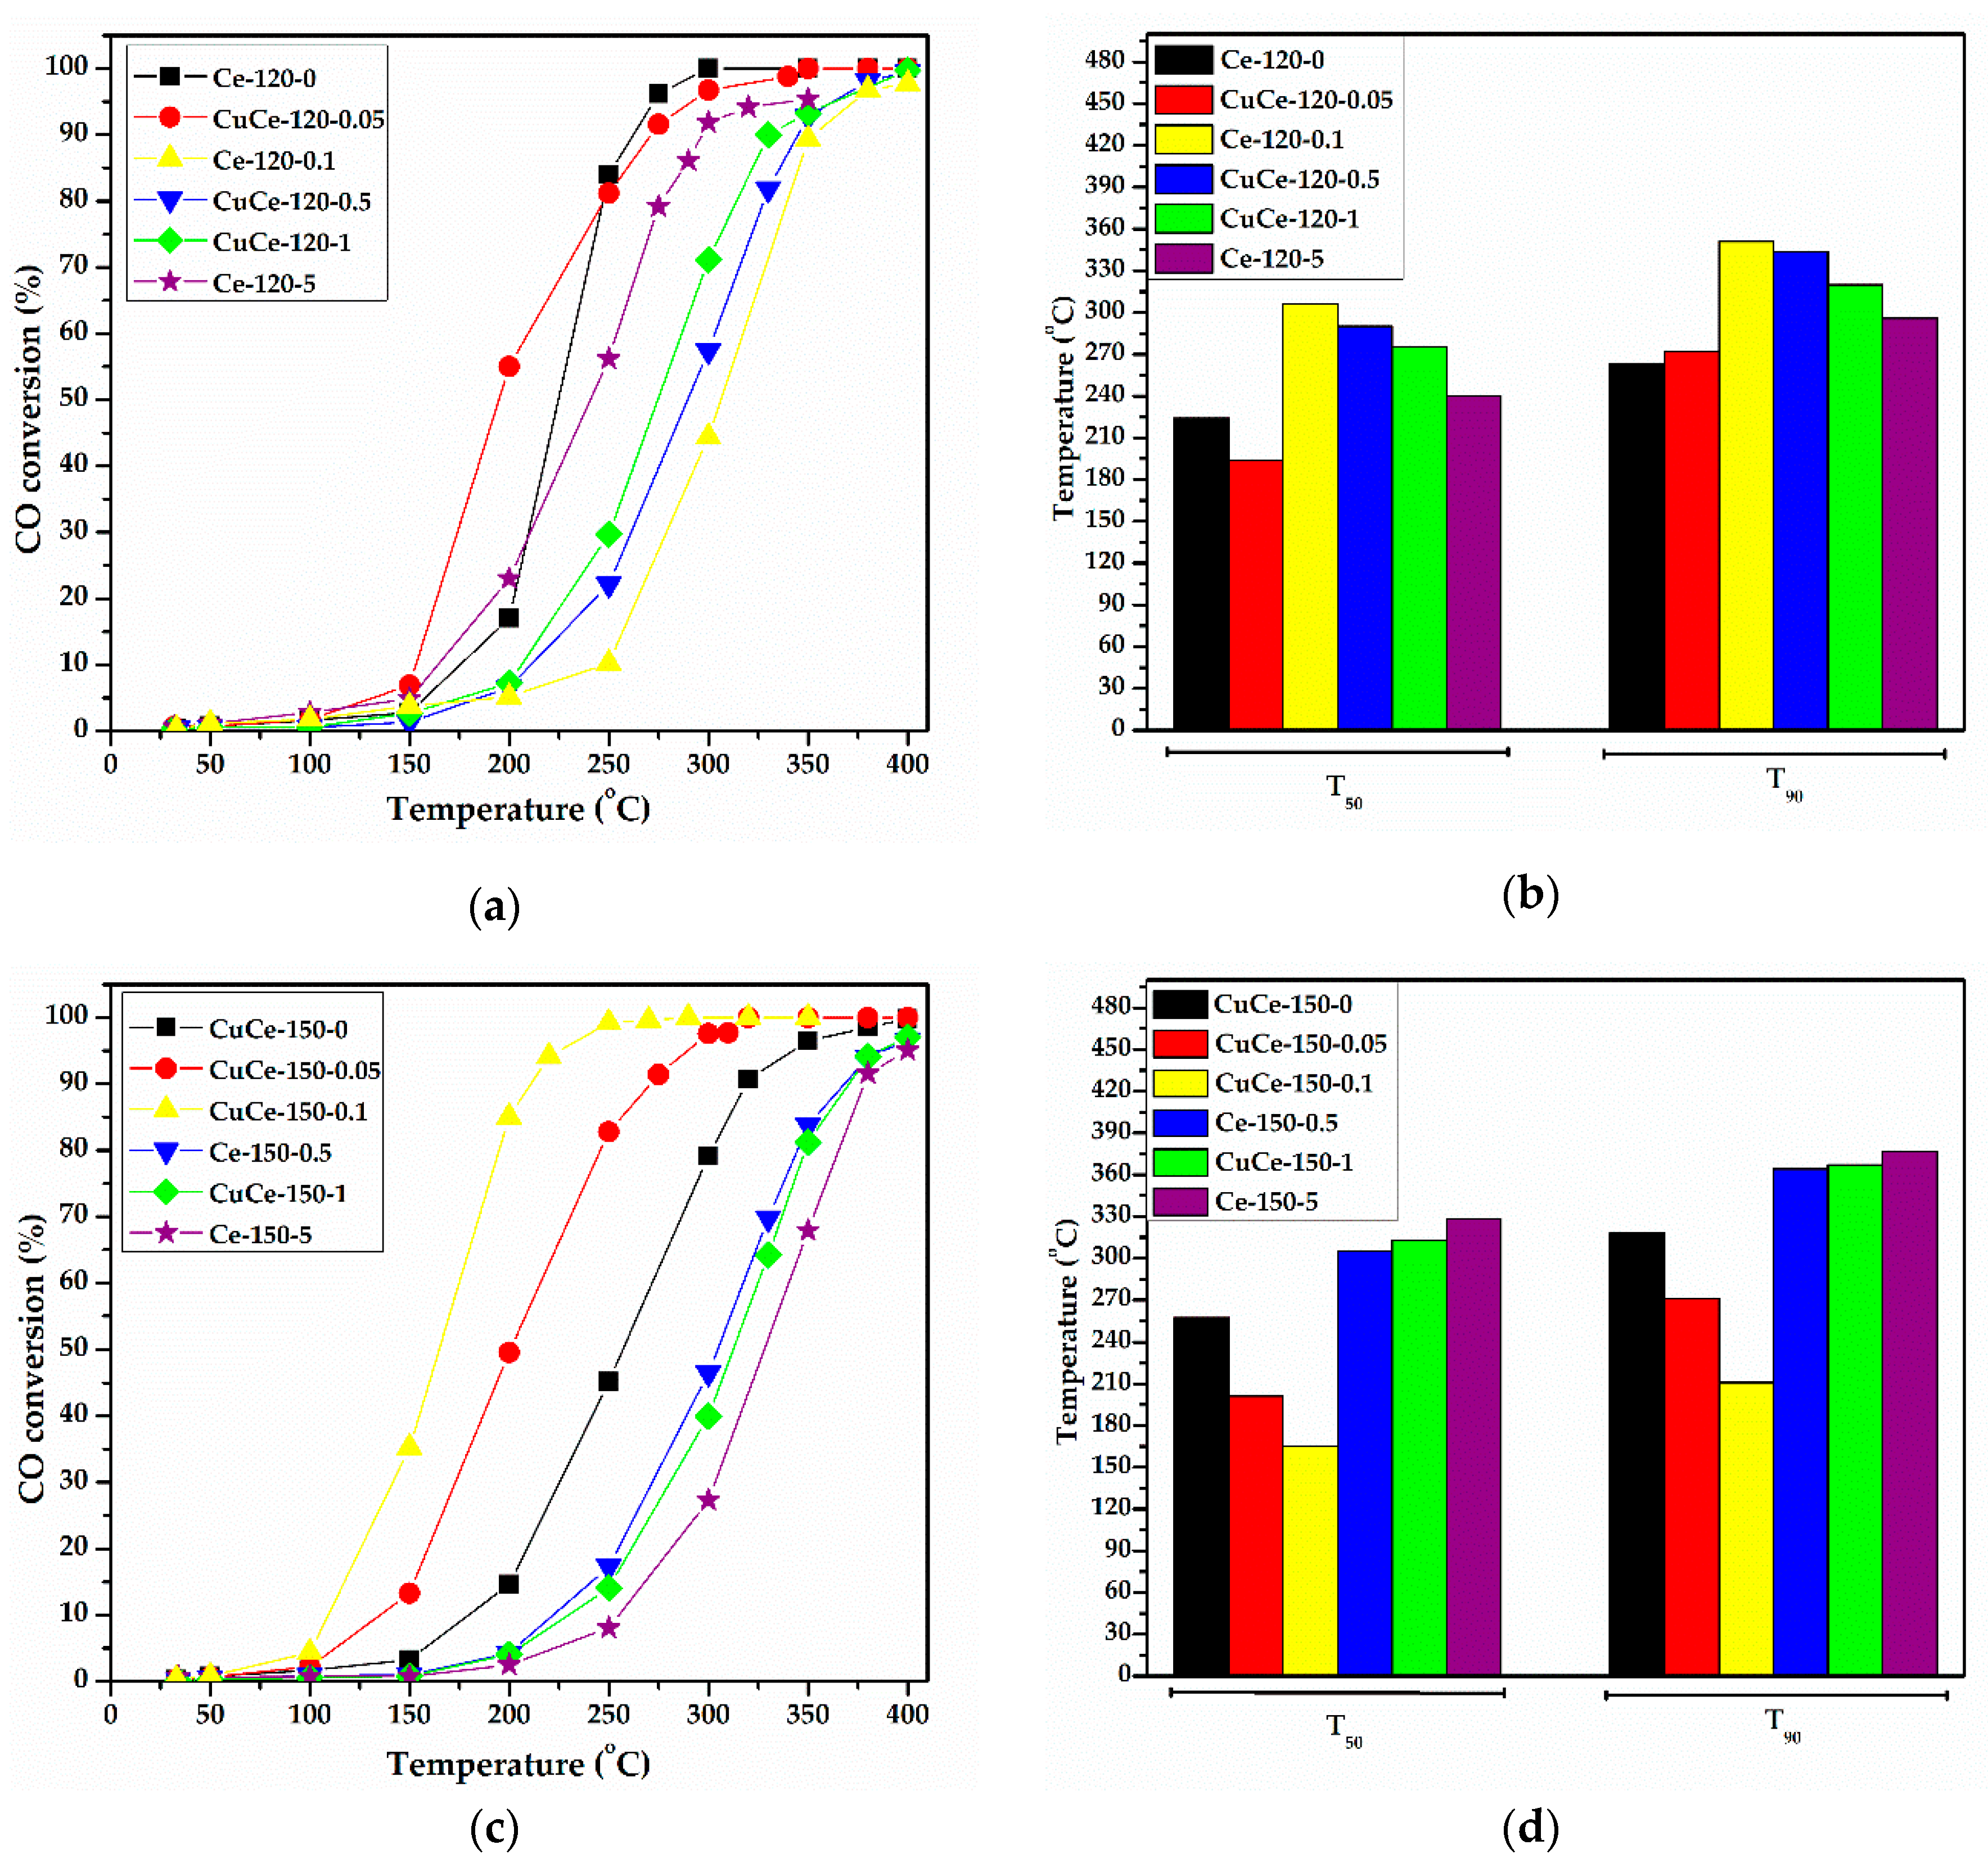
2.8. CO Oxidation Catalytic Studies

The conversion of CO to CO2 as a function of the temperature of the reaction over the ceria-based catalysts is shown in Figure 9. As a general trend, it can be commented that the catalysts prepared with low concentrations of NaOH (≤0.1 M) and contained Cu2+ species onto their surface, presented better catalytic behavior than the catalysts which were hydrothermally treated with high concentrations of NaOH (≥0.5 M). Noticeably, the latter catalysts illustrated a significant amount of surface Ce3+ ions (see Table 1), which is usually correlated with high catalytic activity. However, this is not the case in this work and other factors control the catalytic activity, as will be discussed in the next section.
An indicator of the catalytic activity behavior are the temperatures where 50% and 90% CO conversion is achieved (T50 and T90, respectively) (Figure 9). For the samples treated hydrothermally at 120 °C, it can be seen that the most active catalysts are the CuCe-120-0.05 and the Ce-120-0, presenting T50 equal to 194 °C and 224 °C, respectively, and T90 equal to 272 °C and 263 °C, respectively. Additionally, the above samples achieved full removal of CO. The less active sample was the Ce-120-0.1, which revealed a T50 at 306 °C and T90 at 351 °C. One possible explanation for the poor catalytic activity of this sample is its morphology, which presented rods with high crystallinity. Increasing the concentration of NaOH (≥0.5 M), the catalytic activity of the samples was improved, but it cannot be comparable with the activities of the CuCe-120-0.05 and Ce-120-0. The morphology of the samples prepared with high concentrations of NaOH (see Figure 5) seems to influence the catalytic activity in a negative way. Moreover, although the sample Ce-120-5 illustrated the highest SSA among all catalysts (see Table 3), this is not related to the achievement of high catalytic activity.
The catalytic activity of the samples synthesized at 150 °C, was dramatically improved, especially for NaOH concentrations ≤0.1 M, reaching in some cases 100% of CO conversion. For instance, the CuCe-150-0 sample presents a T50 at 257 °C and the sample CuCe-150-0.1 shows T50 at 165 °C. It should be mentioned that the former sample contained Cu2+ isolated ions dispersed in ceria, as confirmed via EPR spectroscopy, while the latter sample presented Cu2+ clusters onto ceria surface. Higher reactivity of Cu2+ clusters than Cu2+ isolated ions, was also reported by Harrison et al. [39]. Higher concentrations of NaOH (≥0.5 M) resulted in catalytic materials with poor activity.
Similar trends can be also depicted in the catalytic behavior of the materials synthesized with a hydrothermal temperature of 180 °C. Overall, the highest catalytic activity was achieved over the CuCe-180-0.05 sample which present in Figure 9, T50 and T90 at 132 °C and 180 °C, respectively. The rod-like morphology, the presence of high-content Cu2+ clusters (see Table 1) and high concentration of oxygen vacancies (see Table 4) seems to be the crucial reasons behind this extraordinary catalytic activity. It is noteworthy that the CuCe-180-0.05 as both CuCe-180-0 and CuCe-180-0.1 illustrated 100% conversion of CO. On the other hand, the samples that were prepared with high concentrations (≥0.5 M) presented similar catalytic behavior with the samples hydrothermally treated at 120 °C and 150 °C.

3. Discussion

Correlation of the Physicochemical Characteristics with the Catalytic Activity

Taking into consideration both the physicochemical characterization and catalytic evaluation, it can be proposed that the high catalytic activity is controlled by the successful combination of specific materials characteristics such as the morphology, oxygen vacancies, and type of copper entities. The specific surface area seems to be the feature with less impact in order to achieve high activity. More specifically:
  • The most active samples presented spherical and/or rod-like morphology (samples with concentrations of NaOH ≤0.1 M), which was attributed to the effective combination of hydrothermal parameters. Exception to this trend was the sample Ce-120-0.1, which illustrated rods with high crystallinity. The bulky aggregates which, were revealed by the samples with high concentrations (≥0.5 M), seemed to negatively affect the catalytic activity.
  • While the samples with high NaOH concentrations (≥0.5 M) showed high SSA, they could not compete the activities of the samples prepared with low concentrations of NaOH (≤0.1 M). In general, the high SSA is a desirable parameter for enhanced catalytic activity, but in our work, it is not a determining factor, as the observed catalytic performance is a combination of the copper content, copper species nature, morphology, oxygen vacancies and Cu-Ce interactions.
  • Two different copper species were detected in ceria-based materials, which promoted the catalytic activity. This effect was more pronounced in the case of Cu2+ clusters as compared with the effect caused by the presence of Cu2+ isolated ions. The former species were favored under high hydrothermal temperatures and low NaOH concentrations.
  • The presence of lattice defects and especially oxygen vacancies, which were certified by the spectroscopic techniques, affected the catalytic behavior, but not following a conventional trend. As shown via EPR spectroscopy, the catalysts, which were prepared with high concentrations of NaOH (≥0.5 M), presented a high concentration of Ce3+ ions (see Table 1), they did not result in a high catalytic activity. On the other hand, the samples with low concentrations of NaOH (≤0.1 M), although possessing small concentrations of Ce3+ ions, they exhibited better catalytic behavior. Strong copper-ceria concentrations were confirmed via DRS analysis for several samples prepared at 150 and 180 °C with low concentrations of NaOH. Conclcuding the above remarks, it can be commented that the formation of a high-defective structure is not a crucial factor for high catalytic activity, but the formation of a structure that will have a suitable concentration of oxygen vacancies. Similar results have been illustrated by Lin et al. [99]. Pulse calorimetry measurements showed that the high concentration of oxygen vacancies promoted the buildup of adsorbed carbonates that prohibit the adsorption and activation of CO, but not O2. According to several studies, oxygen vacancies tend to form oxygen vacancy clusters [100,101]. Wang et al. [102] showed that oxygen vacancy clusters with suitable size and distribution are responsible for high activity. Thus, it is believed that the various morphologies, which were obtained in this study, can present oxygen vacancies with different size and distribution.

4. Materials and Methods

4.1. Catalysts Preparation

All the chemicals used in this work were of analytical reagent grade. Cerium(III) nitrate hexahydrate Ce(NO3)3 ∙ 6H2O (purity 99.99%, Sigma-Aldrich) and a pure metallic copper ring were used as precursors for the preparation of ceria and copper-promoted ceria nanomaterials. Moreover, citric acid monohydrate C6H8O7 ∙ H2O (purity 99.5–101.0%, Ing. Petr Švec PENTA, Prague, Czech Republic) and sodium hydroxide NaOH (purity ≥98.0%, Ing. Petr Švec PENTA, Prague, Czech Republic) were also employed in the synthesis procedure as a chelating agent and precipitating agent, respectively.
At first, 3.7834 gr of Ce(NO3)3 ∙ 6H2O and 1.8314 gr of C6H8O7 H2O were dissolved under continuous stirring into 15 mL of triple distilled (3D) water, respectively. The molar ratio of citric acid to metal nitrate was adjusted according to the stoichiometry of the reaction (citric acid/Ce = 1/1). When the dissolution of the compounds was completed, the two aqueous solutions were mixed under continuous stirring, while at the same time, a 150 mL aqueous solution of NaOH (CNaOH = 0–5 M) was prepared. Both solutions were mixed in a Teflon beaker, and this mixture was kept under stirring for 20 min. The Teflon beaker was placed in a lab-made stainless-steel autoclave (chamber volume of 200 mL), where the copper ring was placed over the beaker (not immersed into the solution). The autoclave was sealed tightly and heated at various temperatures (120, 150, and 180 °C) for 24 h. After the hydrothermal treatment, the autoclave was opened, excess water was decanted, and the precipitates were filtered, washed several times with triple distilled water (until pH = 7), and dried under vacuum at 70 °C overnight. Finally, the obtained powders were calcined at 400 °C for 2 h (heating ramp = 2 °C min−1).
In order to facilitate the presentation of results, the following encoding of catalysts is used: Ce-T-M and CuCe-T-M, where T represents the temperature (°C) of the hydrothermal reaction and M the molarity of NaOH (M). For example, the Ce-120-5 catalyst was synthesized hydrothermally at 120 °C, using 5 M NaOH.

4.2. Catalysts Characterization

An X-ray powder diffractometer (Bruker D8 Advance, Bruker, Birmingham, UK) employing Cu Ka radiation (λ = 0.15418 nm) at 40 kV and 40 mA was used to analyze the crystalline structure of the catalysts.
The specific surface area (SSA), the pore volume and the pore size distribution of the materials were determined from the adsorption and desorption isotherms of nitrogen at −196 °C using a TriStar 3000 Micromeritics instrument (Norcross, GA, U.S.A). Prior to the measurements, the samples were outgassed at 150 °C for 1 h, under N2 flow.
The morphology of the obtained materials was observed with scanning electron microscopy (SEM, Leo Supra 35VP (Carl Zeiss SMT AG Company, Oberkochen, Germany).
Raman spectra were accumulated with the 441.6 nm laser line as the excitation source emerging from a He–Cd laser (Kimon). The scattered light was analyzed by the Lab-Ram HR800 (Jobin-Yvon, Horiba, Montpellier, France) micro Raman spectometer at a spectral resolution of about 2.0 cm−1. A microscope objective with magnification 50× was used to focus the light onto a spot of ~3 μm in diameter. Low laser intensities were used (∼0.37 mW on the sample) to avoid spectral changes due to heat-induced effects. The Raman shift was calibrated using the 520 cm−1 Raman band of crystalline Si.
The diffuse reflectance spectra of the obtained materials were recorded in the range 200–800 nm at room temperature using a UV-vis spectrophotometer (Varian Cary 3; Varian Inc. Palo Alto, CA, USA) equipped with an integration sphere. The DR spectra were collected on calcined samples with PTFE disks. The powder samples were mounted in a quartz cell, which provided a sample thickness >3 mm to guarantee the “infinite” sample thickness.
Ceria-based nanomaterials were also characterized by Electron Paramagnetic Resonance (EPR) spectroscopy employing a Bruker ER200D spectrometer (Billerica, MA, USA) equipped with an Agilent 5310A frequency counter (Agilent Technologies, Santa Clara, CA, USA). EPR spectra were recorded at 77 K in suprasil-quarz tubes (3 mm inner diameter; Willmad Glass). 10 mg of nano-powders were introduced into the sample EPR tube followed by outgassing at 300 K for 10 min under 10-4 bar vacuum. The spectrometer was running under home-made software based on LabView. Numerical simulation of experimental EPR spectra was performed with EasySpin 5.2.21 software (The MathWorks Inc., Natick, MA, USA) [103]. Quantification of Ce3+-O--Ce4+ (S = 1/2) was performed using 2,2-diphenyl-1-picrylhydrazyl (DPPH) [104] as a spin standard (Sigma Aldrich). Quantification of Ce3+ (S = 5/2) was performed using FeIII (S = 5/2)-EDTA complex [105,106], while the quantification of the Cu2+ centers was done using a Cu(NO3)2 standard. Copper content was also determined via WDXRF analysis (Wavelength Dispersive X-Ray Fluorescence; ZSX PRIMUS II, RIGAKU, Austin, TX, USA).

4.3. Catalytic Studies

Activity measurements for the catalytic oxidation of CO were conducted in a conventional fixed-bed reactor (described in detail elsewhere [107]) at atmospheric pressure, in the temperature range of 30–400 °C. The catalyst was in the form of powder with a mass of 120 mg and the total flow rate of the reaction mixture was 25 cm3 min−1, yielding a contact time of W/F = 0.288 g s cm−3, where W is the weight of catalyst and F the total flow rate of the reactant gas. The reaction feed stream contained 1 vol.% CO, 20 vol.% O2 and He as balance. Product and reactant analysis was carried out by a gas chromatograph (Shimadzu GC-14B) equipped with a thermal conductivity detector. The CO conversion calculation was based on the CO2 formation or CO consumption:
CO   conversion   ( % ) =   [ CO 2 ] OUT [ CO ] IN   ×   100 % ,

5. Conclusions

In this study, highly active ceria and copper-promoted ceria catalysts were synthesized via a novel hydrothermal method and evaluated in CO oxidation reaction. The physicochemical characteristics, and as a consequence, the catalytic properties were controlled via appropriate combination of hydrothermal parameters (temperature and concentration of the precipitating agent). EPR spectroscopy demonstrated the presence of different copper species (isolated ions and amorphous clusters), dispersed in ceria nanostructrures (mainly nanorods and nanospheres, depending on the pH of the hydrothermal solution). Elevated hydrothermal temperatures and NaOH concentrations favored the formation of isolated copper ions, which resulted to be less active, as compared with copper clusters. Moreover, the catalysts prepared with high concentrations of NaOH (≥0.5 M) presented a significant amount of surface Ce3+ ions, while Raman spectroscopy and UV-Vis DRS measurements revealed the presence of lattice defects and especially oxygen vacancies. Overall, ceria-based catalysts prepared at elevated temperatures with low concentrations of NaOH (≤0.1 M) were more active in CO oxidation, and this behavior can be mainly related with the obtained morphology and the nature of oxygen vacancies and dispersed copper species, and to a lesser extent, with the specific surface area and the concentration of defects.

Supplementary Materials

The following are available online at https://www.mdpi.com/2073-4344/9/2/138/s1, Figure S1. XRD diffractograms of CeO2 and Cu/CeO2 catalysts: (a) Catalysts prepared hydrothermally at 120 °C; (b) Catalysts prepared hydrothermally at 150 °C; (c) Catalysts prepared hydrothermally at 180 °C, Figure S2. UV-Vis DRS spectra of CeO2 and Cu/CeO2 catalysts: (a) Catalysts prepared hydrothermally at 120 °C; (b) Catalysts prepared hydrothermally at 150 °C; (c) Catalysts prepared hydrothermally at 180 °C.

Author Contributions

Conceptualization, G.A.; investigation and formal analysis, K.K., C.P., Y.G., J.V., J.P. and Y.D.; writing—original draft preparation, K.K.; writing—review and editing, G.A.

Funding

This research was funded by Research Committee of the University of Patras via “K. Karatheodori” program, grant number (E.610). This research was also co-financed by Greece and the European Union (European Social Fund- ESF) through the Operational Programme “Human Resources Development, Education and Lifelong Learning” in the context of the project “Strengthening Human Resources Research Potential via Doctorate Research” (MIS-5000432), implemented by the State Scholarships Foundation (ΙΚΥ).

Conflicts of Interest

The authors declare no conflict of interest.

References

  1. Liu, Y.; Wen, C.; Guo, Y.; Lu, G.; Wang, Y. Effects of surface area and oxygen vacancies on ceria in CO oxidation: Differences and relationships. J. Mol. Catal. Chem. 2010, 316, 59–64. [Google Scholar] [CrossRef]
  2. Rao, K.N.; Bharali, P.; Thrimurthulu, G.; Reddy, B.M. Supported copper–ceria catalysts for low temperature CO oxidation. Catal. Commun. 2010, 11, 863–866. [Google Scholar] [CrossRef]
  3. He, H.; Yang, P.; Li, J.; Shi, R.; Chen, L.; Zhang, A.; Zhu, Y. Controllable synthesis, characterization, and CO oxidation activity of CeO2 nanostructures with various morphologies. Ceram. Int. 2016, 42, 7810–7818. [Google Scholar] [CrossRef]
  4. Avgouropoulos, G.; Ioannides, T.; Matralis, H.K.; Batista, J.; Hocevar, S. CuO-CeO2 mixed oxide catalysts for the selective oxidation of carbon monoxide in excess hydrogen. Catal. Lett. 2001, 73, 33–40. [Google Scholar] [CrossRef]
  5. Gamarra, D.; Cámara, A.L.; Monte, M.; Rasmussen, S.B.; Chinchilla, L.E.; Hungría, A.B.; Munuera, G.; Gyorffy, N.; Schay, Z.; Corberán, V.C.; et al. Preferential oxidation of CO in excess H2 over CuO/CeO2 catalysts: Characterization and performance as a function of the exposed face present in the CeO2 support. Appl. Catal. B Environ. 2013, 130–131, 224–238. [Google Scholar] [CrossRef]
  6. Guo, X.; Zhou, R. A new insight into the morphology effect of ceria on CuO/CeO2 catalysts for CO selective oxidation in hydrogen-rich gas. Catal. Sci. Technol. 2016, 6, 3862–3871. [Google Scholar] [CrossRef]
  7. Paliwal, A.; Sharma, A.; Tomar, M.; Gupta, V. Carbon monoxide (CO) optical gas sensor based on ZnO thin films. Sens. Actuators B Chem. 2017, 250, 679–685. [Google Scholar] [CrossRef]
  8. Lin, Q.; Han, C.; Su, H.; Sun, L.; Ishida, T.; Honma, T.; Sun, X.; Zheng, Y.; Qi, C. Remarkable enhancement of Fe–V–Ox composite metal oxide to gold catalyst for CO oxidation in the simulated atmosphere of CO2 laser. RSC Adv. 2017, 7, 38780–38783. [Google Scholar] [CrossRef]
  9. Kašpar, J.; Fornasiero, P.; Graziani, M. Use of CeO2-based oxides in the three-way catalysis. Catal. Today 1999, 50, 285–298. [Google Scholar] [CrossRef]
  10. Mai, H.-X.; Sun, L.-D.; Zhang, Y.-W.; Si, R.; Feng, W.; Zhang, H.-P.; Liu, H.-C.; Yan, C.-H. Shape-Selective Synthesis and Oxygen Storage Behavior of Ceria Nanopolyhedra, Nanorods, and Nanocubes. J. Phys. Chem. B 2005, 109, 24380–24385. [Google Scholar] [CrossRef]
  11. Qin, J.; Lu, J.; Cao, M.; Hu, C. Synthesis of porous CuO–CeO2 nanospheres with an enhanced low-temperature CO oxidation activity. Nanoscale 2010, 2, 2739–2743. [Google Scholar] [CrossRef] [PubMed]
  12. Lykaki, M.; Pachatouridou, E.; Iliopoulou, E.; Carabineiro, S.A.; Konsolakis, M. Impact of the synthesis parameters on the solid state properties and the CO oxidation performance of ceria nanoparticles. RSC Adv. 2017, 7, 6160–6169. [Google Scholar] [CrossRef]
  13. Campbell, C.T.; Peden, C.H.F. Oxygen Vacancies and Catalysis on Ceria Surfaces. Science 2005, 309, 713–714. [Google Scholar] [CrossRef] [PubMed]
  14. Yang, Z.; Zhou, K.; Liu, X.; Tian, Q.; Lu, D.; Yang, S. Single-crystalline ceria nanocubes: Size-controlled synthesis, characterization and redox property. Nanotechnology 2007, 18, 185606–185609. [Google Scholar] [CrossRef]
  15. Xu, J.; Harmer, J.; Li, G.; Chapman, T.; Collier, P.; Longworth, S.; Chi Tsang, S. Size dependent oxygen buffering capacity of ceria nanocrystals. Chem. Commun. 2010, 46, 1887–1889. [Google Scholar] [CrossRef] [PubMed]
  16. Ishikawa, Y.; Takeda, M.; Tsukimoto, S.; Nakayama, K.S.; Asao, N. Cerium Oxide Nanorods with Unprecedented Low-Temperature Oxygen Storage Capacity. Adv. Mater. 2016, 28, 1467–1471. [Google Scholar] [CrossRef] [PubMed]
  17. Sayle, T.X.T.; Parker, S.C.; Catlow, C.R.A. The role of oxygen vacancies on ceria surfaces in the oxidation of carbon monoxide. Surf. Sci. 1994, 316, 329–336. [Google Scholar] [CrossRef]
  18. Conesa, J. Computer modeling of surfaces and defects on cerium dioxide. Surf. Sci. 1995, 339, 337–352. [Google Scholar] [CrossRef]
  19. Zhou, K.; Wang, X.; Sun, X.; Peng, Q.; Li, Y. Enhanced catalytic activity of ceria nanorods from well-defined reactive crystal planes. J. Catal. 2005, 229, 206–212. [Google Scholar] [CrossRef]
  20. Wu, Z.; Li, M.; Overbury, S.H. On the structure dependence of CO oxidation over CeO2 nanocrystals with well-defined surface planes. J. Catal. 2012, 285, 61–73. [Google Scholar] [CrossRef]
  21. Tana; Zhang, M.; Li, J.; Li, H.; Li, Y.; Shen, W. Morphology-dependent redox and catalytic properties of CeO2 nanostructures: Nanowires, nanorods and nanoparticles. Catal. Today 2009, 148, 179–183. [Google Scholar] [CrossRef]
  22. Periyat, P.; Laffir, F.; Tofail, S.A.M.; Magner, E. A facile aqueous sol–gel method for high surface area nanocrystalline CeO2. RSC Adv. 2011, 1, 1794–1798. [Google Scholar] [CrossRef]
  23. Suresh, R.; Ponnuswamy, V.; Mariappan, R. Effect of annealing temperature on the microstructural, optical and electrical properties of CeO2 nanoparticles by chemical precipitation method. Appl. Surf. Sci. 2013, 273, 457–464. [Google Scholar] [CrossRef]
  24. Kepenekçi, O.; Emirdag-Eanes, M.; Demir, M.M. Effect of alkali metal hydroxides on the morphological development and optical properties of ceria nanocubes under hydrothermal conditions. J. Nanosci. Nanotechnol. 2011, 11, 3565–3577. [Google Scholar] [CrossRef] [PubMed]
  25. Liu, L.; Cao, Y.; Sun, W.; Yao, Z.; Liu, B.; Gao, F.; Dong, L. Morphology and nanosize effects of ceria from different precursors on the activity for NO reduction. Catal. Today 2011, 175, 48–54. [Google Scholar] [CrossRef]
  26. Zdravković, J.; Simović, B.; Golubović, A.; Poleti, D.; Veljković, I.; Šćepanović, M.; Branković, G. Comparative study of CeO2 nanopowders obtained by the hydrothermal method from various precursors. Ceram. Int. 2015, 41, 1970–1979. [Google Scholar] [CrossRef]
  27. Zhang, W.; Niu, X.; Chen, L.; Yuan, F.; Zhu, Y. Soot Combustion over Nanostructured Ceria with Different Morphologies. Sci. Rep. 2016, 6, 29062. [Google Scholar] [CrossRef]
  28. Lu, X.; Zhai, T.; Cui, H.; Shi, J.; Xie, S.; Huang, Y.; Liang, C.; Tong, Y. Redox cycles promoting photocatalytic hydrogen evolution of CeO2 nanorods. J. Mater. Chem. 2011, 21, 5569–5572. [Google Scholar] [CrossRef]
  29. Terribile, D.; Trovarelli, A.; Llorca, J.; de Leitenburg, C.; Dolcetti, G. The Synthesis and Characterization of Mesoporous High-Surface Area Ceria Prepared Using a Hybrid Organic/Inorganic Route. J. Catal. 1998, 178, 299–308. [Google Scholar] [CrossRef]
  30. Pan, C.; Zhang, D.; Shi, L.; Fang, J. Template-Free Synthesis, Controlled Conversion, and CO Oxidation Properties of CeO2 Nanorods, Nanotubes, Nanowires, and Nanocubes. Eur. J. Inorg. Chem. 2008, 2008, 2429–2436. [Google Scholar] [CrossRef]
  31. Shan, W.; Guo, H.; Liu, C.; Wang, X. Controllable preparation of CeO2 nanostructure materials and their catalytic activity. J. Rare Earths 2012, 30, 665–669. [Google Scholar] [CrossRef]
  32. Montini, T.; Melchionna, M.; Monai, M.; Fornasiero, P. Fundamentals and Catalytic Applications of CeO2-Based Materials. Chem. Rev. 2016, 116, 5987–6041. [Google Scholar] [CrossRef] [PubMed]
  33. Kehoe, A.B.; Scanlon, D.O.; Watson, G.W. Role of Lattice Distortions in the Oxygen Storage Capacity of Divalently Doped CeO2. Chem. Mater. 2011, 23, 4464–4468. [Google Scholar] [CrossRef]
  34. Mahammadunnisa, S.; Reddy, P.M.K.; Karuppiah, J.; Subrahmanyam, C. Facile Synthesis of Au/CeO2 Catalyst for Low Temperature CO Oxidation. Adv. Chem. Lett. 2013, 1, 264–271. [Google Scholar] [CrossRef]
  35. Hu, Z.; Liu, X.; Meng, D.; Guo, Y.; Guo, Y.; Lu, G. Effect of Ceria Crystal Plane on the Physicochemical and Catalytic Properties of Pd/Ceria for CO and Propane Oxidation. ACS Catal. 2016, 6, 2265–2279. [Google Scholar] [CrossRef]
  36. Gatla, S.; Aubert, D.; Agostini, G.; Mathon, O.; Pascarelli, S.; Lunkenbein, T.; Willinger, M.G.; Kaper, H. Room-Temperature CO Oxidation Catalyst: Low-Temperature Metal–Support Interaction between Platinum Nanoparticles and Nanosized Ceria. ACS Catal. 2016, 6, 6151–6155. [Google Scholar] [CrossRef]
  37. Elias, J.S.; Stoerzinger, K.A.; Hong, W.T.; Risch, M.; Giordano, L.; Mansour, A.N.; Shao-Horn, Y. In Situ Spectroscopy and Mechanistic Insights into CO Oxidation on Transition-Metal-Substituted Ceria Nanoparticles. ACS Catal. 2017, 7, 6843–6857. [Google Scholar] [CrossRef]
  38. Zhou, L.; Li, X.; Yao, Z.; Chen, Z.; Hong, M.; Zhu, R.; Liang, Y.; Zhao, J. Transition-Metal Doped Ceria Microspheres with Nanoporous Structures for CO Oxidation. Sci. Rep. 2016, 6, 23900. [Google Scholar] [CrossRef] [PubMed]
  39. Harrison, P.G.; Ball, I.K.; Azelee, W.; Daniell, W.; Goldfarb, D. Nature and Surface Redox Properties of Copper(II)-Promoted Cerium(IV) Oxide CO-Oxidation Catalysts. Chem. Mater. 2000, 12, 3715–3725. [Google Scholar] [CrossRef]
  40. Avgouropoulos, G.; Ioannides, T. Effect of synthesis parameters on catalytic properties of CuO-CeO2. Appl. Catal. B Environ. 2006, 67, 1–11. [Google Scholar] [CrossRef]
  41. Elias, J.S.; Artrith, N.; Bugnet, M.; Giordano, L.; Botton, G.A.; Kolpak, A.M.; Shao-Horn, Y. Elucidating the Nature of the Active Phase in Copper/Ceria Catalysts for CO Oxidation. ACS Catal. 2016, 6, 1675–1679. [Google Scholar] [CrossRef]
  42. Wang, W.-W.; Yu, W.-Z.; Du, P.-P.; Xu, H.; Jin, Z.; Si, R.; Ma, C.; Shi, S.; Jia, C.-J.; Yan, C.-H. Crystal Plane Effect of Ceria on Supported Copper Oxide Cluster Catalyst for CO Oxidation: Importance of Metal–Support Interaction. ACS Catal. 2017, 7, 1313–1329. [Google Scholar] [CrossRef]
  43. Papavasiliou, J.; Rawski, M.; Vakros, J.; Avgouropoulos, G. A Novel Post-Synthesis Modification of CuO-CeO2 Catalysts: Effect on Their Activity for Selective CO Oxidation. ChemCatChem 2018, 10, 2096–2106. [Google Scholar] [CrossRef]
  44. Papavasiliou, J.; Vakros, J.; Avgouropoulos, G. Impact of acid treatment of CuO-CeO2 catalysts on the preferential oxidation of CO reaction. Catal. Commun. 2018, 115, 68–72. [Google Scholar] [CrossRef]
  45. Landi, G.; Barbato, P.S.; Di Benedetto, A.; Lisi, L. Optimization of the preparation method of CuO/CeO2 structured catalytic monolith for CO preferential oxidation in H2-rich streams. Appl. Catal. B Environ. 2016, 181, 727–737. [Google Scholar] [CrossRef]
  46. Konsolakis, M. The role of Copper-Ceria interactions in catalysis science: Recent theoretical and experimental advances. Appl. Catal. B Environ. 2016, 198, 49–66. [Google Scholar] [CrossRef]
  47. Gong, X.; Liu, B.; Kang, B.; Xu, G.; Wang, Q.; Jia, C.; Zhang, J. Boosting Cu-Ce interaction in CuxO/CeO2 nanocube catalysts for enhanced catalytic performance of preferential oxidation of CO in H2-rich gases. Mol. Catal. 2017, 436, 90–99. [Google Scholar] [CrossRef]
  48. Adamski, A.; Zając, W.; Zasada, F.; Sojka, Z. Copper ionic pairs as possible active sites in N2O decomposition on CuOx/CeO2 catalysts. Catal. Today 2012, 191, 129–133. [Google Scholar] [CrossRef]
  49. Kydd, R.; Teoh, W.Y.; Wong, K.; Wang, Y.; Scott, J.; Zeng, Q.-H.; Yu, A.-B.; Zou, J.; Amal, R. Flame-Synthesized Ceria-Supported Copper Dimers for Preferential Oxidation of CO. Adv. Funct. Mater. 2009, 19, 369–377. [Google Scholar] [CrossRef]
  50. Wang, F.; Büchel, R.; Savitsky, A.; Zalibera, M.; Widmann, D.; Pratsinis, S.E.; Lubitz, W.; Schüth, F. In Situ EPR Study of the Redox Properties of CuO–CeO2 Catalysts for Preferential CO Oxidation (PROX). ACS Catal. 2016, 6, 3520–3530. [Google Scholar] [CrossRef]
  51. Knauth, P.; Tuller, H.L. Solute segregation, electrical properties and defect thermodynamics of nanocrystalline TiO2 and CeO2. Solid State Ion. 2000, 136–137, 1215–1224. [Google Scholar] [CrossRef]
  52. Abi-aad, E.; Bechara, R.; Grimblot, J.; Aboukais, A. Preparation and characterization of ceria under an oxidizing atmosphere. Thermal analysis, XPS, and EPR study. Chem. Mater. 1993, 5, 793–797. [Google Scholar] [CrossRef]
  53. Mendelovich, L.; Tzehoval, H.; Steinberg, M. The adsorption of oxygen and nitrous oxide on platinum ceria catalyst. Appl. Surf. Sci. 1983, 17, 175–188. [Google Scholar] [CrossRef]
  54. Fierro, J.L.G.; Soria, J.; Sanz, J.; Rojo, J.M. Induced changes in ceria by thermal treatments under vacuum or hydrogen. J. Solid State Chem. 1987, 66, 154–162. [Google Scholar] [CrossRef]
  55. Aboukaïs, A.; Bennani, A.; Aïssi, C.F.; Wrobel, G.; Guelton, M.; Vedrine, J.C. Highly resolved electron paramagnetic resonance spectrum of copper(II) ion pairs in CuCe oxide. J. Chem. Soc. Faraday Trans. 1992, 88, 615–620. [Google Scholar] [CrossRef]
  56. Lamonier, C.; Bennani, A.; D’Huysser, A.; Aboukaïs, A.; Wrobel, G. Evidence for different copper species in precursors of copper–cerium oxide catalysts for hydrogenation reactions. An X-ray diffraction, EPR and X-ray photoelectron spectroscopy study. J. Chem. Soc. Faraday Trans. 1996, 92, 131–136. [Google Scholar] [CrossRef]
  57. Li, Y.; Cai, Y.; Xing, X.; Chen, N.; Deng, D.; Wang, Y. Catalytic activity for CO oxidation of Cu–CeO2 composite nanoparticles synthesized by a hydrothermal method. Anal. Methods 2015, 7, 3238–3245. [Google Scholar] [CrossRef]
  58. Grigoropoulou, G.; Christoforidis, K.C.; Louloudi, M.; Deligiannakis, Y. Structure-catalytic function relationship of SiO2-immobilized mononuclear Cu complexes: An EPR study. Langmuir 2007, 23, 10407–10418. [Google Scholar] [CrossRef]
  59. Courcot, D.; Abi-Aad, E.; Capelle, S.; Aboukaïs, A. Investigation of copper-cerium oxide catalysts in the combustion of diesel soot. In Studies in Surface Science and Catalysis; Kruse, N., Frennet, A., Bastin, J.-M., Eds.; Catalysis and Automotive Pollution Control IV.; Elsevier: Amsterdam, The Netherlands, 1998; Volume 116, pp. 625–634. [Google Scholar]
  60. Aboukaïs, A.; Bennani, A.; Lamonier-Dulongpont, C.; Abi-Aad, E.; Wrobel, G. Redox behaviour of copper(II) species on CuCe oxide catalysts: Electron paramagnetic resonance (EPR) study. Colloids Surf. Physicochem. Eng. Asp. 1996, 115, 171–177. [Google Scholar] [CrossRef]
  61. Soria, J.; Conesa, J.C.; Martínez-Arias, A.; Coronado, J.M. ESR study of the clustering of Cu ions on the ceria surface in impregnated CuO/CeO2. Solid State Ion. 1993, 63–65, 755–761. [Google Scholar] [CrossRef]
  62. Wang, J.; Liu, Q.; Liu, Q. Ceria- and Cu-Doped Ceria Nanocrystals Synthesized by the Hydrothermal Methods. J. Am. Ceram. Soc. 2008, 91, 2706–2708. [Google Scholar] [CrossRef]
  63. Sakai, M.; Nagai, Y.; Aoki, Y.; Takahashi, N. Investigation into the catalytic reduction of NOx at copper–ceria interface active sites. Appl. Catal. Gen. 2016, 510, 57–63. [Google Scholar] [CrossRef]
  64. Xu, B.; Zhang, Q.; Yuan, S.; Zhang, M.; Ohno, T. Morphology control and characterization of broom-like porous CeO2. Chem. Eng. J. 2015, 260, 126–132. [Google Scholar] [CrossRef]
  65. Zhou, X.-D.; Huebner, W. Size-induced lattice relaxation in CeO2 nanoparticles. Appl. Phys. Lett. 2001, 79, 3512–3514. [Google Scholar] [CrossRef]
  66. Tsunekawa, S.; Ishikawa, K.; Li, Z.-Q.; Kawazoe, Y.; Kasuya, A. Origin of Anomalous Lattice Expansion in Oxide Nanoparticles. Phys. Rev. Lett. 2000, 85, 3440–3443. [Google Scholar] [CrossRef]
  67. Lu, B.; Li, Z.; Kawamoto, K. Synthesis of mesoporous ceria without template. Mater. Res. Bull. 2013, 48, 2504–2510. [Google Scholar] [CrossRef]
  68. Guo, T.; Du, J.; Li, J. The effects of ceria morphology on the properties of Pd/ceria catalyst for catalytic oxidation of low-concentration methane. J. Mater. Sci. 2016, 51, 10917–10925. [Google Scholar] [CrossRef]
  69. Araiza, D.G.; Gómez-Cortés, A.; Díaz, G. Partial oxidation of methanol over copper supported on nanoshaped ceria for hydrogen production. Catal. Today 2017, 282 Pt 2, 185–194. [Google Scholar] [CrossRef]
  70. McBride, J.R.; Hass, K.C.; Poindexter, B.D.; Weber, W.H. Raman and X-ray studies of Ce1−xRExO2−y, where RE = La, Pr, Nd, Eu, Gd, and Tb. J. Appl. Phys. 1994, 76, 2435–2441. [Google Scholar] [CrossRef]
  71. Spanier, J.E.; Robinson, R.D.; Zhang, F.; Chan, S.-W.; Herman, I.P. Size-dependent properties of CeO2−y nanoparticles as studied by Raman scattering. Phys. Rev. B 2001, 64, 245407. [Google Scholar] [CrossRef]
  72. Wu, Z.; Li, M.; Howe, J.; Meyer, H.M.; Overbury, S.H. Probing Defect Sites on CeO2 Nanocrystals with Well-Defined Surface Planes by Raman Spectroscopy and O2 Adsorption. Langmuir 2010, 26, 16595–16606. [Google Scholar] [CrossRef]
  73. Choi, Y.M.; Abernathy, H.; Chen, H.-T.; Lin, M.C.; Liu, M. Characterization of O2-CeO2 Interactions Using In Situ Raman Spectroscopy and First-Principle Calculations. ChemPhysChem 2006, 7, 1957–1963. [Google Scholar] [CrossRef]
  74. Matei-Rutkovska, F.; Postole, G.; Rotaru, C.G.; Florea, M.; Pârvulescu, V.I.; Gelin, P. Synthesis of ceria nanopowders by microwave-assisted hydrothermal method for dry reforming of methane. Int. J. Hydrogen Energy 2016, 41, 2512–2525. [Google Scholar] [CrossRef]
  75. López, J.M.; Gilbank, A.L.; García, T.; Solsona, B.; Agouram, S.; Torrente-Murciano, L. The prevalence of surface oxygen vacancies over the mobility of bulk oxygen in nanostructured ceria for the total toluene oxidation. Appl. Catal. B Environ. 2015, 174–175, 403–412. [Google Scholar] [CrossRef]
  76. Tok, A.I.Y.; Du, S.W.; Boey, F.Y.C.; Chong, W.K. Hydrothermal synthesis and characterization of rare earth doped ceria nanoparticles. Mater. Sci. Eng. A 2007, 466, 223–229. [Google Scholar] [CrossRef]
  77. Naganuma, T.; Traversa, E. Stability of the Ce3+ valence state in cerium oxide nanoparticle layers. Nanoscale 2012, 4, 4950–4953. [Google Scholar] [CrossRef]
  78. Ho, C.; Yu, J.C.; Kwong, T.; Mak, A.C.; Lai, S. Morphology-Controllable Synthesis of Mesoporous CeO2 Nano- and Microstructures. Chem. Mater. 2005, 17, 4514–4522. [Google Scholar] [CrossRef]
  79. Rakai, A.; Bensalem, A.; Muller, J.C.; Tessier, D.; Bozon-Verduraz, F. Revisiting Diffuse Reflectance Spectroscopy for the Characterization of Metal and Semiconducting Oxide Catalysts. In Studies in Surface Science and Catalysis; Guczi, L., Solymosi, F., Tétényi, P., Eds.; New Frontiers in Catalysis—Proceedings of the 10th International Congress on Catalysis, Budapest, Hungary, 19–24 July 1992; Elsevier: Amsterdam, The Netherlands, 1993; Volume 75, pp. 1875–1878. [Google Scholar]
  80. Bensalem, A.; Muller, J.C.; Bozon-Verduraz, F. From bulk CeO2 to supported cerium-oxygen clusters: A diffuse reflectance approach. J. Chem. Soc. Faraday Trans. 1992, 88, 153–154. [Google Scholar] [CrossRef]
  81. Binet, C.; Badri, A.; Lavalley, J.-C. A Spectroscopic Characterization of the Reduction of Ceria from Electronic Transitions of Intrinsic Point Defects. J. Phys. Chem. 1994, 98, 6392–6398. [Google Scholar] [CrossRef]
  82. Aguila, G.; Guerrero, S.; Araya, P. Effect of the preparation method and calcination temperature on the oxidation activity of CO at low temperature on CuO–CeO2/SiO2 catalysts. Appl. Catal. Gen. 2013, 462–463, 56–63. [Google Scholar] [CrossRef]
  83. Pintar, A.; Batista, J.; Hočevar, S. TPR, TPO, and TPD examinations of Cu0.15Ce0.85O2−y mixed oxides prepared by co-precipitation, by the sol–gel peroxide route, and by citric acid-assisted synthesis. J. Colloid Interface Sci. 2005, 285, 218–231. [Google Scholar] [CrossRef]
  84. Mena, E.; Rey, A.; Rodríguez, E.M.; Beltrán, F.J. Nanostructured CeO2 as catalysts for different AOPs based in the application of ozone and simulated solar radiation. Catal. Today 2017, 280 Pt 1, 74–79. [Google Scholar] [CrossRef]
  85. Tsunekawa, S.; Fukuda, T.; Kasuya, A. Blue shift in ultraviolet absorption spectra of monodisperse CeO2−x nanoparticles. J. Appl. Phys. 2000, 87, 1318–1321. [Google Scholar] [CrossRef]
  86. Itoh, T.; Uchida, T.; Izu, N.; Matsubara, I.; Shin, W. Effect of Core–Shell Ceria/Poly(vinylpyrrolidone) (PVP) Nanoparticles Incorporated in Polymer Films and Their Optical Properties. Materials 2013, 6, 2119–2129. [Google Scholar] [CrossRef]
  87. Pan, C.; Zhang, D.; Shi, L. CTAB assisted hydrothermal synthesis, controlled conversion and CO oxidation properties of CeO2 nanoplates, nanotubes, and nanorods. J. Solid State Chem. 2008, 181, 1298–1306. [Google Scholar] [CrossRef]
  88. Taniguchi, T.; Katsumata, K.; Omata, S.; Okada, K.; Matsushita, N. Tuning Growth Modes of Ceria-Based Nanocubes by a Hydrothermal Method. Cryst. Growth Des. 2011, 11, 3754–3760. [Google Scholar] [CrossRef]
  89. Wang, C.; Cheng, X. Hydrothermal Synthesis and Upconversion Properties of α-NaYF4:Yb3+, Er3+ Nanocrystals Using Citric Acid as Chelating Ligand and NaNO3 as Mineralizer. J. Nanosci. Nanotechnol. 2015, 15, 9656–9664. [Google Scholar] [CrossRef]
  90. Liu, H.; Liu, H. Preparing micro/nano core-shell sphere CeO2 via a low temperature route for improved lithium storage performance. Mater. Lett. 2016, 168, 80–82. [Google Scholar] [CrossRef]
  91. Jiang, T.; Qin, W.; Di, W.; Yang, R.; Liu, D.; Zhai, X.; Qin, G. Citric acid-assisted hydrothermal synthesis of α-NaYF4: Yb3+, Tm3+ nanocrystals and their enhanced ultraviolet upconversion emissions. CrystEngComm 2012, 14, 2302–2307. [Google Scholar] [CrossRef]
  92. Levien, B.J. A Physicochemical Study of Aqueous Citric Acid Solutions. J. Phys. Chem. 1955, 59, 640–644. [Google Scholar] [CrossRef]
  93. Masui, T.; Hirai, H.; Imanaka, N.; Adachi, G.; Sakata, T.; Mori, H. Synthesis of cerium oxide nanoparticles by hydrothermal crystallization with citric acid. J. Mater. Sci. Lett. 2002, 21, 489–491. [Google Scholar] [CrossRef]
  94. Ma, J.; Qian, K.; Huang, W.; Zhu, Y.; Yang, Q. Facile One-Step Synthesis of Double-Shelled CeO2 Hollow Spheres and Their Optical and Catalytic Properties. Bull. Chem. Soc. Jpn. 2010, 83, 1455–1461. [Google Scholar] [CrossRef]
  95. Zhang, Y.; Lin, Y.; Jing, C.; Qin, Y. Formation and Thermal Decomposition of Cerium-Organic Precursor for Nanocrystalline Cerium Oxide Powder Synthesis. J. Dispers. Sci. Technol. 2007, 28, 1053–1058. [Google Scholar] [CrossRef]
  96. Wu, N.-C.; Shi, E.-W.; Zheng, Y.-Q.; Li, W.-J. Effect of pH of Medium on Hydrothermal Synthesis of Nanocrystalline Cerium(IV) Oxide Powders. J. Am. Ceram. Soc. 2002, 85, 2462–2468. [Google Scholar] [CrossRef]
  97. Lin, M.; Fu, Z.Y.; Tan, H.R.; Tan, J.P.Y.; Ng, S.C.; Teo, E. Hydrothermal Synthesis of CeO2 Nanocrystals: Ostwald Ripening or Oriented Attachment? Cryst. Growth Des. 2012, 12, 3296–3303. [Google Scholar] [CrossRef]
  98. Bezkrovnyi, O.S.; Lisiecki, R.; Kepinski, L. Relationship between morphology and structure of shape-controlled CeO2 nanocrystals synthesized by microwave-assisted hydrothermal method. Cryst. Res. Technol. 2016, 51, 554–560. [Google Scholar] [CrossRef]
  99. Lin, J.; Huang, Y.; Li, L.; Wang, A.; Zhang, W.; Wang, X.; Zhang, T. Activation of an Ir-in-CeO2 catalyst by pulses of CO: The role of oxygen vacancy and carbonates in CO oxidation. Catal. Today 2012, 180, 155–160. [Google Scholar] [CrossRef]
  100. Nörenberg, H.; Briggs, G.A.D. Defect Structure of Nonstoichiometric CeO2 (111) Surfaces Studied by Scanning Tunneling Microscopy. Phys. Rev. Lett. 1997, 79, 4222–4225. [Google Scholar] [CrossRef]
  101. Esch, F.; Fabris, S.; Zhou, L.; Montini, T.; Africh, C.; Fornasiero, P.; Comelli, G.; Rosei, R. Electron Localization Determines Defect Formation on Ceria Substrates. Science 2005, 309, 752–755. [Google Scholar] [CrossRef]
  102. Wang, L.; Yu, Y.; He, H.; Zhang, Y.; Qin, X.; Wang, B. Oxygen vacancy clusters essential for the catalytic activity of CeO2 nanocubes for o-xylene oxidation. Sci. Rep. 2017, 7, 12845. [Google Scholar] [CrossRef]
  103. Stoll, S.; Schweiger, A. EasySpin, a comprehensive software package for spectral simulation and analysis in EPR. J. Magn. Reson. 2006, 178, 42–55. [Google Scholar] [CrossRef] [PubMed]
  104. Stathi, P.; Gournis, D.; Deligiannakis, Y.; Rudolf, P. Stabilization of phenolic radicals on graphene oxide: An XPS and EPR study. Langmuir 2015, 31, 10508–10516. [Google Scholar] [CrossRef] [PubMed]
  105. Scullane, M.; White, L.; Chasteen, N. An efficient approach to computer simulation of EPR spectra of high-spin Fe(III) in rhombic ligand fields. J. Magn. Reson. 1969, 47, 383–397. [Google Scholar] [CrossRef]
  106. Knijnenburg, J.T.N.; Seristatidou, E.; Hilty, F.M.; Krumeich, F.; Deligiannakis, Y. Proton-promoted iron dissolution from nanoparticles and the influence by the local iron environment. J. Phys. Chem. C 2014, 118, 24072–24080. [Google Scholar] [CrossRef]
  107. Avgouropoulos, G.; Ioannides, T.; Papadopoulou, C.; Batista, J.; Hocevar, S.; Matralis, H.K. A comparative study of Pt/γ-Al2O3, Au/α-Fe2O3 and CuO–CeO2 catalysts for the selective oxidation of carbon monoxide in excess hydrogen. Catal. Today 2002, 75, 157–167. [Google Scholar] [CrossRef]
Figure 1. EPR spectra of the catalysts prepared with 0–5 M NaOH. Magnification of the region in which the bulk Ce3+ ions were detected, is shown in the inset figure; the figures on the right side present an enlarged region where the Cu2+ species and the surface Ce3+ ions were detected.
Catalysts 09 00138 g001aCatalysts 09 00138 g001bCatalysts 09 00138 g001c
Figure 2. Dependence of the crystallites size of the catalysts with respect to the hydrothermal parameters: (a) Based on the temperature of the hydrothermal treatment; and (b) based on the concentration of NaOH.
Catalysts 09 00138 g002
Figure 3. N2 adsorption/desorption isotherms and pore size distribution curves of CeO2 and Cu/CeO2 catalysts: (a,c,e) N2 adsorption/desorption isotherms; and (b,d,f) pore size distribution curves.
Catalysts 09 00138 g003
Figure 4. Dependence of the specific surface area of the catalysts with respect to the hydrothermal parameters: (a) Based on the temperature of the hydrothermal treatment; and (b) based on the concentration of NaOH.
Catalysts 09 00138 g004
Figure 5. Catalysts prepared hydrothermally at 120 °C: (a) Ce-120-0, (b) CuCe-120-0.05, (c) Ce-120-0.1, (d) CuCe-120-0.5, (e) CuCe-120-1, and (f) Ce-120-5.
Catalysts 09 00138 g005aCatalysts 09 00138 g005b
Figure 6. Catalysts prepared hydrothermally at 150 °C: (a) CuCe-150-0, (b) CuCe-150-0.05, (c) CuCe-150-0.1, (d) Ce-150-0.5, (e) CuCe-150-1, and (f) Ce-150-5.
Catalysts 09 00138 g006aCatalysts 09 00138 g006b
Figure 7. Catalysts prepared hydrothermally at 180 °C: (a) CuCe-180-0, (b) CuCe-180-0.05, (c) CuCe-180-0.1, (d) CuCe-180-0.5, (e) CuCe-180-1, and (f) Ce-180-5.
Catalysts 09 00138 g007aCatalysts 09 00138 g007b
Figure 8. Raman spectra of the catalysts synthesized hydrothermally (a) 120, (b) 150, and (c) 180 °C.
Catalysts 09 00138 g008aCatalysts 09 00138 g008b
Figure 9. (a,c,e) CO conversion diagrams of the catalysts which were treated hydrothermally at 120, 150 and 180 °C, respectively; and (b,d,f) Bar graphs which are shown the temperatures where 50% and 90% conversion of CO to CO2 is achieved.
Catalysts 09 00138 g009aCatalysts 09 00138 g009b
Table 1. Concentrations of the species as detected by EPR spectroscopy.
SamplesBulk Ce3+ (μM/gr)Surface Ce3+ (μM/gr)Cu2+ Species (wt %)
Ce-120-00.430.1N.D.
CuCe-120-0.050.501.30.20 (isolated ions)
Ce-120-0.10.400.4N.D.
CuCe-120-0.50.504.00.002 (isolated ions)
CuCe-120-10.294.00.02 (isolated ions)
Ce-120-50.504.0N.D.
CuCe-150-01.001.30.15 (isolated ions)
CuCe-150-0.050.201.10.3 (>95% clusters)
CuCe-150-0.10.400.83.9 (>95% clusters)
Ce-150-0.50.503.0N.D.
CuCe-150-10.274.00.002 (isolated ions)
Ce-150-50.504.0N.D.
CuCe-180-00.02<0.052.1 (>95% clusters)
CuCe-180-0.05N.D. 1<0.052.8 (>95% clusters)
CuCe-180-0.10.400.11.4 (>95% clusters)
CuCe-180-0.50.503.00.02 (isolated ions)
CuCe-180-10.253.00.01 (isolated ions)
Ce-180-50.404.0N.D.
1 Not-detected.
Table 2. Average crystallite size and lattice parameter of the catalysts based on the crystal plane of (111) of CeO2.
Samplesd111 (nm)α (nm)
Ce-120-08.60.54078
CuCe-120-0.056.90.54228
Ce-120-0.110.00.54136
CuCe-120-0.513.20.54118
CuCe-120-113.80.54123
Ce-120-58.20.54185
CuCe-150-07.20.53966
CuCe-150-0.057.50.54147
CuCe-150-0.119.00.54211
Ce-150-0.59.50.54164
CuCe-150-115.20.54127
Ce-150-525.30.54133
CuCe-180-037.70.54168
CuCe-180-0.0529.20.54168
CuCe-180-0.118.20.54142
CuCe-180-0.511.30.54134
CuCe-180-113.90.54138
Ce-180-523.50.54159
Table 3. Specific Surface Area, Pore Volume, and Pore Size of the catalysts.
SamplesSSA (m2/g)Pore Volume (cm3/g)Pore Size (nm)
Ce-120-036.30.086010.34
CuCe-120-0.0567.00.09205.33
Ce-120-0.122.20.042010.02
CuCe-120-0.570.60.12865.17
CuCe-120-178.80.14475.63
Ce-120-5137.10.22945.55
CuCe-150-063.70.10705.51
CuCe-150-0.0573.30.10504.80
CuCe-150-0.140.40.03205.23
Ce-150-0.586.20.14624.97
CuCe-150-158.60.13905.88
Ce-150-537.30.211418.06
CuCe-180-09.20.045015.30
CuCe-180-0.0514.80.053012.30
CuCe-180-0.127.80.073010.00
CuCe-180-0.576.50.14375.50
CuCe-180-159.40.13436.50
Ce-180-535.00.195216.80
Table 4. F2g peak position, full width at half maximum (FWHM) for the F2g band, relative intensity ratio of ID/IF2g, and energy band gap (Eg) of the catalysts.
SamplesF2g (cm−1)FWHM (cm−1)ID/IF2gEg (eV)
Ce-120-0463.014.80.0273.05
CuCe-120-0.05462.322.80.0463.03
Ce-120-0.1463.117.70.0233.13
CuCe-120-0.5463.013.30.0353.18
CuCe-120-1463.012.50.0603.24
Ce-120-5462.336.50.1063.12
CuCe-150-0463.024.20.0313.12
CuCe-150-0.05462.326.70.0503.06
CuCe-150-0.1460.736.00.0463.07
Ce-150-0.5463.817.60.0323.20
CuCe-150-1464.612.70.0143.28
Ce-150-5464.617.00.0463.29
CuCe-180-0463.722.80.0473.11
CuCe-180-0.05463.023.20.0803.00
CuCe-180-0.1461.428.10.0353.21
CuCe-180-0.5463.715.80.0383.20
CuCe-180-1464.513.10.0203.25
Ce-180-5463.814.80.0343.29
Table 5. pH values from the different part of the catalyst’s preparation.
SamplespH (Ce3+) 2pH (CA) 3pH (Ce3+ + CA) 4pH (NaOH) 5pH Total 6
0 M 13.751.560.9501.68
0.05 M3.751.560.9512.762.10
0.1 M3.751.560.9513.032.52
0.5 M3.751.560.9513.3513.11
1 M3.751.560.9513.5113.46
5 M3.751.560.9513.9113.86
1 The sample 0M is referred to the sample that no addition of NaOH is occurred and so on; 2 pH of the solution that contains Ce3+ ions; 3 pH of the solution that contains citric ions; 4 pH during the mixing of the previous solutions; 5 pH of the NaOH solution; and 6 pH of the final solution before the hydrothermal treatment.

