Article

CdS Photocatalysts Modified with Ag: Effect of the Solvothermal Temperature on the Structure and Photoactivity for Hydrogen Production

Instituto de Catálisis y Petroleoquímica (CSIC), C/Marie Curie 2, Cantoblanco, 28049 Madrid, Spain
*
Author to whom correspondence should be addressed.
Catalysts 2019, 9(2), 110; https://doi.org/10.3390/catal9020110
Submission received: 14 December 2018 / Revised: 14 January 2019 / Accepted: 15 January 2019 / Published: 22 January 2019
(This article belongs to the Special Issue Photocatalysis Science and Engineering in Europe)

Abstract

:
This work studies the effect of the temperature in the solvothermal synthesis of CdS modified with Ag (Ag-CdS) over both the structure of CdS and the chemical state of the Ag species. The increase in the solvothermal temperature produces the evolution of the CdS nanostructures from nanoparticles of low crystallinity in coexistence with small nanocrystals with strong confinement effect to the formation of highly crystalline nanorods. The Ag species also change with the solvothermal temperature from Ag2S species, formed at low temperature, to metallic species as the temperature increases. The photoactivity of the Ag-CdS samples is the result of the combination of three factors: crystallinity of the CdS structures, existence of small nanocrystals with strong confinement effect and the presence of segregated Ag2S species. The Ag-CdS sample prepared at 120 °C shows the better efficiency for hydrogen production because it achieves the better combination of the aforementioned factors.

Graphical Abstract

1. Introduction

Renewable hydrogen production by water splitting using photocatalytic materials has attracted great interest over the past 40 years as exciting alternative for solar light harnessing. To date, a large number of materials (oxides, sulfides, nitrides, oxynitrides, oxysulfides) have been developed for this application [1,2]. Among the most efficient materials, the CdS stands out because of its narrow band gap and the position of its valence and conduction bands that allow the absorption of a wide range of the solar light spectrum [3,4,5]. The main challenge in the development of photocatalysts based on CdS is to improve its efficiency bringing it to the value required for the practical production of hydrogen. This requires the optimization of its photo-physical and photo-optical properties because both factors determine the efficiency of the intermediate steps that compose the overall photocatalytic process for hydrogen production (absorption of photons from solar light and the generation, transport, and reaction of the charge carriers). It is known that shape, size, and crystallinity of CdS control the efficiency for the generation and transport of charge carriers. The control of the physicochemical properties of CdS has been widely explored in the literature, including the control of the nanomorphology [6,7,8,9], the use of co-catalysts [10,11], the hybridization with highly conductive materials [12,13], doping with transition metals [14] or forming solid solutions [15]. Among the nanostructures studied for efficient CdS photocatalysts, monodimensional structures such as nanorods, nanowires, or nanofibers are reported to be beneficial for photoactivity because of the confinement effects along their radial dimension which favors a better charge carrier separation. These monodimensional nanostructures can be obtained applying different methodologies of synthesis: electrochemical synthesis, chemical vapor deposition, colloidal micellar method, vapor–liquid–solid assisted-method, hydrothermal and solvothermal among others. Solvothermal methods have attracted much interest for the nanosynthesis of CdS because they can control the crystal growth of CdS through the coordination of the solvent with the Cd2+ ions in combination with the adjustment of the synthesis variables such as temperature, time and precursors employed. Among the different solvents used in the solvothermal nanosynthesis of CdS, ethylenediamine (EDA) has demonstrated to be an interesting solvent due to its ability to form planar complexes with the Cd2+ ions [Cd(EDA)2]2+ which produces well-oriented two-dimensional nanostructures after the combination with the S2− ions [16,17]. The evolution of these initial two-dimensional nanostructures towards well-crystallized monodimensional structures is highly dependent on the temperature of synthesis, as it was described by Mahdi et al. [18]. The crystallinity of the monodimensional CdS nanostructures increases with the solvothermal temperature and it strongly influences on the photoactivity of CdS [19]. In spite of this fact, previous studies performed in our laboratory [20] showed improved photo-efficiency for CdS nanostructures prepared at low solvothermal temperature with relatively low crystallinity because of the presence of small crystalline domains with strong confinement effect (quantum dots, QD) in combination with monodimensional CdS nanostructures.
As it was mentioned above, the photo-efficiency of CdS could be also modified by addition of transition metals as co-catalysts forming semiconductor–semiconductor (S–S) or semiconductor–metal (S–M) heterojunctions [21]. The incorporation of noble metals such as Au, Pt, Pd, or Rh as co-catalysts in CdS has been extensively studied due to their capacity to improve the charge separation, decreasing by this way their recombination and enhancing the photoactivity of CdS [22,23,24]. Among the metals used as co-catalysts, silver has been often considered for CdS as consequence of its optical and electronic properties and also by its economic advantage respect to noble metals. Silver shows a higher work function respect to that of Au or Pt and it maintains good ability to trap electrons being therefore an effective co-catalyst to minimize the recombination of electron and holes on CdS [25]. Additionally, the Ag+ ions in the presence of S2− could form segregated Ag2S during the synthesis of CdS taking into account its low solubility. Ag2S has been reported by some authors [26,27,28] as an attractive material to form an effective p–n heterojunction with CdS since Ag2S behaves as a semiconductor material with an indirect band gap around 1 eV which favors the light absorption in a wider range of the solar spectrum.
With this background, the present work aims to study the solvothermal synthesis of CdS modified with Ag (AgCdS) in order to explore the structural and nanomorphological evolution of CdS and the nature of the silver species with the change in the temperature used in the synthesis. The relationship between the changes in the properties of the prepared Ag-CdS nanostructures and their effects on photoactivity under visible light were also studied.

2. Results

2.1. Physicochemical Characterization

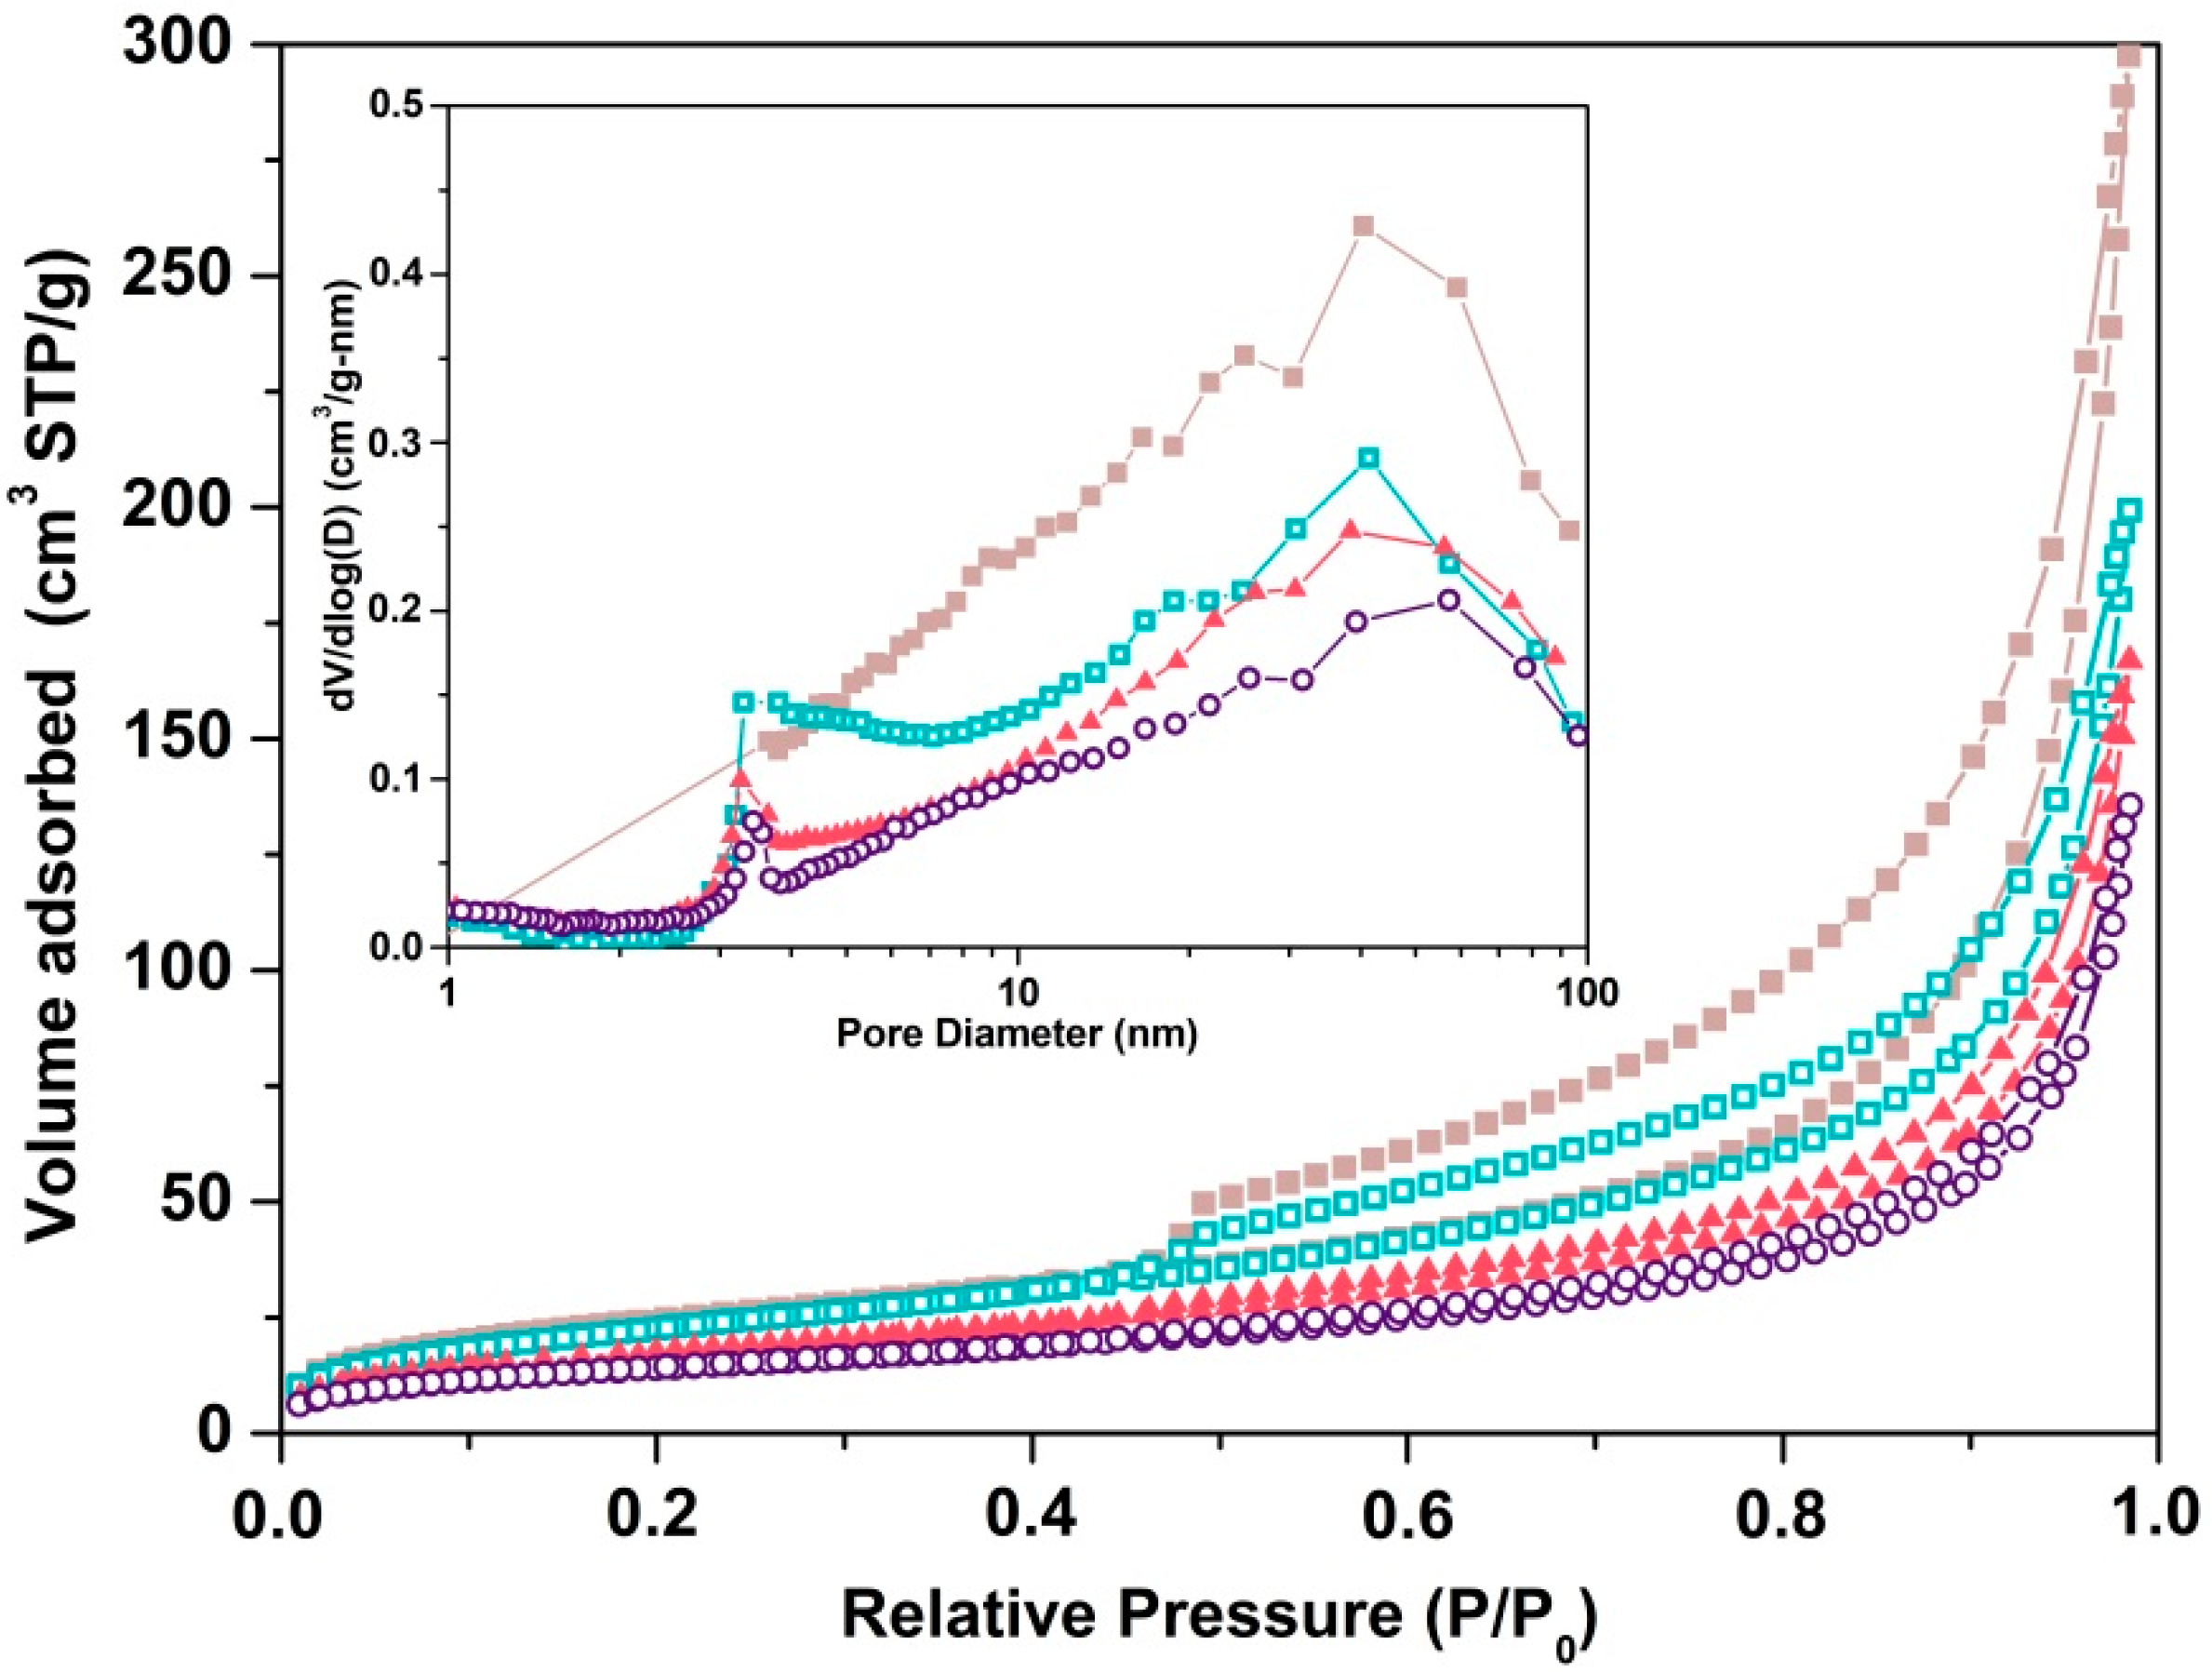
2.1.1. Chemical and Textural Analysis

The chemical composition of AgCdS-T samples were analyzed by total reflection X-ray fluorescence (TXRF) and the results were summarized in Table 1. The chemical analyses indicate that the temperature of synthesis does not seem to be very significant on the coordination between Cd and S because all samples show similar Cd/S atomic ratio. This ratio is lower than the nominal value on all AgCdS-T samples and it could be ascribed to a defect of Cd as a consequence of the presence of the amine ligands of solvent which can act as a cation sequestering binding to the Cd2+ ions on the surface [29]. The Ag concentration on the AgCdS-T samples was also analyzed, showing all samples values close to the theoretical concentration, except for the sample prepared at 90 °C (AgCdS-90) that shows an important increase in the concentration of silver. This fact could be related to the low temperature of synthesis used for this sample which could limit the growth of CdS nanostructures improving the surface exposition of silver species as will be discussed later.
All the AgCdS-T photocatalysts are mesoporous as the shape of its isotherms indicate (Type IV Figure 1). The texture of the AgCdS-T materials present slit-like pores (H3 hysteresis loop) derived from the agglomeration of the CdS particles. BET (Brunauer, Emmett, and Teller) surface area and pore volume of AgCdS-T samples (Table 1) decrease with the increase in the temperature of synthesis as a consequence of the collapse of the mesoporous structure derived from changes in the size and aggregation of the CdS particles. The surface area of the AgCdS-T photocatalysts are lower than the pure CdS counterparts synthesized under similar conditions [20] which indicates that the presence of silver during the solvothermal synthesis influences on the size and aggregation of the CdS particles.

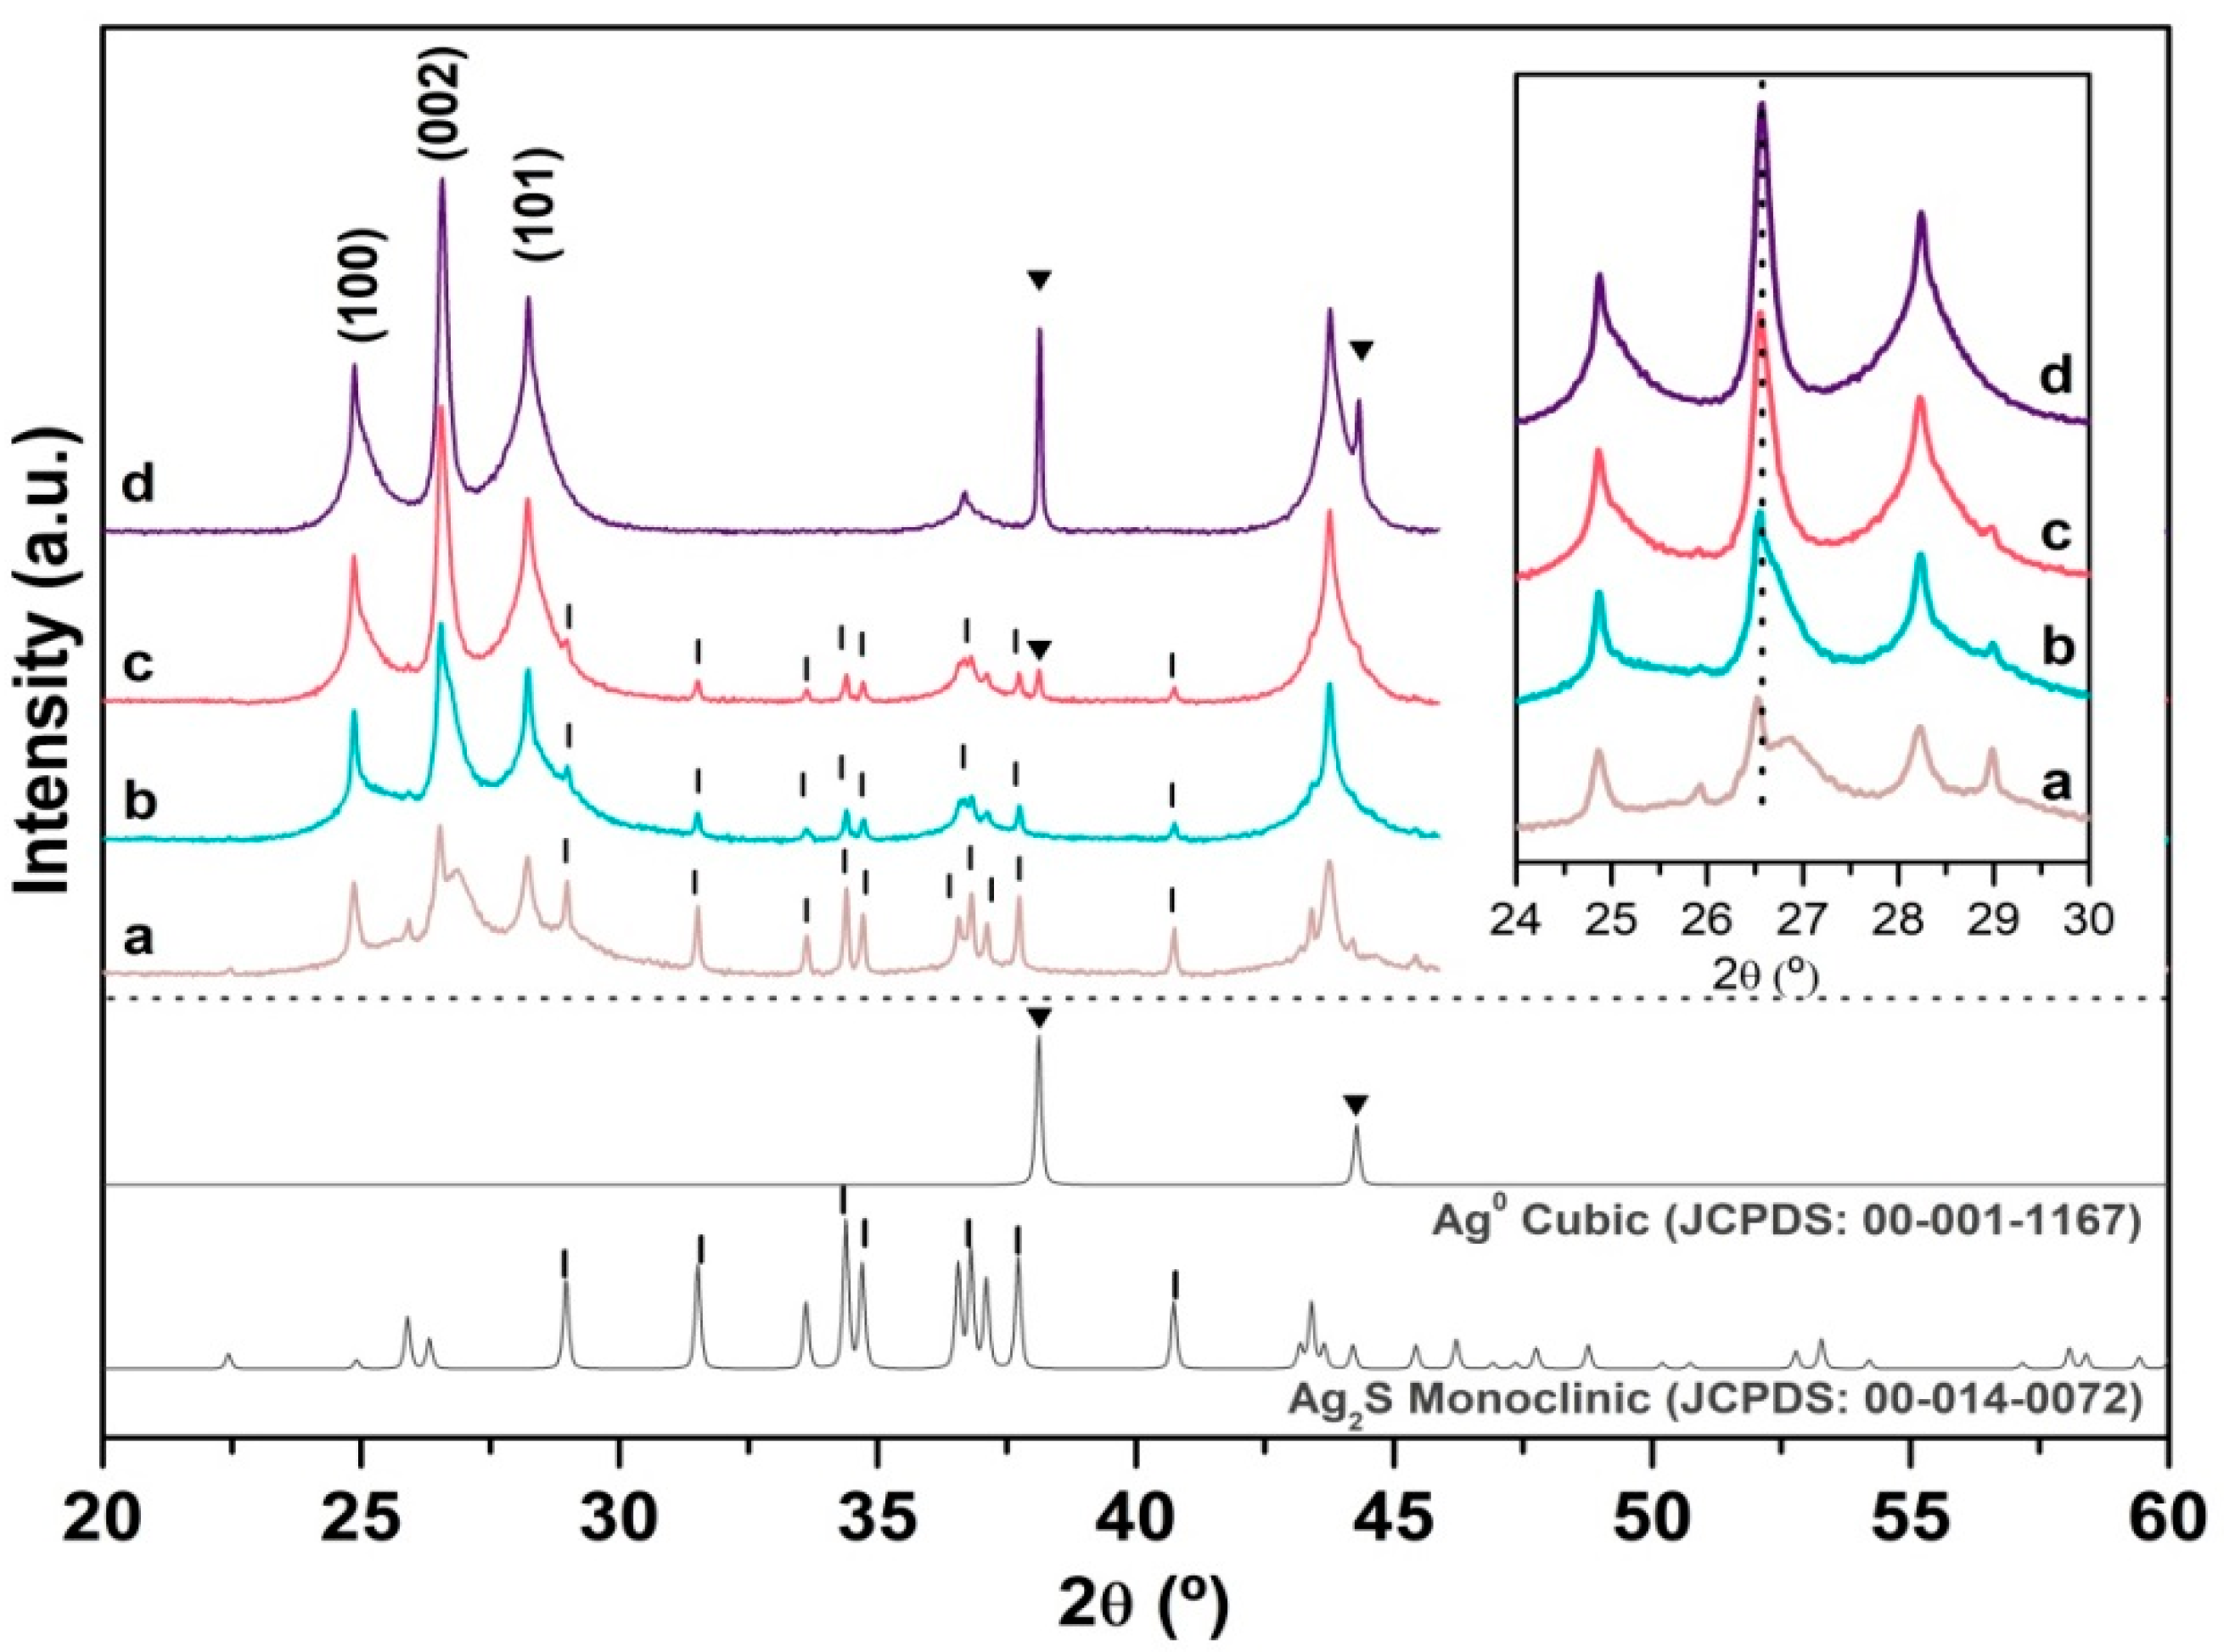
2.1.2. X-ray Diffraction (XRD)

Figure 2 shows the diffraction profiles for the AgCdS-T samples which indicate the presence of the hexagonal phase of CdS (JCPDS: 01-077-2306). The position of the main diffraction peaks does not shift with the temperature used in the synthesis (inset Figure 2) which means small modification of the CdS lattice by the insertion of Ag+ ions. The strain component (ε parameter, Table 2) calculated from Williamson–Hall linear fit (Figure S1) shows low lattice strain which indicates that the presence of silver equilibrates the lattice of CdS. The calculation of the lattice strain was not possible for the AgCdS-90 sample probably due to its highly anisotropic character [30]. The crystalline domain sizes of the CdS (Table 2) in AgCdS-T samples increase with the rise in the solvothermal temperature and the relative intensities of (100)/(002) hexagonal planes (Table 2) grow in parallel indicating preferential orientation of the CdS nanostructures along the c-axis. In the XRD profiles of the samples synthesized at 90, 120, and 150 °C is also detected the segregation of monoclinic Ag2S (JCPDS: 00-014-0072). Small diffraction peaks associated to cubic Ag0 (JCPDS: 00-004-0783) was also detected in the samples prepared at 150 °C and 190 °C. The intensity of the diffraction peaks of Ag2S tends to decrease with the rise in the solvothermal temperature while the intensity associated to metallic silver increases simultaneously.

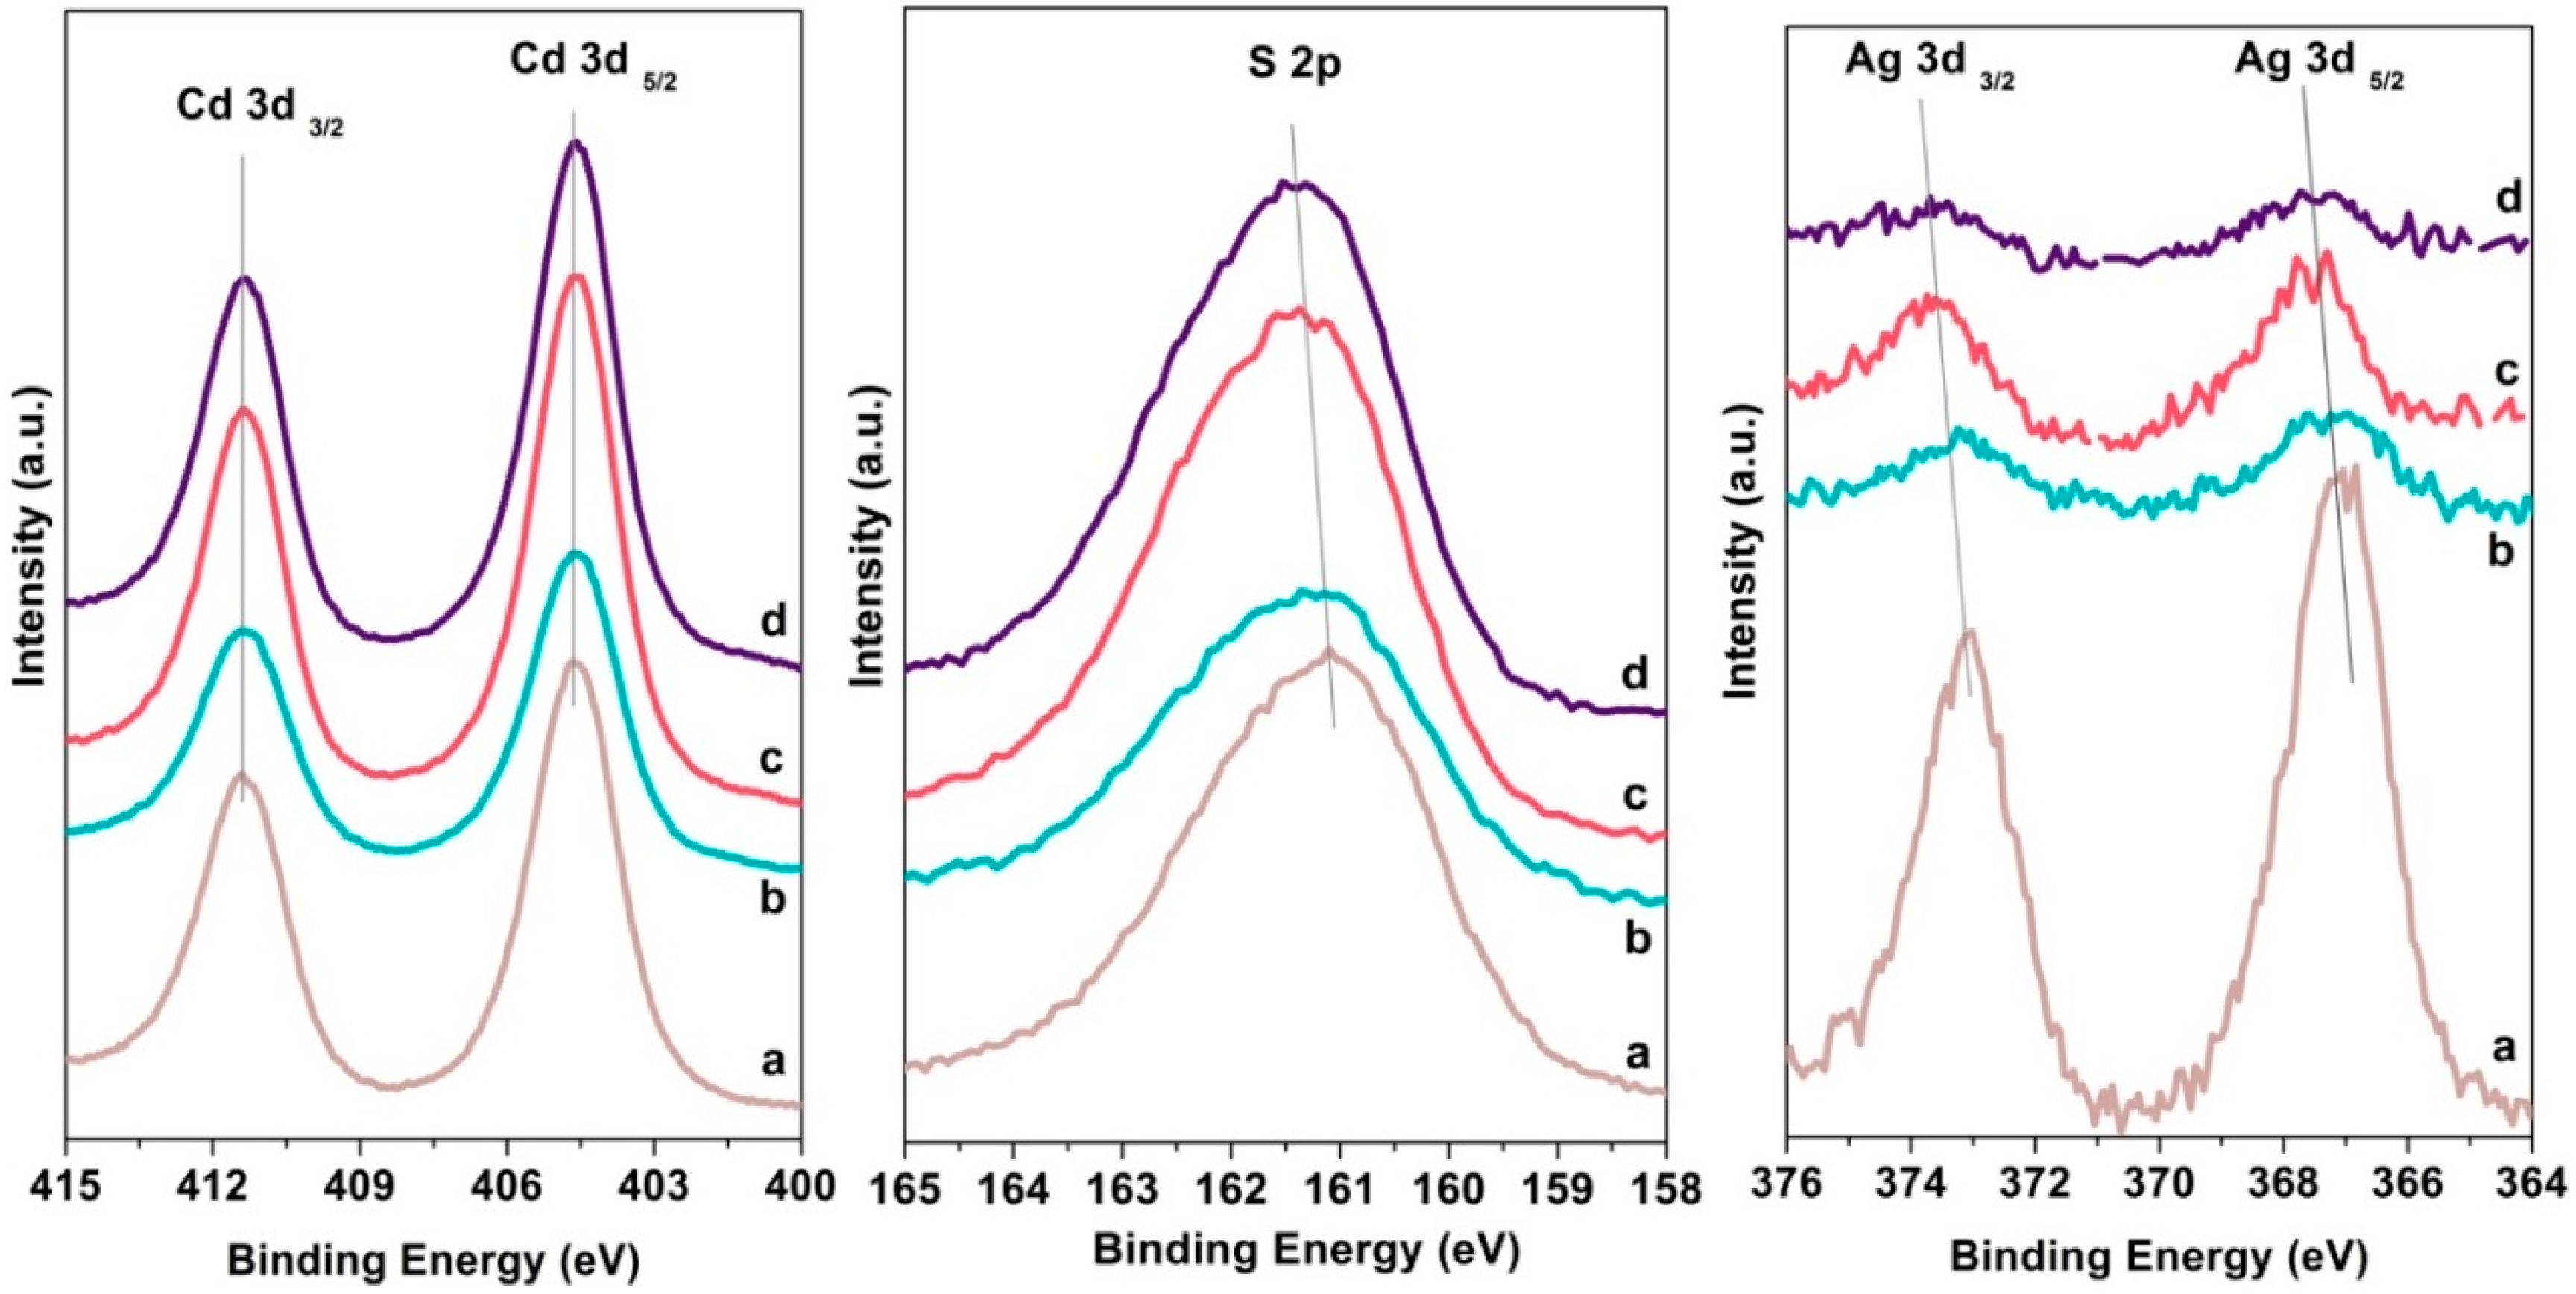
2.1.3. X-ray Photoelectron Spectroscopy (XPS)

The composition and oxidation state of the elements on the surface of the AgCdS-T photocatalysts were analyzed by XPS. Binding energies for Cd 3d, S 2p, and Ag 3d core-levels were recorded (Figure 3) and summarized in Table 3. The Cd 3d5/2 region in all AgCdS-T samples show binding energies located around 404.6 eV which are consistent with Cd2+ ions bonded to S2− in CdS [31]. The Ag 3d level in the samples synthesized below 150 °C (AgCdS-90 and AgCdS-120) shows a main contribution around 367.2 eV which are close to that reported for Ag2S species [32,33]. The Ag 3d level in the AgCdS samples prepared above 150 °C (AgCdS-150 and AgCdS-190) showed a second minor component at binding energies around 368.4–369 eV characteristic of metallic Ag species [34,35]. The position of the main contribution of S 2p region in all AgCdS-T samples appears at 161.1 eV in agreement with the values reported for S2− anions [36]. However a slight shift to higher energies has been observed in the samples prepared at higher temperature associated with the appearance of sulphur vacancies derived from the formation of metallic silver in the surface of the AgCdS photocatalysts.
The surface concentration of Cd, S, and Ag calculated from XPS areas are listed in Table 3. The AgCdS-T photocatalysts prepared at temperatures above 120 °C shows sulfur impoverishment at surface level and a decrease in the surface concentration of silver that become relevant in the sample prepared at 190 °C. The decrease in the concentration of sulfur could be consequence of the increase in the number of vacancies with the increase in the temperature of synthesis while the lower surface concentration of silver is in line with the increase in the particle size of silver species already observed by XRD (Figure 2).

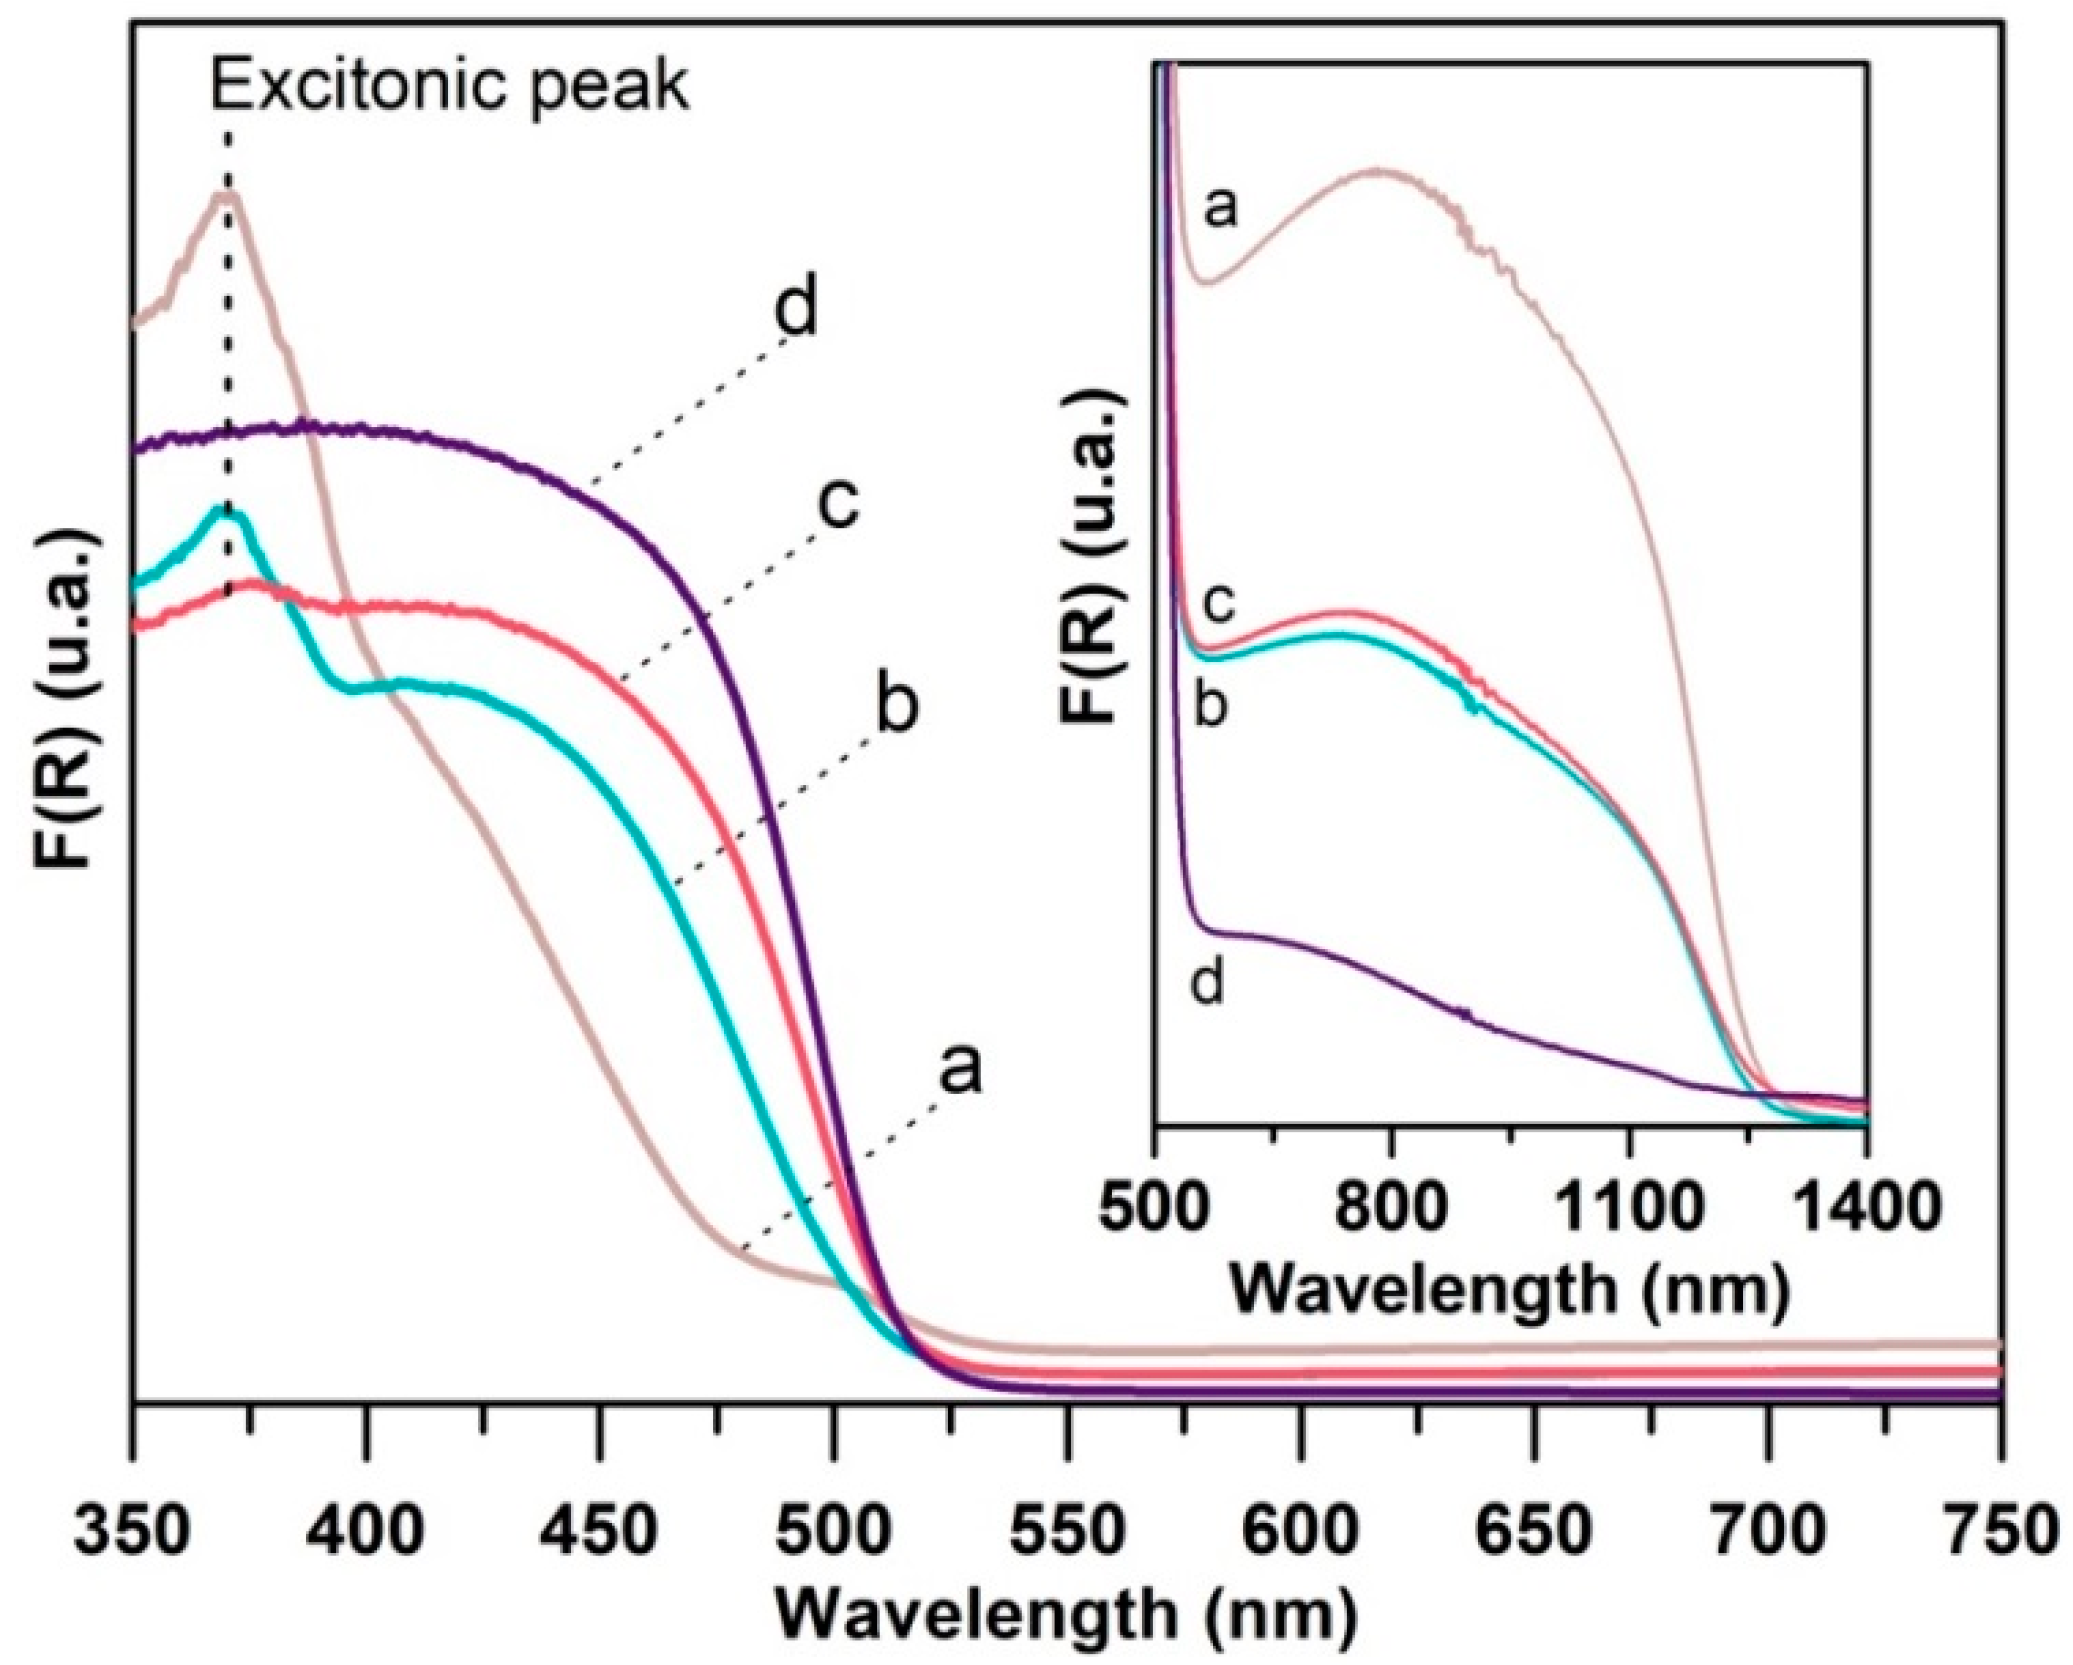
2.1.4. UV–vis Spectroscopy (UV–vis)

Figure 4 collects the UV–vis spectra of the AgCdS-T photocatalysts. The sample prepared at 90 °C showed two different absorption steps below 500 nm related with the coexistence of cubic and hexagonal phases of CdS [4,37,38]. On the contrary, the samples prepared at higher temperature show one well-defined absorption edge around 500 nm related with the allowed transitions in the CdS with hexagonal phase. It is interesting to note that the samples prepared at temperature below 150 °C also exhibit an excitonic emission peak located at 370 nm. This emission peak is related with the presence of small crystalline domains of CdS with a diameter lower than its Bohr radius (<2.5 nm) which produces a strong quantum confinement effect (SQE) [39]. The concentration of this type of nanostructures, commonly known as quantum dots (QD), depends on the temperature of synthesis showing the sample AgCdS-120 the maximum concentration of these species (Table 4). The UV–vis spectra of AgCdS-T samples also show (Figure 4) an additional absorption shoulder around 500 and 1250 nm related to the absorption in the Ag2S species [40] whose intensity decreases with the increase in the temperature of synthesis in line with the decrease in the segregation of Ag2S previously observed from the XRD analysis (Figure 2). The extension of the absorption range towards NIR of the AgCdS-T samples respect to the bare CdS was demonstrated through the UV–vis analysis of a sample of Ag2S prepared using the same solvothermal methodology (results not shown).
The absorption edges of the AgCdS-T samples shifted to higher wavelengths with the increase in the temperature which produces a decrease in its band gaps (Table 4, calculated from the slope of the Tauc plots (Figure S2)). The decrease in the band gap could be derived from the rearrangement and growth of the crystal domains of CdS leading to a better definition of the electronic band structure since crystallinity means low density of surface defects that result in the narrowing of the band gap [20,41,42,43]. However, it was observed tailing effects in the UV–vis spectra of AgCdS-T samples which denote the presence of some residual crystalline defects. These defects have been quantified by means of the Urbach parameter [41,42,43] (Figure S2, Table 4). Higher Urbach energy is observed for the AgCdS-T samples prepared at lower temperature as consequence of its crystalline disorder as already stated from the XRD data (ε in Table 2).

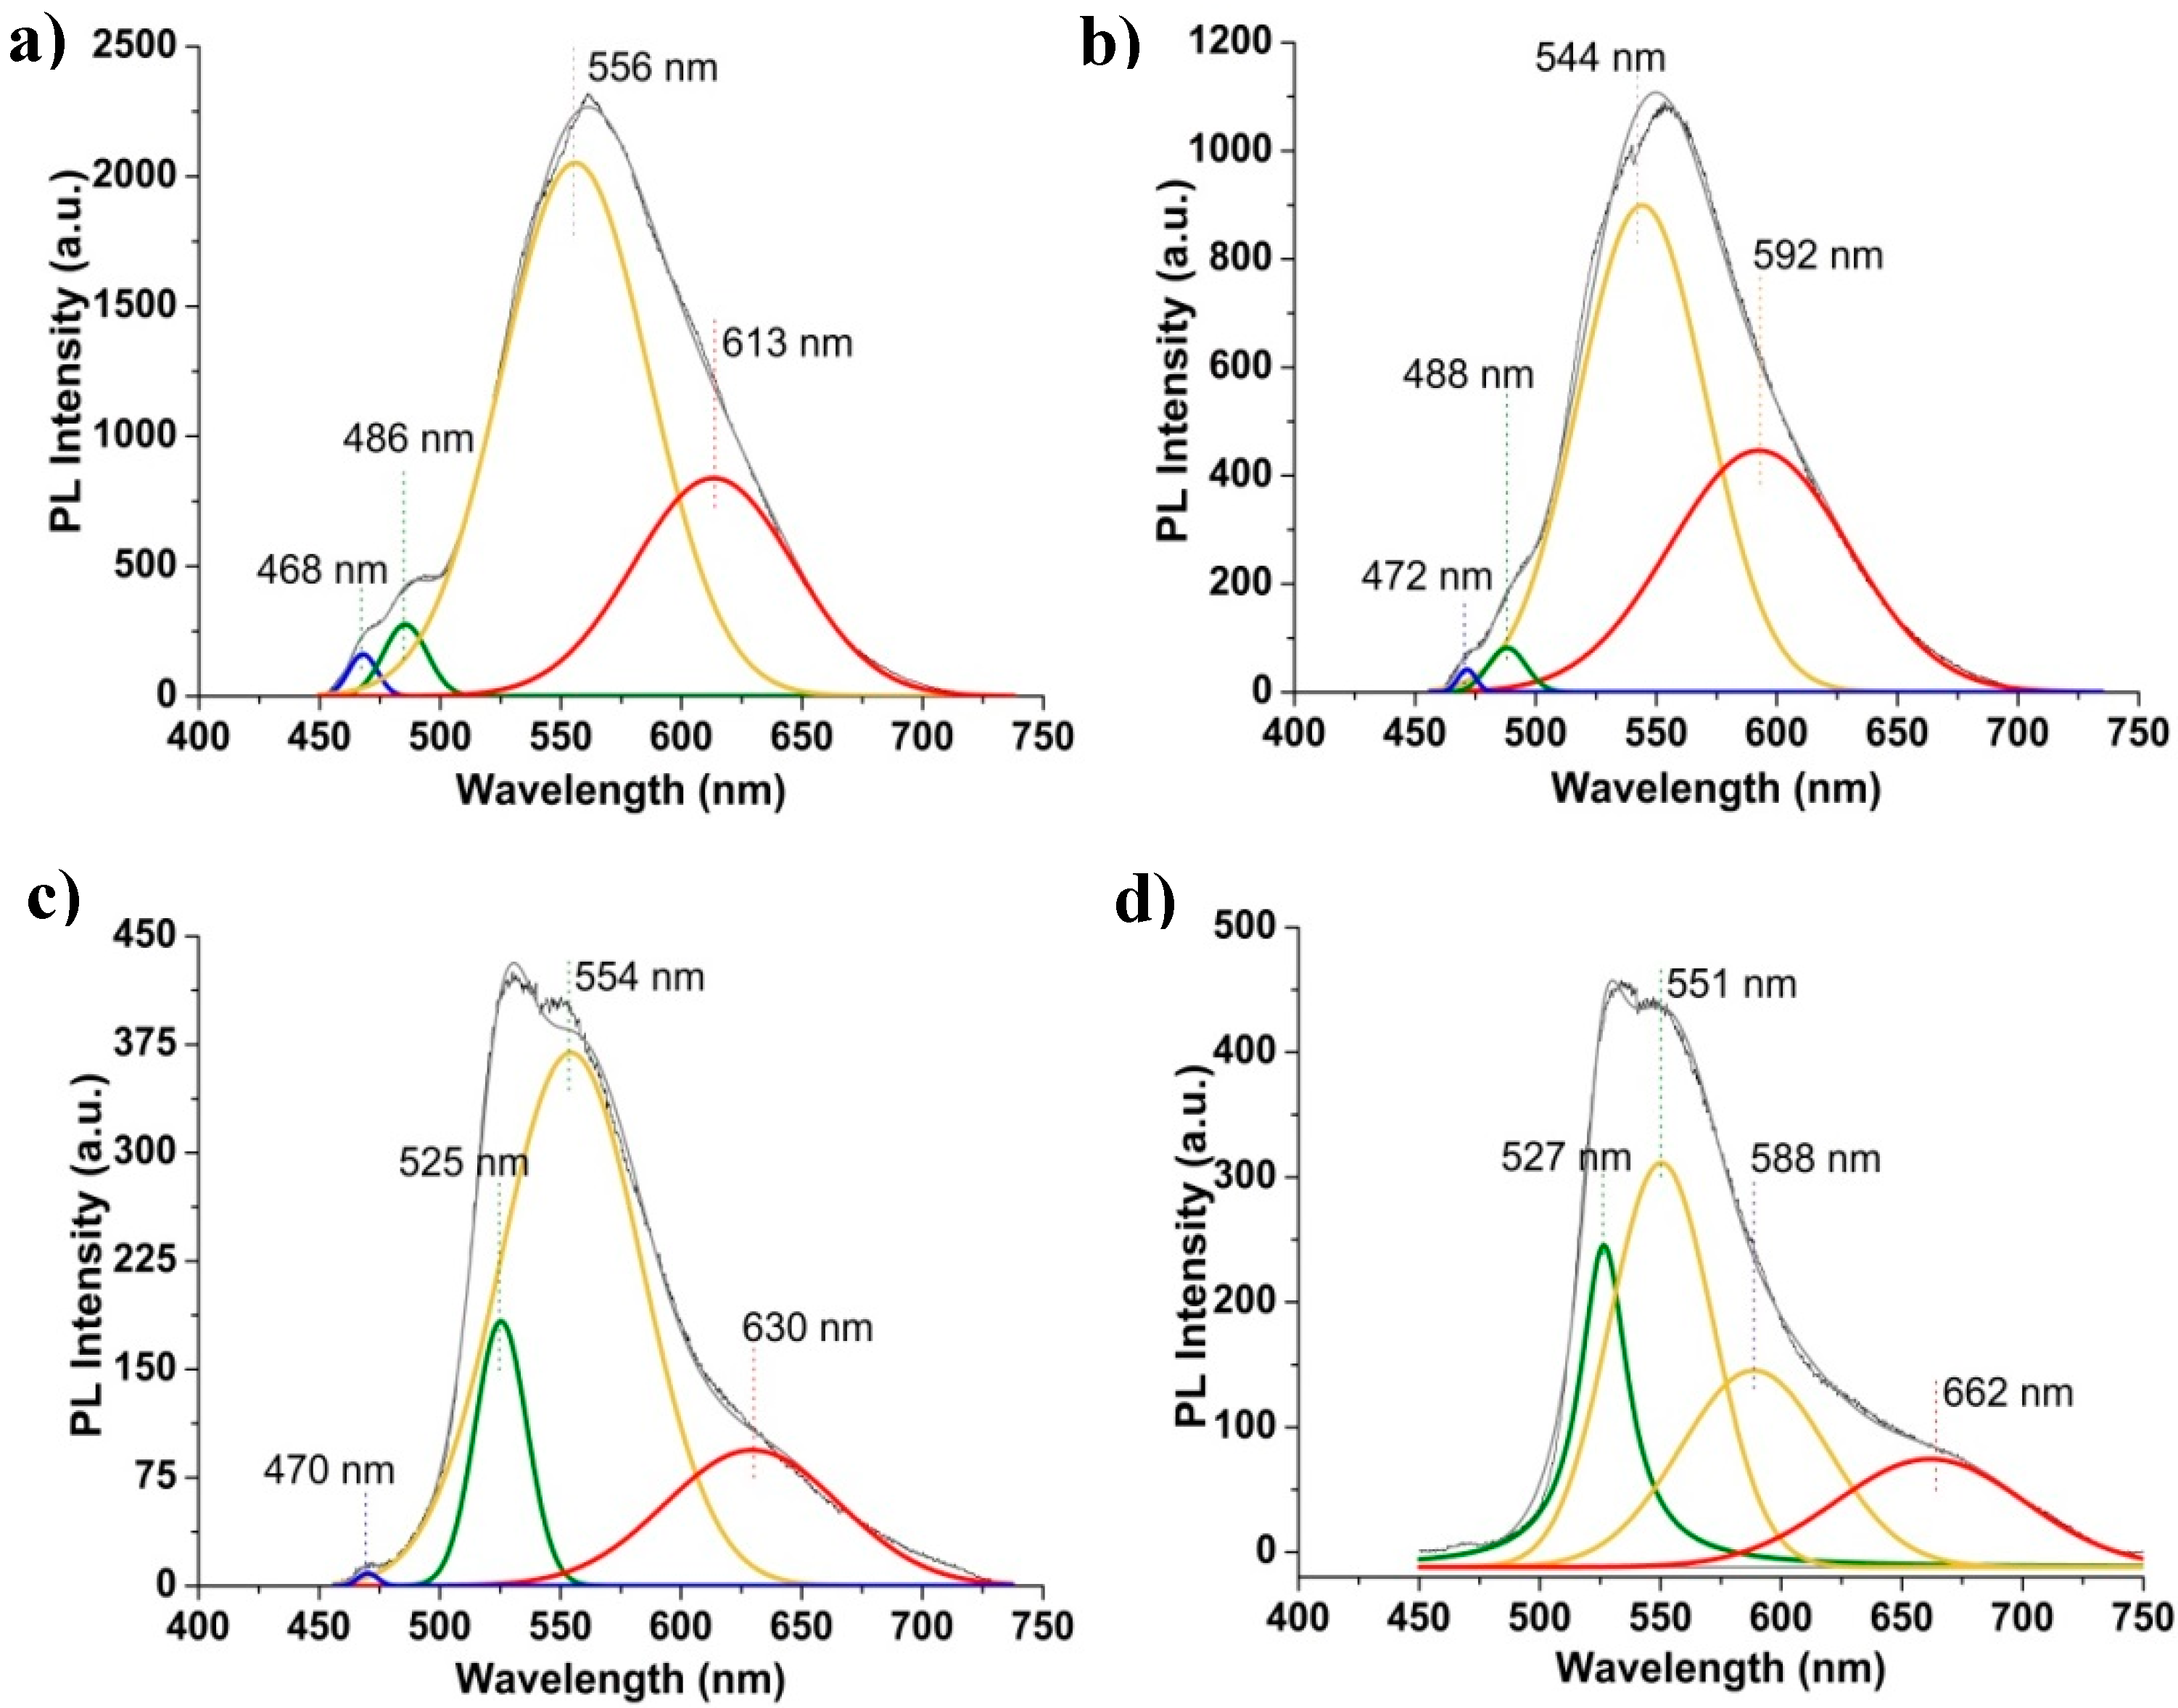
2.1.5. Photoluminescence (PL)

Figure 5 shows the photoluminescence (PL) spectra of AgCdS-T photocatalysts measured at room temperature with an excitation wavelength of 375 nm. All the samples show a green emission band in the 480–530 nm range associated with band to band transitions near the band gap of CdS [44,45]. This emission band shifts to higher wavelengths in the samples prepared at higher temperature. The excitonic peaks associated with the quantum dots observed in the UV–vis spectra of the samples prepared at temperature below 150 °C are translated as luminescent emissions located around 480 nm in its PL spectra [14,46,47]. The PL spectra of all samples also show a broader yellow emission band at 530–590 nm (Figure 5), which according to the literature [44,45] are originated from surface defects due to the presence of interstitial cadmium or cadmium vacancies. The profile of this band narrows and decreases as the solvothermal temperature increases. This evolution is consequence of the increase in the crystallinity and the decrease in the cubic phase observed in the AgCdS-T samples as the temperature of preparation increases. The samples prepared at temperatures above 150 °C show an emission shoulder over 590 nm which is commonly related with deep shallow defects derived from the presence of sulphur vacancies [48] which act as recombination sites of shallow trapped electrons in sulphur vacancy defect energy states with holes in the valence band [49]. The higher presence of sulphur vacancies in samples prepared above 150 °C is in agreement with the defective sulphur concentration previously determined by XPS analyses. In this sense, the shifting in this emission shoulder to higher wavelengths observed in the sample prepared at 190 °C may be related with the additional appearance of sulphur vacancies derived from the formation of metallic silver in the surface as discussed above in the XPS section.

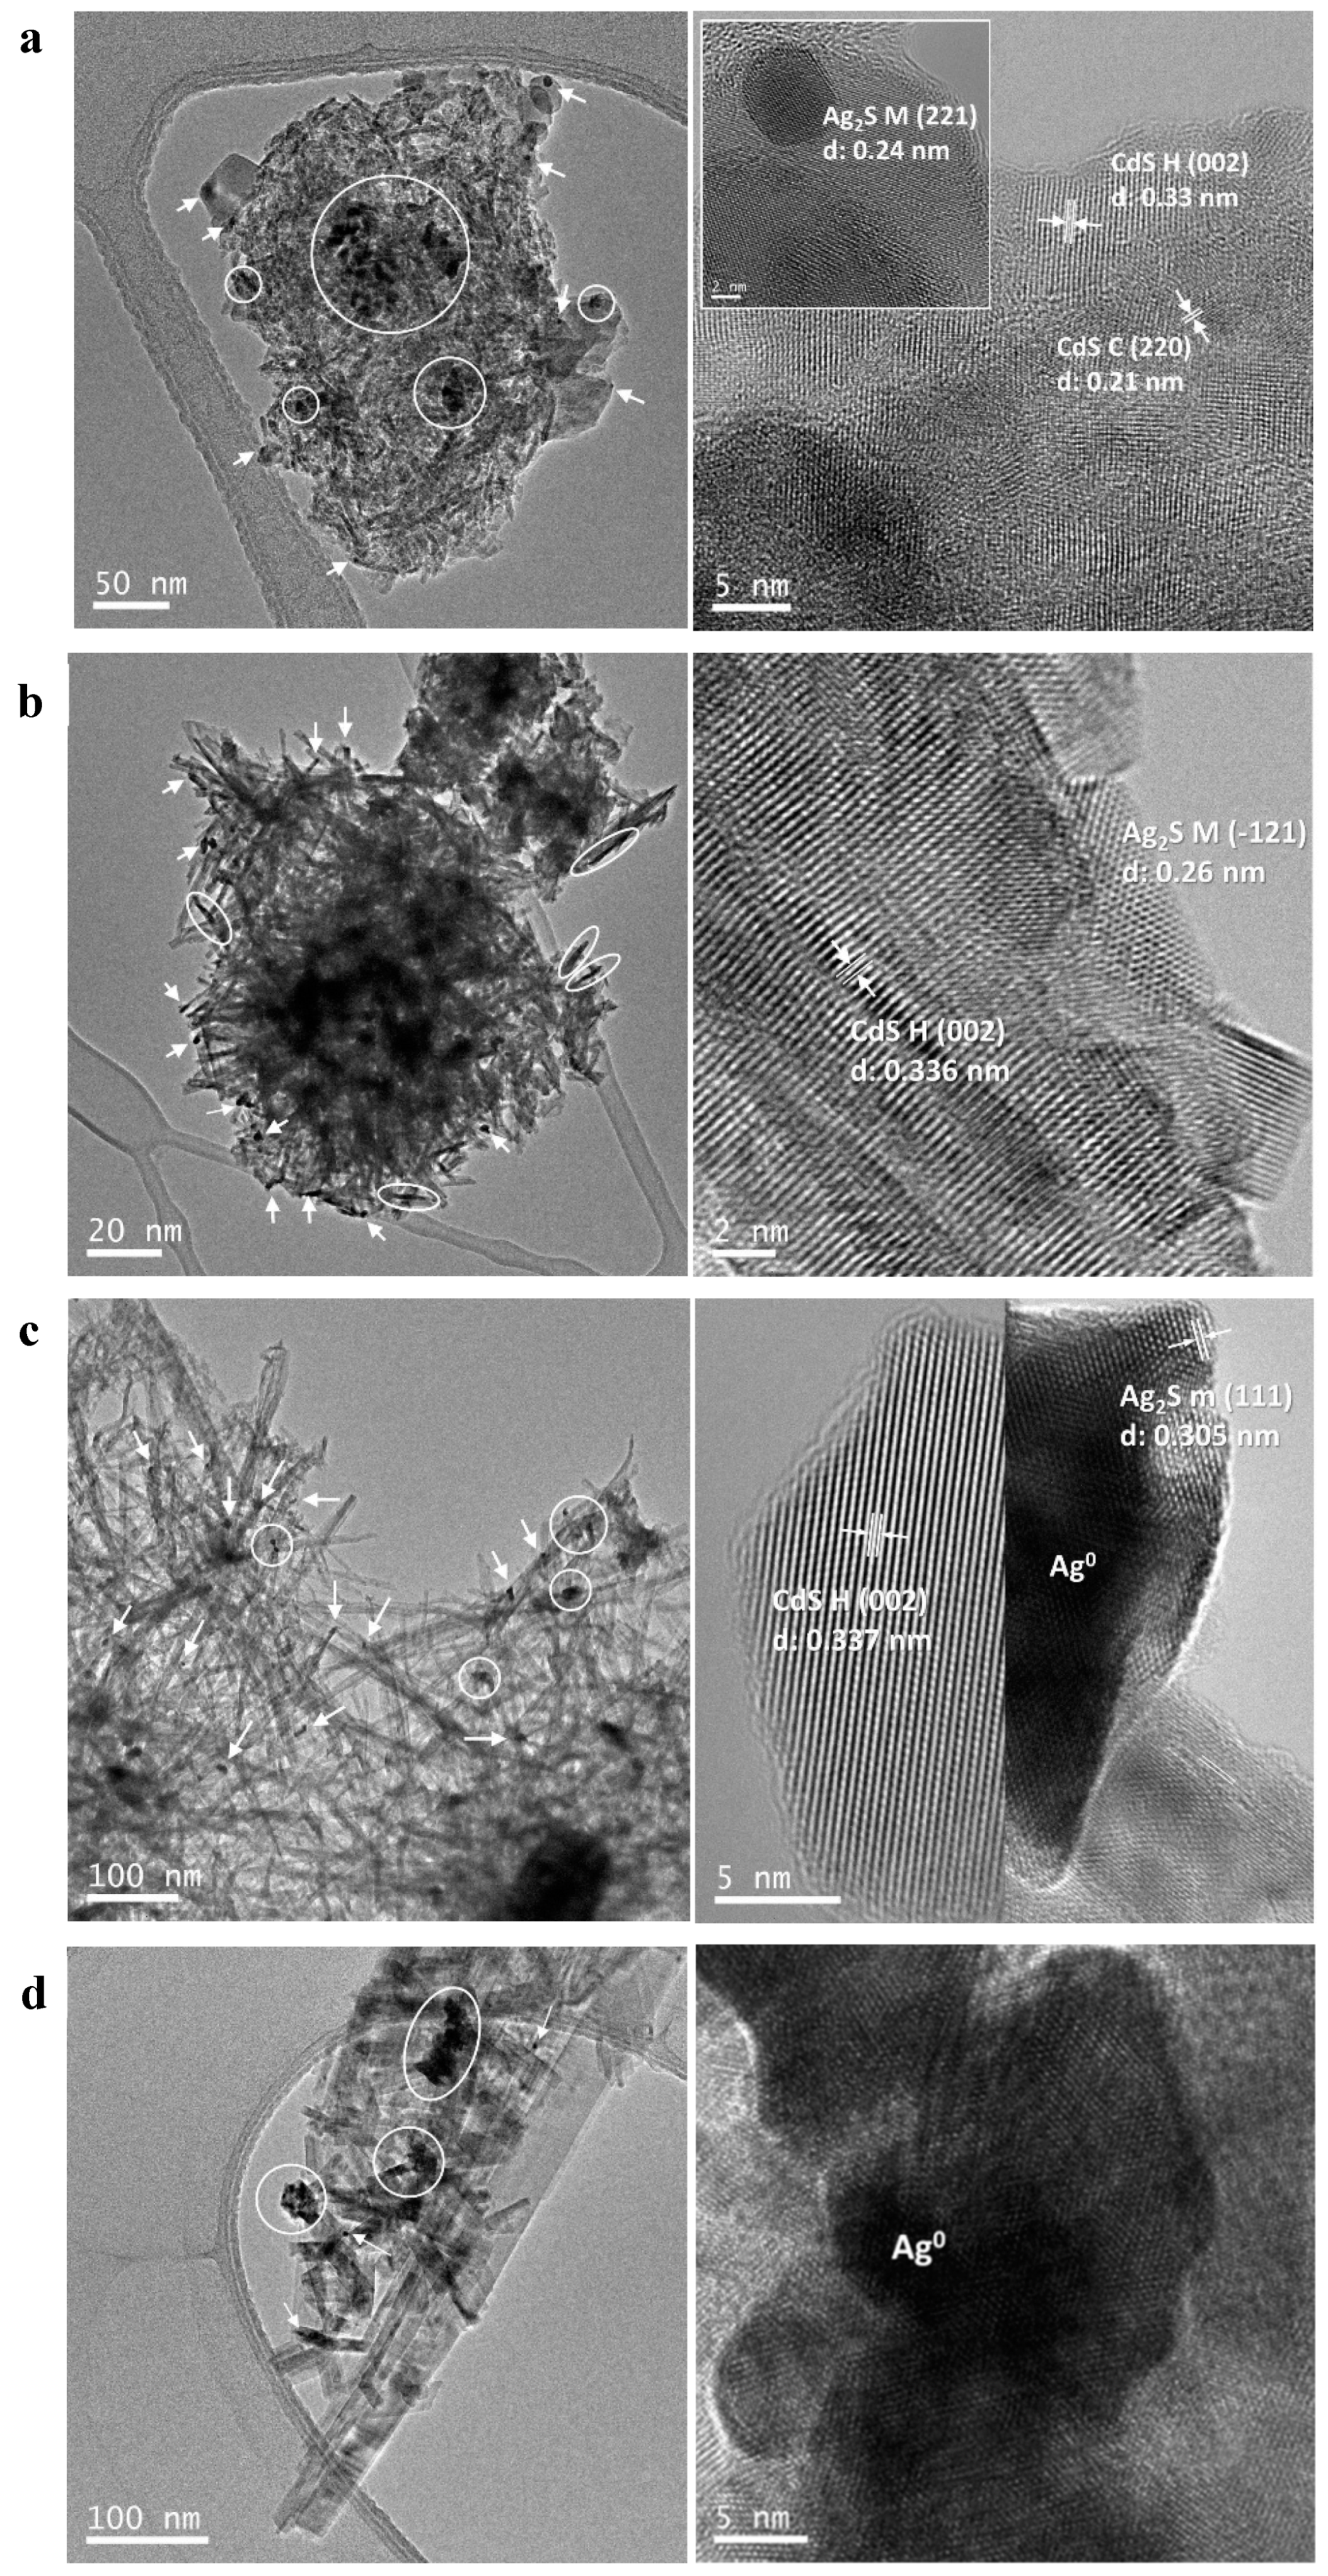
2.1.6. Transmission Electron Microscopy (TEM)

TEM micrographs of AgCdS-T samples (Figure 6) show an evident evolution of the nanomorphology of the CdS with the solvothermal temperature and the location and dispersion of the Ag2S/Ag0 species deposited over the CdS. It is observed a change from the prevalent lamellar nanostructures of CdS in the sample prepared at 90 °C (AgCdS-90 Figure 6a) to more defined CdS nanorods in the samples prepared at higher solvothermal temperature (AgCdS-150 Figure 6c and AgCdS-190 Figure 6d). The AgCdS-T samples prepared at temperature below 120 °C showed a lattice space corresponding to cubic and hexagonal phases of CdS, 0.33 nm and 0.21 nm respectively. These samples also displayed crystalline structures with interplanar distances corresponding to Ag2S monoclinic phase. This phase transforms into metallic silver in the sample prepared at 190 °C as it can be observed in the micrograph presented in Figure 6d. It was also observed slight differences in the dispersion and morphology of Ag2S/Ag0 species deposited over the CdS nanostructures (marked by arrows and circles in Figure 6). It was found the coexistence of highly agglomerated sphere-like and filamentous Ag2S structures at low temperature (Figure 6a,b) whereas at 150 °C the most of Ag2S/Ag0 particles are spherical and well dispersed (Figure 6c). At 190 °C the Ag0/Ag2S particles tend to bind together leading to irregular agglomerates on CdS nanostructures (Figure 6d).

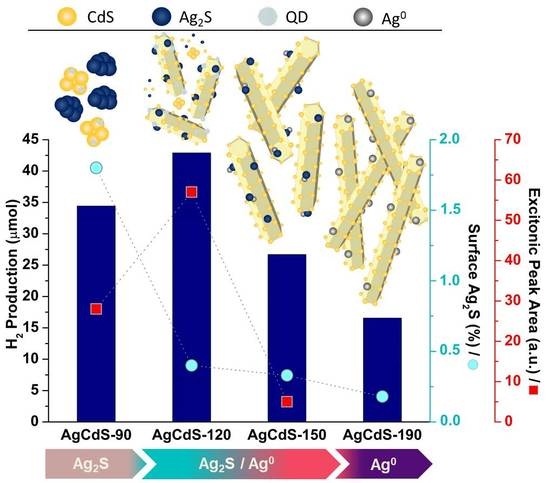
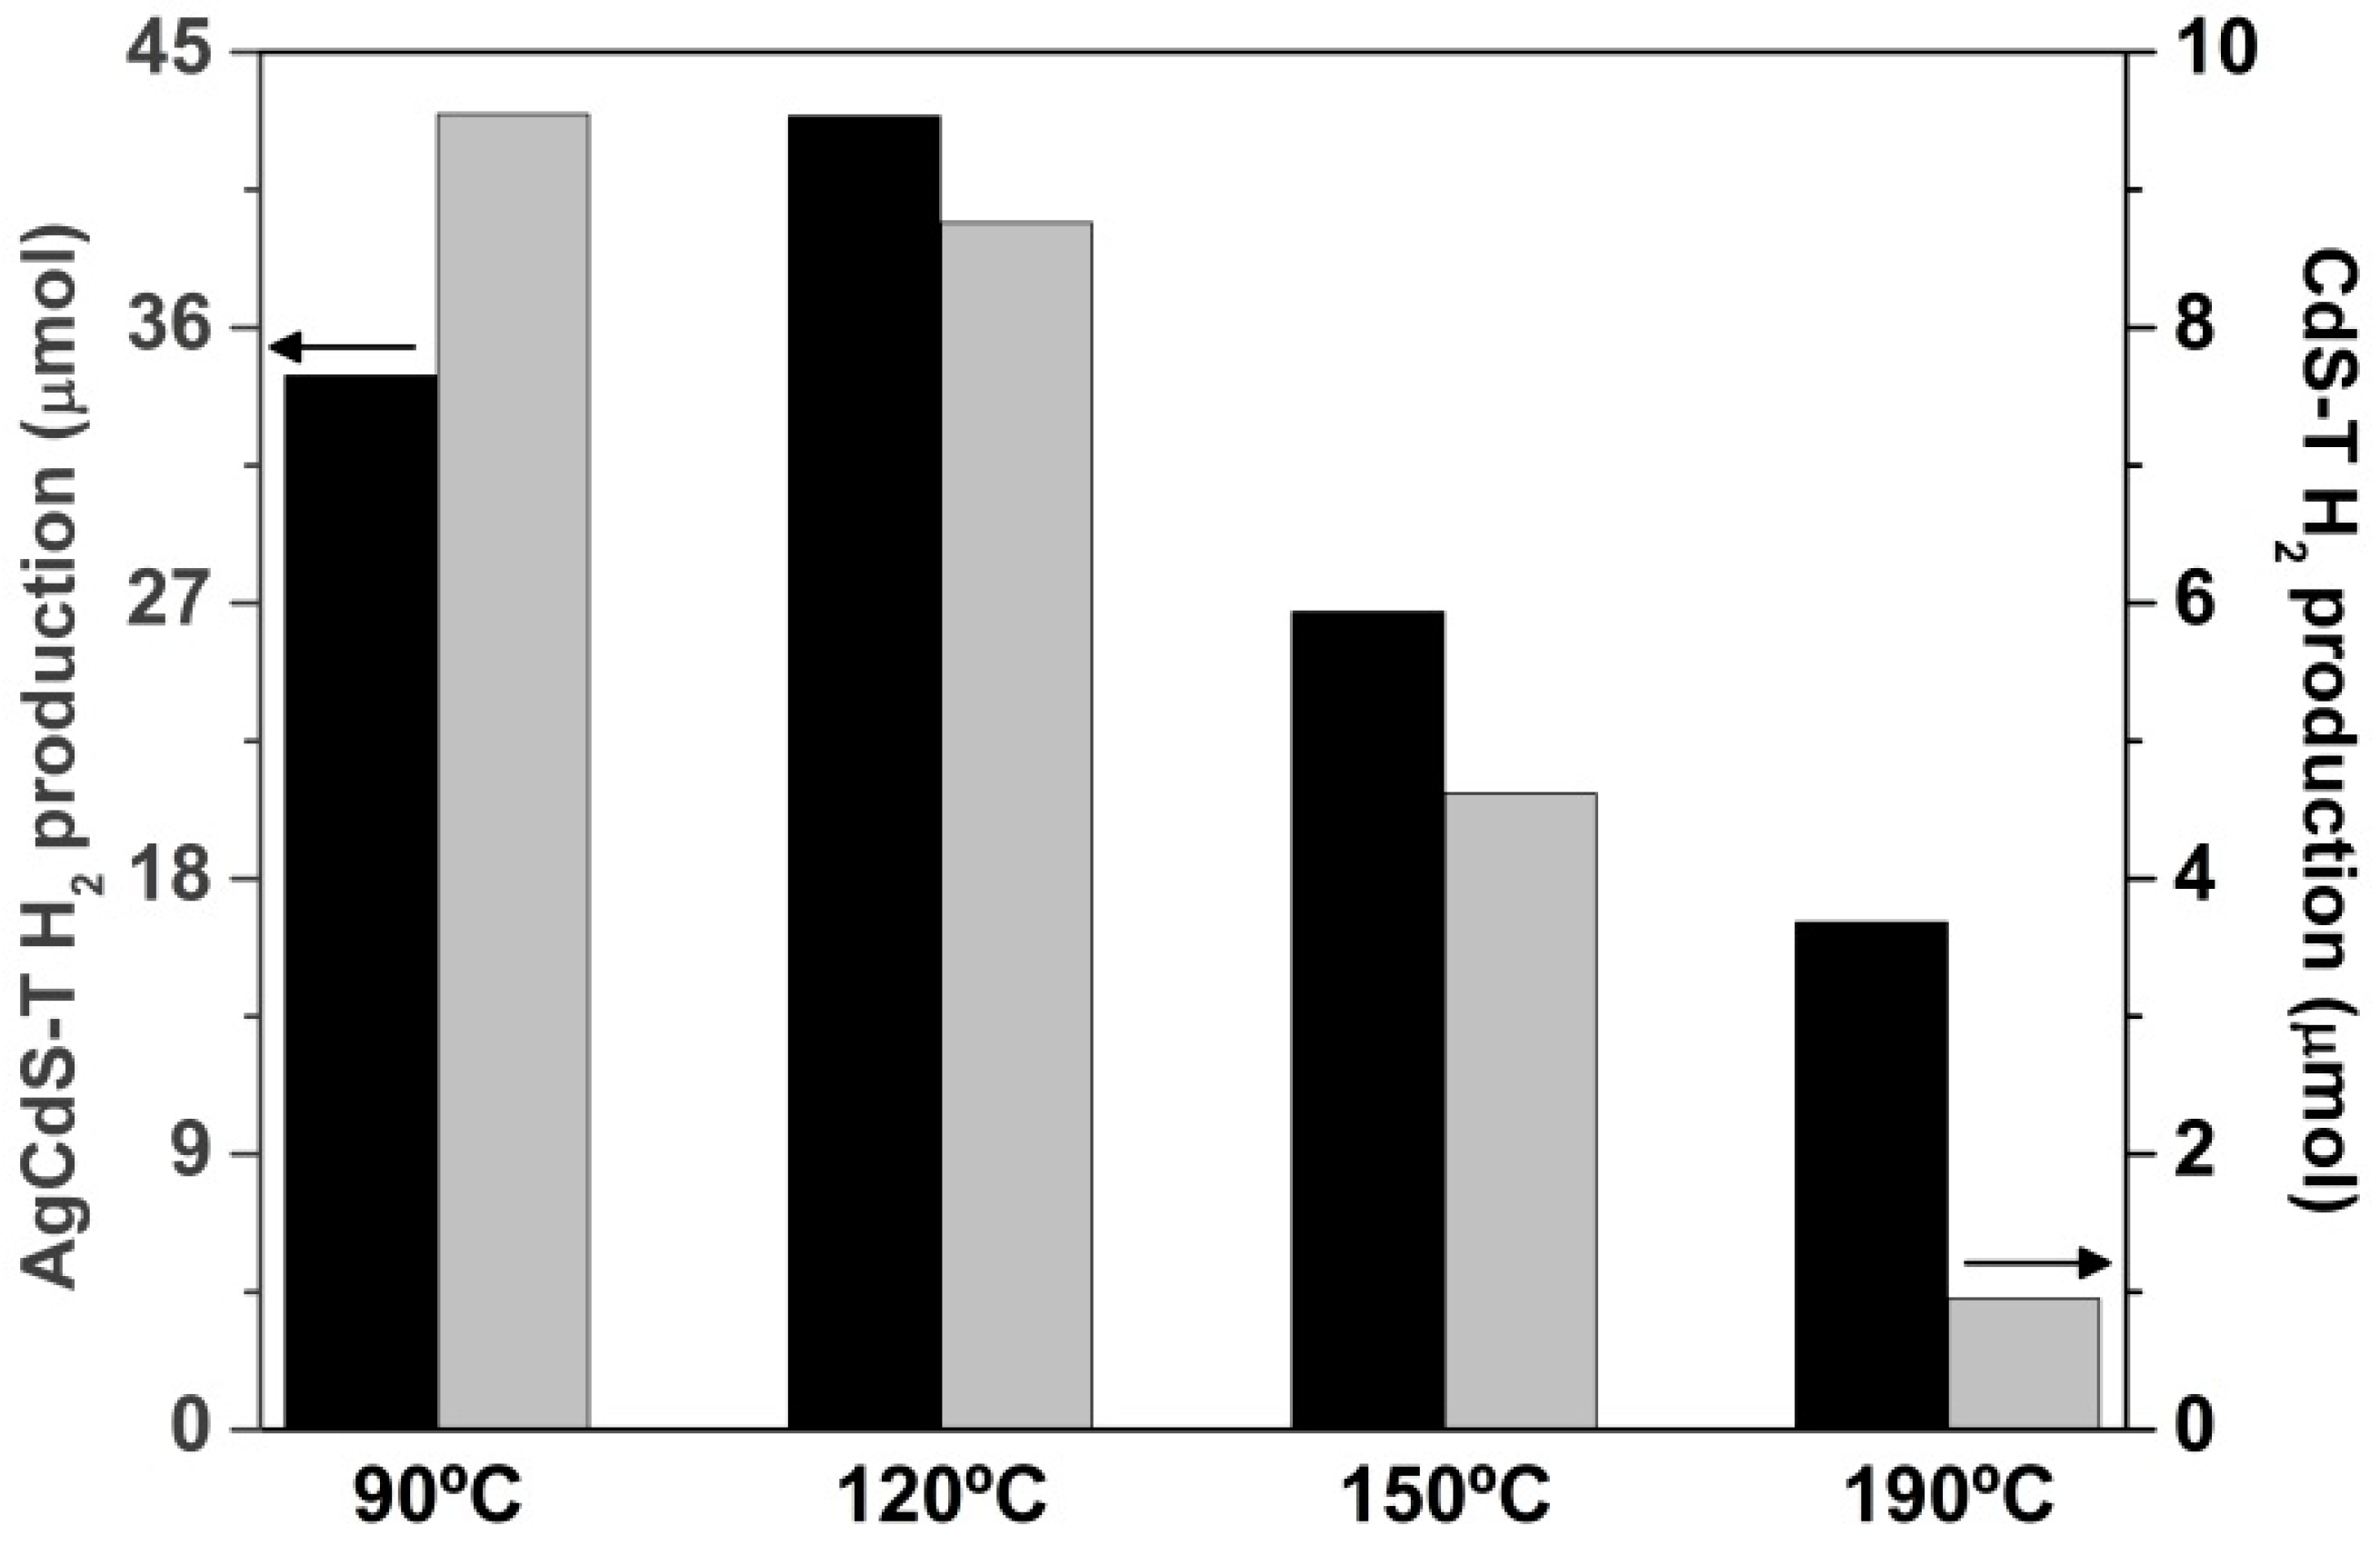
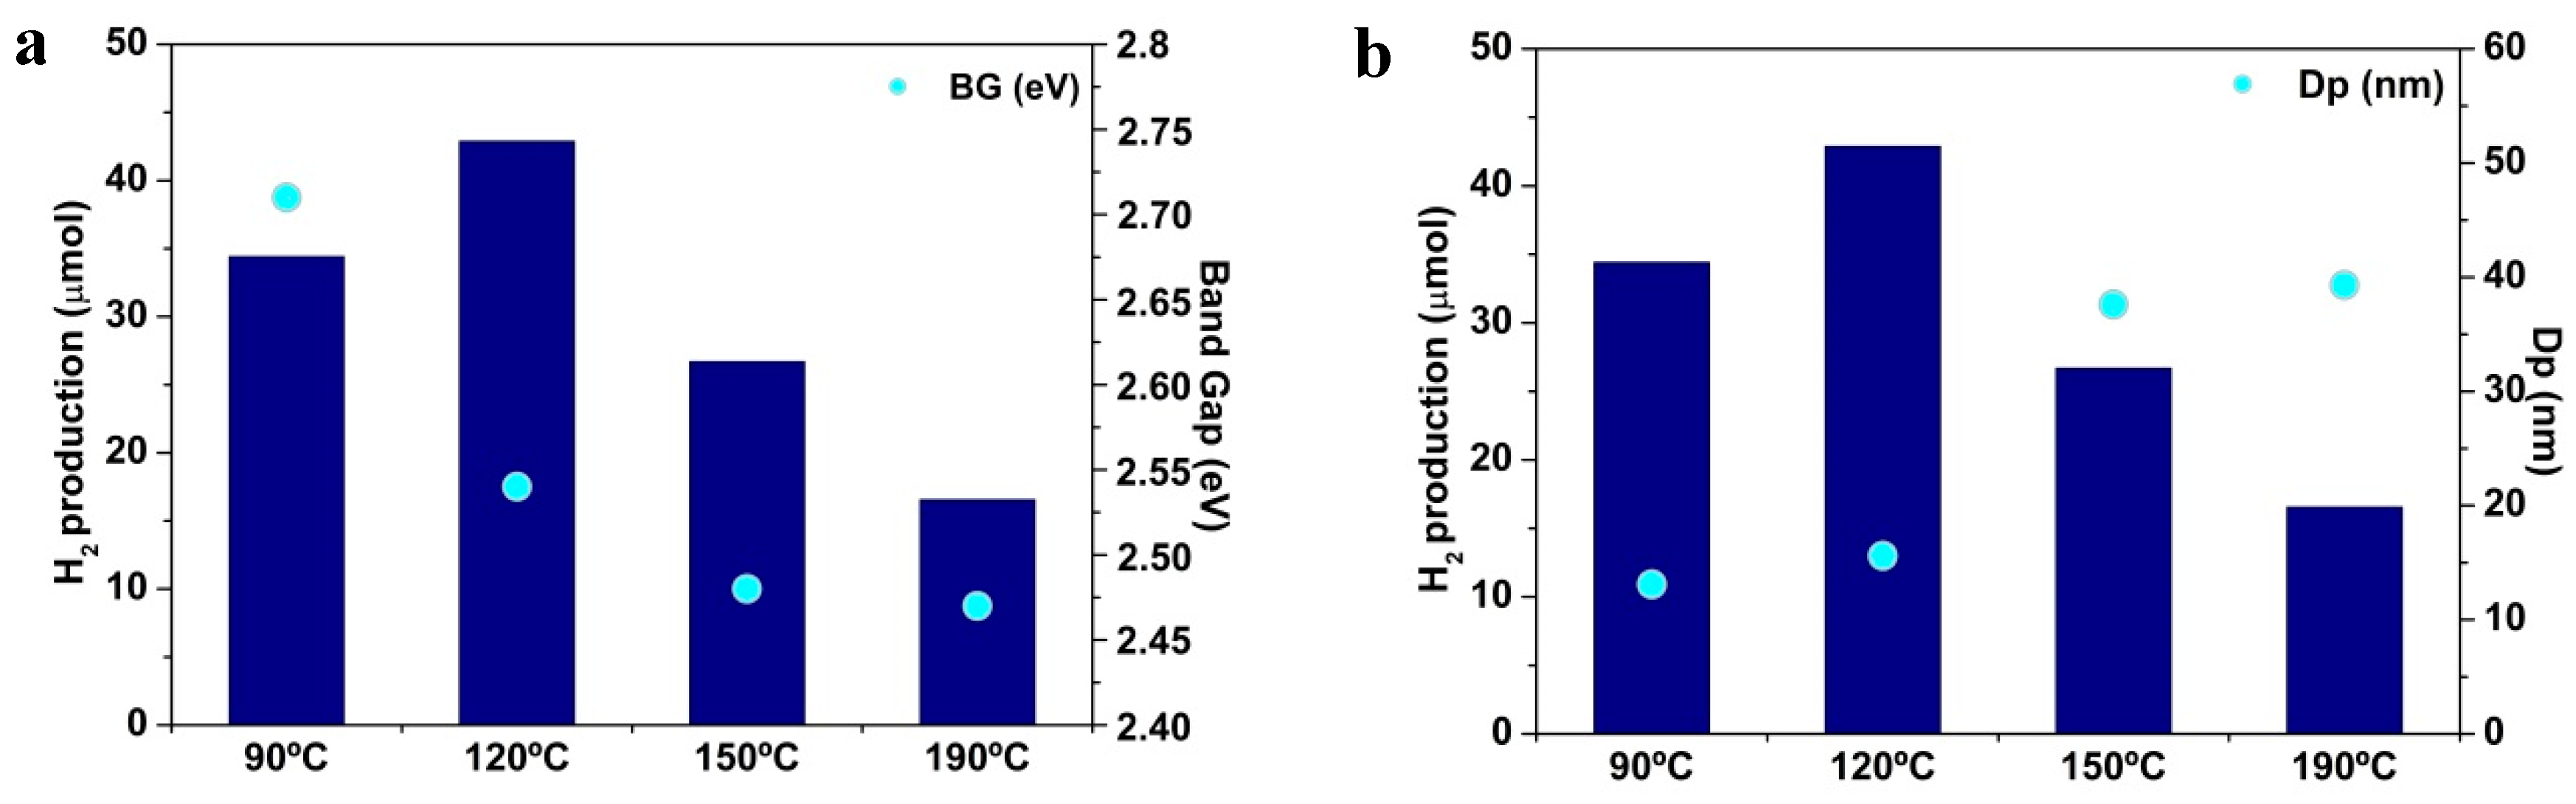
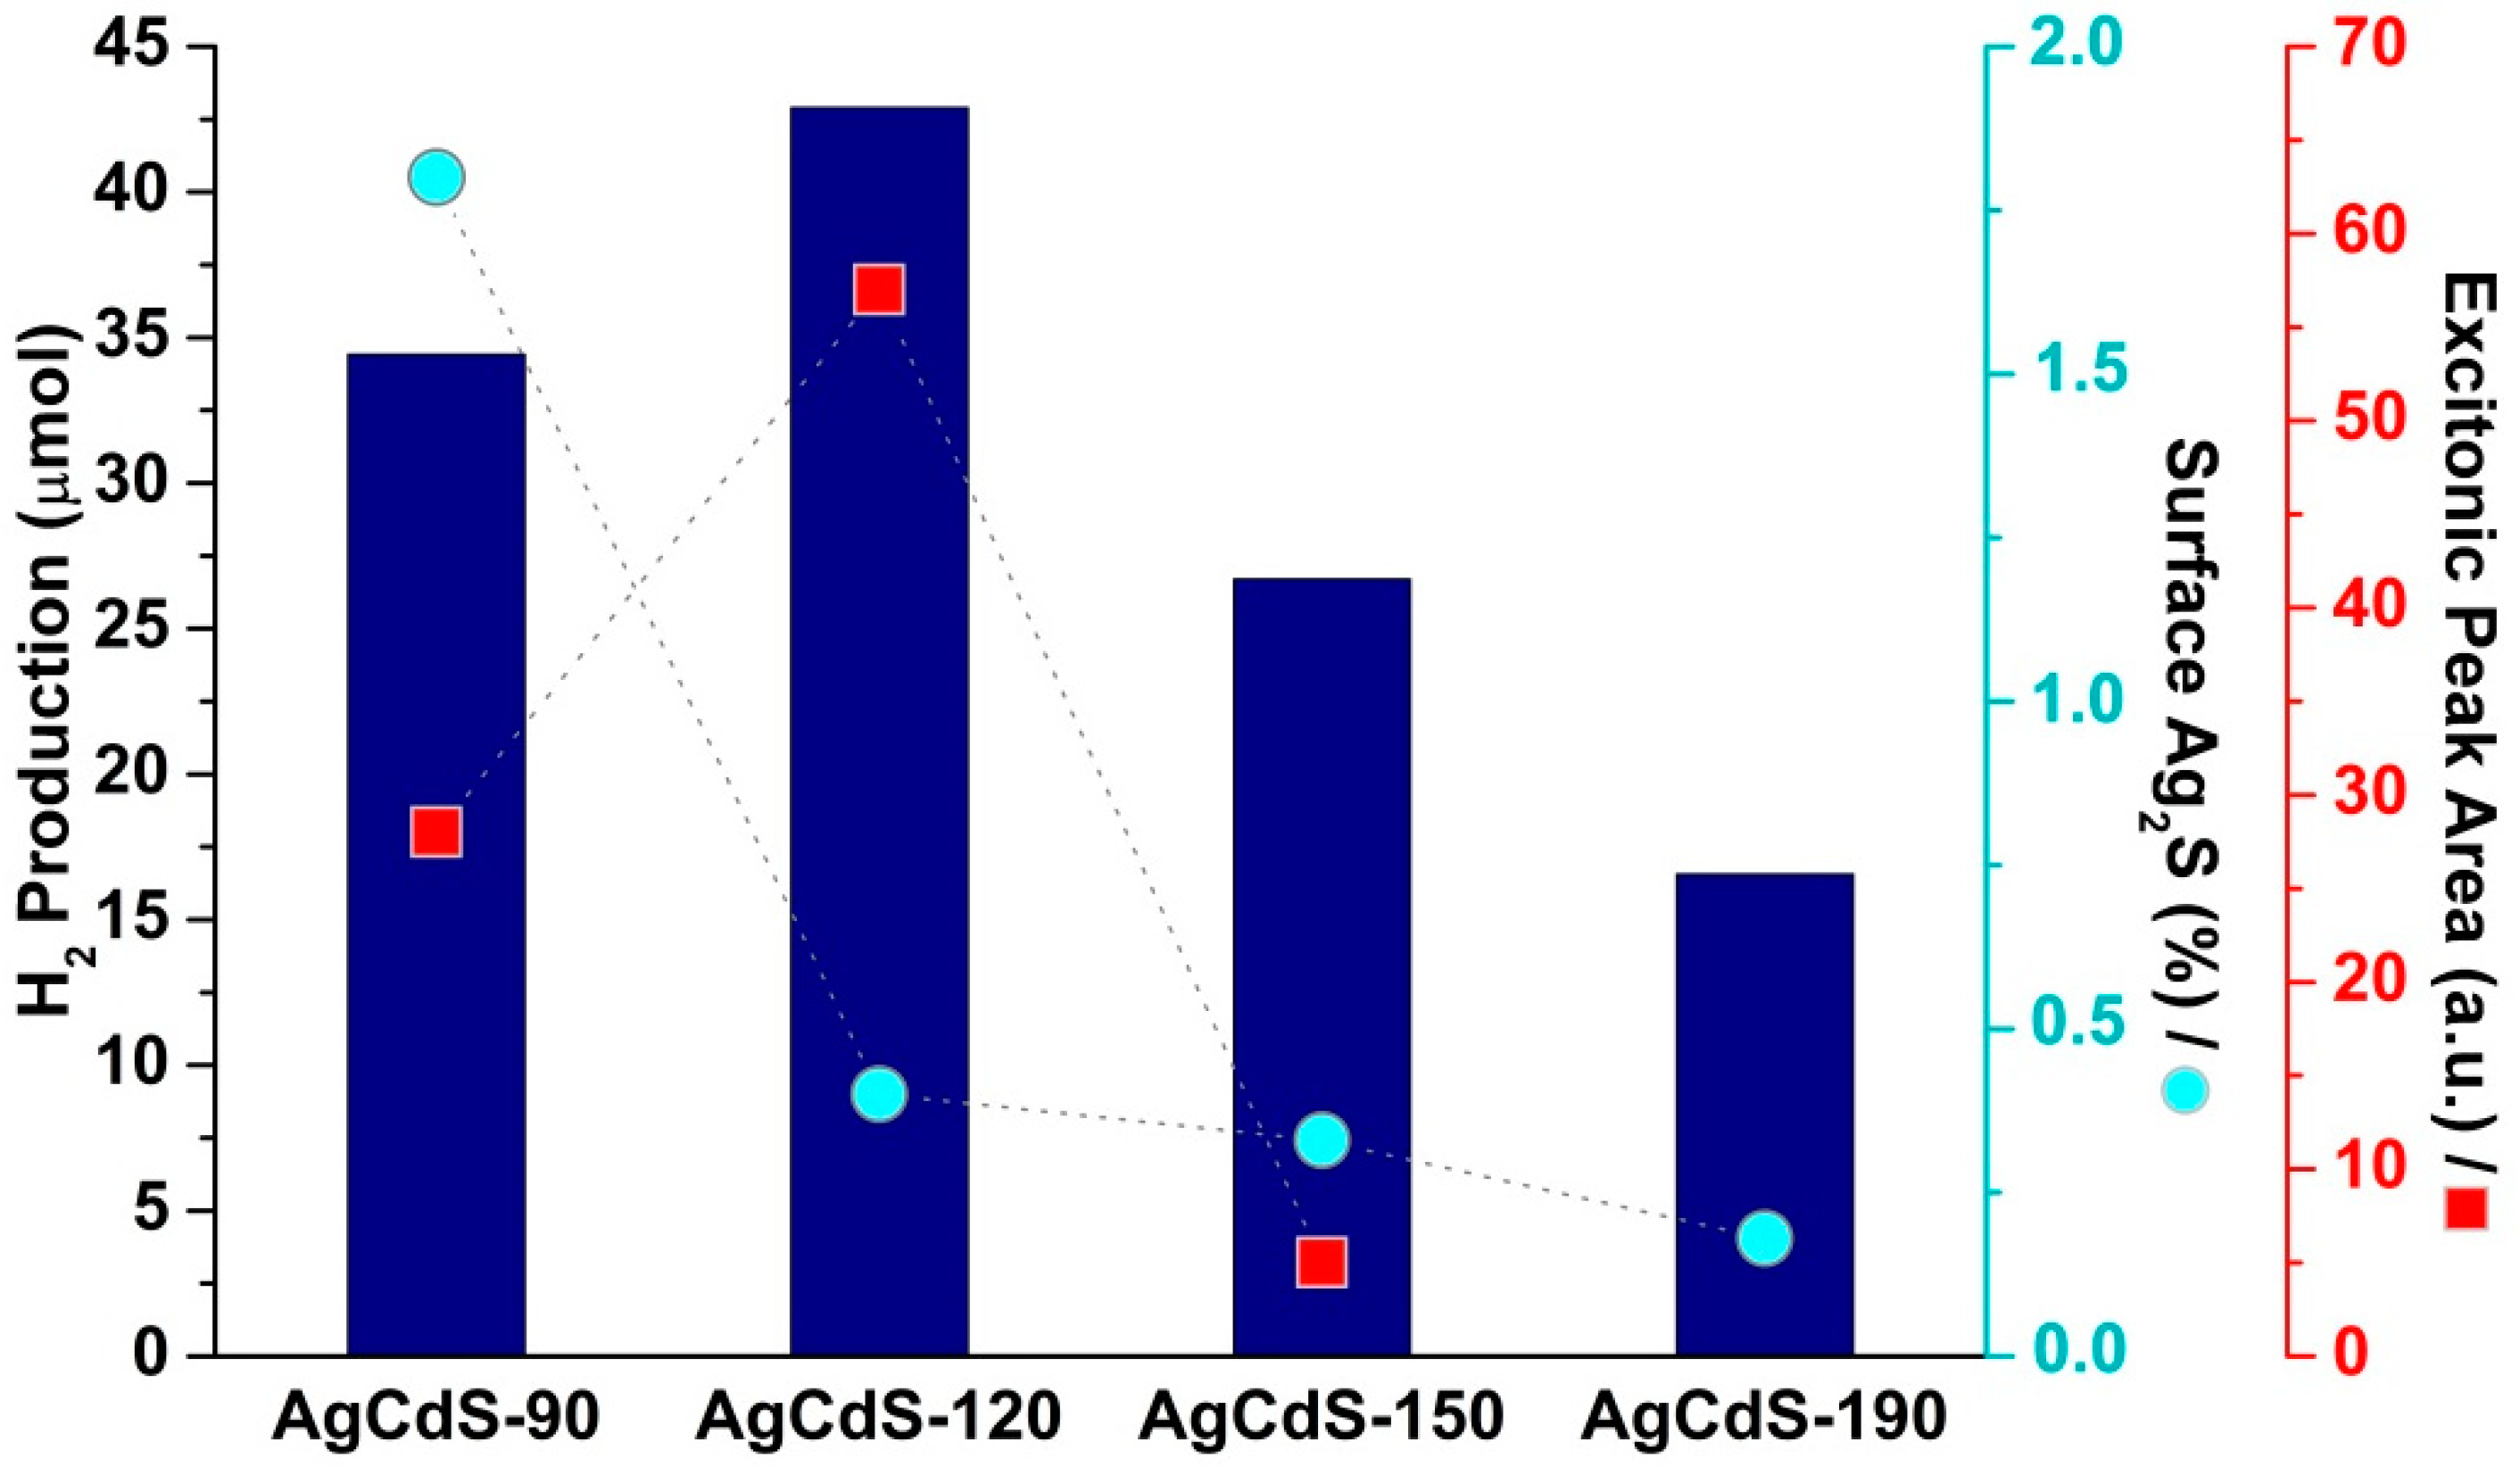
2.2. Photoactivity Tests
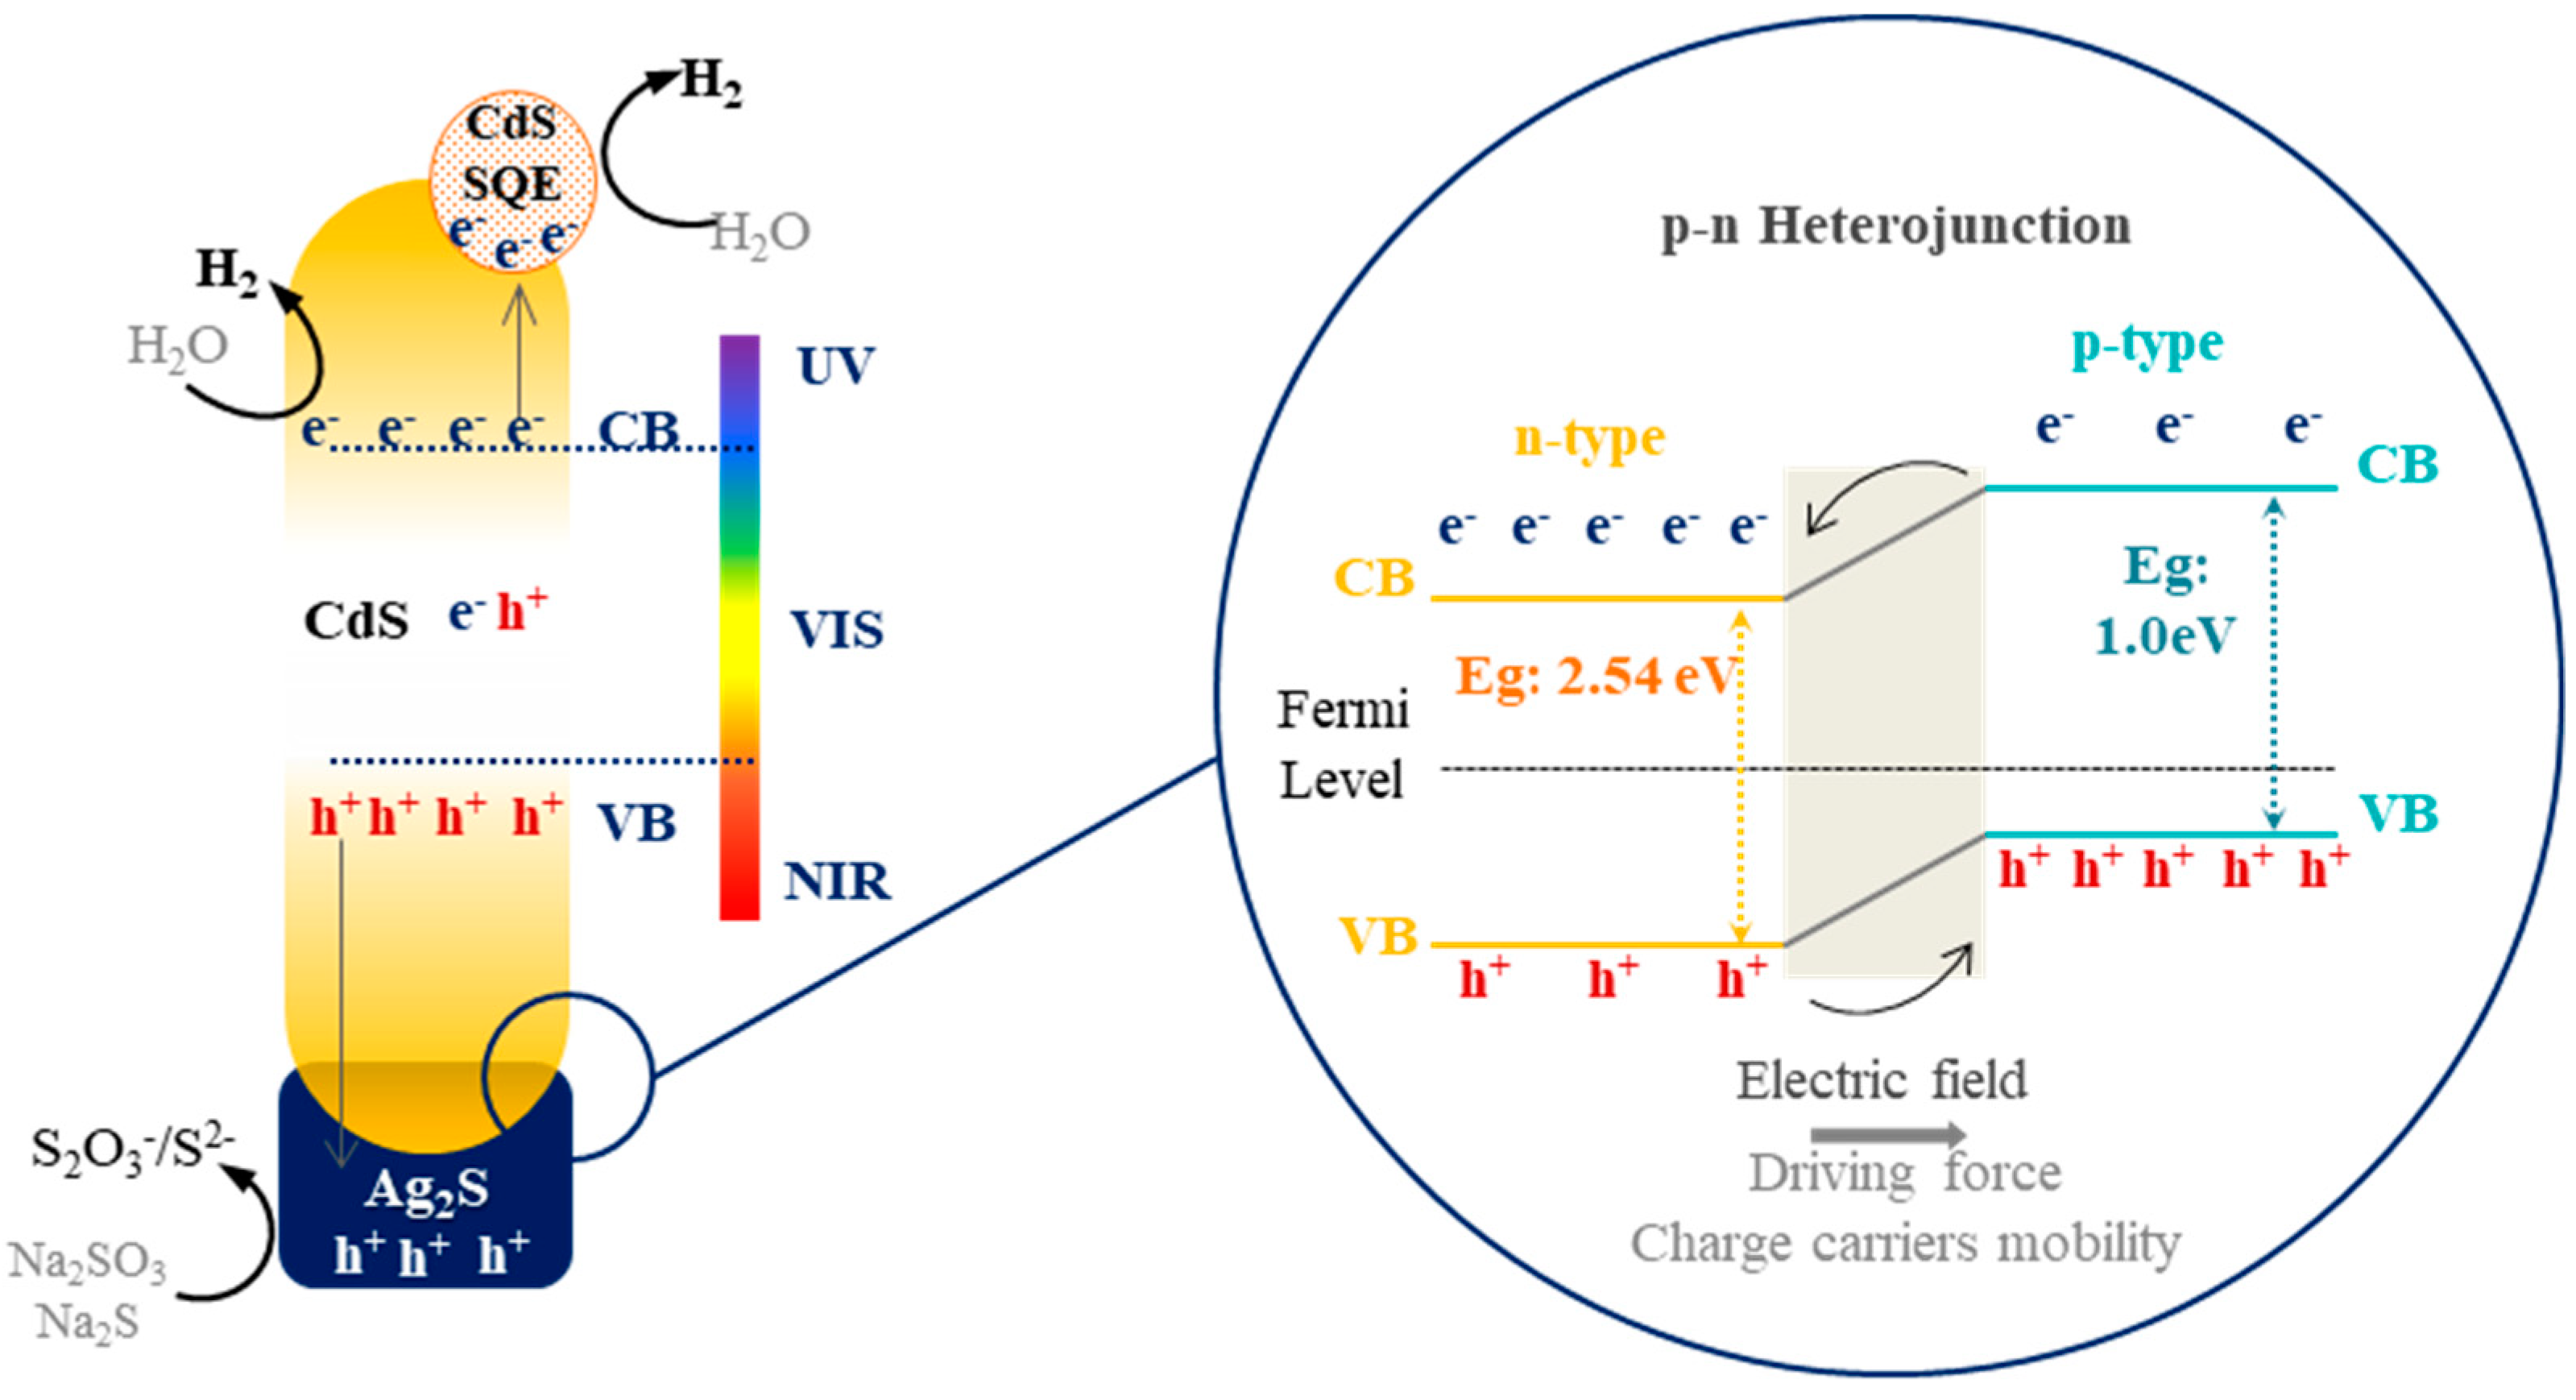
Figure 7 depicts the hydrogen production over the AgCdS-T samples. For comparison, Figure 7 also includes the photoactivity of bare CdS reference samples synthesized under similar solvothermal conditions. The AgCdS-T samples show higher activity than the bare CdS-T counterparts which demonstrates the promoter effect of the addition of Ag in the photoactivity of CdS. The photoactivity tests show important differences in the hydrogen production over the AgCdS samples depending on the temperature of synthesis. The sample AgCdS-120 shows the highest hydrogen production value followed by the sample AgCdS-90. On the contrary, the samples AgCdS-150 and AgCdS-190 show a sharp decrease in their photoactivity. The light conversion efficiency on the most active AgCdS-120 sample (0.54%) is close to the most active Ag2S/CdS system published in literature (0.7% [50]) in spite that the latter was modified with Pt as co-catalyst. The most active photocatalysts, AgCdS-120, was subjected to three consecutive photoactivity cycles in order to evaluate its stability under reaction conditions. It was observed some deactivation of the sample (around 2.9 µmol/h) which indicated changes in the initial characteristics of the sample under visible irradiation conditions. This fact contrasts with the stability of the Ag2S/CdS systems reported in the work of S.S. Mao et al. [50] but is in line with the low stability reported for the Ag2S/CdS samples prepared by precipitation method [51]. According to Mao et al. [50] differences in dispersion of Ag2S could be the origin of the observed differences in the stability of the Ag2S/CdS photocatalysts.

3. Discussion

The physicochemical characterization of the AgCdS samples has shown that solvothermal temperature produces modifications in the nanomorphology, crystallinity and chemical state of both the CdS and Ag structures. The reaction mechanism operating during the solvothermal synthesis of CdS has been described in our previous work [20]. However the presence of silver alters the solvothermal mechanism due to the much lower solubility of Ag2S (Ks = 6 × 10−51). The low solubility causes the quick precipitation of Ag2S which alters the nucleation and growth steps of CdS under solvothermal conditions [52]. In this scenario, the first nucleation of CdS in the form of sheets is affected by the precipitation of Ag2S forming heterojunctions between the two sulfides without excluding some insertion of Ag+ ions into the CdS during this nucleation step (Figure 2a and Figure 6a). The subsequent growth step of CdS after nucleation is determined by the temperature of synthesis which defines the kinetics of crystallization of two-dimensional sheets into one-dimensional nanostructures in agreement with the mechanism established for the formation of nanorods by rolling and breaking of the initial precipitates in form of sheets [53]. In such a way the variation in the solvothermal temperature produces important changes in the size, crystallinity, and nanostructuration of the CdS (Figure 2b–d and Figure 6b–d) as consequence of changes in the kinetics of crystallization. The solvothermal temperature also affects to the nature of the Ag structures because the Ag2S entities initially precipitated suffer (Figure 2a and Figure 6a) reduction by the ethylenediamine solvent at temperature higher than 150 °C forming metallic Ag0 particles in close contact with the nanostructures of CdS (Figure 3d and Figure 6d).
The surface area exposed to irradiation is one of the most important parameters that have influence on the photoactivity of AgCdS-T samples because this parameter is related to their ability for light absorption. However the differences in the normalized hydrogen production per surface area of the AgCdS-T samples (not shown) indicated the participation of other parameters, apart from surface area, to justify the differences in the photoactivity. The capacity to generate electron and holes is another important parameter related with the photoactivity. The generation of these charges is governed by the band gap of the Ag-CdS-T photocatalysts. In this sense, the comparison of the hydrogen production with the band gap of the samples (Figure 8a) did not show a linear relationship. In fact, it is observed higher photoactivity for those samples with higher band gap (AgCdS-90 and AgCdS-120) in spite that it implies less efficiency for visible light absorption. This behavior can be justified by the presence of quantum dots (QD) in the samples with higher band gap prepared at lower temperature, as it was observed from the UV–vis results (Figure 4). These QD nanostructures are able to absorb photonic energy to produce hydrogen themselves [20] and therefore they could be involved in the improvement of photoactivity observed in the CdS-T samples prepared at low temperature as shown in Figure 9. The mobility of the photogenerated carriers on AgCdS-T samples should be also analyzed in order to explain its photocatalytic behavior. It is well known that carrier mobility can be affected by the crystallinity and size of the CdS. The comparison between the CdS crystallite size calculated by the Debye–Scherrer equation with the photoactivity is presented in Figure 8b and from this figure it is not observed a linear relationship among the crystallite size of AgCdS-T samples and their capacity for hydrogen evolution. Hence the carrier mobility associated to the different size of CdS play a role in the photoactivity but is not the only factor which justifies the differences in photoactivity of the AgCdS-T samples.
As stated above, the carrier mobility can also be affected by the presence of co-catalysts which can modify the recombination mechanisms and/or the surface reactivity of energy carriers. Regarding to the PL measurements, it was observed a higher recombination rate for the AgCdS-T samples prepared at lower temperatures due to its lower crystallinity and high density of structural defects (Figure 5). The presence of silver exerts a quenching effect over the recombination processes (Figure 5) because of its ability to scavenge the holes coming from the CdS valence band. The quenching effect of silver depends on their state and concentration. PL measurements show that Ag2S species were more efficient for this purpose, because the reduction to Ag0 generates sulfur vacancies acting as deep shallow traps that favor the recombination of electrons and holes (Figure 5). Figure 9 compares the photoactivity of the AgCdS-T samples with the surface content of Ag2S in the samples determined by XPS (Table 3). Also in this case there is not a linear relationship among the Ag2S surface concentration and the capacity of the AgCdS-T photocatalysts to produce hydrogen.
Therefore, the photoactivity of the AgCdS-T samples is not defined by a single parameter but is linked to the combination of three main factors: CdS nanostructures, quantum dots (QD) and Ag2S species. The precise implication of each factor in the photoactivity of AgCdS-Ag samples is not easy to determine but it is clear that the three factors only concur in the AgCdS-T samples prepared at lower temperature which show the formation of the ternary CdS/QD/Ag2S systems as schematically represented in Figure 10. In this scenario the ternary system obtained in the sample AgCdS-120 was the most effective photocatalyst because it combines crystalline monodimensional CdS structures, the presence of quantum dots and the existence of Ag2S species. This combination offers the best photoactivity because the crystalline monodimensional CdS structures favours the effective charge carrier separation along the axial direction, the quantum dots capture electrons from the conduction band of the CdS and contributes to the production of H2 while the Ag2S species form a p–n heterojunction with CdS favouring the scavenging of holes from the valence band of CdS. The enhancement of photoactivity associated with Ag2S could be also induced by the additional light absorption in the 570–1250 nm region by Ag2S (insert Figure 4). However the energy of the photons corresponding to the extension of wavelengths associated with Ag2S are low to perform the reactions involved in the photo-production of hydrogen and therefore it could exclude the possible effect of the additional light absorption of Ag2S to the enhancement of the photocatalytic activity in line with previous works published in the literature [50]. The sample prepared at 90 °C is less photoactive because this temperature of preparation produces CdS with poor crystallinity which does not favor the effective charge carrier separation associated with crystalline nanostructures of CdS. At temperatures above 150 °C, the ternary system changes with the partial reduction of Ag2S into Ag0, the disappearance of the QD structures and the increase in the crystalline growth of CdS. This evolution leads to a ternary system composed by CdS/Ag2S/Ag0 with lower photoactivity derived from the absence of QD together with the presence of metallic silver which could attract electrons altering by this way the mobility of the carriers in the heterojunction between CdS and Ag2S, which was responsible for a portion of the improvement in activity observed in the samples prepared at lower temperature.

4. Materials and Methods

4.1. Synthesis of Ag Modified CdS Photocatalysts

All the reagents employed for the preparation of the Ag modified CdS photocatalysts (AgCdS) were of analytical grade and used without further purification. The selected reagents were cadmium acetate (Cd(CH3CO2)2·2H2O), thiourea (SC(NH2)2 and silver acetate (AgCH3CO2) all of them from Sigma Aldrich. Cadmium and sulphur precursors were added according to the molar ratio Cd:S = 1:2 to assure the total precipitation of CdS, followed by the addition of water in a molar ratio thiourea: H2O = 1:2. Silver was added in a molar ratio equal to 0.05 mol Ag/0.95 mol Cd. As described in previous works [3] the solvothermal synthesis was performed using a Teflon-lined stainless steel autoclave filled up with the precursors dissolved in 100 mL of ethylenediamine (EDA). The solvothermal conditions established for the experiments are analogous to those described in our previous work [20], maintaining the autoclave for 12 h at the selected temperatures: 90, 120, 150, and 190 °C. The obtained yellow precipitates suspended in the solvent were washed with distilled water and ethanol several times and dried under vacuum (70 °C, 0.008 bar, 2 h) in order to get the solid powders. The obtained samples were labeled as: AgCdS-T (T = 90, 120, 150, 190 °C).

4.2. Physicochemical Characterization

The chemical composition of all AgCdS-T photocatalysts was measured by total X-ray fluorescence analysis (TXRF) through the quantification of the k-lines corresponding to Cd, S, and Ag in a benchtop S2 PicoFox TXRF spectrometer from Bruker Nano GmbH (Berlin, Germany).
Specific surface area of all samples were determined by the BET method to the N2 adsorption/desorption isotherms measured at liquid nitrogen at −196 °C on a Micromeritics TRISTAR 3000 instrument over samples degassed under vacuum at 70 °C for 2 h. The BET equation has been calculated within the relative pressure in the range 0.05 < P/Po < 0.30. Pore size and distribution were estimated assuming a cylindrical pore model by applying the Barret–Joyner–Halenda method.
The crystalline structure of AgCdS-T photocatalysts were evaluated by X-ray powder diffraction (XRD) using an X’Pert Pro PANalytical polycrystal diffractometer (Malvern Pananalytical, Malvern, UK) with a X’Celerator RTMS detector and nickel-filtered Cu Kα1 radiation (λ = 0.15406 nm, 45 kV, 40 mA). The estimation of the crystallite size (Dp) was carried out by applying the Scherrer equation from the broadening of the (002) reflection. In this study Williamson–Hall analysis has been carried out for the estimation of the lattice strains of the nanostructures as a function of the temperature of synthesis. Through the plotting of the Equation (1) for the three main reflection planes of the hexagonal CdS, it is possible the quantification of the microstrain parameter, ε:
βcosθ = /D + 4ε∙sinθ
where β is the broadening of the diffracted peak, K is a shape factor close to unity, λ is the X-ray wavelength, D is the crystallite size and ε is the slope of the linear fit of the plot.
XPS spectra of the AgCdS-T photocatalysts were acquired with a VG Escalab 200R spectrometer (Thermo Fisher Scientific, East Grinstead, UK) equipped with a hemispherical electron analyzer and a Mg Kα (hν = 1253.6 eV) X-ray source. The scanned regions were Cd 3d, Ag 3d and S 2p and the areas of the peaks were computed by fitting the experimental spectra to Gaussian/Lorenztian curves (90/10) after subtracting the background.
UV–vis spectra of the AgCdS samples was measured with an UV–vis–NIR Varian Cary 5000 spectrometer (Agilent, Santa Clara, CA, USA) with double beam and double shutter synchronized electronically. The sources are deuterium (UV) and halogen quartz. The detectors were a multiplier and PbS detector refrigerated for the NIR area. The absorption of samples was analyzed trough the Kubelka–Munk Function F(R) plot, whereas band gap size was obtained from Tauc plot tracing a tangent line parallel to the slope of the curve to the x-axis. The structural defects of the materials promotes tailing effects on UV–vis spectra or Urbach tails [53,54], as a consequence of the apparition of localized electronic states near the band gap region in the UV–vis spectra. The density of defects near the band gap was quantified applying the Urbach law (Equation (2)) through the Urbach energy parameter, Eu
ln(F(R)) = A + (1/Eu)·hν
where F(R) is the Kubelka-Munk function, h is the Planck constant, ν the speed of light and Eu is the inverse of the slope of the straight line of the plot in meV.
The photoluminescence (PL) spectra of all samples were recorded to analyze the role of the structural defects on the recombination of electron and holes. PL experiments were carried out in a sonicated aqueous suspension and room temperature using a Varian Cary Eclipse fluorescence spectrophotometer (Agilent, Santa Clara, CA, USA) with sweep analysis among 400–600 nm and an excitation wavelength of 375 nm at high voltage. All the spectra were deconvoluted applying a Gaussian function using Origin 8.0 OPK fitting tool in order to identify the blue (BE, λ < 480 nm), green (GE, λ: 480–530 nm), yellow (YE, λ: 530–590 nm), and red emission (RE, λ: 610–700 nm) bands.
The nanomorphology of the AgCdS samples were studied by high-resolution transmission electron microscopy (HRTEM) with a TEM/STEM JEOL 2100F (JEOL, Tokio, Japan) operating at 200 kV accelerating voltage with a field emission gun (FEG), obtaining a point resolution of 0.19 nm.

4.3. Photocatalytic Activity Tests

The hydrogen production tests were performed employing 0.050 g of AgCdS photocatalysts suspended in an aqueous solution containing sacrificial reagents (0.05 M Na2S/0.02 M Na2SO3) magnetically stirred in a closed Pyrex glass reactor under ambient temperature, pressure, and inert atmosphere. The system was irradiated with a Xenon arc lamp (150 W, Ozone Free, LOT Oriel GmbH & CO KG, Darmstadt, Germany) for 5 h. Every 60 min, 0.5 mL of the gases evolved were extracted from the reactor with a Hamilton Samplelock gas syringe and injected in a gas chromatograph (Star 3400 CX chromatograph, Varian, Agilent, Santa Clara, CA, USA) equipped with a TCD detector and a 5Å molecular sieve packed column using Ar as carrier gas to quantify the hydrogen production.

5. Conclusions

The temperature used in the solvothermal synthesis of Ag-CdS photocatalysts has strong influence on both the nanomorphology of CdS and in the state of the Ag species. The increase in the solvothermal temperature provokes the evolution of the CdS nanostructures from nanoparticles of low crystallinity in coexistence with small nanocrystals with strong confinement effect (quantum dots) to the formation of highly crystalline monodimensional nanorods without quantum dots. The Ag species present in the AgCdS samples also evolve with the increase in the solvothermal temperature. In this case the initially Ag2S segregated from CdS formed in the samples prepared at low temperature evolve towards the formation of metallic species as the temperature increases above 150 °C. The photoactivity of the AgCdS-T samples is the result of the combination of three factors: crystallinity of CdS structures, existence of QD and presence of Ag2S. The AgCdS sample prepared at 120 °C shows the better efficiency for hydrogen production because it achieves the better combination of these three factors: 1D CdS in combination with QD and Ag2S.

Supplementary Materials

The following are available online at https://www.mdpi.com/2073-4344/9/2/110/s1, Figure S1: William–Hall plot linear fit of AgCdS-T photocatalysts; Figure S2: Urbach tails linear fit of AgCdS-T photocatalysts: (a) AgCdS-90; (b) AgCdS-120; (c) AgCdS-150 and (d) AgCdS-190.

Author Contributions

J.L.G.F. and R.M.N. conceived and designed the experiments; E.S. performed the experiments; F.V., J.L.G.F., N.M., and R.M.N. analyzed the data; E.S. and R.M.N. wrote the paper; N.M. and J.L.G.F. review and editing the paper.

Funding

The present work was performed within the research program supported by under the project and CAM within the S2013/MAE-288 project. This research was funded by MINECO (Spain), grant number CTQ2016-76505-C3-1-R. E. Soto would like to acknowledge MINECO for the FPI research grant.

Conflicts of Interest

The authors declare no conflict of interest.

References

  1. Kudo, A. Photocatalyst materials for water splitting. Catal. Surv. Asia 2003, 7, 31–38. [Google Scholar] [CrossRef]
  2. Osterloh, F.E. Inorganic nanostructures for photoelectrochemical and photocatalytic water splitting. Chem. Soc. Rev. 2013, 42, 2294–2320. [Google Scholar] [CrossRef] [PubMed]
  3. Vaquero, F.; G Fierro, J.L.; Navarro Yerga, R.M. From nanorods to nanowires of CdS synthesized by a solvothermal method: Influence of the morphology on the photoactivity for hydrogen evolution from water. Molecules 2016, 21, 401. [Google Scholar] [CrossRef] [PubMed]
  4. Cao, H.; Wang, G. Growth and optical properties of wurtzite-type CdS nanocrystals. Inorg. Chem. 2006, 45, 5103–5108. [Google Scholar] [CrossRef] [PubMed]
  5. Cheng, L.; Xiang, Q.; Liao, Y.; Zhang, H. CdS-Based photocatalysts. Energy Environ. Sci. 2018, 11, 1362–1391. [Google Scholar] [CrossRef]
  6. Liu, Y.; Ma, Y.; Liu, W.; Shang, Y.; Zhu, A.; Tan, P.; Xiong, X.; Pan, J. Facet and morphology dependent photocatalytic hydrogen evolution with CdS nanoflowers using a novel mixed solvothermal strategy. J. Colloid Interface Sci. 2018, 513, 222–230. [Google Scholar] [CrossRef]
  7. Yu, J.; Yu, Y.; Zhou, P.; Xiao, W.; Cheng, B. Morphology-dependent photocatalytic H2 production activity of CdS. Appl. Catal. B Environ. 2014, 156–157, 184–191. [Google Scholar] [CrossRef]
  8. Zhai, T.; Fang, X.; Li, L.; Bando, Y.; Golberg, D. One-dimensional CdS nanostructures: Synthesis, properties, and applications. Nanoscale 2010, 2, 168–187. [Google Scholar] [CrossRef]
  9. Vaquero, F.; Navarro, R.M.; Fierro, J.L.G. Influence of the solvent on the structure, morphology and performance for H2 evolution of CdS photocatalysts prepared by solvothermal method. Appl. Catal. B Environ. 2017, 203, 753–767. [Google Scholar] [CrossRef]
  10. Ma, S.; Xie, J.; Wen, J.; He, K.; Li, X.; Liu, W.; Zhang, X. Constructing 2D layered hybrid CdS nanosheets/MoS2 heterojunctions for enhanced visible-light photocatalytic H2 generation. Appl. Surf. Sci. 2017, 391, 580–591. [Google Scholar] [CrossRef]
  11. Yan, H.; Yang, J.; Ma, G.; Wu, G.; Zong, X.; Lei, Z.; Shi, J.; Li, C. Visible-light-driven hydrogen production with extremely high quantum efficiency on Pt–PdS/CdS photocatalyst. J. Catal. 2009, 266, 165–168. [Google Scholar] [CrossRef]
  12. Murillo Leo, I.; Soto, E.; Vaquero, F.; Mota, N.; Navarro, R.M.; Fierro, J.L.G. Influence of the reduction of graphene oxide (rGO) on the structure and photoactivity of CdS-rGO hybrid systems. Int. J. Hydrogen Energy 2017, 42, 13691–13703. [Google Scholar] [CrossRef]
  13. Xiang, Q.; Yu, J.; Jaroniec, M. Graphene-based semiconductor photocatalysts. Chem. Soc. Rev. 2012, 41, 782–796. [Google Scholar] [CrossRef]
  14. Mohamed, M.B.; Abdel-Kader, M.H.; Alhazime, A.A.; Almarashi, J.Q.M. Effect of preparation methods and doping on the structural and tunable emissions of CdS. J. Mol. Struct. 2018, 1155, 666–674. [Google Scholar] [CrossRef]
  15. Del Valle, F.; Ishikawa, A.; Domen, K.; Villoria de la Mano, J.A.; Sánchez-Sánchez, M.C.; González, I.D.; Herreras, S.; Mota, N.; Rivas, M.E.; Álvarez Galván, M.C. Influence of Zn concentration in the activity of Cd1−xZnxS solid solutions for water splitting under visible light. Catal. Today 2009, 143, 51–56. [Google Scholar] [CrossRef]
  16. Dalvand, P.; Mohammadi, M.R.; Fray, D.J. One-dimensional cadmium sulfide (CdS) nanostructures by the solvothermal process: Controlling crystal structure and morphology aided by different solvents. Mater. Lett. 2011, 65, 1291–1294. [Google Scholar] [CrossRef]
  17. Bao, C.; Zhu, G.; Yang, J.; Liu, M.; Zhang, R.; Shen, X. Small molecular amine mediated synthesis of hydrophilic CdS nanorods and their photoelectrochemical water splitting performance. Dalton Trans. 2015, 44, 1465–1472. [Google Scholar] [CrossRef]
  18. Mahdi, M.A.; Hassan, J.J.; Ng, S.S.; Hassan, Z. Growth of CdS nanosheets and nanowires through the solvothermal method. J. Cryst. Growth 2012, 359, 43–48. [Google Scholar] [CrossRef]
  19. Jang, J.S.; Joshi, U.A.; Lee, J.S. Solvothermal synthesis of CdS nanowires for photocatalytic hydrogen and electricity production. J. Phys. Chem. C 2007, 111, 13280–13287. [Google Scholar] [CrossRef]
  20. Vaquero, F.; Navarro, R.M.; Fierro, J.L.G. Evolution of the nanostructure of CdS using solvothermal synthesis at different temperature and its influence on the photoactivity for hydrogen production. Int. J. Hydrogen Energy 2016, 41, 11558–11567. [Google Scholar] [CrossRef]
  21. Wang, H.; Zhang, L.; Chen, Z.; Hu, J.; Li, S.; Wang, Z.; Liu, J.; Wang, X. Semiconductor heterojunction photocatalysts: Design, construction, and photocatalytic performances. Chem. Soc. Rev. 2014, 43, 5234–5244. [Google Scholar] [CrossRef] [PubMed]
  22. Navarro, R.; Del Valle, F.; Fierro, J.L.G. Photocatalytic hydrogen evolution from CdS–ZnO–CdO systems under visible light irradiation: Effect of thermal treatment and presence of Pt and Ru Cocatalysts. Int. J. Hydrogen Energy 2008, 33, 4265–4273. [Google Scholar] [CrossRef]
  23. Wang, Y.; Meng, G.; Zhang, L.; Liang, C.; Zhang, J. Catalytic growth of large-scale single crystal CdS nanowires by physical evaporation and their photoluminescence. Chem. Mater. 2002, 14, 1773–1777. [Google Scholar] [CrossRef]
  24. Song, L.; Li, T.; Zhang, S. Synthesis of rhodium phosphide cocatalyst and remarkably enhanced photocatalytic hydrogen evolution over CdS under visible light radiation. Chem. Eng. J. 2017, 314, 498–507. [Google Scholar] [CrossRef]
  25. Dweydari, A.W.; Mee, C.H.B. Work function measurements on (100) and (110) surfaces of silver. Phys. Status Solidi 1975, 27, 223–230. [Google Scholar] [CrossRef]
  26. Kryukov, A.I.; Stroyuk, A.L.; Zin’chuk, N.N.; Korzhak, A.V.; Kuchmii, S.Y. Optical and catalytic properties of Ag2S nanoparticles. J. Mol. Catal. A Chem. 2004, 221, 209–221. [Google Scholar] [CrossRef]
  27. Wang, J.; Feng, H.; Chen, K.; Fan, W.; Yang, Q. Solution-phase catalytic synthesis, characterization and growth kinetics of Ag2S-CdS matchstick-like heteronanostructures. Dalton Trans. 2014, 43, 3990–3998. [Google Scholar] [CrossRef] [PubMed]
  28. Zhu, G.; Xu, Z. Controllable growth of semiconductor heterostructure mediated by bifunctional Ag2S nanocrystals as catalyst or source-host. J. Am. Chem. Soc. 2011, 133, 148–157. [Google Scholar] [CrossRef] [PubMed]
  29. Ma, X.; Xu, F.; Liu, Y.; Liu, X.; Zhang, Z.; Qian, Y. Double-dentate solvent-directed growth of multi-armed CdS nanorod-based semiconductors. Mater. Res. Bull. 2005, 40, 2180–2188. [Google Scholar] [CrossRef]
  30. Khorsand Zak, A.; Majid, W.H. X-ray analysis of ZnO nanoparticles by Williamson–Hall and size–strain plot methods. Solid State Sci. 2011, 13, 251–256. [Google Scholar] [CrossRef]
  31. Moulder, F.; Stickle, W.F.; Sobol, P.E.; Bomben, K.D. Handbook of Standard Spectra for Identification and Interpretation of XPS Data; Perkin Elmer Corporation: Waltham, MA, USA, 1995. [Google Scholar]
  32. Hammond, J.S.; Gaarenstroom, S.W.; Winograd, N. X-ray Photoelectron spectroscopic studies of cadmium and silver oxygen surfaces. Anal. Chem. 1975, 47, 2193–2199. [Google Scholar] [CrossRef]
  33. Schön, G. Studies of Ag, Ag2O and AgO. Acta Chem. Scand. 1973, 27, 2623–2633. [Google Scholar] [CrossRef]
  34. Wagner, A.V.; Naumkin, A.; Kraut-Vass, J.W.; Allison, C.J.; Powell, P.; Rumble, J.R. NIST X-ray Photoelectron Spectroscopy Database; Version 3.3; NIST Standarad Reference Database: Gaithersburg, MD, USA, 2003.
  35. Kaushik, V.K. XPS core level spectra and auger parameters for some silver compounds. J. Electron. Spectrosc. Relat. Phenom. 1991, 56, 273–277. [Google Scholar] [CrossRef]
  36. Abe, T.; Kashiwaba, Y.; Baba, M.; Imai, J.; Sasaki, H. XPS analysis of p-type Cu-doped CdS thin films. Appl. Surf. Sci. 2001, 175–176, 549–554. [Google Scholar] [CrossRef]
  37. Yang, J.; Deng, D.W.; Yu, J.S. Transfer from trap emission to band-edge one in water-soluble CdS nanocrystals. J. Colloid Interface Sci. 2013, 394, 55–62. [Google Scholar] [CrossRef] [PubMed]
  38. Banerjee, R.; Jayakrishnan, R.; Ayyub, P. Effect of the size-induced structural transformation on the band gap in CdS nanoparticles. J. Phys. Condens. Matter 2000, 12, 10647–10654. [Google Scholar] [CrossRef]
  39. Alivisatos, A.P. Semiconductor clusters, nanoscrystals and quantum dots. Sci. New Ser. 1996, 271, 933–937. [Google Scholar]
  40. Zhu, G.; Bao, C.; Liu, Y.; Shen, X.; Xi, C.; Xu, Z.; Ji, Z. Self-regulated route to ternary hybrid nanocrystals of Ag-Ag2S-CdS with near-infrared photoluminescence and enhanced photothermal conversion. Nanoscale 2014, 6, 11147–11156. [Google Scholar] [CrossRef]
  41. O’Leary, S.K.; Zukotynski, S.; Perz, J.M. Disorder and optical absoprtion in amorphous silicon and amorphous germanium. J. Non-Cryst. Solids 1997, 210, 249–253. [Google Scholar] [CrossRef]
  42. Chandran, A.; George, K.C. Phase instability and defect induced evolution of optical properties in Cd rich-CdS nanoparticles. J. Appl. Phys. 2014, 115, 164309. [Google Scholar] [CrossRef]
  43. Mercy, A.; Sakthi Murugesan, K.; Milton Boaz, B.; Jesper Anandhi, A.; Kanagadurai, R. Synthesis and structural and optical characterization of Mn2+ doped cadmium sulphide nanoparticles stabilized in DETA matrix. J. Alloy. Compd. 2013, 554, 189–194. [Google Scholar] [CrossRef]
  44. Huang, L.; Yang, J.; Wang, X.; Han, J.; Han, H.; Li, C. Effects of surface modification on photocatalytic activity of CdS nanocrystals studied by photoluminescence spectroscopy. Phys. Chem. Chem. Phys. 2013, 15, 553–560. [Google Scholar] [CrossRef] [PubMed] [Green Version]
  45. Lozada-Morales, R.; Zelaya-Angel, O.; Torres-Delgado, G. On the yellow-band emission in CdS films. Appl. Phys. A Mater. Sci. Process. 2001, 73, 61–65. [Google Scholar] [CrossRef]
  46. Liu, Z.; Ji, G.; Guan, D.; Wang, B.; Wu, X. Enhanced charge-carrier transfer by CdS and Ag2S quantum dots co-sensitization for TiO2 nanotube arrays. J. Colloid Interface Sci. 2015, 457, 1–8. [Google Scholar] [CrossRef]
  47. López, I.; Gómez, I. Improvement of the luminescent properties of cadmium sulfide quantum dots by a post-synthesis modification. Phys. B Condens. Matter 2014, 453, 81–85. [Google Scholar] [CrossRef]
  48. Karimipour, M.; Izadian, L.; Molaei, M. Effect of CdS growth time on the optical properties of one-pot preparation of CdS-Ag2S binary compounds. J. Electron. Mater. 2017, 47, 1322–1329. [Google Scholar]
  49. Ramsden, J.; Gräetzel, M. Photoluminescence of small cadmium sulphide particles. J. Chem. Soc. Faraday Trans. 1984, 1, 919–933. [Google Scholar] [CrossRef]
  50. Shen, S.; Guo, L.; Chen, X.; Ren, F.; Mao, S.S. Effect of Ag2S on solar-driven photocatalytic hydrogen evolution of nanostructured CdS. Int. J. Hydrogen Energy 2010, 35, 7110–7115. [Google Scholar] [CrossRef]
  51. Reber, J.F.; Rusek, M. Photochemical hydrogen production with platinized suspensions of cadmium sulphide and cadmium zinc sulphide modified by silver sulphide. J. Phys. Chem. 1986, 90, 824–834. [Google Scholar] [CrossRef]
  52. Dalvand, P.; Mohammadi, M.R. Controlling morphology and structure of nanocrystalline cadmium sulfide (CdS) by tailoring solvothermal processing parameters. J. Nanopart. Res. 2011, 13, 3011–3018. [Google Scholar] [CrossRef]
  53. Ikhmayies, S.J.; Ahmad-Bitar, R.N. A study of the optical bandgap energy and Urbach tail of spray-deposited CdS:In thin films. J. Mater. Res. Technol. 2013, 2, 221–227. [Google Scholar] [CrossRef] [Green Version]
  54. Haj Lakhdar, M.; Larbi, T.; Ouni, B.; Amlouk, M. Optical and structural investigations on Sb2S2O new kermesite alloy for optoelectronic applications. J. Alloy. Compd. 2013, 579, 198–204. [Google Scholar] [CrossRef]
Figure 1. N2 adsorption/desorption isotherms of AgCdS-T photocatalysts: (■) T = 90 °C; (□) T = 120 °C; (▲) T = 150 °C and (○) T = 190 °C.
Catalysts 09 00110 g001
Figure 2. XRD patterns of AgCdS-T photocatalysts: (a) T = 90 °C; (b) T = 120 °C; (c) T = 150 °C; and (d) T = 190 °C.
Catalysts 09 00110 g002
Figure 3. XPS core-level spectra from Cd 3d, S 2p and Ag 3d core levels of AgCdS-T: (a) T = 90 °C; (b) T = 120 °C; (c) T = 150 °C; and (d) T = 190 °C.
Catalysts 09 00110 g003
Figure 4. UV–vis spectra of AgCdS-T photocatalysts: (a) T = 90 °C; (b) T = 120 °C; (c) T = 150 °C; and (d) T = 190 °C.
Catalysts 09 00110 g004
Figure 5. PL spectra of AgCdS-T photocatalysts: (a) T = 90 °C; (b) T = 120 °C; (c) T = 150 °C; and (d) T = 190 °C.
Catalysts 09 00110 g005
Figure 6. HR-TEM images of AgCdS-T samples: (a) T = 90 °C, (b) T = 120 °C, (c) T = 150 °C; and (d) T = 190 °C (Ag2S/Ag particles noted in images by arrows and circles).
Catalysts 09 00110 g006
Figure 7. Hydrogen production (µmol) for AgCdS-T photocatalysts (black) and bare CdS-T counterparts (grey).
Catalysts 09 00110 g007
Figure 8. Relationship between photoactivity of AgCdS-T and (a) band gap or (b) CdS crystallite size.
Catalysts 09 00110 g008
Figure 9. Relationship between hydrogen production for AgCdS-T respect to the Ag2S surface concentration () and concentration of quantum dots ().
Catalysts 09 00110 g009
Figure 10. Schematic diagram showing the combination of factors that operates in the AgCdS-T photocatalysts.
Catalysts 09 00110 g010
Table 1. Chemical composition (atomic %) from TXRF and textural data from N2 isotherms of the AgCdS-T photocatalysts.
% Cd% S% AgCd/SAg/SBET (m2/g)Pore Volume (cm3/g)
AgCdS-9043.848.77.50.90.1587.90.43
AgCdS-12045.852.12.10.880.0484.60.29
AgCdS-15046.650.430.920.0665.20.25
AgCdS-19046.251.32.50.90.0552.20.21
Table 2. Crystallite size and lattice strains of AgCdS-T photocatalytsts determined from XRD.
Dp (nm)I(100)/(002)Lattice Strain (ε)
AgCdS-9013.10.614-
AgCdS-12015.60.594−0.0032
AgCdS-15037.60.492−0.0021
AgCdS-19039.30.473−0.0022
Table 3. XPS binding energies (eV) of core levels and surface composition (atomic percentages) of AgCdS-T photocatalysts.
Cd 3d5/2Ag 3d5/2S 2p% Cd% S% Ag
AgCdS-90404.7367.1161.241.356.91.8
AgCdS-120404.6367.2161.352.147.50.4
AgCdS-150404.6367.6 (81.4)/369 (18.6) 1161.453.845.80.4
AgCdS-190404.6367.5 (91)/368.4 (9) 1161.452.946.90.2
1 In parenthesis percentage of species.
Table 4. Band gap, relative intensity of the excitonic peak areas and Urbach energy (Eu) of AgCdS-T photocatalysts from UV–vis.
BG (eV)Excitonic Peak (Rel. Intensity)Eu (meV)
AgCdS-902.71/2.360.49177.5
AgCdS-1202.54192.2
AgCdS-1502.480.0862.6
AgCdS-1902.47-50.5

