1. Introduction
Photoelectrocatalytic hydrogen production is one of the most popular research subjects because it promises an effective route for converting solar energy and storing it as chemical energy in the form of hydrogen. The popularity of hydrogen stems from the fact that it has the highest gravimetric heat of combustion (~286 kJ/mole), while its combustion leads to the production of water. Hydrogen is mainly produced by reforming of fossil fuels. It can also be produced by electrolysis using, for example, renewable electricity. Theoretically, 1.23 V are necessary to split water by electrolysis; however, in reality, much higher voltages and expensive electrocatalysts are necessary. In this sense, water splitting by photoelectrocatalysis [
1] is a very promising approach since it necessitates much lower electric biases. However, oxidation of water is a four-electron process:
Therefore, it is necessary to simultaneously extract four units of charge in order to oxidize water and produce molecular oxygen. This is not easy and necessitates oxygen evolution co-catalysts. On the contrary, it is easier to oxidize an organic substance. For example, in the case of ethanol, oxidation leads to the formation of acetaldehyde, which is a two electron process, therefore easier to realize, either directly [
2,
3,
4]:
or by the intermediate of hydroxyl radicals:
For most organic substances, oxidation and subsequent mineralization proceed by steps, as in the above case of ethanol, which usually are two electron processes, therefore easier to oxidize than water. In terms of oxidation potential, oxidation of ethanol to acetaldehyde corresponds to −0.21 V [
5], i.e., it is much lower than the above mentioned potential of 1.23 V necessary to oxidize water. Molecular hydrogen production by reduction of protons or water is also a two electron process [
3,
4]:
or
Therefore, photoelectrocatalytic hydrogen production by using an organic substance as a fuel is even more of a promising approach, which has been adopted in the present work.
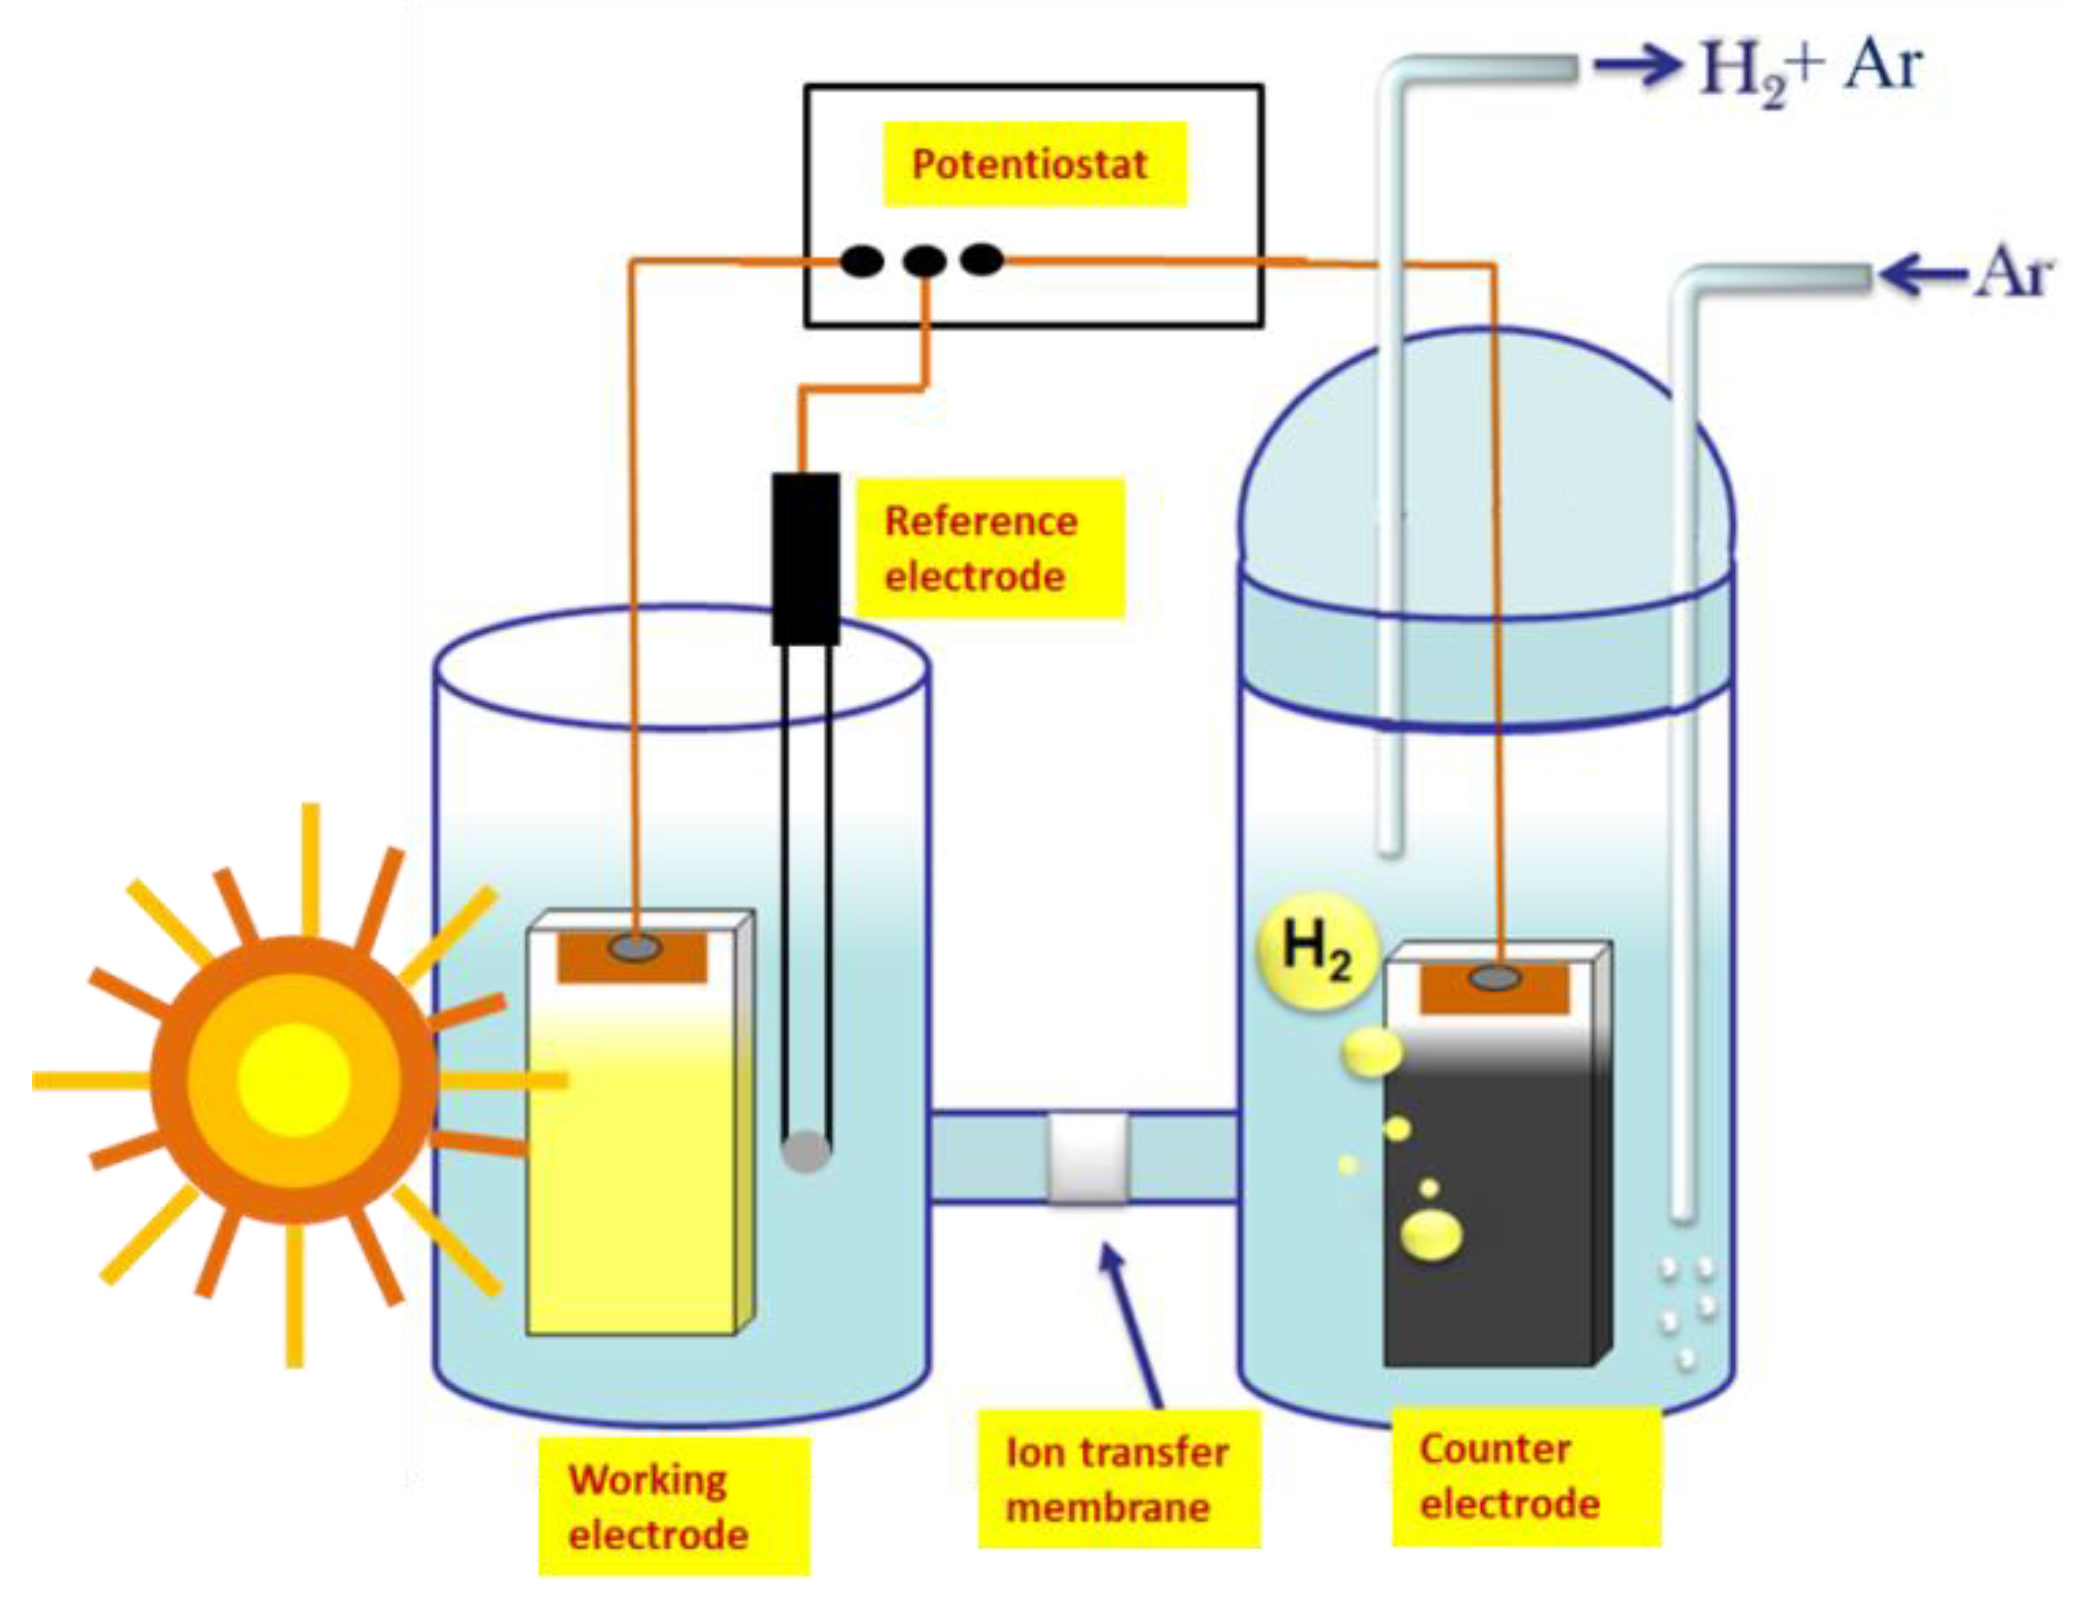
The standard configuration of a photoelectrocatalytic cell for hydrogen production involves a photoanode electrode carrying a semiconductor photocatalyst and a cathode electrode where reductive reactions are carried out, producing hydrogen. Both electrodes are immersed in an electrolyte, which increases the internal cell conductivity and provides the ionic species necessary to allow device functioning in a cyclic manner [
3,
4].
Figure 1 shows a simplified design of a photoelectrocatalysis cell. When photons are absorbed by the photocatalyst, electron-hole (e
−-h
+) pairs are generated. Holes are consumed by oxidation reactions, such as (2) or (3), while electrons move through an external circuit and are consumed by reduction reactions at the cathode. The overall result of oxidation and reduction can be represented, for example, by combining (2) or (3) with (4) or (5), respectively [
2]:
which describes the consumption of ethanol, from now on referred to as the “fuel”, to produce hydrogen by means of a photoelectrocatalytic process. Acetaldehyde may be further oxidized until complete mineralization and further hydrogen production. The complete mineralization of ethanol may be expressed by the following overall reaction [
3,
4]:
which is the same as ethanol reforming [
6] and can be rightfully called “photoelectrocatalytic alcohol reforming”.
Photoelectrocatalysis necessitates then the presence of a photocatalyst. There exists a rich literature on the choice of photocatalysts [
4,
7,
8]. Researchers searching for a new photocatalyst have developed resourceful arguments in their favor; however, it is a matter of fact that very few among them simultaneously possess more than one quality that distinguishes each one of them from the others. Nanostructured titania is the best such example, but WO
3 is also a distinguished choice as well [
9,
10,
11]. Titania is an n-type, low cost, non-toxic semiconductor, easy to process, and having a strong adhesive quality on various types of electrodes. It possesses a strong oxidative potential (about 3 V in the case of anatase) and a conduction band conveniently located with respect to the hydrogen production potential (about −0.2V vs. NHE) [
12]. Titania also possesses relatively large charge carrier mobility. For example, its hole diffusion length is of the order of 10
4 nm, much larger than that of WO
3 (~150 nm) and hematite (2–4 nm) [
13]. These properties would make titania an ideal photocatalyst; however, it still suffers from substantial electron-hole recombination, while its light absorption range is limited only to the UV. Nanoparticulate tungsten oxide is also a very popular choice, and thanks to its substantial range of visible light absorption, it has been studied for several decades [
11,
14,
15,
16,
17] as an alternative to the UV absorbing titania. Indeed, WO
3 has a bandgap ranging between 2.5 and 2.8 eV, and it may thus absorb light up to 500 nm, which accounts for 12% of the solar radiation on the surface of the Earth [
17]. WO
3 is an n-type indirect semiconductor. It is easy to synthesize and deposit on electrodes; it has a moderate hole-diffusion length (~150 nm [
17], as already said); it is resistant against photocorrosion; and it is stable at relatively low pH values. For this reason, WO
3 has been studied as a photoanode material for photoelectrochemical water splitting applications [
11,
14,
15,
16,
17,
18,
19,
20]. Its valence band is located approximately at +2.8 V vs. NHE [
12]; therefore, it also possesses high oxidative power, and it is well placed for water and organics’ oxidation. Its conduction band is located at positive potentials (approximately +0.2 to +0.3V vs. NHE, cf. [
12]); therefore, it is located substantially lower than that of titania. If the two semiconductors are then brought into contact, it is expected that photogenerated electrons may be transferred from TiO
2 to WO
3, thus achieving charge separation and limiting e
−-h
+ recombination. However, it is understood that since the photon absorption spectral range for titania is limited, its role as an electron source for WO
3 is of limited importance. There is another role that titania may play, which is of utmost importance, and this is the passivation of surface states of WO
3 that a top cover of titania can offer. This role will be investigated in the present case.
In addition to the surface states’ passivation effect, there is one more reason to enhance WO3’s performance. As will be discussed below, contrary to the transparent WO3 layer, the top titania layer is a light scattering film, which scatters back to WO3 at least part of the incident light. This situation supports conditions for enhancement of light absorption by the WO3 layer, and this, of course, results in higher photocurrent production.
Unbiased flow of electrons from the photoanode to the cathode electrode would necessitate a substantial potential difference between the two electrodes. The potential of the photoanode is roughly defined by the conduction band of the photocatalyst, while that of the cathode electrode by the redox potential of the reduction reaction. In the case of hydrogen production, the potential in a strongly acidic environment is around 0 V vs. NHE. The conduction band of titania lies at about −0.2 V vs. NHE, as already said. This difference of 0.2 V is too small, and it is eliminated by losses. It is even worse in the case of WO
3, which has a conduction band slightly more positive than the hydrogen production potential. Therefore, no unbiased flow of electrons is expected for a WO
3 photoanode and is hardly expected in the case of a TiO
2 photoanode. In other words, when the above two photocatalysts are used, production of hydrogen may be obtained only by applying a bias. This is the reason that in the present work, hydrogen was produced under electric bias, as schematically illustrated in
Figure 1.
By taking into account the above knowledge, in the present work, we are studying photoanodes made by combining nanoparticulate WO
3 with nanoparticulate TiO
2, in a bilayer structure comprising a bottom film made of WO
3 and a top film made of TiO
2, in order to investigate the merits of such a combination. Measurements have focused on photoelectrocatalytic hydrogen production by using ethanol as the model fuel [
19] with the understanding that other organic materials, either biomass byproducts or water soluble pollutants, may apply as well [
20].
2. Results and Discussion
In the present work, as already said, the photoanodes were made either by deposition of a WO
3 nanoparticulate film alone on an FTO electrode or by adding a layer of nanoparticulate titania on the top. As seen in
Figure 2A, WO
3 nanoparticles were polydisperse with the size ranging between 20 and 50 nm. The BET specific surface area was 26 m
2g
−1, and X-ray diffractograms (not shown) revealed the formation of monoclinic WO
3 crystallites of size around 25 nm as calculated by using Scherrer’s formula. The quantity of WO
3 in the film was approximately 4.5 mg cm
−2. When the titania layer was added on the top, a complete coverage of the lower WO
3 film was obtained by exposing only the titania film. The SEM image of the film in
Figure 2B then showed a typical titania nanostructure. The quantity of titania was approximately 4 mg cm
−2. The latter maintained the characteristics previously described in other publications [
21,
22]. The thickness of the combined semiconductor film was approximately determined by its scanning electron microscope profile, and it was below 1 µm.
The spectroscopic characteristics of the WO
3 film before and after titania deposition are shown in
Figure 3A. WO
3 film alone absorbed light up to about 480 nm, i.e., within a spectral range typical of this semiconductor. When titania was added on the top, the reflectance-absorption spectrum presented a different aspect depending on which side of the film was exposed to light. When the light passed through the transparent FTO electrode (cf.
Figure 3B), the spectrum (Curve 2) showed similar characteristics as those of WO
3 alone (Curve 1). Since the photoanode operates by this mode (
Figure 3B), it was seen that the spectroscopic characteristics of WO
3 prevailed. When absorption was recorded by front reflection, i.e., by means of the top titania layer, the corresponding curve (Curve 3) had a typical aspect of a nanocrystalline titania film. This is an additional indication of complete coverage of the WO
3 layer by (the light scattering) titania.
The presence of TiO
2 on the top of WO
3 was expected to encourage electron-hole separation, thanks to the difference between the levels of the conduction band of these semiconductors, which may reach more than 0.4 V, with the titania conduction band being the more negative of the two (cf. the band levels in [
23]). However, as already said, the role of titania as a sensitizer of WO
3 was expected to be limited since its photon absorption range was limited. On the contrary, deposition of titania on the top of the WO
3 film may result in the passivation of surface defects of the latter, and this would limit charge recombination sites. Passivation of surface defects has been observed and recorded in TiO
2/WO
3 and other semiconductor combinations [
24,
25,
26,
27,
28,
29,
30]. In addition, titania films are more stable than WO
3 films; therefore, the top titania layer provided protection against aggressive electrolytes. Finally, the top titania layer provided a light scattering film, in contrast to the transparent WO
3 film, which may send light back to WO
3, thus enhancing its capacity for photon harvesting. This is especially convenient in the present case where light was absorbed through the supporting FTO layer. This configuration is illustrated by the design of
Figure 3B. Light scattering by the titania layer was due to the agglomeration of titania nanoparticles into large clusters (cf.
Figure 2B).
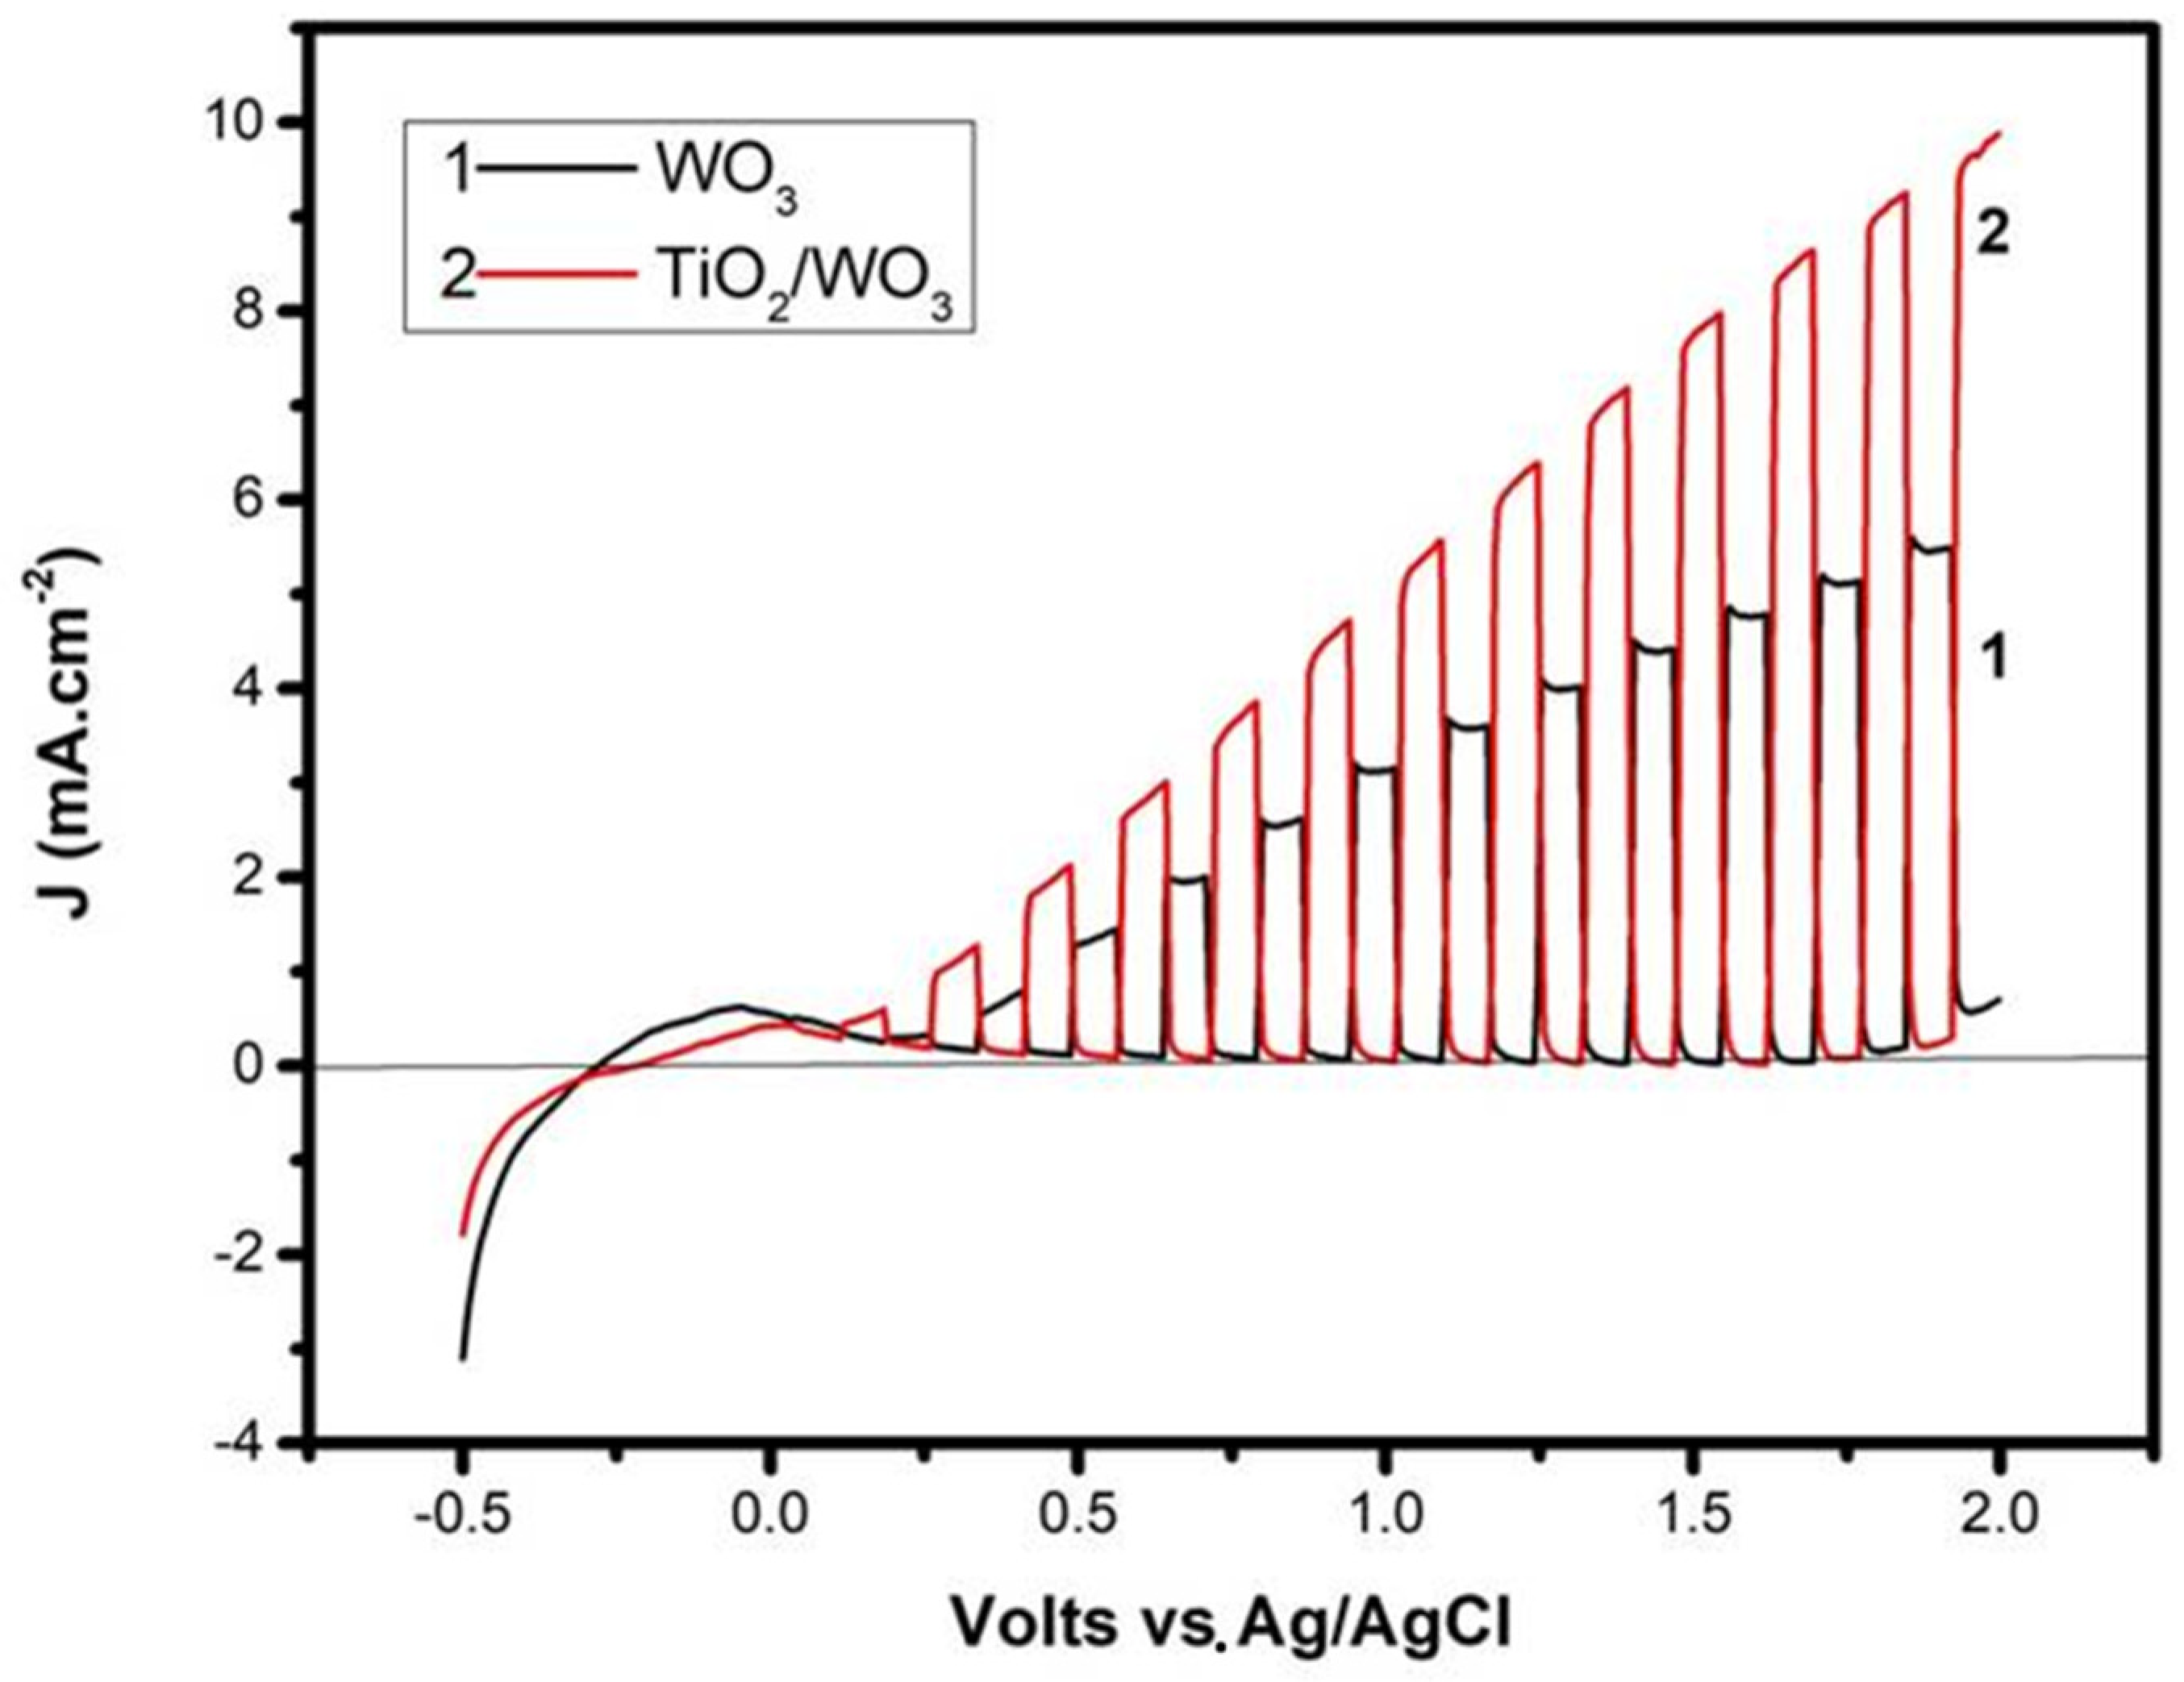
The beneficial effects that the bilayer photocatalyst film had on the activity of the photoelectrocatalytic cell were immediately seen by recording current-voltage curves, as seen in
Figure 4. More than a 30% increase of current was recorded when the titania layer was added on the top, compared with a photoanode made of WO
3 alone. The curves of
Figure 4 were recorded under the same conditions, differing only by the composition of the photocatalyst film. The curves were recorded in light chopping mode demonstrating that the voltage range of pure photocurrent extended between about 0.2 and 1.8 volts vs. Ag/AgCl. The small anodic peak below this range was due to capacitance current deriving from the adsorption of cations from the electrolyte into the pores of the mesoporous film [
21]. The increase of the dark current above 1.8 V vs. Ag/AgCl was due to electrolysis. The electrolyte was 0.5 M NaClO
4 with 5% v/v ethanol added in the anode compartment. In accordance with previous publications [
19,
20], in the absence of ethanol (not shown; cf. the data in [
19]), lower currents were obtained in both photoanode cases. This was expected as previously explained [
19,
20]. Ethanol acted as a hole scavenger, which further limited charge recombination, thus resulting in higher currents. Moreover, transient species formed by ethanol oxidation induced current increase by the “current doubling” phenomenon [
31]. Indeed, the maximum current density expected for a photoanode with light absorption threshold at 480 nm (cf.
Figure 3A) was no more than 5 mA cm
−2 [
4]. However, the current density presently increased under bias well beyond this limit, and this was rationalized only by the current doubling effect. The addition then of the titania layer and the presence of the fuel (ethanol) resulted in the production of substantial photocurrent.
The increase of the current when titania was added on the top of WO
3 was not due to titania acting as the photocatalyst by itself. When a photoanode was made by using titania alone, by taking care to deposit the same quantity of photocatalyst (4 mg cm
−2), under the same conditions of the cell configuration and the electrolyte and fuel concentration, the behavior of the current-voltage curve presented a completely different aspect, as seen in
Figure 5. The maximum current density was only 0.42 mA cm
−2, while in the case of
Figure 4, the current increase was more than 3 mA cm
−2. Most importantly, open circuit voltage (the point where the current became zero) was <−1 V vs. Ag/AgCl, while in
Figure 4, the open circuit voltage was approximately located at 0.0 V vs. Ag/AgCl. The difference in the onset potential between a WO
3 and a TiO
2 photoanode roughly reflected the difference in the electrochemical potential of each semiconductor, and it was systematically observed. The fact that the addition of titania on the top of WO
3 preserved the characteristics of the latter simply means that the bottom lying WO
3 layer defined the level at which electrons left the anode electrode. It was furthermore observed that in the case of titania alone, the photocurrent soon reached saturation by the voltage increase, while in the case of WO
3 and TiO
2/WO
3, the current continuously increased with bias voltage. In other words, the addition of the titania layer on the top of WO
3 resulted only in a current increase without affecting the original appearance of the pure WO
3 current-voltage curve. Obviously, photogenerated electrons in the titania layer were transferred to the electrode only by means of the underlying WO
3 layer, and titania did not act as a photocatalyst by itself. Because of the continuous increase of current with increasing voltage and since hydrogen production was proportional to the current flowing through the external circuit of the cell, it was expected that the hydrogen production rate should strongly depend on the applied electric bias.
At this point, a question arises about the fate of the photogenerated holes. An approximate positioning of band levels for TiO
2 and WO
3 nanoparticulate semiconductors and of the oxidation potentials of the three possible hole scavengers in the present system is presented by the diagram in
Figure 6 (cf. also the band levels in [
23]). Titania nanoparticles used for the present application were a mixture of anatase and rutile. For this reason, the valence band level could not be clear cut and was expected to lie between 3.0 and 2.8 V vs. NHE. A similar situation existed for WO
3 due to the fact that its bandgap may range between 2.5 and 2.8 eV, as already said. This created an uncertainty concerning the direction of the hole transfer. In
Figure 6, we favored the transfer of holes to titania, which, being on the top, facilitated the interaction with hole scavengers in the solution. In view of structural imperfections in both semiconductors, it was hard to make a strong assertion on this matter. In any case, the level of 3.0 V vs. NHE was positive enough to produce
•OH radicals. However, vast losses, again due to structural imperfections, may make transfer of holes to OH
- ions less probable than the most obvious hole scavenging by ethanol or water. Oxidation of ethanol, as already said, is easier than water therefore, ethanol remained the most probable hole consumer.
The hydrogen production rate by employing the two types of photoanode was indeed monitored, and the results are presented in
Figure 7. In
Figure 7, we tried to demonstrate the strong variation of the hydrogen production rate as a function of the applied bias. No hydrogen production was observed without a forward bias. Three different electric biases were applied, chosen within the above photocurrent range. Thus, each curve was divided into three parts, one for each applied bias, as marked on the graph. Each part demonstrated a period of a rising rate followed by a period of a practically constant rate. A fast increase of the hydrogen production rate took place after changing the applied bias, and it corresponded to the filling of tubes and detection device with the additional hydrogen produced. The variation of the hydrogen production rate with applied bias was a clear demonstration that hydrogen produced by reduction reactions at the cathode depended on the current flowing through the external circuit of the cell. Indeed, by comparing Curve #2 of
Figure 4 with Curve #2 of
Figure 7, it is found that the hydrogen produced was roughly proportional to the current. In addition, the combined TiO
2/WO
3 photoanode produced a higher quantity of hydrogen than the WO
3 photoanode, in accordance with the higher current flow. The maximum hydrogen production rate recorded under the present conditions, with 1.6 V bias vs. Ag/AgCl, was 4.4 µmol.min
-1. The corresponding current was 24.3 mA. The Faradaic efficiency for hydrogen production under the present conditions could be calculated by the following equivalent [
32]: 1 µmole/min H
2 corresponds to (10
−6 moles) × (6.022 × 10
23 molecules/mole) × (2 electrons/H
2 molecule) × (1.6 × 10
−19 Coulomb/electron)/60 s, which is equal to 3.21 mA. Consequently, 4.4 µmole.min
−1 correspond to 14.1 mA. Since the average real current was 24.3 mA, then the Faradaic efficiency was 58% (14.1/24.3 = 0.58). The Faradaic efficiency depended on the device configuration and reactor parameters, as well as the efficiency of the cathode electrode and the quality of the electrocatalyst. The presently obtained value was relatively low, owed mainly to the use of an inexpensive electrocatalyst (carbon paper loaded with carbon black), but also to the fact that the reactor parameters were not optimized. Comparable Faradaic efficiencies were also obtained in a previous work [
32]. It must be stressed at this point that the quality of the photoanode and the strength of the applied bias mainly dictated the flowing current, while the functionality of the cathode electrode mainly affected the Faradaic efficiency. It relied then mainly on the counter electrode to improve Faradaic efficiency, and this will be a matter of our future projects.
The data of
Figure 7 corresponded to relatively short-time measurements. When the experiment was run for a longer period of time, a slow current drop was observed, which was accompanied by an analogous drop of the hydrogen production rate (cf. the data in our previous work [
32]). The proportionality of current with the hydrogen production rate preserved the value of the Faradaic efficiency, in accordance with the above discussion. It was then again concluded that the photoanode and its immediate environment, as well as the applied bias dictated the current production, while the capacities of the counter electrode dictated the Faradaic efficiency for hydrogen production.


