Article

Study on the Catalytic Pyrolysis Mechanism of Lignite by Using Extracts as Model Compounds

Key Laboratory of Coal Science and Technology of Ministry of Education and Shanxi Province, Taiyuan University of Technology, Taiyuan 030024, China
*
Author to whom correspondence should be addressed.
Catalysts 2019, 9(11), 953; https://doi.org/10.3390/catal9110953
Submission received: 2 October 2019 / Revised: 8 November 2019 / Accepted: 12 November 2019 / Published: 14 November 2019
(This article belongs to the Special Issue Catalytic Fast Pyrolysis)

Abstract

:
Understanding the catalytic pyrolysis mechanism of lignite is of great significance for obtaining a high yield of the target products or designing high-efficiency catalysts, which are generally derived by using simple model compounds, while the ordinary model compounds cannot represent the real atmosphere of lignite pyrolysis owing to the simple structures and single reactions. Based on the coal two-phase model, the extractable compounds are the important compositions of coal, which can reflect the partial characteristics of raw coal while obtaining a high extraction yield. Hence, a better understanding of the interaction between the coal structure and catalyst can be inferred by using a mobile phase in coal as model compounds instead of conventional simple compounds. In this work, tetrahydrofuran extracts of lignite were chosen as model compounds to study the catalytic pyrolysis mechanism with separate addition of Fe(NO3)3 and FeCl3 by using a thermogravimetric combined with mass spectrometry. It was found that about 77.88% of the extracts were vaporized before 700 °C, and the residual yield was 22.12%. With the separate addition of 5 wt % of Fe(NO3)3 and FeCl3, the conversion of the extracts increased to 84.38% and 89.66%. Meanwhile, the final temperature decreased to 650 and 550 °C, respectively. The addition of Fe(NO3)3 and FeCl3 promoted the breakage of aliphatic chains at approximately 150 °C, leading to the generation of CH4 and H2 in the temperature range 100–200 °C, which were nearly invisible for that without catalyst. The addition of iron-based catalysts allowed more CO2 formation at approximately 200 °C since they enabled efficient promotion of the cleavage of carboxyl functionals at lower temperatures. The enlarged peak of H2O and CH4 at approximately 500 °C means that iron-based catalysts are significant for the cleavage of methoxy groups in the catalytic respect. Aromatic side chains facilitated cracking at approximately 500 °C, leading to more light aliphatics and aromatics generation in this temperature range.

1. Introduction

According to BP Statistical Review of World Energy (2018), more than 30% of the world’s reserves of coals is lignite, which will be an important energy resource in this century [1]. Pyrolysis, as the initial step in nearly all coal conversion process, is considered to be the most promising way for clean and efficient utilization of lignite to get useful chemicals [2].
The addition of catalyst in the pyrolysis of lignite is a hopeful method to increase the yield of coal tar or improve the yield of desired low volatility products [3]. Theoretically, it is feasible to assist the breakage of particular chemical bonds, leading to a change in the reaction pathways, and obtaining a high selectivity for specific compounds with high values in the product stream [4,5,6]. Backed by the price advantage, marked availability, and environmental friendliness, Fe-based catalysts have been frequently adopted in diverse coal catalytic thermal conversions. Kang et al. [7] compared the catalytic hydroliquefaction reactivity of Xiaolongtan lignite with different Fe-based catalysts and the results showed that Fe + S catalyst produced the highest gas and oil yields compared to FeS and SO42−/ZrO2 catalyst. Monterroso et al. [8] conducted coal gasification experiments by adding composite Fe-sodium catalyst, by which the carbon conversion rate was dramatically increased at 700 to 800 °C and the yields of H2 and CO at 800 °C also increased by 15% and 40%, respectively. Sowa et al. [9] studied the effect of four different kinds of natural iron ores in catalytic pyrolysis of coal to produce light aromatic hydrocarbons. With the limonite addition, light aromatics production increased remarkably due to its excellent deoxygenation ability. The interaction between the coal structure and the catalyst in the pyrolysis process is vital for the development of new catalytic pyrolysis technology and the design of high efficiency catalyst. Many researchers have tried to obtain the catalytic mechanism with various apparatus [10,11]. Nonetheless, no defined interpretation has been established because of the complex composition of coal, as well as the multiple reactions in the pyrolysis process.
An attractive way to study the catalytic pyrolysis mechanism of lignite is to use model compounds. Sekiguchi et al. [12] studied the effect of basic CaO on the pyrolysis of bibenzyl, and it was found that toluene was the primary product with the catalyst while stilbene was the primary product without the catalyst. Wang et al. [13] performed a theoretical study on the catalytic pyrolysis of benzoic acid with or without four different metallic oxides using the periodic density functional theory (DFT) calculation. Song et al. [14] conducted a hydropyrolysis of phenethyl phenyl ether over an Ni-based catalyst, and found that the noble catalyst exhibited a high level of C–O bond cracking selectivity. Ordinary model compounds can only be adopted to study specific chemical bonds with selective catalysts under the thermal process, and hardly exhibit all the information that takes part in coal pyrolysis owing to the simple structures and single reactions.
According to the fixed-mobile model of coal, the mobile fractions trapped in coal can be removed by organic solvent extraction. Given that the extraction yield strongly relies on the solvent, tetrahydrofuran (THF) has been extensively chosen for its powerful extraction ability [15]. As reported, the extracting yield using THF was 5.09% (Huolinghe lignite) [16], 5.5% (Loy Yang lignite) [17], 6.58% (high-sulfur bituminous coal) [18], and as high as 25% (Australian coals) [19]. In this regard, THF was also chosen in this study since it enables the dissolution of mobile fractions of coal as thoroughly as possible. As extracted from raw coal, the mobile fractions could partially reflect the characteristics and molecular weight distributions of the parent coal during the heating treatment [20]. Therefore, a promising approach to elucidate the catalytic mechanism of raw coal is to study the reactivity of extracts with/without catalyst. As far as we know, current research on the catalytic pyrolysis of extracts has rarely been presented. In this study, the reactivity of extracts with/without catalysts were studied by thermogravimetry with mass spectrometry (TG-MS), which provided deep insight into the sensitive thermal reactions and simultaneous volatile information about the physical and chemical nature of fossil fuels using thimbleful samples (milligram level) in a specific thermal event [21].
The aim of the current study was to elucidate the interaction between the coal structure and catalyst by using THF extracts as model compounds instead of conventional simple compounds, which will benefit the development of new catalytic pyrolysis technology and the design of high efficiency catalysts. In this work, Fe(NO3)3·9H2O and FeCl3·6H2O were used as Fe-based catalysts, which are noted as Fe(N) and Fe(C), respectively. THF was employed to exhaustively extract the mobile phase from the lignite. The composition of the extracts was analyzed by comprehensive two-dimensional gas chromatography mass spectrometry (GC×GC-MS). The thermal behaviors and product distributions of the extracts with/without catalyst were investigated by TG-MS. The kinetic parameters during pyrolysis were also established to gain a deeper insight into the catalytic mechanism.

2. Results and Discussions

2.1. Proximate and Ultimate Analyses

Table 1 shows the proximate and ultimate analyses of the samples. A higher hydrogen to carbon (H/C) and oxygen to carbon (O/C) ratio was exhibited in extracts (EX) in contrast with raw coal (RC) and residue (RE), indicating that THF treatment was efficient in removing the O-containing compounds from RC. Apart from that, a higher H/C ratio in EX implies that it contains more aliphatics and/or long aliphatic side chains. The lower volatile content of RE is attributed to the removal of EX, implying that EX plays an important role in the devolatilization reactions in coal pyrolysis.

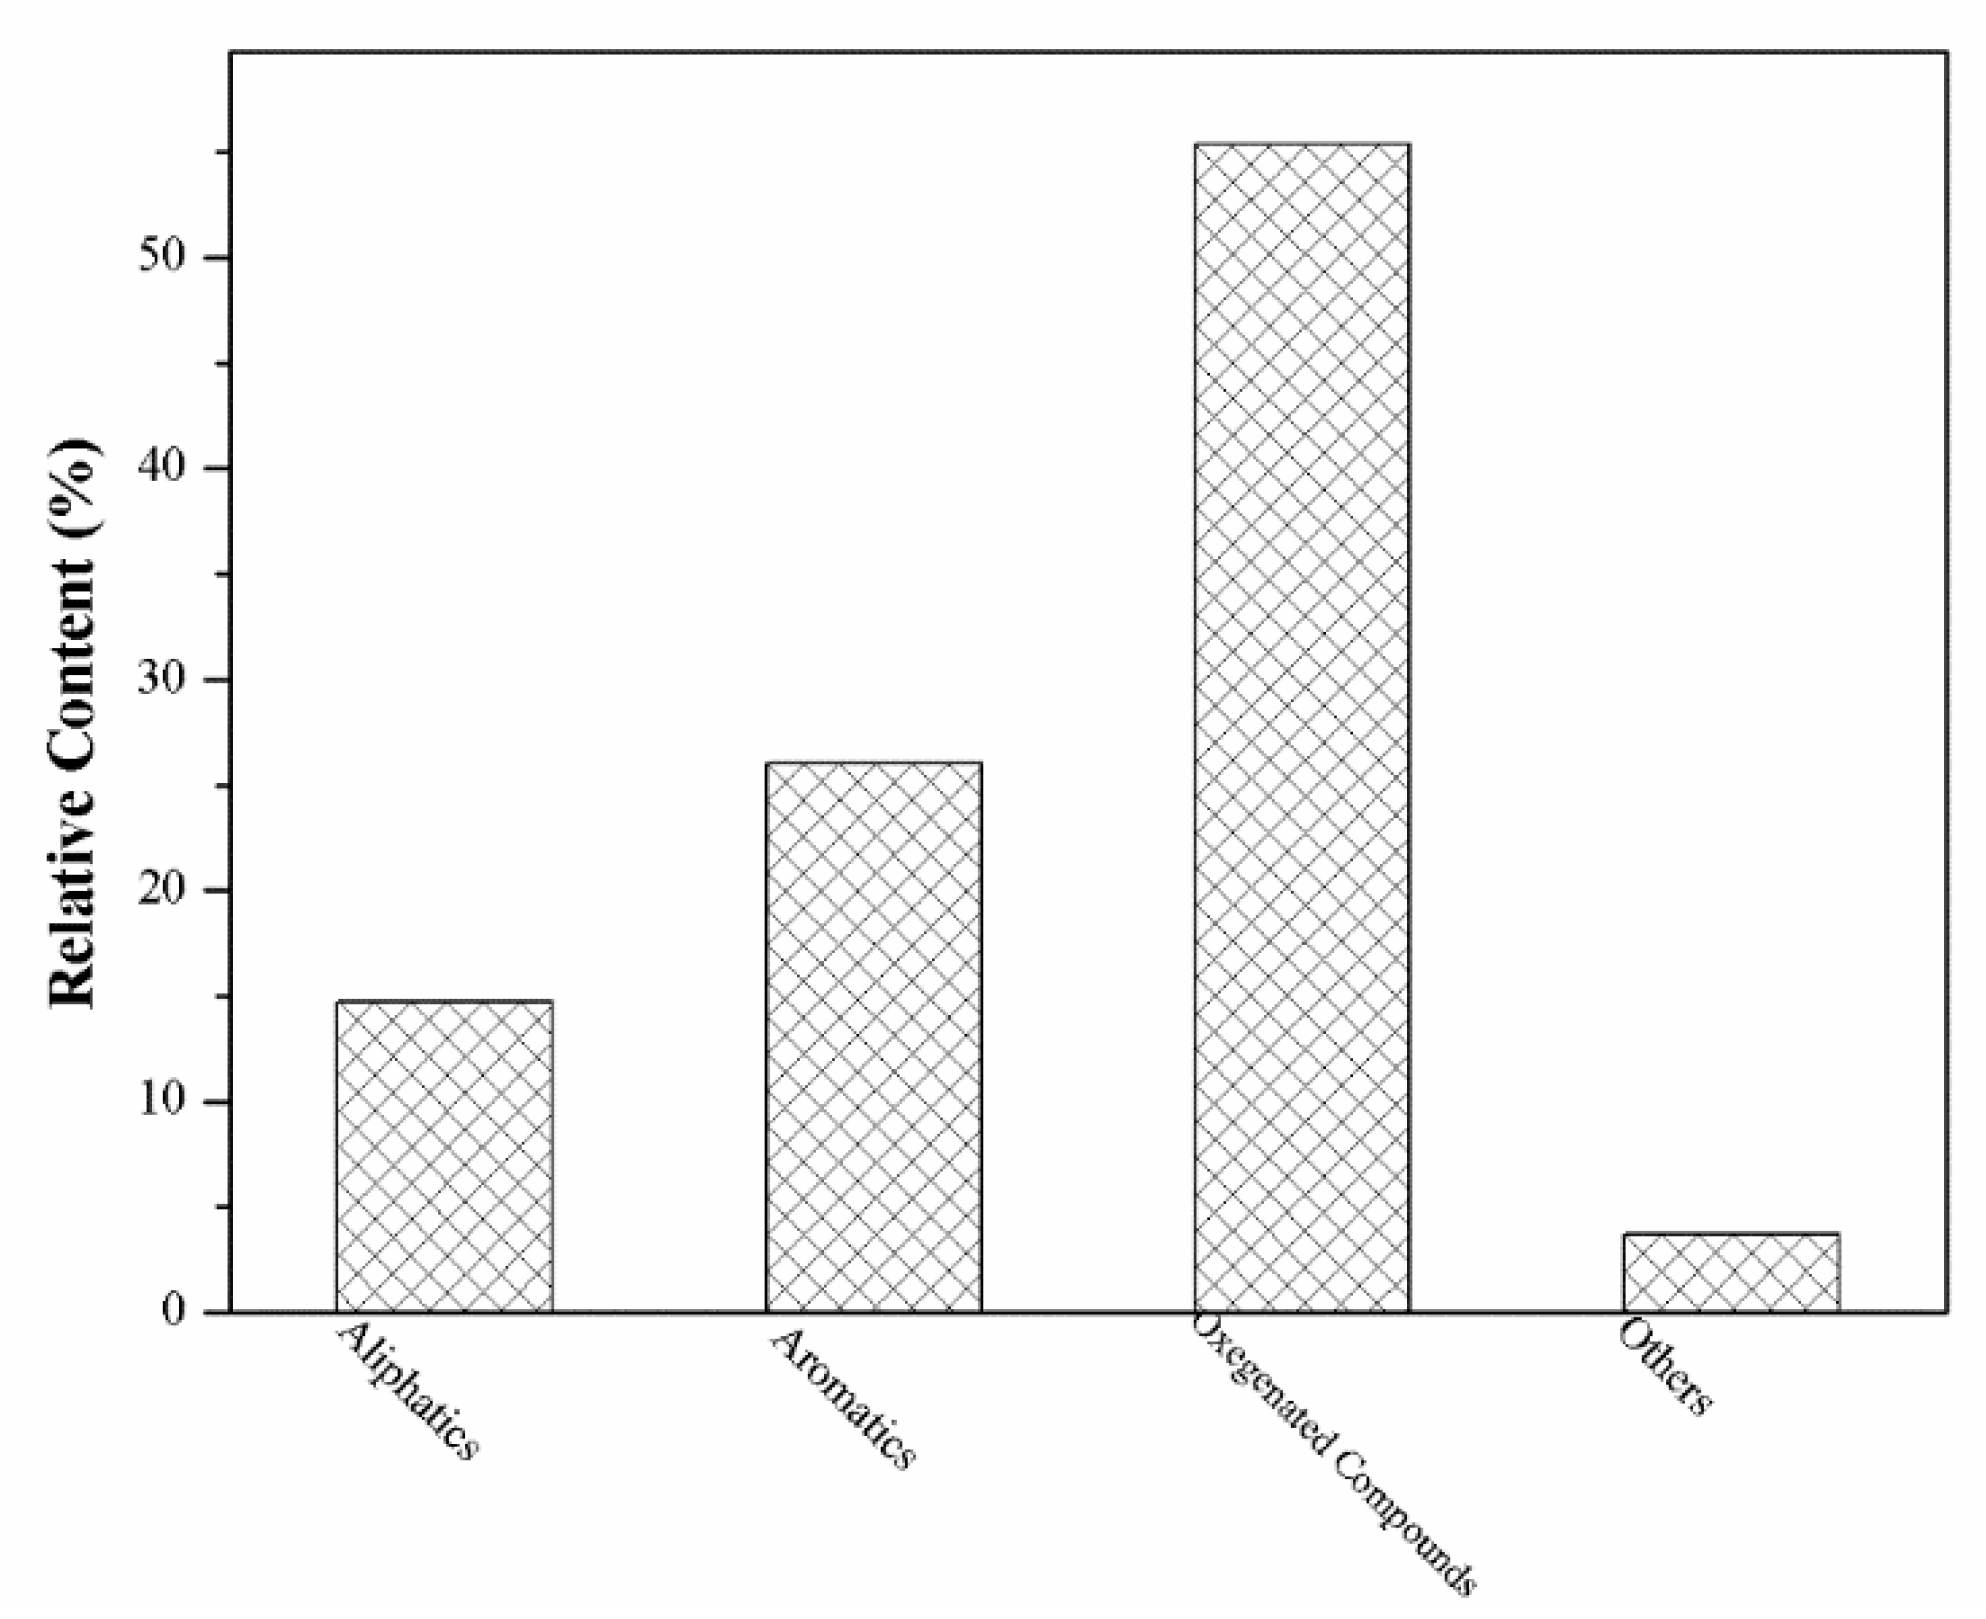
2.2. GC×GC-MS Analysis of Extracts

Figure 1 illustrates a colorized chromatogram of a total intensity chromatogram (TIC) of EX. In the chromatogram, the X-axis is the volatility-based retention time (min), the Y-axis is the polarity-based retention time (s), and the Z-axis is the MS response, which appears as a spot, and its intensity value is displayed by color variation from low (blue) to high (red). The properties of the detected compounds were identified using the National Institute of Standards and Technology (NIST11) library. More than 100 compounds in EX can be well separated and detected using a mass spectrum similarity greater than 70% and a signal-to-noise ratio greater than 500. Here, 55 main compounds were identified as the numbered spots, and are listed in Table S1 (in the Supplementary Materials), which are largely grouped into aromatics, aliphatics, and oxygenated compounds. It can be seen that in Figure 2, the highest content of oxygenated compounds was detected in EX, including phenols, alcohol, ketone, and acid, with a relative content of 55.35%. This result is in good agreement with the literature [18]. It is believed that the oxygenated compounds were extracted by the electronic donor acceptor bonds’ and hydrogen bonds’ interaction between the THF and O-containing structures of the coal [18,22]. The total aromatic content ranging from one ring to four rings is 26.02%. Additionally, most of the remaining components were aliphatic hydrocarbons, which were composed of straight chain alkanes and alkenes.

2.3. TG-MS Analysis of Extract with/without Catalyst

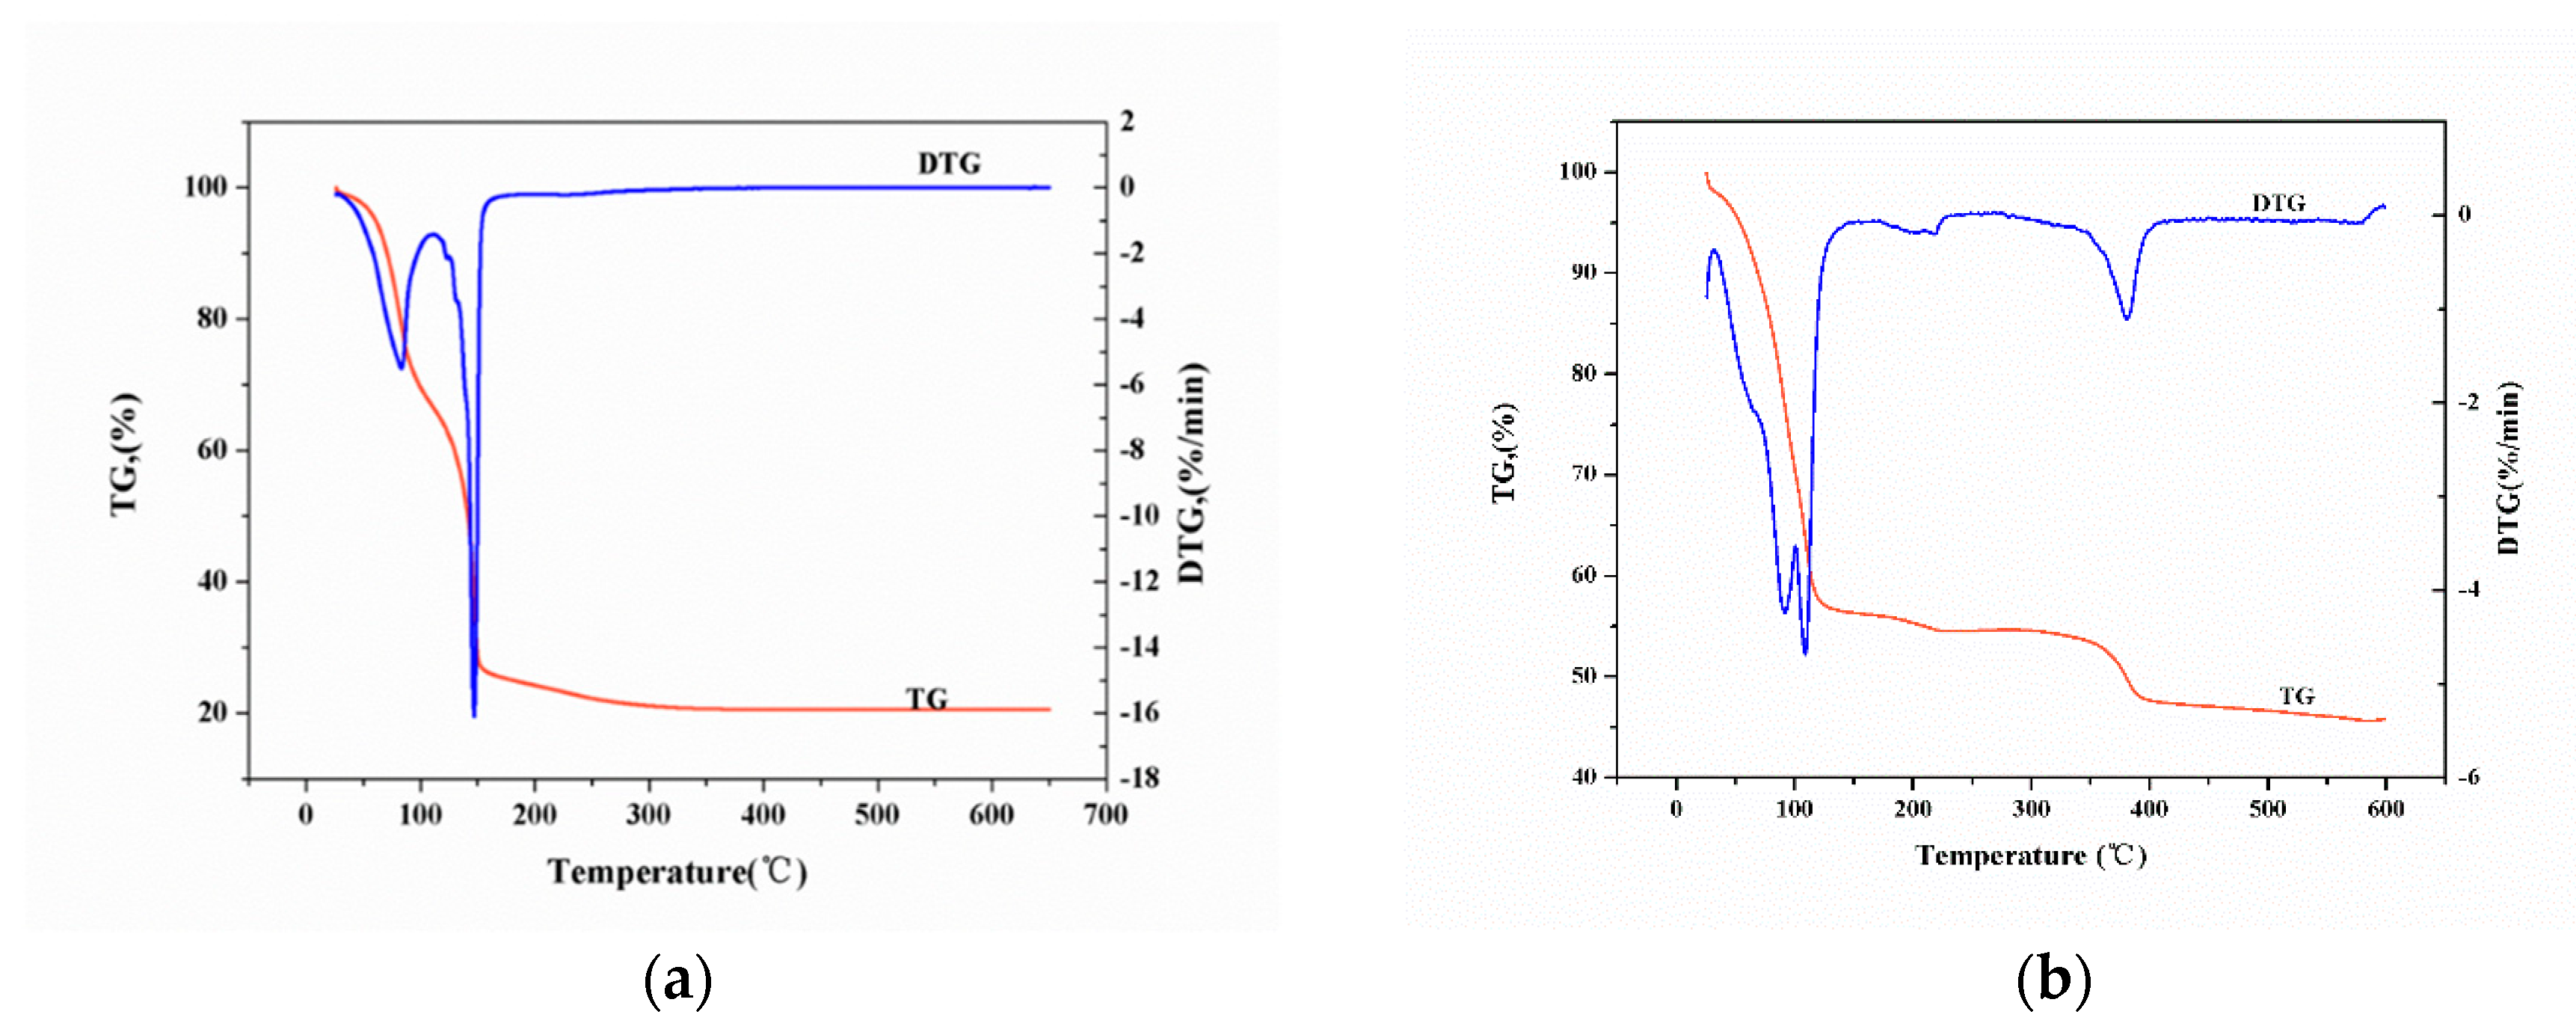
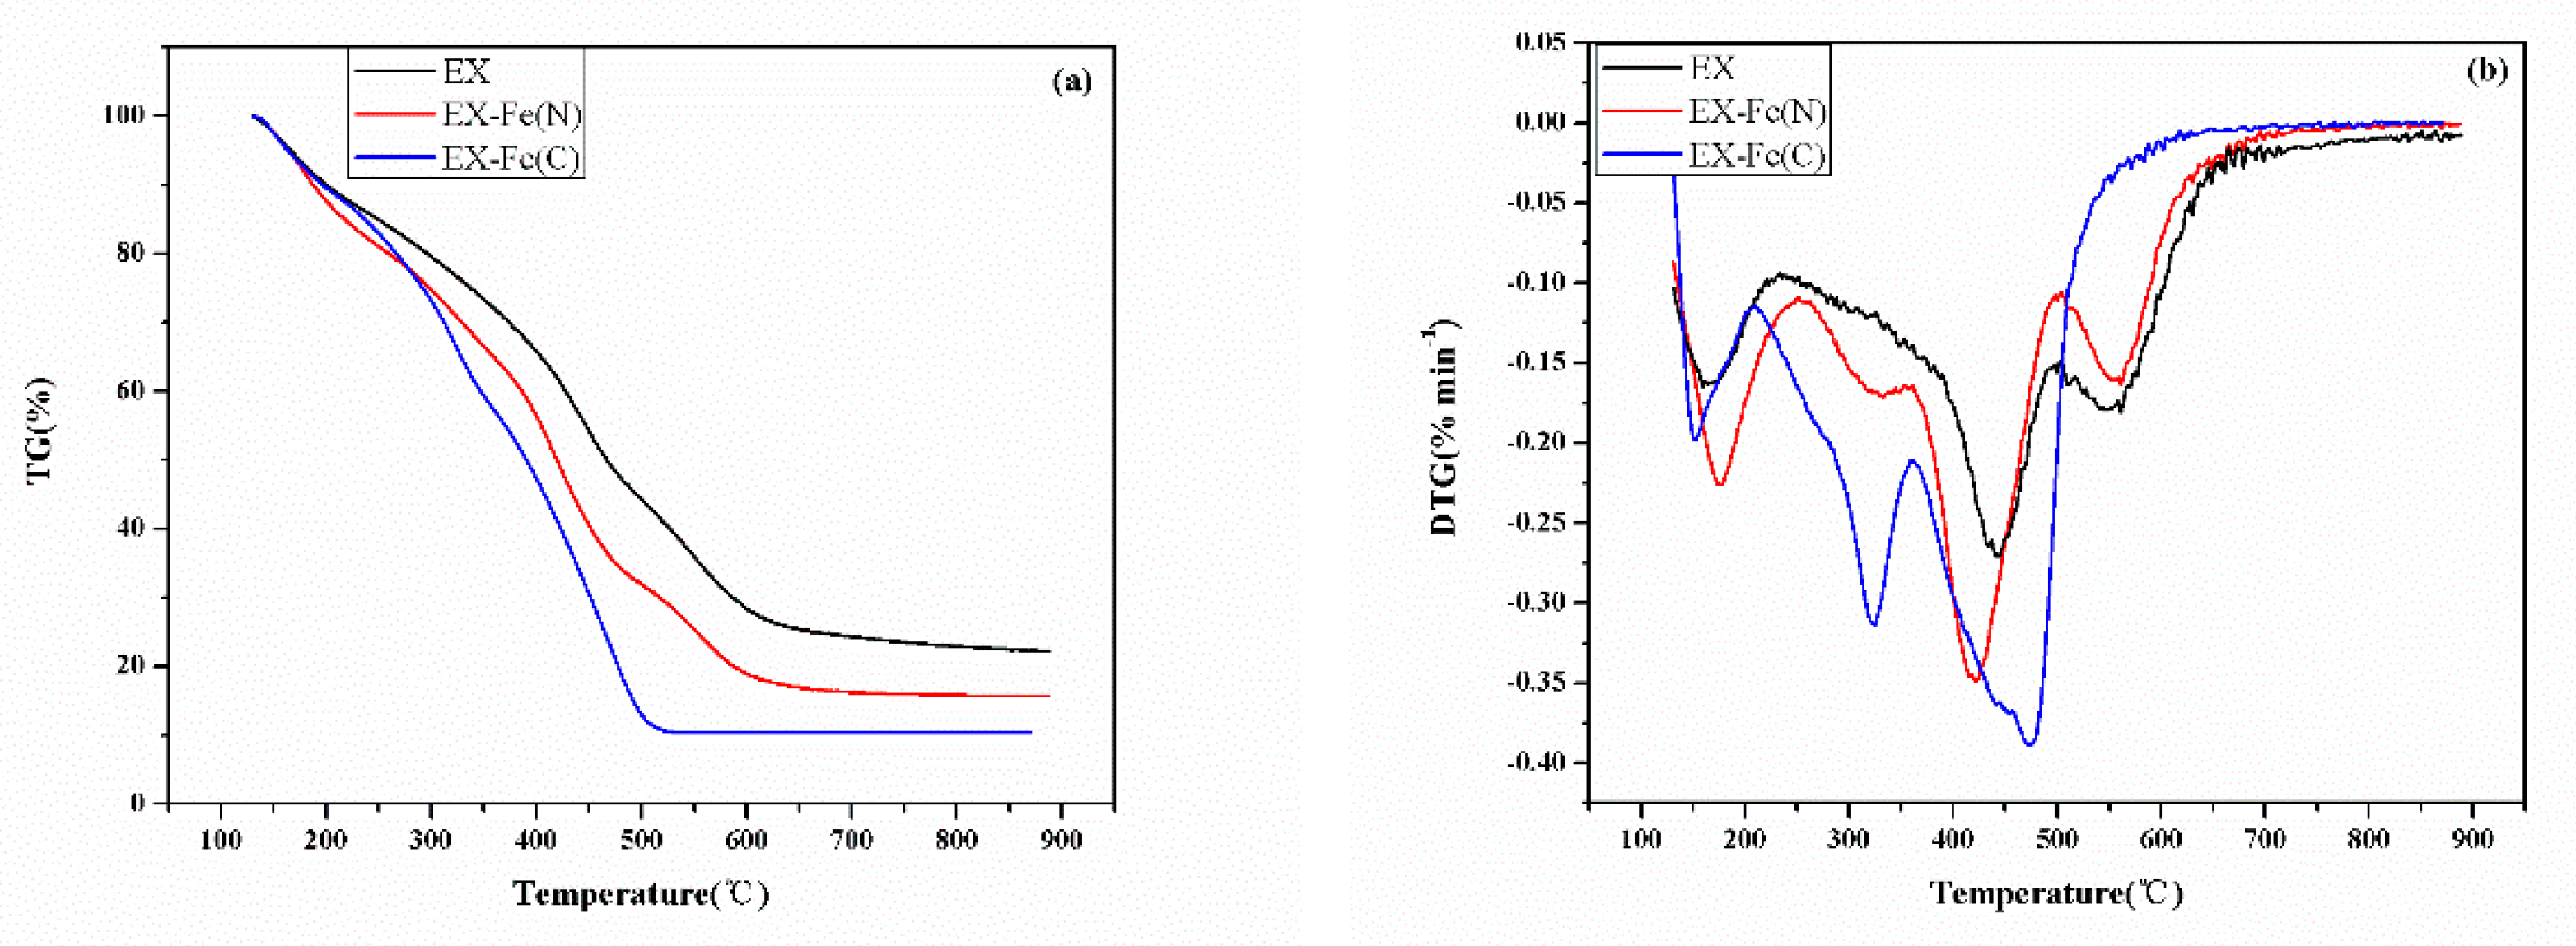
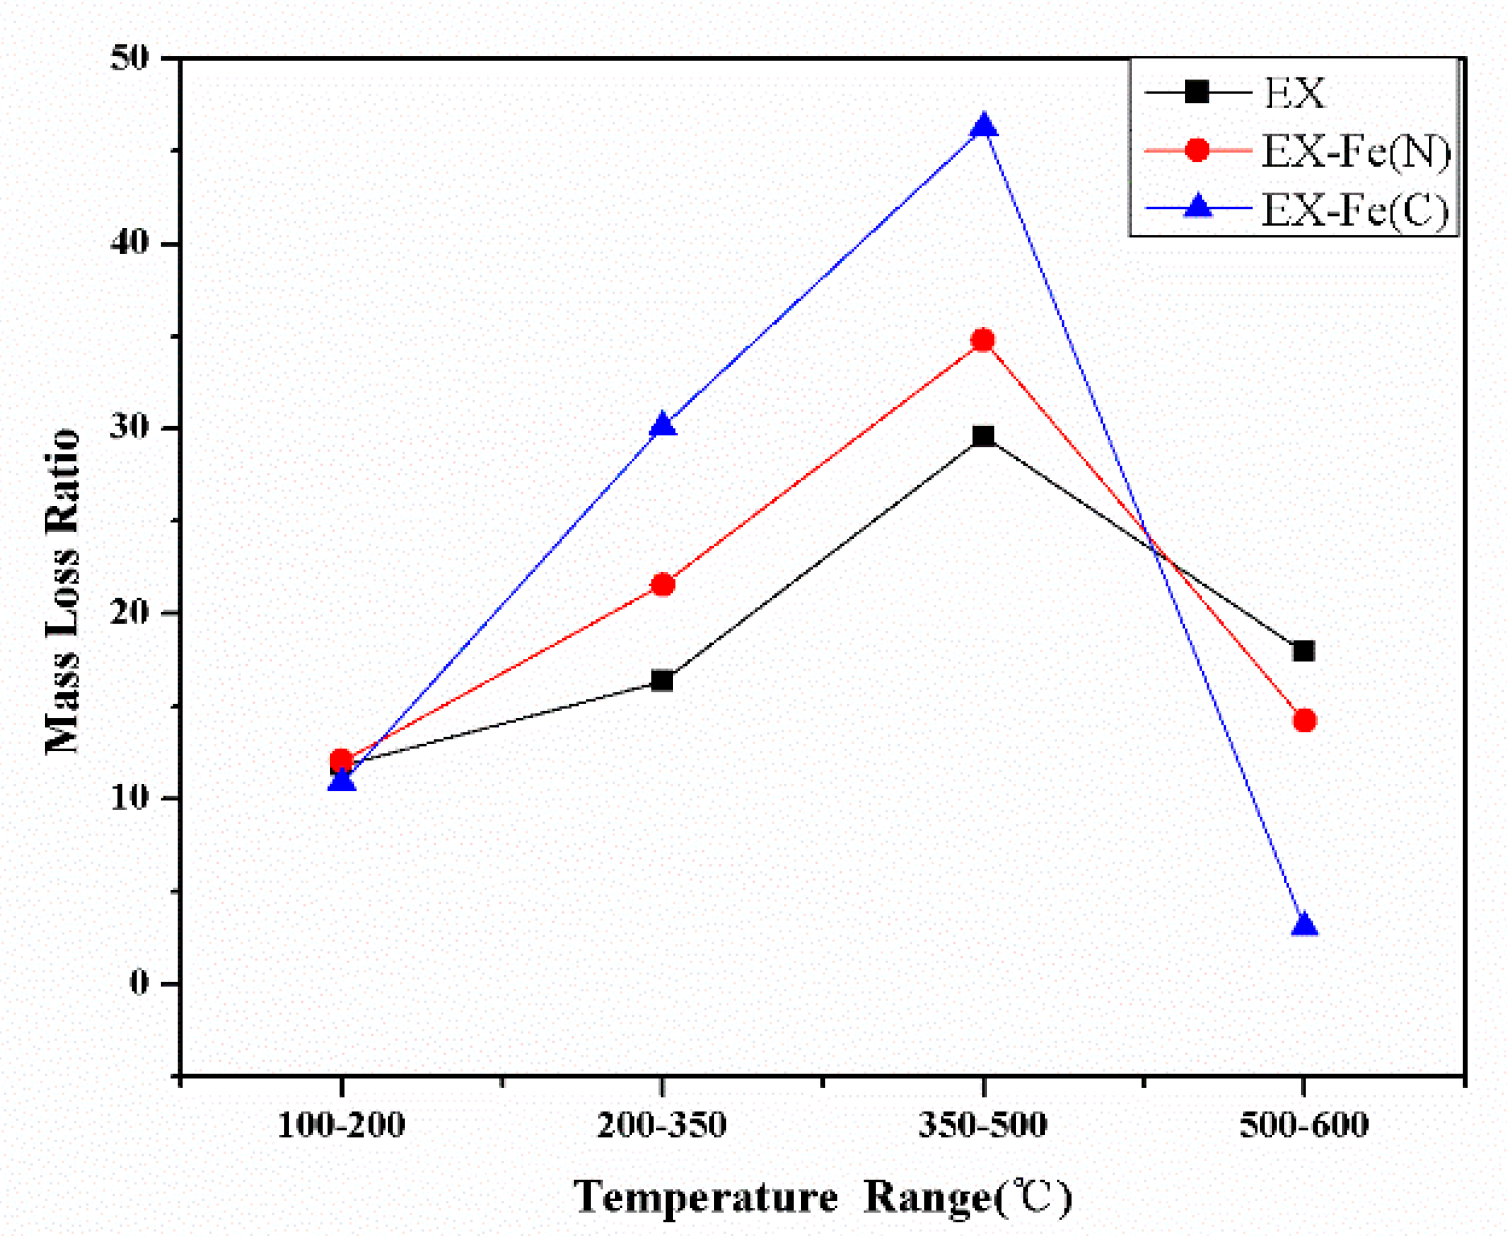
2.3.1. Thermal Behaviors of Extract with/without Catalyst

To explain the characteristics and remove the mass loss of catalyst in the pyrolysis process, TG analyses of pure catalysts was carried out under the same experimental condition. As shown in Figure 3a, two obvious DTG peaks of Fe(N) were observed during the whole thermal treatment. The first mass lose stage between 80 and 120 °C resulted from the dehydration reaction, and the other dramatic peak around 150 °C was ascribed to the decomposition of Fe(N). The DTG results of Fe(C) (Figure 3b) showed that a dramatic peak occurred at about 100 °C because of the crystal water removal, and the other two peaks appeared at 205 and 380 °C, respectively, indicating that more complicated chemical reactions and changeable iron species occurred for Fe(C) in the thermal process, which is in agreement with that reported by Yamashita and Tomita [23,24].
For pyrolysis of EX without catalyst (Figure 4a), approximately 77.88% of the compounds contained in EX were removed before 700 °C, for which the residual yield remained almost unchanged. Here, an unchanged residual yield temperature was defined as the final temperature. In the pyrolysis process, it is commonly recognized that compounds in EX evaporate to form tar, decompose to generate gas, and even repolymerize into larger molecules [18]. TGA curves of EX-Fe(N) and EX-Fe(C) were derived by deducting the mass loss of pure catalyst proportionally. By the separate addition of 5 wt % Fe(N) and Fe(C), the conversion of EX improved to 84.38% and 89.66% at the final temperature. Moreover, the final temperature was decreased to 650 and 550 °C, respectively. Evidently, the catalytic influence of Fe-based catalyst lead to the rise of EX conversion and reduction of the final temperature. Multiple studies [25,26,27] showed that Fe-based catalysts have the capability of cracking the long-chain aliphatic hydrocarbons and lowering the bond energy, thereby making the pyrolysis reaction occur at lower temperature.
As shown in Figure 4b, a DTG peak emerged at about 200 °C, which was similar for three samples, and resulted from the evaporation of small molecules at a low boiling point. The maximum weight loss for the three samples occurred at around 450 °C due to the removal of volatiles and the decomposition reactions. Different from EX, an obvious DTG peak appeared for EX-Fe(N) and EX-Fe(C) at about 300 °C, thus it can be concluded that the addition of Fe(N) and Fe(C) facilitated some stable chemical bonds in EX cracking at lower temperatures. An obvious difference between EX-Fe(N) and EX-Fe(C) was that nearly no mass loss appeared at around 550 °C for EX-Fe(C), suggesting that Fe(N) and Fe(C) exhibited different catalytic performances in the pyrolysis of EX. Given the diversity of mass loss stages, the mass loss ratio in different temperature regions (100–200 °C, 200–350 °C, 350–500 °C, 500–600 °C) for the three samples are illustrated in Figure 5. The mass loss ratio in the first temperature region (100–200 °C) remained constant for the three samples, which was attributed to the evaporation of substances at the low boiling point. In the second temperature region, the mass loss ratio of EX, EX-Fe(N), and EX-Fe(C) was 16.35%, 21.57%, and 30.12%, respectively. In the temperature region 350–500 °C, the mass loss ratio of EX-Fe(N) and EX-Fe(C) increased to 34.75% and 46.29% in contrast with 29.58% for EX. On the contrary, in the temperature region 500–600 °C, the mass loss ratio of EX decreased from 17.93% to 14.21% and 3.08% for EX-Fe(N) and EX-Fe(C). It is believed that the reactions in a certain temperature range are generally related to the cleavage of specific chemical bonds in coal pyrolysis, and the decomposition of Car-Cal and Car-O structures generally occurs at temperatures above 550 °C [28]. Fu et al. [5] considered that Fe-based catalyst facilitated the decomposition of aliphatic chains and O-containing structures, thereby the weight loss for EX-Fe(N) and EX-Fe(C) dramatically increased in the temperature range 200–500 °C. Yamashita et al. [24] studied the local structures of Fe(NO3)3 and FeCl3 during the thermal treatment of iron-loaded brown coal. The iron species of Fe(NO3)3 were exhibited mainly as atomically dispersed Fe or ultrafine FeOOH blow 650 °C, while that of FeCl3 easily aggregated to crystalline FeO at 500 °C. Moreover, Zhao et al. [29] demonstrated that ferrous ions, such as Fe3O4 and FeO, possessed a better catalytic effect for cracking the coal structure in the pyrolysis, which is due to the mass loss ratio of EX-Fe(C) being enlarged more than that of EX-Fe(N) after the temperature reached 450 °C.

2.3.2. Evolution of Gaseous Products

The evolution of gaseous products for EX with/without catalyst are shown in Figure 6a–j. It is clearly observed that the evolution curve of CH4 for EX can be divided into two steps. The first step was assigned to the temperature range 300–500 °C, where CH4 generation started at about 300 °C, followed by a sharp rise trend, achieving a maximum value at around 450 °C. This step resulted from the breakage of long chain aliphatics. The second stage lasted from 500 °C until the final temperature, where the evolution peak appeared at about 550 °C, which was attributed to demethylation of methoxyl groups [30]. By the separate addition of Fe(N) and Fe(C), a slight CH4 evolution appeared in the temperature range 100–200 °C, which was nearly invisible for EX, indicating that Fe(N) and Fe(C) evidently facilitate the cleavage of aliphatic chains, with small radicals (CH3·and H·) formation, and then rapid stabilization with each other. For this reason, H2 (Figure 6b) also appeared in this temperature range for EX-Fe(N) and EX-Fe(C). It is reasonably concluded that EX acts as the hydrogen donors during the catalytic pyrolysis of coal [18]. The evolution peaks around 400 °C for EX-Fe(N) and EX-Fe(C) exhibited a slight difference in comparison with that of EX, which may be due to the different properties of Fe(N) and Fe(C) on the catalytic fracture of aliphatic chains into CH4. The second peak for EX-Fe(N) and EX-Fe(C) was clearly strengthened, along with a decrease in their peak temperature from 600 to 550 and 505 °C, respectively, which evidently resulted from the positive influence of the Fe-based catalysts on the decomposition of the methoxyl groups.
The evolution of H2 for EX also comprised two steps (Figure 6b). In the first step, H2 was released in the temperature range 300–500 °C, which followed a radical mechanism. Small radicals produced from the decomposition of side chains and/or alkyl chains connected to aromatic structures can stabilize with each other to form aliphatic hydrocarbons, H2 and CH4, which is evidence of the phenomenon that H2, CH4, and aliphatic hydrocarbons are simultaneously generated for EX in such a temperature range [21]. In the second step, abundant H2 was generated from the condensation of aromatics above 600 °C [31]. For EX-Fe(N) and EX-Fe(C), the initial formation of H2 appeared at about 150 °C, and the intensities were evidently strengthened in the temperature range 400–500 °C, but decreased at about 600 °C, as Fe-based catalysts clearly promoted the breakage of aliphatic chains at lower temperatures, thereby making the reaction more available. This conclusion is confirmed by the fact that EX-Fe(N) and EX-Fe(C) exhibited a greater mass loss ratio at 350 to 500 °C, and a smaller mass loss ratio after 500 °C in contrast with EX.
The evolution of H2O at low temperatures (<200 °C) mainly came from the moisture of the samples [32]. H2O normally results from the degradation of O-containing functional groups above 200 °C. It is generally accepted that the thermal stability of O-containing functional groups is in the order of –OH > –O– > –C=O > –COOH > –CHO [16,33]. The aldehyde group and carboxyl group are active O-containing structures, which are easily degraded below 300 °C [16]. Carbonyl groups and ether bonds are usually decomposed in the temperature range 350–550 °C [33]. Aromatic hydroxyl is a relatively steady O-containing functional group, which generally fractures above 700 °C [16]. Here, the H2O evolution curve for EX was distributed in a wide temperature range, where the initial peak appeared at around 100 °C for the removal of external moisture, and then achieved three peaks at about 185, 450, and 570 °C, which accounted for the breakage of the aldehyde group and/or carboxyl group, carbonyl groups, and ether bonds, respectively. For EX-Fe(N) and EX-Fe(C), the evolution peak of H2O was clearly enlarged at around 185 °C, while simultaneously the peak at about 450 °C disappeared in comparison with EX, implying that Fe-based catalysts facilitated the degradation of carbonyl groups at lower temperatures. The peak at around 570 °C was dramatically strengthened for EX-Fe(N), and the peak temperature decreased to 500 °C for EX-Fe(C). Moreover, the evolution trend of H2O was strongly close to that of CH4 in the temperature range 400–600 °C, which further proved that Fe-based catalysts effectively promoted the decomposition of methoxy groups.
Similar CO evolution trends are shown in Figure 6d for the three samples during the whole thermal process. Nearly no CO was produced until the temperature reached 300 °C, and then maximum production was achieved at around 500 °C, but finally stopped after 600 °C. CO formation also resulted from the breakdown of oxygenated functional groups. The major tar molecules were released at around 500 °C during the pyrolysis of coal [32], thereby it is reasonably inferred that CO evolution in this temperature range is mainly attributed to the secondary fracture of O-containing structures in volatile molecules for the three samples, and the catalysts possessed a slight influence in the secondary reactions.
The source of CO2 generated during pyrolysis at low temperatures generally comes from three aspects, i.e., adsorbed CO2, breakage of carboxyl groups, and cleavage of some stable O-containing structures [30]. For EX, CO2 was originally generated at about 100 °C for the removal of adsorbed CO2, with a stable rising trend, and reached its first peak at around 300 °C, which was attributed to the breaking of carboxyl functional groups, and then achieved maximum production at around 400 °C for the cracking of stable O-containing heterocycles (Figure 6e). For EX-Fe(N) and EX-Fe(C), a large amount of CO2 formation was observed to 200 °C, and CO2 evolution decreased at around 400 °C, which indicates that the Fe-based catalysts evidently promoted the breakage of carboxyl functional groups at lower temperatures. This is consistent with the conclusion that CO2 yield is dramatically increased by the presence of Fe-based catalysts in the literature [5].
The fragment of C3H5+ (m/z = 41) was chosen to study the development characteristics of light aliphatics since C3H5+ had a sharp peak with an even shape in the aliphatic hydrocarbon mass spectrum [30,34]. As shown in Figure 6f, similar evolution trends were observed for the three samples, where the first slight peak appeared at approximately at 130 °C, and the second strong peak appeared at about 450 °C. Accordingly [30], the evolution of aliphatic hydrocarbons at around 450 °C mainly resulted from the degradation of straight chain paraffin, aromatic side chains, and some Car-O-Cal/Cal-O-Cal structures in the coal. The first peak at around 130 °C was caused by the evaporation of small molecules at the low boiling point. Despite the evolution temperature being almost the same for the three samples, the intensities of EX-Fe(N) and EX-Fe(C) were much stronger than that of EX, suggesting that the cracking of aliphatic structures can be promoted by the presence of Fe-based catalysts, and Fe(C) possessed a better catalytic reactivity.
The evolution curves of benzene, toluene, xylene, and phenol are illustrated in Figure 6g–j. For the evolution of toluene and xylene, an analogous single peak appeared at nearly 500 °C for three samples, while the intensities of EX-Fe(N) and EX-Fe(C) were much stronger than that of EX. Such an evolution trend was strongly close to the second evolution peak of aliphatic hydrocarbon (Figure 6f), indicating that the cracking of aliphatic side chains connected to aromatic structures can be promoted by the presence of Fe-based catalysts at about 500 °C, leading to the generation of more aliphatic and aromatic fragments, which is evidence of the phenomenon that a higher amount of toluene and xylene radicals, along with aliphatic units, emerged in this temperature range for EX-Fe(N) and EX-Fe(C). It is considered that phenol was generated from the decomposition of aryl ether bonds or monohydric phenolic structure, and then stabilization with H· [35]. It was observed that nearly no phenol was generated during the whole thermal process for three samples, indicating that monohydric phenolic structure and/or aryl ether bond were decomposed to form other products, rather than a combination with H.

2.4. Kinetic Analysis

Ex was selected as a respective sample to show the curve of the thermal process at different heating rates (10, 20, and 40 °C/min) from 120 to 900 °C, and the plot of the DAEM method, which are exhibited in Figure 7 and Figure 8, respectively. The thermal curves and DAEM plot for EX-Fe(N) and EX-Fe(C) are shown in Figures S1–S4, respectively (in the Supplementary Materials). E and A values at different conversions were calculated and are listed in Table S2. High correlation coefficients (higher than 0.9) were obtained for three samples, suggesting that the DAEM method could provide good fitting effects. With the conversion ratio changing from 0.1 to 0.9, the E value of EX also increased from 74.31 to 286.03 kJ/mol. The E mean different bond energies of species in EX during the thermal process. Additionally, the variations of A and E showed the same trend, indicating the existence of a compensation effect between A and E [4]. The mean value of E and A for the three different samples are listed in Table 2. The average E value of EX was 146.63 kJ/mol, which was higher than E (98.1 kJ/mol) [36] obtained via the DAEM method in the thermal process of the mobile fractions from a lignite by using NMP/CS2 mixed solvent extraction. This might be due to the heavier components extracted by THF. However, the average value of E for different coals were 180 [36] and 192 kJ/mol [37], respectively, which were higher than the average E of EX in this study, suggesting EX was more easily pyrolyzed than raw coal during the thermal process. With the separate addition of Fe(N) and Fe(C), the average value of EX-Fe(N) and EX-Fe(C) was obviously decreased to 122.17 and 102.39 kJ/mol, respectively, indicating that Fe-based catalysts facilitate the cracking of EX, leading to an increase in EX reactivity, and making the pyrolysis reactions more available. Moreover, the catalytic effect of Fe(C) was higher than Fe(N), which may be due to the appearance of ferrous ion [24,29] in the thermal treatment of Fe(C).

3. Experiments

3.1. Experimental Procedures

Raw coal sample was selected from Yunnan Province, China. Before use, the sample was pulverized and sieved to blow 80 mesh, and then dried at 105 °C for 2 h.
THF was chosen as the extraction solvent in this experiment. Raw coal (10 ± 0.1 g) and 250 mL of THF were added to Soxhlet vessel. The apparatus was heated in a water bath at 80 °C, then the experiment was halted when the solvent became colorless. After extraction, the solution was condensed in a rotary evaporator. The soluble fraction obtained from the Yunnan lignite was 7.21%, which was calculated at the extract-to-coal weight ratio on a dry basis. In addition, raw coal, residue, and extracts are abbreviated as RC, RE, and EX. Before TG-MS analysis, the extracts and the catalysts Fe(N) and Fe(C) were homogeneously mixed at a weight ratio of 5:100 by mixing 50 mg of salt (without crystal water) with 1 g of extracts, which are respectively denoted as EX-Fe(N) and EX-Fe(C).

3.2. GC×GC-MS Analysis

GC×GC-MS is a more effective equipment for analyzing complex samples than traditional GC-MS. Hundreds/thousands of analytes can be fully separated and detected from the sample matrix by using GC×GC-MS [38,39]. In this work, an Agilent 7890B gas chromatograph coupled with a 5977A mass spectrometer (Agilent Technologies, Santa Clara, CA, USA) and an extra ZX10542 thermal modulator (ZOEX Corporation, Houston, TX, USA) were assembled in a GC×GC-MS system. High purity helium (99.999%) was used as the carrier gas. It was employed to analyze the THF extract, and its detailed operational programs are referenced in our previous study [40].

3.3. TG-MS Analysis

TG-MS was used to examine the thermal behavior and detect the volatile product distribution during the thermal treatment. In this work, TG-MS experiments were performed using a thermal analyzer (Setsys Evolution 24, SETARAM, Caluire-et-Cuire, France) combined with a mass spectrometer (HPR20, Hider, Hull, UK) with Ar purging at 100 mL/min. Approximately 10 mg of sample was heated from room temperature to 900 °C at 10 °Cmin−1. The released volatile species, including H2, CH4, CO, CO2, H2O and some non-condensed aliphatics and aromatics, such as benzene, toluene, xylene, and phenol, were measured.

3.4. Kinetic Analysis

To gain a deeper insight into the influence of Fe-based catalysts on the extract during the whole thermal process, a non-isothermal method of the distributed activation energy model (DAEM) [41,42] was adopted in this study. DAEM assumes that the pyrolysis of solid-state samples consists of a series of first-order parallel irreversible reactions, each of which has its own activation energy, all of which exhibit a certain continuous distribution. The resulting DAEM equation of solid-state materials during heating treatment can be described as:
1 V V * = 0 e x p ( A 0 t e x p ( E R T ) d t ) f ( E ) d E ,
where V* is the total amount of volatiles from the pyrolysis reaction, V is the volatile amount evolved by time t, and V/V* is the conversion ratio at the corresponding time, t. A is the pre-exponential factor, E is the apparent activation energy, R is the universal gas constant, and T is the reaction temperature (K). f(E) is the activation energy distribution function, which follows Equation (2):
0 f ( E ) d E = 1 .
For non-isothermal conditions, Equation (2) can be modified under a constant heating rate, β = dT/dt, as in the following equation:
Φ ( E , T ) = e x p ( A β 0 T e x p ( E R T ) d T ) .
Integration and simplification of Equation (3) gives the following logarithmic expression of the equation:
Φ ( E , T ) = e x p ( A R T 2 β E e x p ( E R T ) ) .
According to the Miura [42] integration method, the ultimate Arrhenius equation can be modified by:
l n ( β T 2 ) = l n ( A R E ) l n [ l n ( 1 V V * ) ] E R T .
Thus, the kinetic parameters, E and A, can be determined from the liner plot of ln(β/T2) versus 1/T at different heating rates for the entire conversion ranging from 0 to 1.

4. Conclusions

This study involved the influence of two different iron-based catalysts (Fe(NO3)3 and FeCl3) on the thermal behavior and product distribution of THF extract obtained from a lignite.
The TGA results showed that with the separate addition of 5 wt % Fe(NO3)3 and FeCl3, the conversion of THF extract increased to 84.38% and 89.66% from 77.88%, and the final temperature was lowered to 650 and 550 °C from 700 °C simultaneously. The increase of the mass loss mainly occurred in two stages: 200–350 °C and 350–500 °C. In summary, Fe(NO3)3 and FeCl3 demonstrated the catalytic reactivity for the decomposition of THF extract in the thermal treatment process and FeCl3 exhibited a better catalytic reactivity than Fe(NO3)3.
For the separate addition of Fe(NO3)3 and FeCl3, the evolution of CH4 and H2 commenced at approximately 100 °C, and more short-chain aliphatic hydrocarbons were produced at about 150 °C. The generation peak of H2O at around 570 °C was remarkably increased, simultaneously. The evolution of CH4 showed an analogous trend in this temperature range. The generation temperature of CO2 was lowered to 200 °C from 400 °C with the separate addition of catalyst. More aliphatic side chains connected to aromatic structures facilitated cracking at approximately 500 °C, leading to more aliphatic hydrocarbons and aromatics, including benzene, toluene, and xylene generation, in this temperature range. Moreover, the intensity of H2 was remarkably enlarged in 400–500 °C. The sole evolution peak of CO appeared at approximately 500 °C, which was ascribed to the degradation of tar-O structures. Thus, the evolution curves of CO with/without catalyst remained nearly unchanged in this temperature range.
Kinetics analysis using the DAEM method is suitable for the catalytic thermal treatment of THF extract. With the separate addition of Fe(NO3)3 and FeCl3, the average activation energy of EX dramatically decreased to 146.63 and 122.17 kJmol−1 from 102.39kJmol−1.

Supplementary Materials

The following are available online at https://www.mdpi.com/2073-4344/9/11/953/s1, Figure S1: TGA curves for EX-Fe(N) at different heating rates, Figure S2: TGA curves for EX-Fe(C) at different heating rates, Figure S3: Arrhenius plot of DAEM method for EX-Fe(N), Figure S4: Arrhenius plot of DAEM method for EX-Fe(C), Table S1: Typical components in THF extract detected by GC×GC-MS, Table S2: Variation of E and A obtained from DAEM method for different samples.

Author Contributions

Conceptualization, W.H.; Data curation, J.L., W.H.; Formal analysis, J.L., Q.Z. and L.L.; Funding acquisition, W.H.; Investigation, J.L., Q.Z. and L.L.; Methodology, J.L. and Q.Z.; Project administration, W.H.; Software, J.L.; Validation, Q.Z.; Writing-original draft, J.L.; Writing-review and editing, J.L.

Funding

This work was supported by Natural Science Foundation of China (Grants 21776195 and 21975173), International Science & Technology Cooperation Program (Grant 2013DFG60060) and National Research and Development Program of China (Grants 2018YFB060403-03 and 2018YFB0604600-01-03)

Conflicts of Interest

The authors declare no conflict of interest.

References

  1. Dudley, B. BP Statistical Review of World Energy; ISO 14001; Pureprint Group Limited: Uckfield, UK, 2018. [Google Scholar]
  2. Lievens, C.; Ci, D.; Bai, Y.; Ma, L.; Zhang, R.; Chen, J.Y.; Gai, Q.; Long, Y.; Guo, X. A study of slow pyrolysis of one low rank coal via pyrolysis-GC/MS. Fuel Process. Technol. 2013, 116, 85–93. [Google Scholar] [CrossRef]
  3. Li, G.; Yan, L.; Zhao, R.; Li, F. Improving aromatic hydrocarbons yield from coal pyrolysis volatile products over HZSM-5 and Mo-modified HZSM-5. Fuel 2014, 130, 154–159. [Google Scholar] [CrossRef]
  4. Li, B.; Lv, W.; Zhang, Q.; Wang, T.; Ma, L. Pyrolysis and catalytic pyrolysis of industrial lignins by TG-FTIR: Kinetics and products. J. Anal. Appl. Pyrolysis 2014, 108, 295–300. [Google Scholar] [CrossRef]
  5. Fu, Y.; Guo, Y.; Zhang, K. Influence of Three Different Catalysts (KCl, CaO, and Fe2O3) on the Reactivity and Mechanism of Low-Rank Coal Pyrolysis. Energy Fuel 2016, 30, 2428–2433. [Google Scholar] [CrossRef]
  6. Altuntas, N.; Yurum, Y. Influence of Catalysts on the Pyrolysis of Turkish Zonguldak Bituminous Coal. Energy Fuel 2000, 14, 820–827. [Google Scholar] [CrossRef]
  7. Kang, S.G.; Zong, Z.M.; Shui, H.F.; Wang, Z.C.; Wei, X.Y. Comparison of catalytic hydroliquefaction of Xiaolongtan lignite over FeS, FeS+S and SO42−/ZrO2. Energy 2011, 36, 41–45. [Google Scholar] [CrossRef]
  8. Monterroso, R.; Fan, M.; Zhang, F.; Gao, Y.; Popa, T.; Argyle, M.D.; Towler, B.; Sun, Q.Y. Influences of an environmentally-friendly, inexpensive composite iron–sodium catalyst on coal gasification. Fuel 2014, 116, 341–349. [Google Scholar] [CrossRef]
  9. He, L.; Hui, H.L.; Li, S.G.; Lin, W.G. Production of light aromatic hydrocarbons by catalytic. Fuel 2018, 216, 227–232. [Google Scholar] [CrossRef]
  10. Shi, Z.; Jin, L.; Zhou, Y.; Li, H.; Li, Y.; Hu, H. In-situ analysis of catalytic pyrolysis of Baiyinhua coal with pyrolysis time-of-flight mass spectrometry. Fuel 2018, 227, 386–393. [Google Scholar] [CrossRef]
  11. Seitz, M.; Heschel, W.; Nagler, T.; Nowak, S.; Zimmermann, J.; Stam-Creutz, T.; Frank, W.; Appelt, J.; Bieling, S.; Meyer, B. Influence of catalysts on the pyrolysis of lignites. Fuel 2014, 134, 669–676. [Google Scholar] [CrossRef]
  12. Sekiguchi, Y.; Klabunde, K.J. Catalytic and non-catalytic flow-pyrolysis of bibenzyl. Possible homolytic and heterolytic processes on basic CaO. Fuel Process. Technol. 1981, 4, 73–84. [Google Scholar] [CrossRef]
  13. Wang, M.F.; Zuo, Z.J.; Ren, R.P.; Gao, Z.H.; Huang, W. Theoretical Study on Catalytic Pyrolysis of Benzoic Acid as a Coal-Based Model Compound. Energy Fuels 2016, 30, 2833–2840. [Google Scholar] [CrossRef]
  14. Song, Q.; Cai, J.; Zhang, J.; Yu, W.; Wang, F.; Xu, J. Hydrogenation and cleavage of the C-O bonds in the lignin model compound phenethyl phenyl ether over a nickel-based catalyst. Chin. J. Catal. 2013, 34, 651–658. [Google Scholar] [CrossRef]
  15. Pinto, I.G.; Lobo, L.S.; Cabrita, I. Effect of coal pre-treatment with swelling solvents on coal liquefaction. Fuel 1999, 78, 629–634. [Google Scholar] [CrossRef]
  16. Zou, L.; Jin, L.; Li, Y.; Zhu, S.; Hu, H.Q. Influence of tetrahydrofuran extraction on lignite pyrolysis under nitrogen. J. Anal. Appl. Pyrolysis 2015, 112, 113–120. [Google Scholar] [CrossRef]
  17. Takanohashi, T.Y.; Iino, M. Extraction and Swelling of Low-Rank Coals with Various Solvents at Room Temperature. Energy Fuel 1996, 10, 1128–1132. [Google Scholar] [CrossRef]
  18. Qin, X.; Jiao, T.; Zhang, Y.; Yu, J.; Liang, P. Influence of solvent pretreatment on pyrolysis characteristic of high-sulfur bituminous coal. J. Anal. Appl. Pyrolysis 2018, 135, 54–59. [Google Scholar] [CrossRef]
  19. Tran, Q.A.; Stanger, R.; Xie, W.; Smith, N.; Lucas, J.; Wall, T. Impacts of Mild Pyrolysis and Solvent Extraction on Coking Coal Thermoplasticity. Energy Fuel 2016, 30, 9293–9302. [Google Scholar] [CrossRef]
  20. Iino, M.; Takanohashi, T.; Obara, S.; Tsueta, H.; Sanokawa, Y. Characterization of the extracts and residues from CS2-N-methyl-2-pyrrolidinone mixed solvent extraction. Fuel 1989, 68, 1588–1593. [Google Scholar] [CrossRef]
  21. Zhao, Y.; Hu, H.; Jin, L.; He, X.F.; Wu, B. Pyrolysis behavior of vitrinite and inertinite from Chinese Pingshuo coal by TG-MS and in a fixed bed reactor. Fuel Process. Technol. 2011, 92, 780–786. [Google Scholar] [CrossRef]
  22. Shi, D.L.; Wei, X.Y.; Fan, X.; Zong, Z.M.; Chen, B.; Zhao, Y.P.; Wang, Y.G.; Cao, J.P. Characterizations of the Extracts from Geting Bituminous Coal by Spectrometries. Energy Fuel 2013, 27, 3709–3717. [Google Scholar] [CrossRef]
  23. Yamashita, H.; Yoshida, S.; Tomitat, A. Local Structures of Metals Dispersed on Coal. 1. Change of Local Structure of Iron Species on Brown Coal during Heat Treatment. Energy Fuel 1989, 3, 686–692. [Google Scholar] [CrossRef]
  24. Yamashita, H.; Tomita, A. Local Structures of Metals Dispersed on Coal. 5. Influence of Coal, Catalyst Precursor, and Catalyst Preparation Method on the Structure of Iron Species during Heat Treatment and Steam Gasification. Ind. Eng. Chem. Res. 1993, 32, 409–415. [Google Scholar] [CrossRef]
  25. Zhao, H.; Li, Y.; Song, Q.; Lv, J.; Shu, Y.; Liang, X.; Shu, X. Influences of Iron Ores on the Pyrolysis Characteristics of a Low-Rank Bituminous Coal. Energy Fuel 2016, 30, 3831–3839. [Google Scholar] [CrossRef]
  26. Cyores, R.; Soudan-Moinet, C. Pyrolysis of coal and iron oxides mixtures.1. Influence of iron oxides on the pyrolysis of coal. Fuel 1980, 59, 48–54. [Google Scholar]
  27. Boudou, J.B.; Alain, E.; Furdi, G.; Mareche, J.F.; Albiniak, A. Influences of FeCl3 (intercalated or not in graphite) on the pyrolysis of coal or coal tar pitch. Fuel 1998, 77, 601–606. [Google Scholar] [CrossRef]
  28. Shi, L.; Liu, Q.; Guo, X.; Wu, W.; Liu, Z. Pyrolysis behavior and bonding information of coal—A TGA study. Fuel Process. Technol. 2013, 108, 125–132. [Google Scholar] [CrossRef]
  29. Zhao, Y.; Liu, J.T.; Liang, W.S.; Huang, W.; Zuo, Z.J. Influence of the valence state change of iron oxidation for pyrolysis by using density functional theory. Appl. Surf. Sic. 1993, 32, 409–415. [Google Scholar] [CrossRef]
  30. Liu, J.; Jiang, X.; Shen, J.; Zhang, H. Pyrolysis of superfine pulverized coal. Part 1. Mechanisms of methane formation. Energy Convers. Manag. 2014, 87, 1027–1038. [Google Scholar] [CrossRef]
  31. Wang, M.; Li, Z.; Huang, W.; Yang, J.; Xue, H. Coal pyrolysis characteristics by TG-MS and its late gas generation potential. Fuel 2015, 156, 243–253. [Google Scholar] [CrossRef]
  32. Liu, J.; Jiang, X.; Shen, J.; Zhang, H. Pyrolysis of superfine pulverized coal. Part 2. Mechanisms of carbon monoxide formation. Energy Convers. Manag. 2014, 87, 1039–1049. [Google Scholar] [CrossRef]
  33. Arenillas, A.; Rubiera, F.; Pis, J.; Cuesta, M.; Iglesias, M.; Jimenez, A.; Suarez-Ruiz, I. Thermal behaviour during the pyrolysis of low rank perhydrous coals. J. Anal. Appl. Pyrolysis 2003, 68–69, 371–385. [Google Scholar] [CrossRef]
  34. Szabo, G.V.; Till, F.; Szekely, T. Investigation of subbituminous coals by thermogravimetry-mass spectrometry Part 1. formation of hydrocarbon products. Thermochim. Acta 1990, 170, 167–177. [Google Scholar] [CrossRef]
  35. Yan, L.; Bai, Y.; Zhao, R.; Li, F.; Xie, K. Correlation between coal structure and release of the two organic compounds during pyrolysis. Fuel 2015, 145, 12–17. [Google Scholar] [CrossRef]
  36. Tian, B.; Qiao, Y.; Bai, L.; Feng, W.; Jiang, Y.; Tian, Y. Pyrolysis behavior and kinetics of the trapped small molecular phase in a lignite. Energy Convers. Manag. 2017, 140, 109–120. [Google Scholar] [CrossRef]
  37. Kawni, K.; Bhattacharya, S. Pyrolysis kinetics and reactivity of algae–coal blends. Biomass Bioenergy 2013, 55, 291–298. [Google Scholar]
  38. Westhuizen, A.C.; Crouch, A.; Sandra, P. The use of GC×GC with time-of-flight mass spectrometry to investigate dienes and Diels-Alder polymerisation products in high-temperature Fischer-Tropsch-based fuels. J. Sep. Sci. 2008, 31, 3423–3428. [Google Scholar] [CrossRef]
  39. Pierce, K.M.; Hoggard, J.C.; Mohler, R.E.; Synovec, R.E. Recent advancements in comprehensive two-dimensional separations with chemometrics. J. Chromatogr. A 2008, 1184, 341–352. [Google Scholar] [CrossRef]
  40. Liu, J.; Zhang, Q.; Liang, L.; Guan, G.; Huang, W. Catalytic depolymerization of coal char over iron-based catalyst: Potential method for producing high value-added chemicals. Fuel 2017, 210, 329–333. [Google Scholar] [CrossRef]
  41. Zhang, C.; Jiang, X.; Wei, L.; Wang, H. Research on pyrolysis characteristics and kinetics of super fine and conventional pulverized coal. Energy Convers. Manag. 2007, 48, 797–802. [Google Scholar] [CrossRef]
  42. Miura, K.; Maki, T. A simple method for estimating f(E) and K0(E) in the distributed activation energy model. Energy Fuel 1998, 12, 864–869. [Google Scholar] [CrossRef]
Figure 1. A colorized chromatogram of a total ion chromatography of extracts.
Catalysts 09 00953 g001
Figure 2. The content of different chemical groups in EX.
Catalysts 09 00953 g002
Figure 3. (a) TG-DTG analysis of Fe(N); (b) TG-DTG analysis of Fe(C).
Catalysts 09 00953 g003
Figure 4. (a) TGA curve of EX with/without catalyst; (b) DTG curve of EX with/without catalyst.
Catalysts 09 00953 g004
Figure 5. Mass loss ratios of EX with/without catalyst in different temperature ranges.
Catalysts 09 00953 g005
Figure 6. Evolution products during thermal treatment of EX with/without catalyst: (a) CH4; (b) H2; (c) H2O; (d) CO; (e)CO2; (f) aliphatics; (g) benzene; (h) toluene; (i) xylene; and (j) phenol.
Catalysts 09 00953 g006
Figure 7. TGA curve of EX at different heating rates.
Catalysts 09 00953 g007
Figure 8. Arrhenius plots of the DAEM method for EX.
Catalysts 09 00953 g008
Table 1. Proximate analyses and ultimate analyses.
SamplesProximate Analyses (wt %) Ultimate Analyses (wt %, daf) Atomic Ratio
MadAdVd CHNSO* H/CO/C
RC15.819.9357.69 63.464.732.080.9228.81 0.8940.340
RE11.3910.3555.38 64.834.382.040.9627.79 0.8110.321
EX--- 51.6912.340.731.0834.16 2.8650.496
* by difference.
Table 2. Mean value of E and A for three different samples.
E (kJ/mol)A (min−1)
EX146.634.57 × 108
EX-Fe(N)122.171.32 × 108
EX-Fe(C)102.391.45 × 104

