Article

A 2.5D Electrode System Constructed of Magnetic Sb–SnO2 Particles and a PbO2 Electrode and Its Electrocatalysis Application on Acid Red G Degradation

1
Department of Environmental Science and Engineering, Xi’an Jiaotong University, Xi’an 710049, China
2
Department of Structures and Environmental Engineering, University of Agriculture, Faisalabad 38040, Pakistan
3
Water Affair Science and Technology Research Institute, Shaanxi Water Affair Group, Xi’an 710021, China
*
Author to whom correspondence should be addressed.
Catalysts 2019, 9(11), 875; https://doi.org/10.3390/catal9110875
Submission received: 9 October 2019 / Revised: 19 October 2019 / Accepted: 21 October 2019 / Published: 23 October 2019
(This article belongs to the Special Issue Green Synthesis and Catalysis)

Abstract

:
A novel electrode consisting of a Ti/PbO2 shell and Fe3O4/Sb–SnO2 particles was developed for electrochemical oxidation treatment of wastewater. Scanning electron microscope (SEM), X-ray diffraction (XRD), the current limiting method, toxicity experiments, and high-performance liquid chromatography were adopted to characterize its morphology, crystal structure, electrochemical properties, the toxicity of the wastewater, and hydroxyl radicals. Acid Red G (ARG), a typical azo dye, was additionally used to test the oxidation ability of the electrode. Results indicated that the 2.5D electrode could significantly improve the mass transfer coefficient and •OH content of the 2D electrode, thereby enhancing the decolorization, degradation, and mineralization effect of ARG, and reducing the toxicity of the wastewater. The experiments revealed that, at higher current density, lower dye concentration and higher temperature, the electrochemical oxidation of ARG favored. Under the condition of 50 mA/cm2, 25 °C, and 100 ppm, the ARG, Chemical Oxygen Demand (COD) and Total Organic Carbon (TOC) removal efficiency reached 100%, 65.89%, and 52.52%, respectively, and the energy consumption and the current efficiency were 1.06 kWh/g COD, 8.29%, and energy consumption for TOC and mineralization current efficiency were 3.81 kWh/g COD, 9.01%. Besides, the Fe3O4/Sb–SnO2 particles after electrolysis for 50 h still had remarkable stability. These results indicated that the ARG solution could be adequately removed on the 2.5D electrode, providing an effective method for wastewater treatment.

Graphical Abstract

1. Introduction

Electrochemical oxidation (EO) is an environmentally friendly technology for treatment of hazardous or refractory contaminants from wastewater [1,2,3,4,5]. The application of EO is highly promising for yielding some useful by-products. Electrodes, especially the anode, are the core of the electrochemical system, therefore, numerous studies have been carried out on the various electrode materials [6,7,8]. The most common electrocatalytic anodes include titanium-based electrode (Dimension stable anode (DSA electrode), including PbO2 [9,10], Sb–SnO2 [11,12], IrO2 [13] and RuO2 [14] electrodes), noble metal electrode and graphite electrode (including common graphite electrode and boron doped diamond electrode [15,16]). Each electrode has some specific properties on account of its advantages and disadvantages [1]. Compared with other electrodes, the DSA electrodes are inexpensive, easy to prepare, and have high catalytic properties and strong stability [1,11,17,18].
The mass transfer process, as a significant restriction of the electrochemical oxidation, is primarily influenced by the electrochemical reactor structure [2]. The EO system has been conducted by using a conventional 2D electrode or by a newly developed 3D cell while both have their limitations regarding practical applications [19]. The traditional 2D electrochemical reactor, including cathodes and anodes, has the mass transfer limitation and the low area–volume ratio [20,21,22]. On the other hand, 3D electrochemical reactor promotes the mass transfer efficiency, current efficiency, and decreases the energy consumption, whereas relatively low cyclic stability is still an issue [23,24,25].
During the process of pollutants oxidization in the 2D reactor, the DSA electrode became inactive due to corrosion and the coatings dispersed in solution that also cannot be recycled, which result in serious material waste [26]. In our previous work [27,28], a new electrolytic cell type named 2.5D electrode system was proposed, as shown in Scheme 1. It consists of a DSA anode as the central electrode, and metal oxide coated magnetic particles as the auxiliary electrodes while the use of a magnet conduces to tightly join the central electrode and the auxiliary electrodes as well as to effectively recycle the magnetic particles. In contrast to the 3D reactor, the particles do not scatter in the solution but comes on the surface of the electrode, which increases the real surface area of the electrode and decreases the applied current density on the central electrode, leading to higher current efficiency and stronger electrode stability.
In the preliminary work, Sb–SnO2 electrode shell (central electrode) and Fe3O4/Sb–SnO2 magnetic particles (auxiliary electrodes) were used for electrochemical oxidation. The Sb–SnO2 electrode did not perform well in terms of stability [4], and the accelerated life of the previous 2.5D electrode was only 24 h [27], which would limit its further industrial application. The PbO2 electrode was a typical titanium-based electrode with excellent stability and high hydroxyl radical yield [29]. However, the leakage of lead ions was an obstacle in further use [7,26]. In this work, the new 2.5D electrode system (as shown in Scheme 1) consists of PbO2 electrode and Sb–SnO2 particles. That combination makes full use of the high stability of PbO2 electrode and the high catalytic activity of Sb–SnO2 particles. At the same time, it is also expected to reduce the release of lead ions on the surface of PbO2 electrode by covering with Sb–SnO2 particles. In this paper, the mass transfer and electrochemical performance of this new 2.5D electrode system were investigated in detail, and the electrocatalytic degradation experiments of relevant target organics were also conducted.

2. Materials and Experiment

2.1. Chemicals and Reagents

All chemicals used in the experiment were obtained from Sinopharm Chemical Reagent Xi’an Co., Ltd. (Xi’an, China), and were of analytical grade without further purification. The pure water fabricated in a water purification system (EPED-S2-D, EPED, Nanjing, China).

2.2. Electrode and Magnetic Powder Preparation

Ti cylinder tube (Purity > 99.6%, BaoTi Ltd., Baoji, China) with a dimension of φ 3 cm × 12 cm were used as the electrode substrate. The Sb–SnO2 layer was coated on the Ti tubes through a brush coating method as reported by our previous work [30,31]. After that, one end of the Ti tubes was sealed with epoxy ethyl ester and polyamide ethyl ester. Finally, the PbO2 coating was fabricated by electrodeposition with an inner layer (α-PbO2) and an outer layer (β-PbO2). The electrodeposition process was conducted in a two-electrode system undercurrent of 10 mA∙cm−2. The α-PbO2 and β-PbO2 layers were prepared by electrodeposition at 40 °C for 30 min and 65 °C for 120 min respectively. Details for the electrodeposition process of PbO2 coating can be found in our previous work [6,7,32,33].
The specific preparation method of the Sb–SnO2 magnetic particles was the same as our previous work [27], mainly including heating and stirring, calcination, grinding, and sieving.
The 2D electrode system consisted of titanium tube-based lead dioxide anode and annular copper cathode. In the 2.5D electrode system, the titanium tube-based lead dioxide electrode was covered by a certain amount of Sb–SnO2, magnetic powder used as the anode. The annular copper cathode in the same size as the 2D electrode system was used as the cathode.

2.3. Material Characterizations

The morphology, microstructure and element content of the prepared magnetic particles were analyzed by scanning electron microscopy (SEM: JSM-6390A, JEOL, Tokyo, Japan) equipped with an EDX (energy-dispersive X-ray spectroscopy) detector. X-ray diffraction (XRD: X’pert PRO MRD, PANalytical, Almelo, Holland, Cu Kα) was adopted to analyze crystal structure, with the scanning angle ranging from 10° to 80°. The magnetic property of the granules was determined by a vibrating sample magnetometer (VSM: 735 VSM Controller, LakeShore, Westerville, OH., USA). The powder sample was sealed in a 3 mm × 1 mm space on the vibrating stick and the mass of each sample was recorded. The range of magnet field intensity was set between −7500 Oe and 7500 Oe.

2.4. Electrode System Characterizations

2.4.1. Determination of Mass Transfer Coefficient

The mass transfer coefficient determined by the most common method reported in the literatures is the current limiting method [34,35]. The volume of the test solution was 500 mL, and it contained 0.2 mol/L K3Fe(CN)6 and 0.1 mol/L K4Fe(CN)6 with 1mol/L Na2SO4 as the supporting electrolyte. Then a three-electrode system was scanned with an Amperometric i-t Curve in an electrochemical workstation (CHI 660D, Chenhua, Shanghai, China). The working electrode was a 2.5D electrode and a 2D electrode, respectively. The reference electrode was a saturated calomel electrode. Raising voltage from 0.4 V to 3.4 V every 0.2 V with a scanning interval of 400 s, the results were made into a U–I curve. The corresponding mass transfer coefficient can be calculated through Equation (1).
k = I l i m n F A C B ,
where k is the mass transfer coefficient, m/s; Ilim is the limiting current, A; n is the electron transfer number; F is the Faraday constant (96,500 C·mol−1); A is the plate area, m2; CB is the bulk solution concentration, kmol/m3.

2.4.2. Cyclic Voltammogram Test

The cyclic voltammogram test was performed at an electrochemical workstation (CHI 660D, Chenhua, Shanghai, China) in a three-electrode cell system. Copper sheets acted as the counter electrode, and Ag/AgCl (sat KCl) served as a reference electrode. The measure of cyclic voltammogram test performed in 0.5 mol·L−1 Na2SO4 solutions at the scan rate of 0.05 V·s−1 from 0 V to 2 V.

2.4.3. The Determination of •OH

Hydroxyl radicals were measured by an indirect method with DMSO as the capture agent [36,37]. 2.5D and 2D electrode were used to electrolysis a 500 mL-volume solution with 250 mmol/L DMSO for 1 h at 40 mA/cm2, sampling 2 mL every 15 min. The samples were filtered through a 0.45 μm filter, maintained at 25 °C for a certain time, then 2.5 mL pH 4.0 H3PO4–NaH2PO4 and 0.2 mL six mmol/LDNPH were added and diluted to 5 mL. The mixture was maintained at room temperature for 30 min and analyzed by HPLC (Sykam S500, Sykam, Eresing, Germany). HPLC conditions: λ = 355 nm, injection volume: 20 μL, mobile phase: methanol/water = (60/40, v/v). The flow rate of 1.0 mL·min−1. Samples were ultrasonically degassed and filtered with a 0.45 μm PTFE filter.

2.5. Electrochemical Oxidation Process

Acid Red G (C18H13N3Na2O8S2, Chemical Abstracts Service Number ( CAS no.) 3734-67-6) and three other organics (including Salicylic acid (CAS no.69-72-7), Phenol (CAS no.108-95-2), and Aniline (CAS no.62-53-3)) were selected as the target organics in the electrochemical oxidation process. Electrochemical oxidation was conducted in a thermostatic glass cell (φ = 5 cm) using the two-electrode configuration, and the electrolyte circulated through a peristaltic pump. The 2.5D and 2D electrode were used as the anode and a copper sheet was employed as the cathode. The volume of the electrolyte solutions was 500 mL. To maintain the conductivity of the solution (27.2 mS/cm), 0.1 mol·L−1 Na2SO4 was added to the aqueous solution. The experiments were operated with a magnetic stirrer for 120 min, sampling 5 mL every 30 min. A UV-visible spectrophotometer (UV2600A, Unico, Shanghai, China) was employed to measure the absorbance spectra of Acid Red G (ARG), and the maximum absorption peak of ARG was at 505 nm. The Chemical Oxygen Demand (COD) was measured with a water quality tester (ET99722 Lovibond, Shanghai, China). TOC was analyzed by ET1020A TOC analyzer.
The calculation methods of some indexes, such as ARG removal efficiency (ηARG), COD removal efficiency (ηCOD), TOC removal efficiency (ηTOC), current efficiency (CE), energy consumption (ECCOD, kWh/gCOD), mineralization current efficiency (MCE) and TOC energy consumption (ECTOC, kWh/gTOC), are shown in the following equations.
η A R G = A 0 A t A 0 × 100 % ,
η C O D = C O D 0 C O D t C O D 0 × 100 % ,
η T O C = T O C 0 T O C t T O C 0 × 100 % ,
C E = F V C O D 0 C O D t C O D 0 × 100 % ,
E C C O D = U I t V ( C O D 0 C O D t ) ,
E C T O C = 50 U I t 3 V × T O C 0 × η T O C ,
M C E =   n F V ( T O C 0 T O C t ) m I t × 4.32 × 10 7 × 100 % ,
where A0 and At are the absorbance value in 505 nm of initial wastewater sample and electrolysis at the given times t, COD0 and CODt are the COD of initial wastewater sample and electrolysis at the given times t, g·m−3. TOC0 and TOCt are the TOC of initial wastewater sample and electrolysis at the given times t, g·m−3. I is the current (A); U is the cell voltage (V); V is the volume of the electrolyte (m3); t is the treatment time (min); n is the number of electrons consumed during ARG mineralization (98); 4.32 × 10⁷ is the conversion factor (3600 s·h−1 × 12,000 mg); m is the number of carbon atoms in the ARG molecule (18).

2.6. Toxicity Evaluation of Degradation Result

The concentration of a metal element in the solution after electrolysis was determined by ICP-OES (ICPE-9000, SHIMADZU, Kyoto, Japan).
Biofluorescence method. According to GB 15441-1995, toxicity experiments were carried out to evaluate the toxicity of samples after electrochemical oxidation. Photobacterium phosphoreum T3 was purchased from the China Microorganisms Collection Center. Three sets of parallel and one control group were set for each sample to test. In the parallel-group, 867 μL of the test sample was added, and in the control group, 867 μL of pure water was added. After contacting with the sample, the broth was placed on a Modulus™ single-tube multi-purpose detector and counted. Relative luminosity significantly negatively correlated with the concentration of toxic components in the water sample. Therefore, the relative luminosity of the water sample can be measured with a bioluminescence photometer to indicate its toxic luminescence level.

3. Results and Discussion

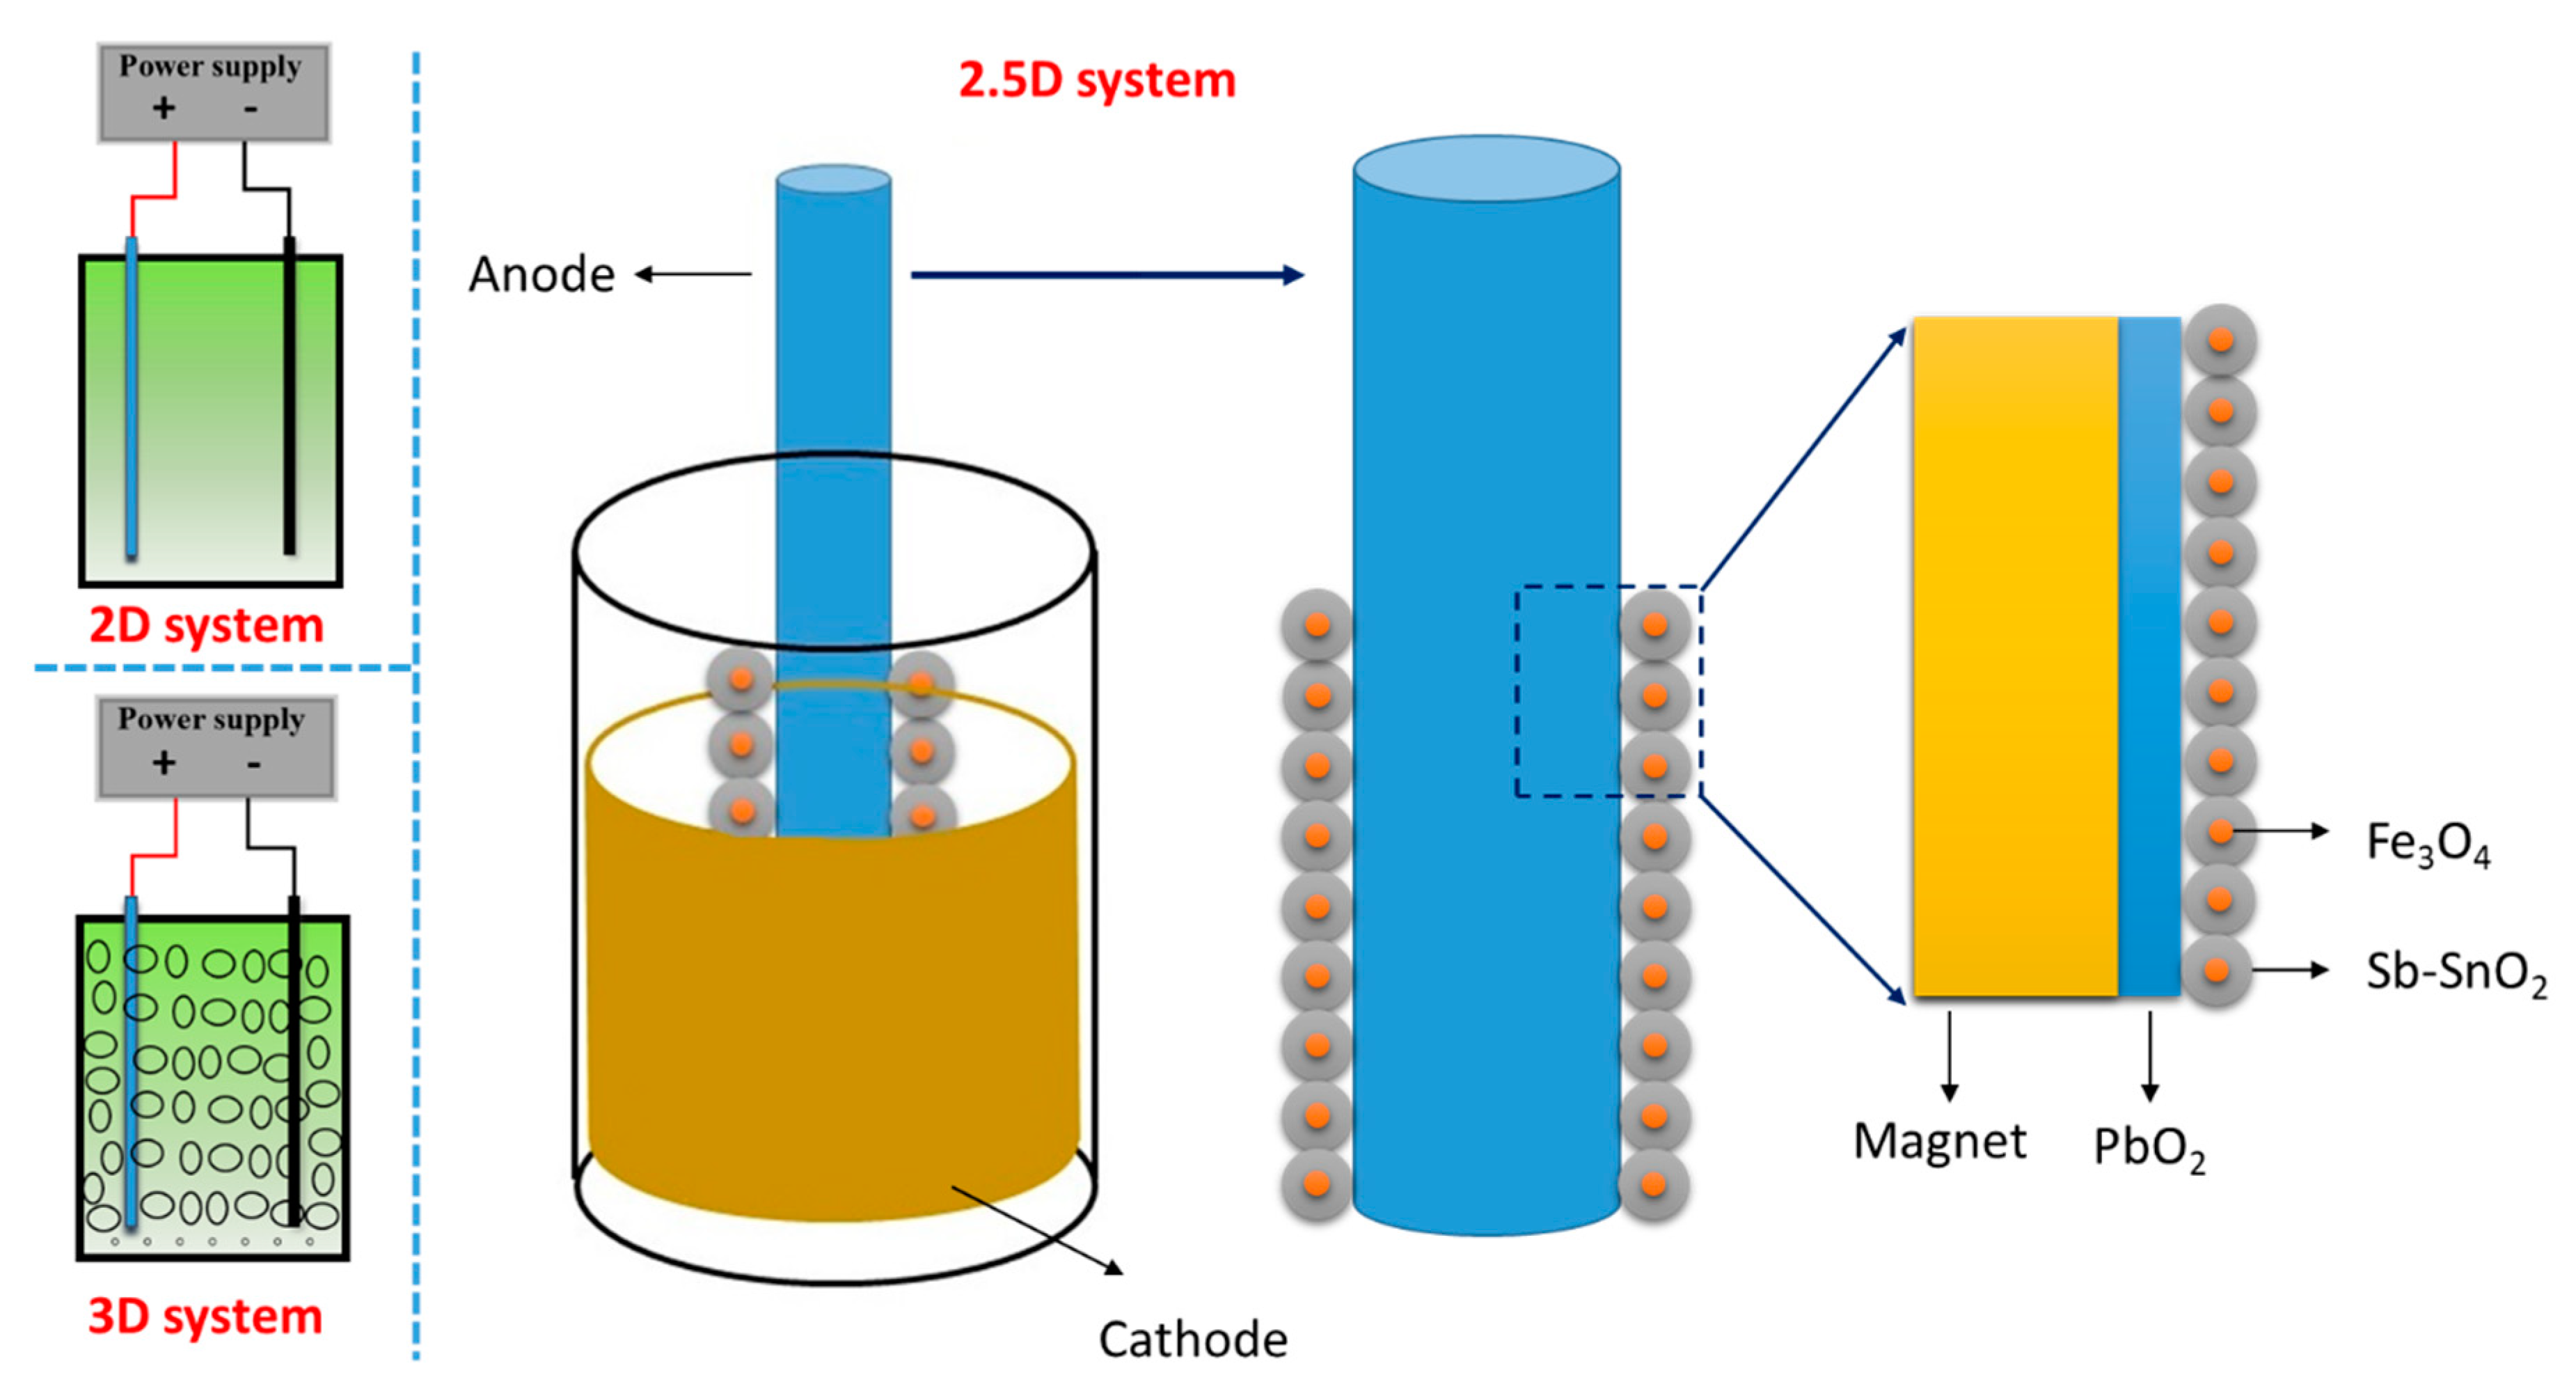
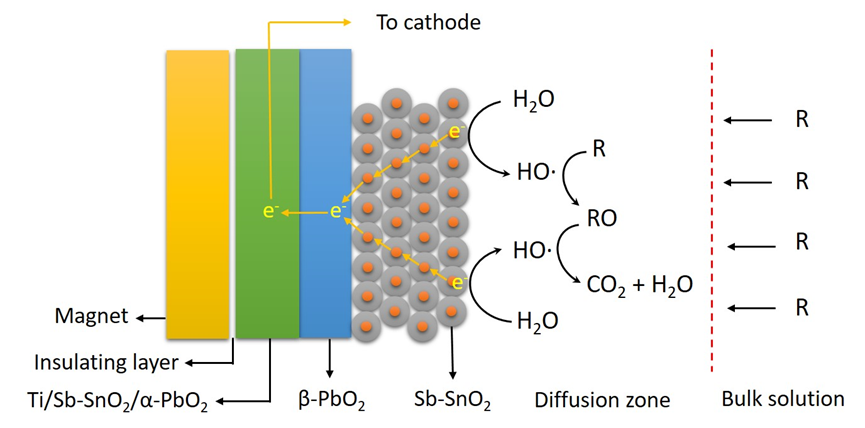
3.1. The Comparison of 2D and 2.5D Electrode

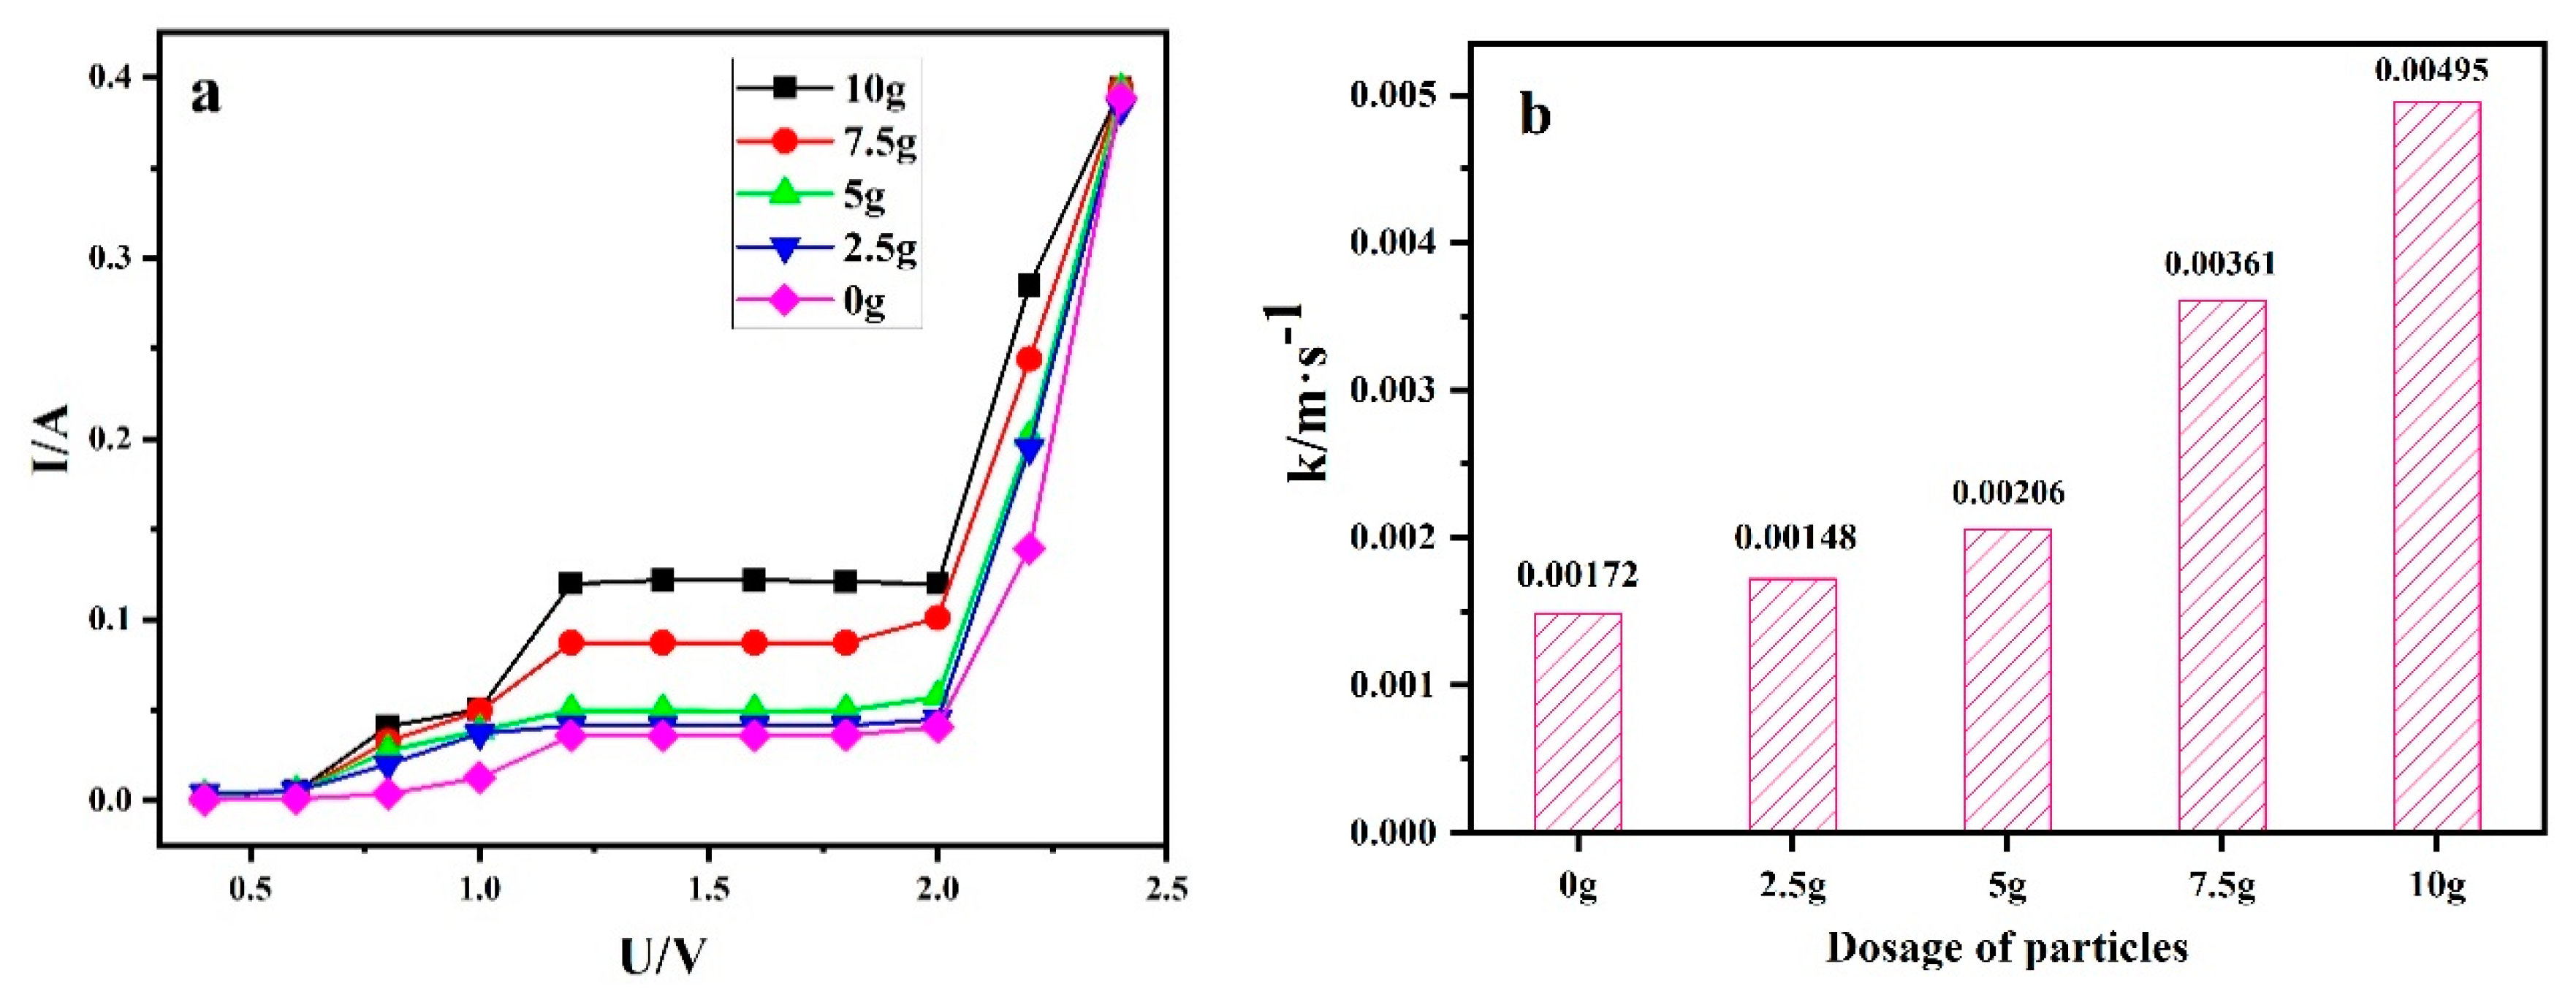
3.1.1. Mass Transfer Coefficient

Figure 1a shows the ampere-voltage curve of 2.5D electrode system under different magnetic particle dosage. As shown in Figure 1a, one can find that the ampere-voltage curve of the 2.5D electrode at different particle dosage has the current plateau. When the particle dosage increased from 0 to 5 g, the plateau current value increased slowly. When the particle dosage increased to 7.5 g and 10 g, the plateau current value was significantly higher than the data when the particle dosage was 0 g. The mass transfer coefficient can be calculated by combining the current platform value with equation 1, as shown in Figure 1b. The corresponding mass transfer coefficients were 0.00148, 0.00172, 0.00206, 0.00361, and 0.00495 m·s−1 when the particle dosage was 0 g, 2.5 g, 5 g, 7.5 g, and 10 g. The data confirmed that the addition of particle dosage could increase the electrochemical system mass transfer coefficient.

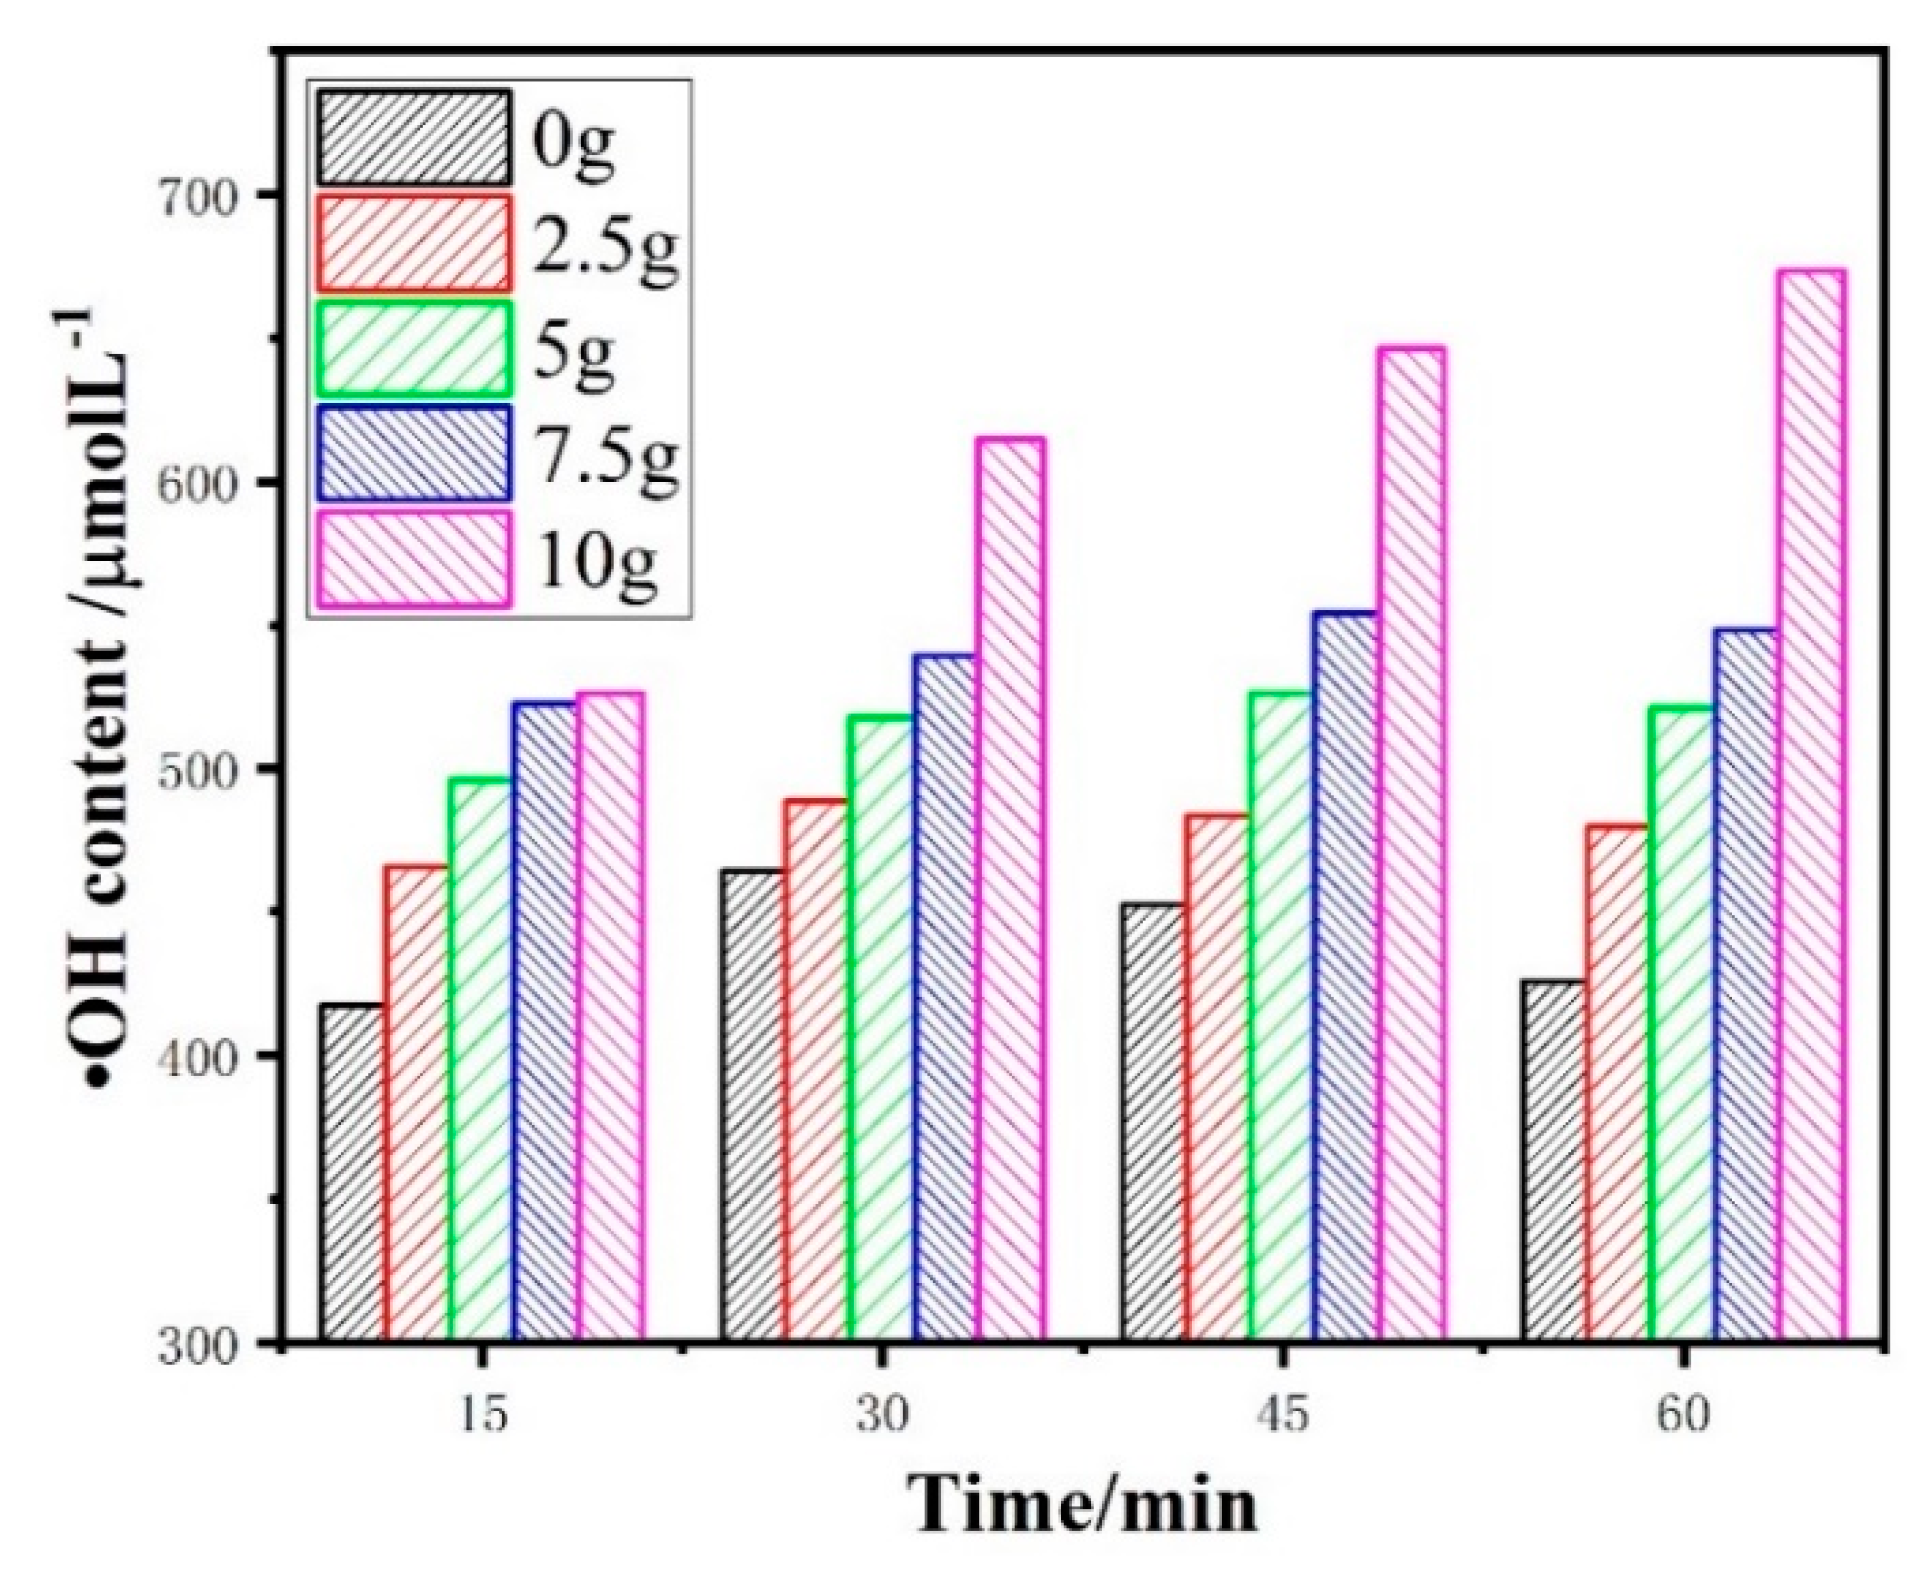
3.1.2. Hydroxyl Radicals

Hydroxyl radicals are generated from the oxidation of water, as shown in Equation (9). It is the core of electrocatalytic reaction. Hydroxyl radicals were measured by an indirect method with DMSO as the capture agent. HPLC was used to qualitatively determine the •OH content of 2.5D electrodes with different magnetic particle dosage. The variation of •OH content with electrolysis time is shown in Figure 2. The •OH content grew up improperly with the increase of Sb–SnO2 magnetic particle dosage and the extension of electrolysis time as shown in Figure 2. It meant that the •OH yield of the 2.5D electrode system was more than that of the traditional 2D electrode system. When the magnetic particle was 10 g, the •OH yield of the 2.5D electrode system was the highest. At 60min, the •OH yield of 2.5D electrode system was 673.4 µmol·L−1, while that of 2 D electrode system was 425.8 µmol·L−1.
H2O → •OH + H+ + e

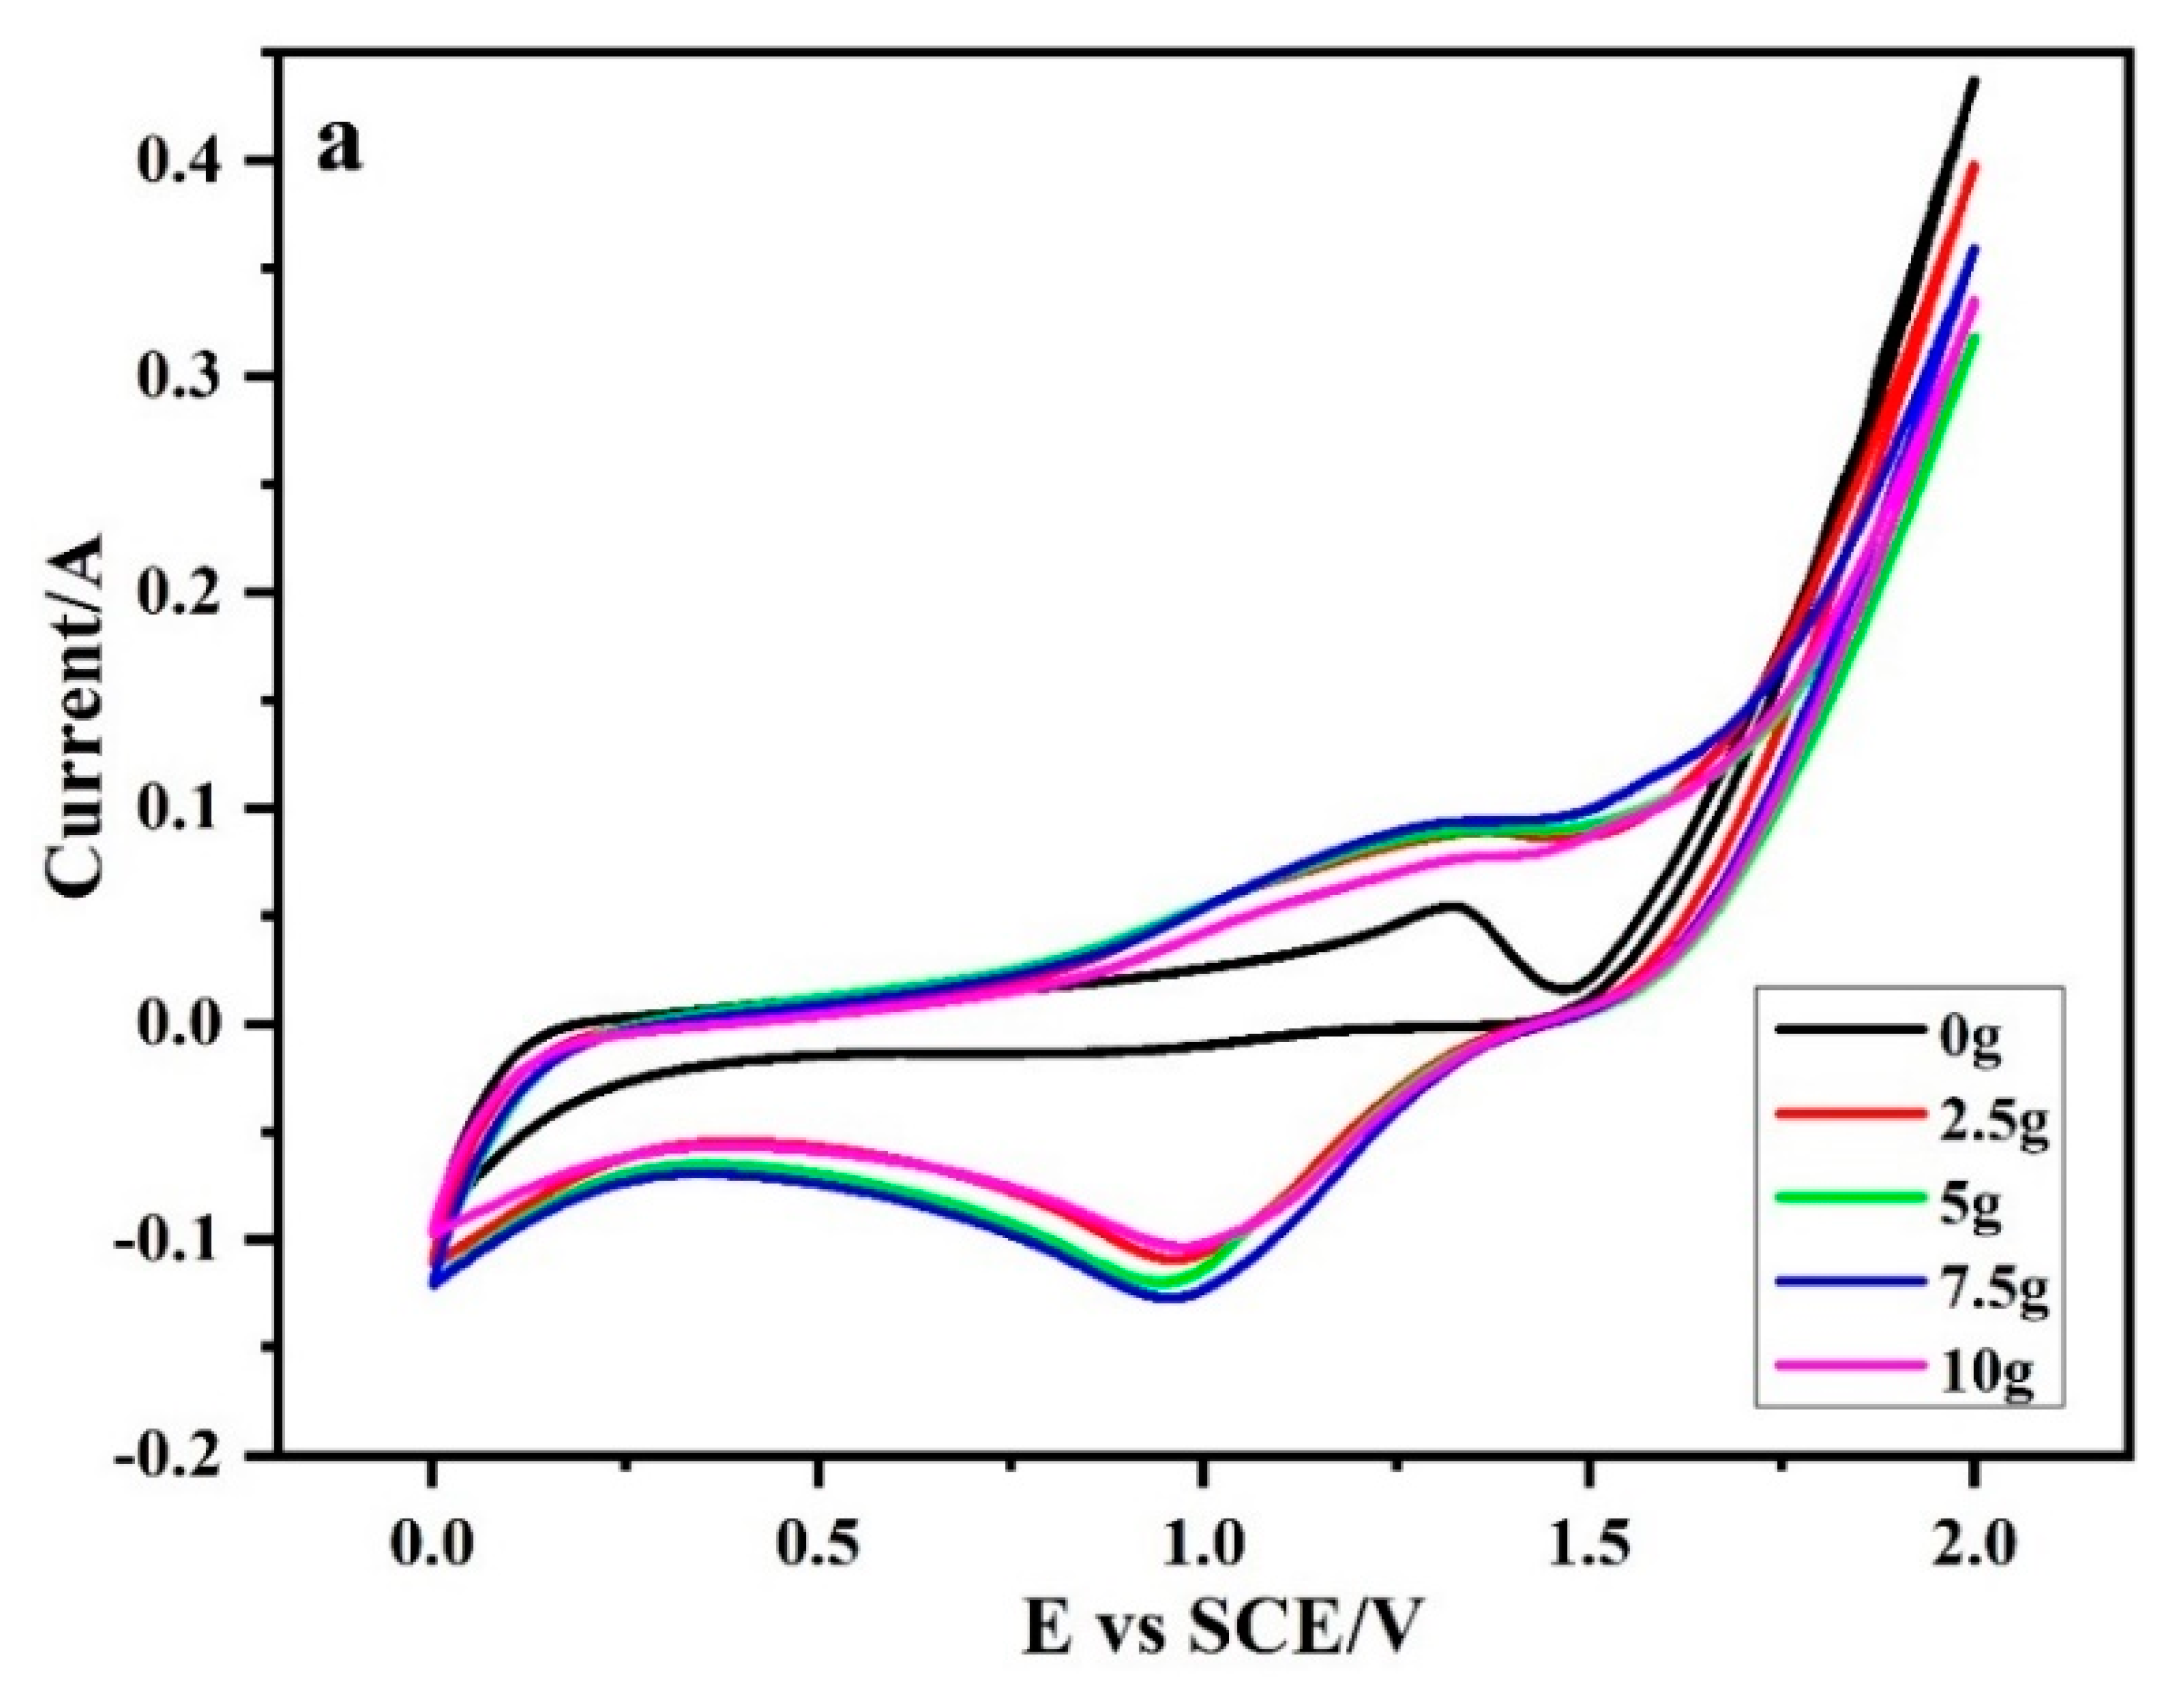
3.1.3. Electrochemically Active Site

Literature reports that the number of electroactive sites on the electrode surface is proportional to the area of its cyclic voltammetry curve. Figure 3 is the cyclic voltammetry curve of a 2.5D electrode system under different Sb–SnO2 magnetic particle dosage. It can be seen from Figure 3 that the introduction of magnetic particles significantly increased the cyclic voltammogram area of the electrode system. This indicates that the number of electrode surface active sites in 2.5D electrode system was larger than that in the traditional 2D electrode system.
Comprehensive appeal results show that the 2.5D electrode system is superior to the traditional 2D electrode system in terms of mass transfer coefficient, hydroxyl radical yield, and surface-active sites. The reason for that phenomenon is that Sb particles are excellent electroactive particles, whose introduction can greatly expand the surface area of lead dioxide electrode. Considering that the electrode surface cannot adsorb more particles magnetically, 10 g was chosen as the number of magnetic particles.

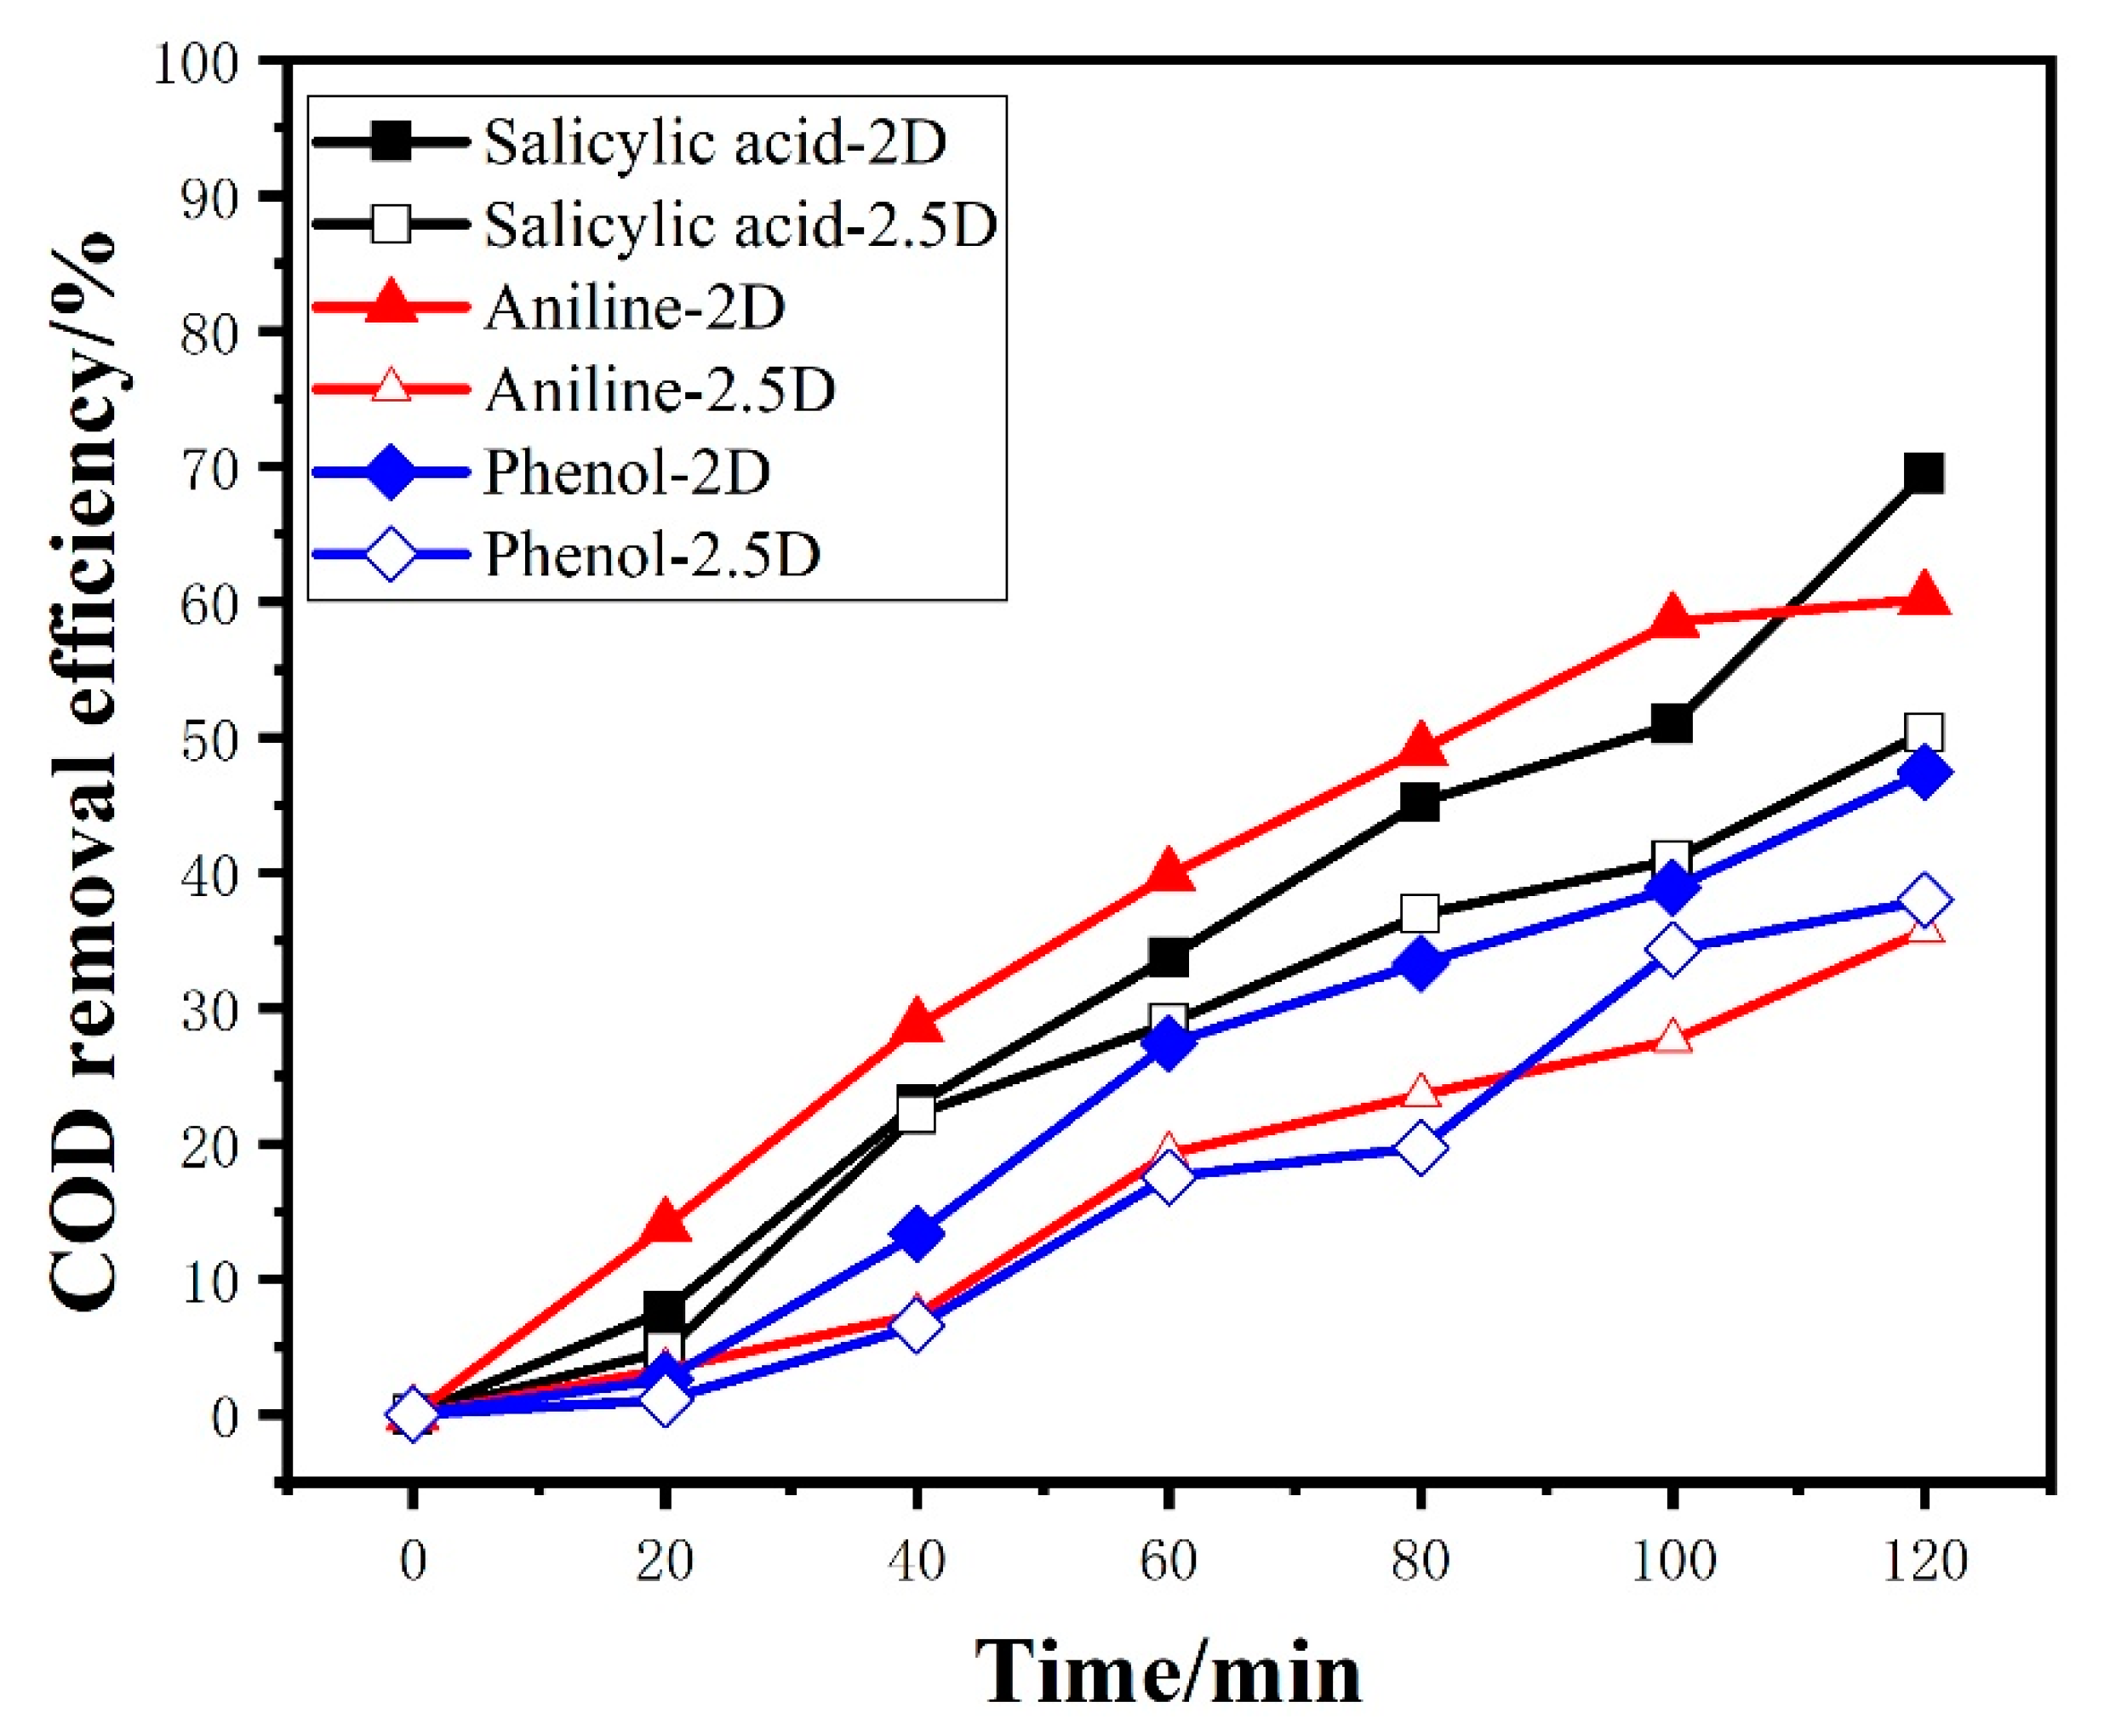
3.1.4. Electrocatalytic Capacity Comparison

An electrocatalytic degradation experiment was carried out with ARG as the target. The results are shown in Figure 4 and Table 1. As shown in Figure 4a, the removal efficiency (including ηARG, ηCOD, and ηTOC) of the 2.5D electrode system is higher than that of the 2D electrode system. Meanwhile, the 2.5D electrode system has a higher CE, almost twice as much as the 2D electrode, with the current efficiency of 12.21% compared with 7.1%. The ECCOD decreases from 1.71 kWh/gCOD to 0.961 kWh/gCOD, as shown in Table 1. From the above results, one can find that the 2.5D electrode system has better performance in the electrocatalytic process than 2D electrode system. It may be because the 2.5D electrode system has a higher mass transfer coefficient, greater hydroxyl radical production, and more surface-active sites than the 2D electrode system.
According to GB/T 15441-1995, the toxicity of wastewater samples before and after degradation by the 2D and 2.5D electrode system were tested, as shown in Figure 4b, indicating that the relative luminosity of samples treated by 2.5D electrode system is higher than that of the raw water. Nevertheless, the relative luminosity of samples treated by the 2D electrode was significantly lower than that of the raw water. It means that the 2.5D electrode system reduced the biotoxicity of the raw water and greatly increased compared to the 2D electrode system. One of the reasons for this phenomenon is that the electrocatalytic oxidation ability of the 2.5D electrode system is stronger than that of the 2D electrode system. ARG molecules can be decomposed by the 2.5D electrode system to a higher degree and more non-toxic or low-toxic small molecular substances. Another reason is the concentration of lead ions released during electrolysis. The lead dioxide of the 2D electrode system is exposed to the solution. In this case, the lead ion will leak into the solution, increasing the toxicity of the wastewater. Inductively Coupled Plasma (ICP) test results showed that the concentration of a lead ion in the electrolyzed water of 2D electrode system was 0.25 mg/L. For the 2.5D electrode system, the Sb−SnO2 magnetic particles adhere to the lead dioxide electrode surface and can inhibit the leakage of lead ion during the electrolysis. The concentration of lead ion in the electrolyzed water of 2.5D electrode system was 0.10 mg/L, less than that of the 2D electrode system.
To further verify the superiority of the 2.5D electrode system in electrocatalytic capability, three other typical organic compounds (including Salicylic acid, Phenol, and Aniline) were used as degradation targets for electrocatalytic degradation experiments. The results are shown in Figure 5 and Table 1. The ηCOD-2 h and ηTOC-2 h of aniline were 60.18% and 56.01% by using the 2.5D electrode system, which were higher than 35.71% and 28.92% of the 2D electrode system. The CE of aniline for the 2.5D electrode system was 12.06%, higher than 10.05% for 2D electrode system. Meanwhile, the ECCOD decreased from 0.23 kWh/gCOD to 0.19 kWh/gCOD. Similar results could be obtained when the other two organics were degraded. All the above results show that the 2.5D electrode system has advantages in electrocatalytic capability over the 2D electrode system.

3.2. Degradation of ARG by Using the 2.5D Electrode System

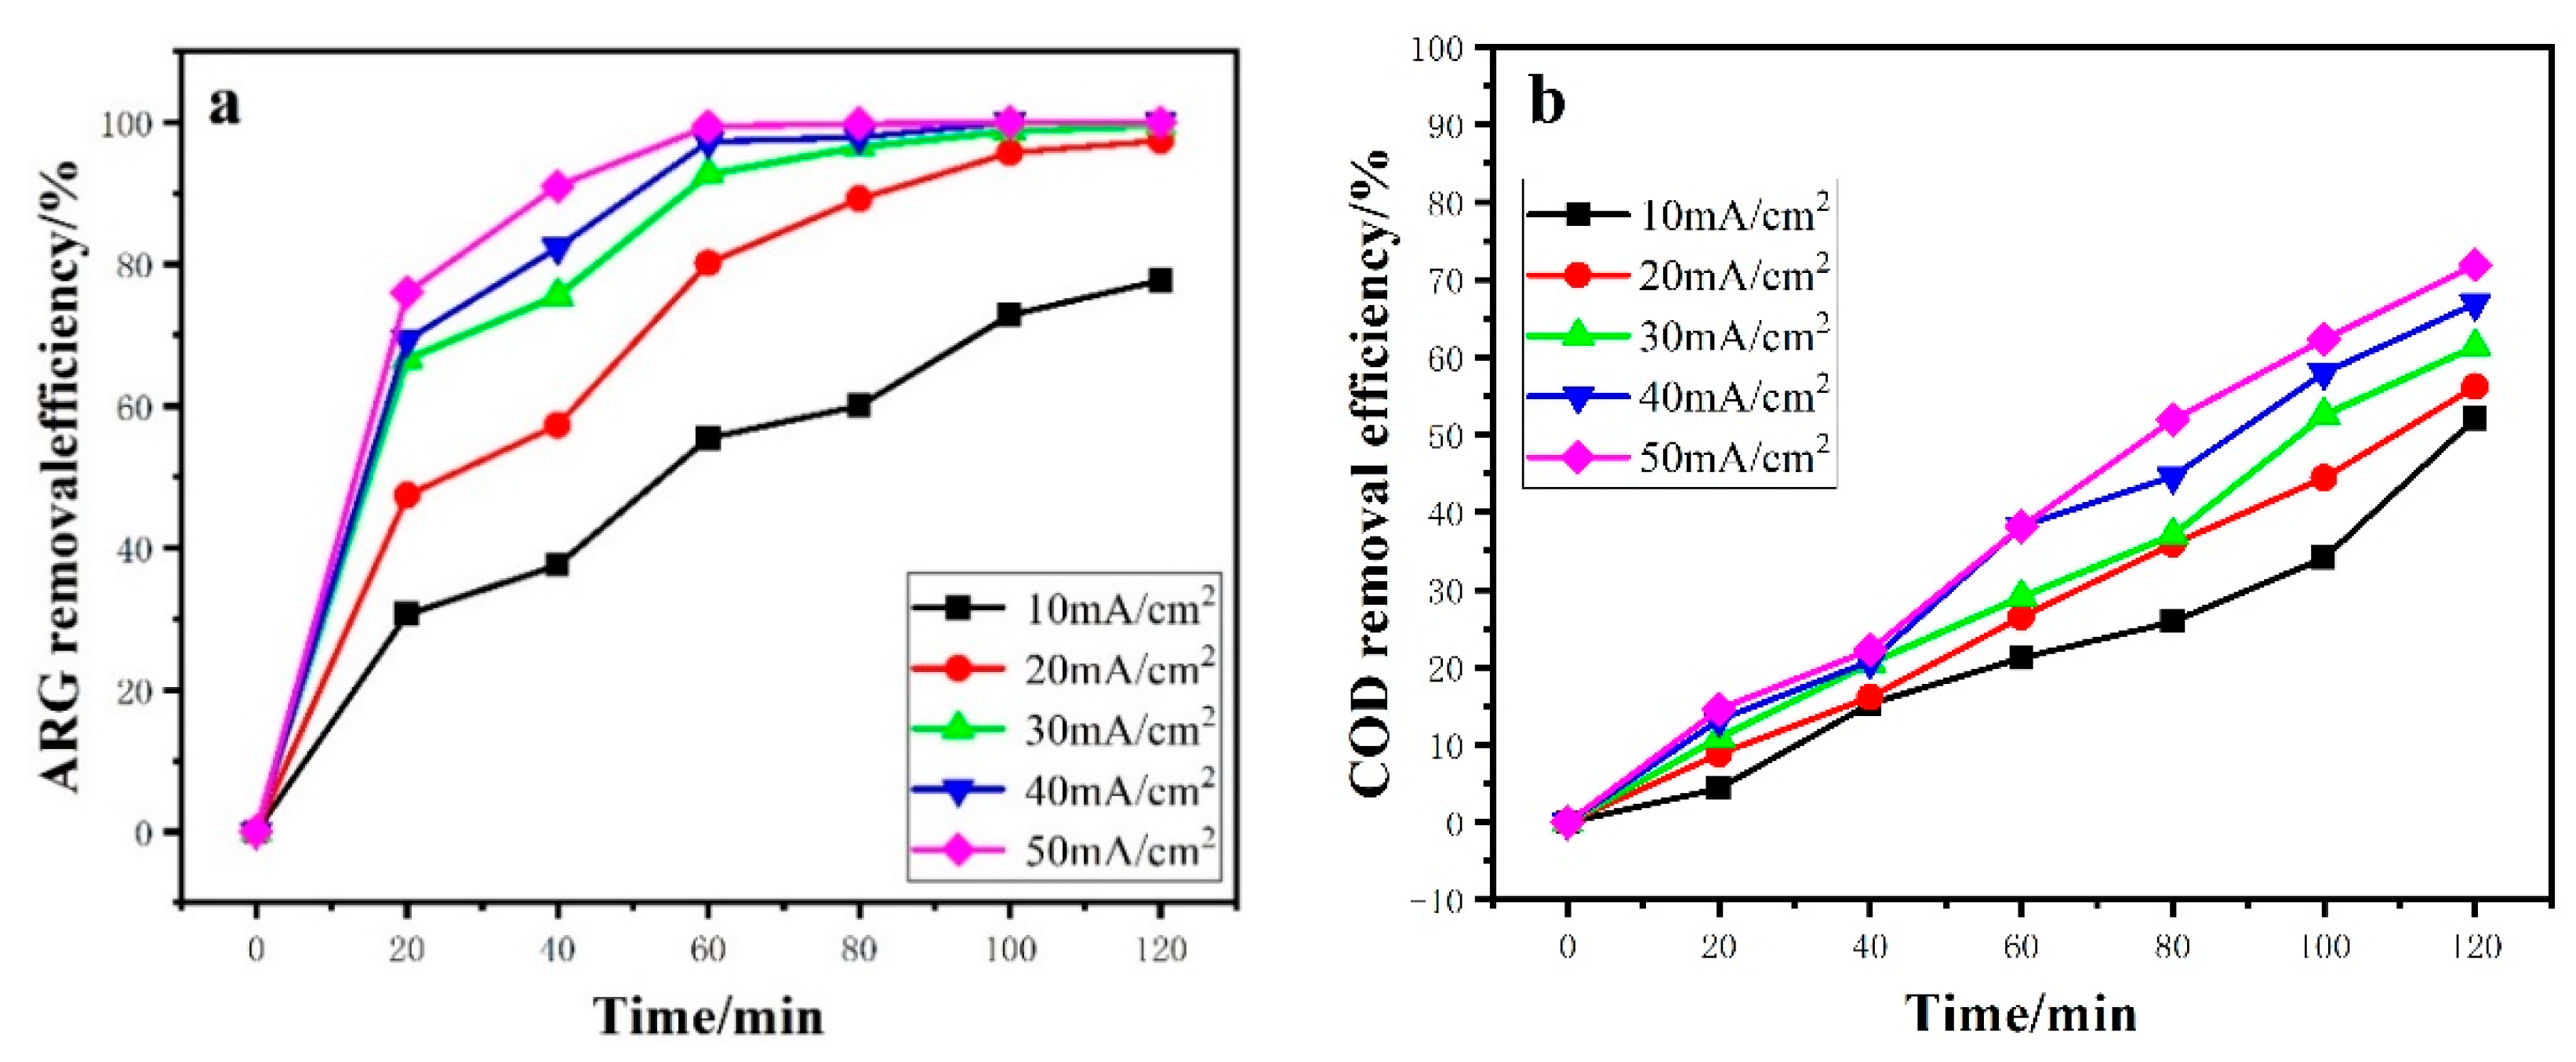
3.2.1. Effect of Current Density

Current density is an important parameter in controlling the reaction rate and has a significant effect on the electrochemical oxidation process. The current density was changed from 10 to 50 mA/cm2 in the process of degrading the ARG. As shown in Figure 6a,b, current density had a positive effect on the degradation of ARG with the increasing of current density. The ηARG increased from 77.69% to 100% after 120 min of electrolysis. When the current density reached 40 mA/cm2, the complete discoloration of ARG can be achieved after 60 min. The ηCOD increased from 52.6% to 65.89% with the raising of current density from 10 to 50 mA/cm2, but not completely removed. It may be because, of the process of electrochemical oxidation where an azo bond oxidation easily occurred, the intermediate products and other organics continued to be oxidized so that the rate of color removal was higher than the COD reduction. Yao et al. [38] reported that current density was proportional to electrochemical oxidation and could increase •OH production. Therefore, in the 2.5D electrode system, the increasing current density is also beneficial to organic matter removal.
From Table 2, it can be seen that with the increase of current density, ηTOC increased from 18.64% to 52.51%. However, ECCOD and ECTOC both increased, and CE and MCE gradually decreased. Li et al. [19] considered that with the increase of current density, the reaction of oxygen production increased, which would compete with the degradation of organics, leading to the decrease of current efficiency and the increase of energy consumption.

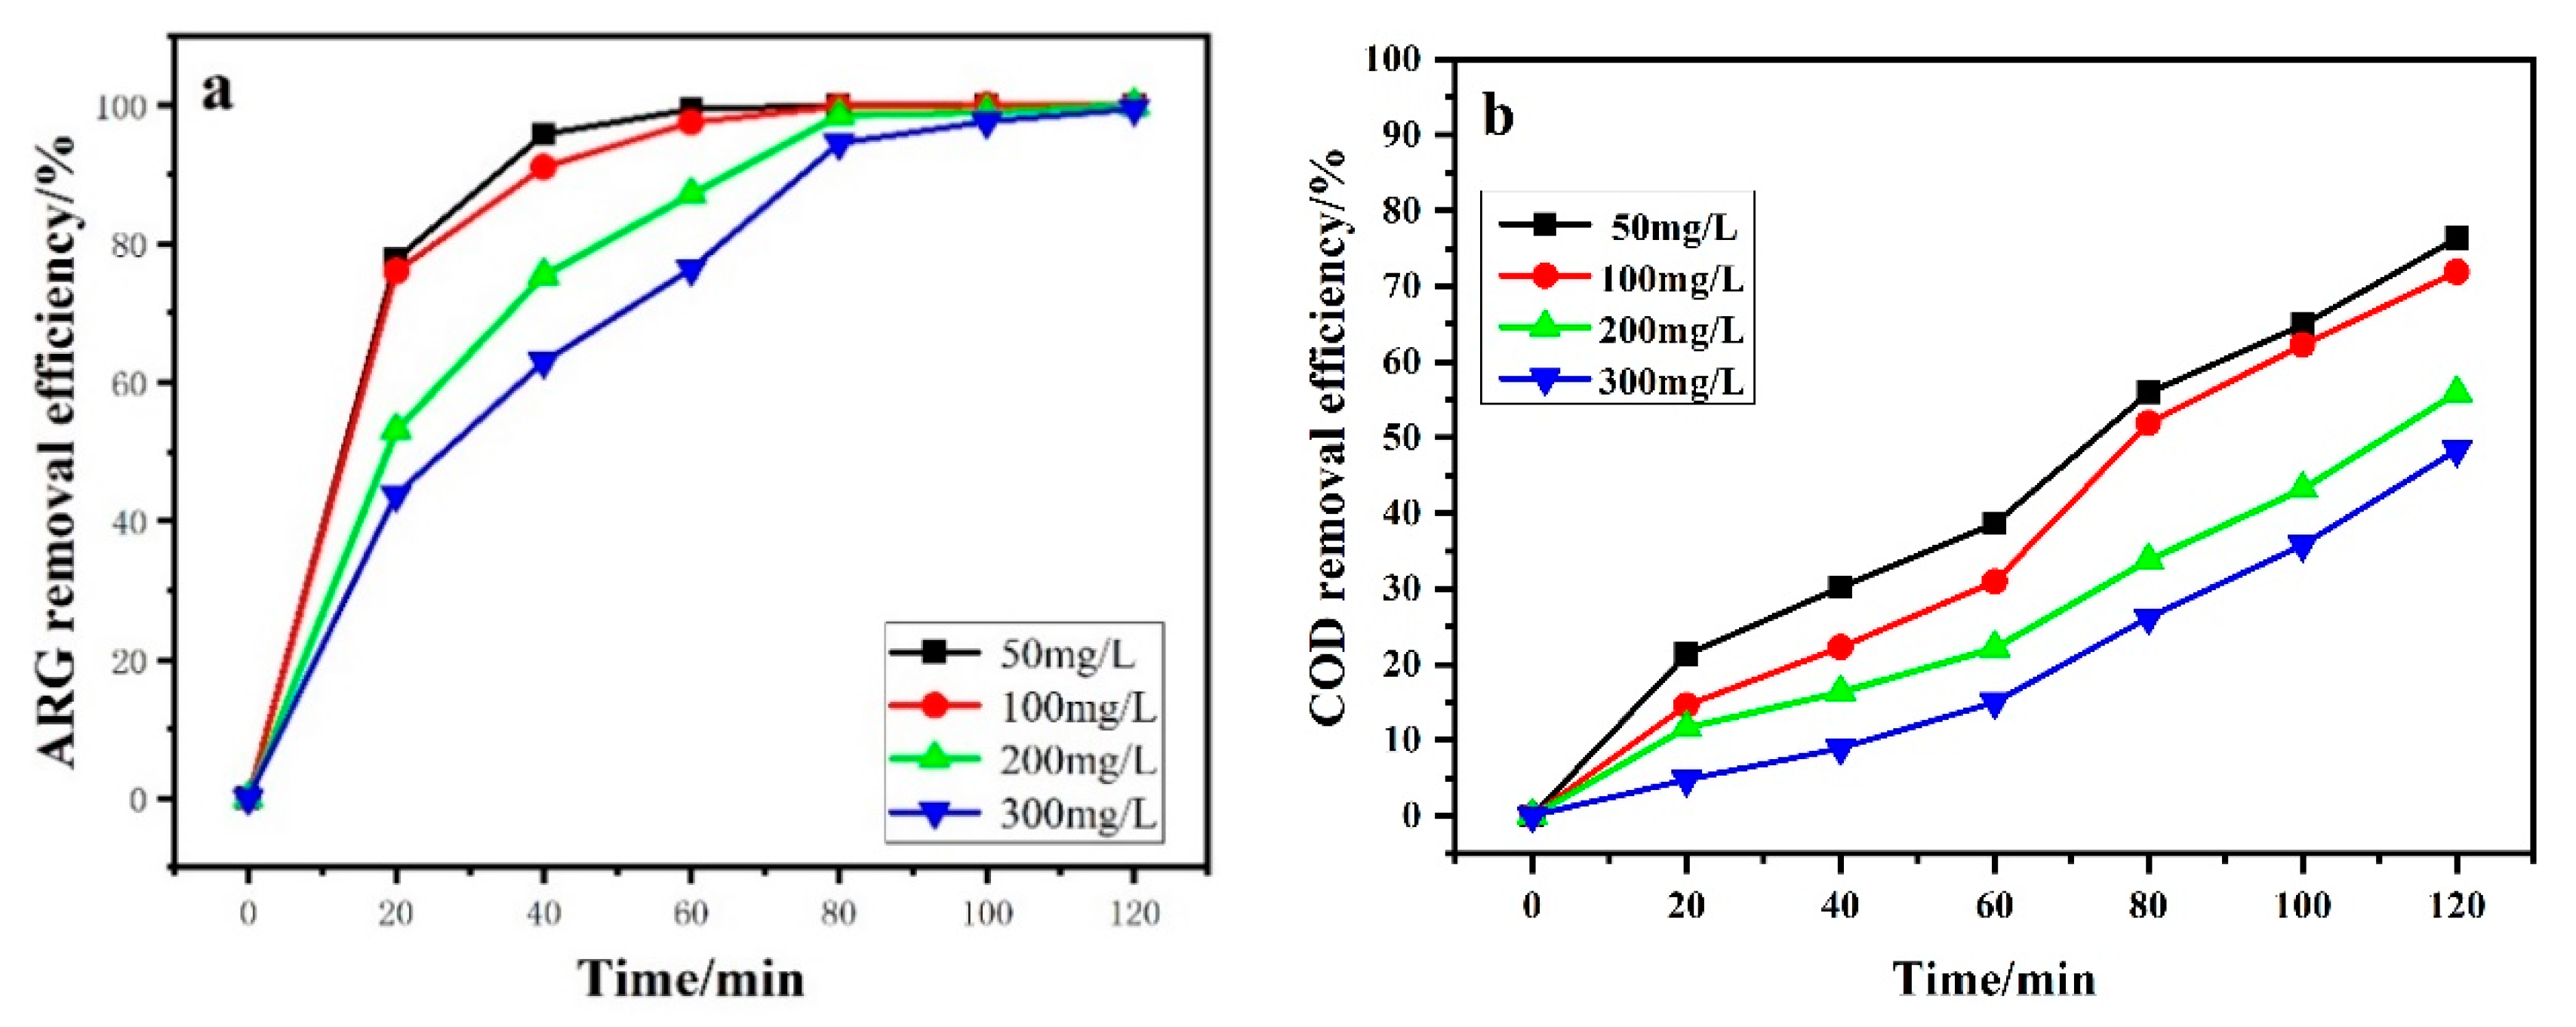
3.2.2. Effect of Initial Organic Concentration

Figure 7 shows the effect of initial dye concentration on ARG degradation. As shown in Figure 7a, complete color removal could be achieved when the ARG concentration increased from 50 ppm to 300 ppm. However, it would take more time to achieve the complete decolorization for higher ARG concentration solution. The ηCOD after 120 min electrolysis was 76.17%, 71.96%, 56.05%, and 48.18% when the initial ARG concentration was 50, 100, 200, and 300 mg·L−1, respectively. Table 2 also shows that ECCOD and ECTOC significantly reduced with increasing initial dye concentration, while CE and MCE significantly increased with the increasing initial dye concentration.
The electrocatalytic oxidation process is controlled by mass transfer. At low initial ARG concentrations, the electrochemical reaction is faster than the diffusion process. The dye molecule was expected to be degraded completely at the electrode–solution interface. When the initial ARG concentrations increased, the amount of ARG molecule achieved the anode surface was larger than that in the low concentration solution. Thus, more ARG molecules reacted with the •OH on the anode surface in the high concentration solution [2]. The amount of •OH generated on the surface of the PbO2 anode at a given current density fixed. Active free radicals generated on the electrode surface were insufficient for pollutant degradation with increasing ARG concentration. Then the ηCOD decreased with the increase of the initial ARG concentrations, while ECCOD and ECTOC decreased with the increase of the initial ARG concentrations.

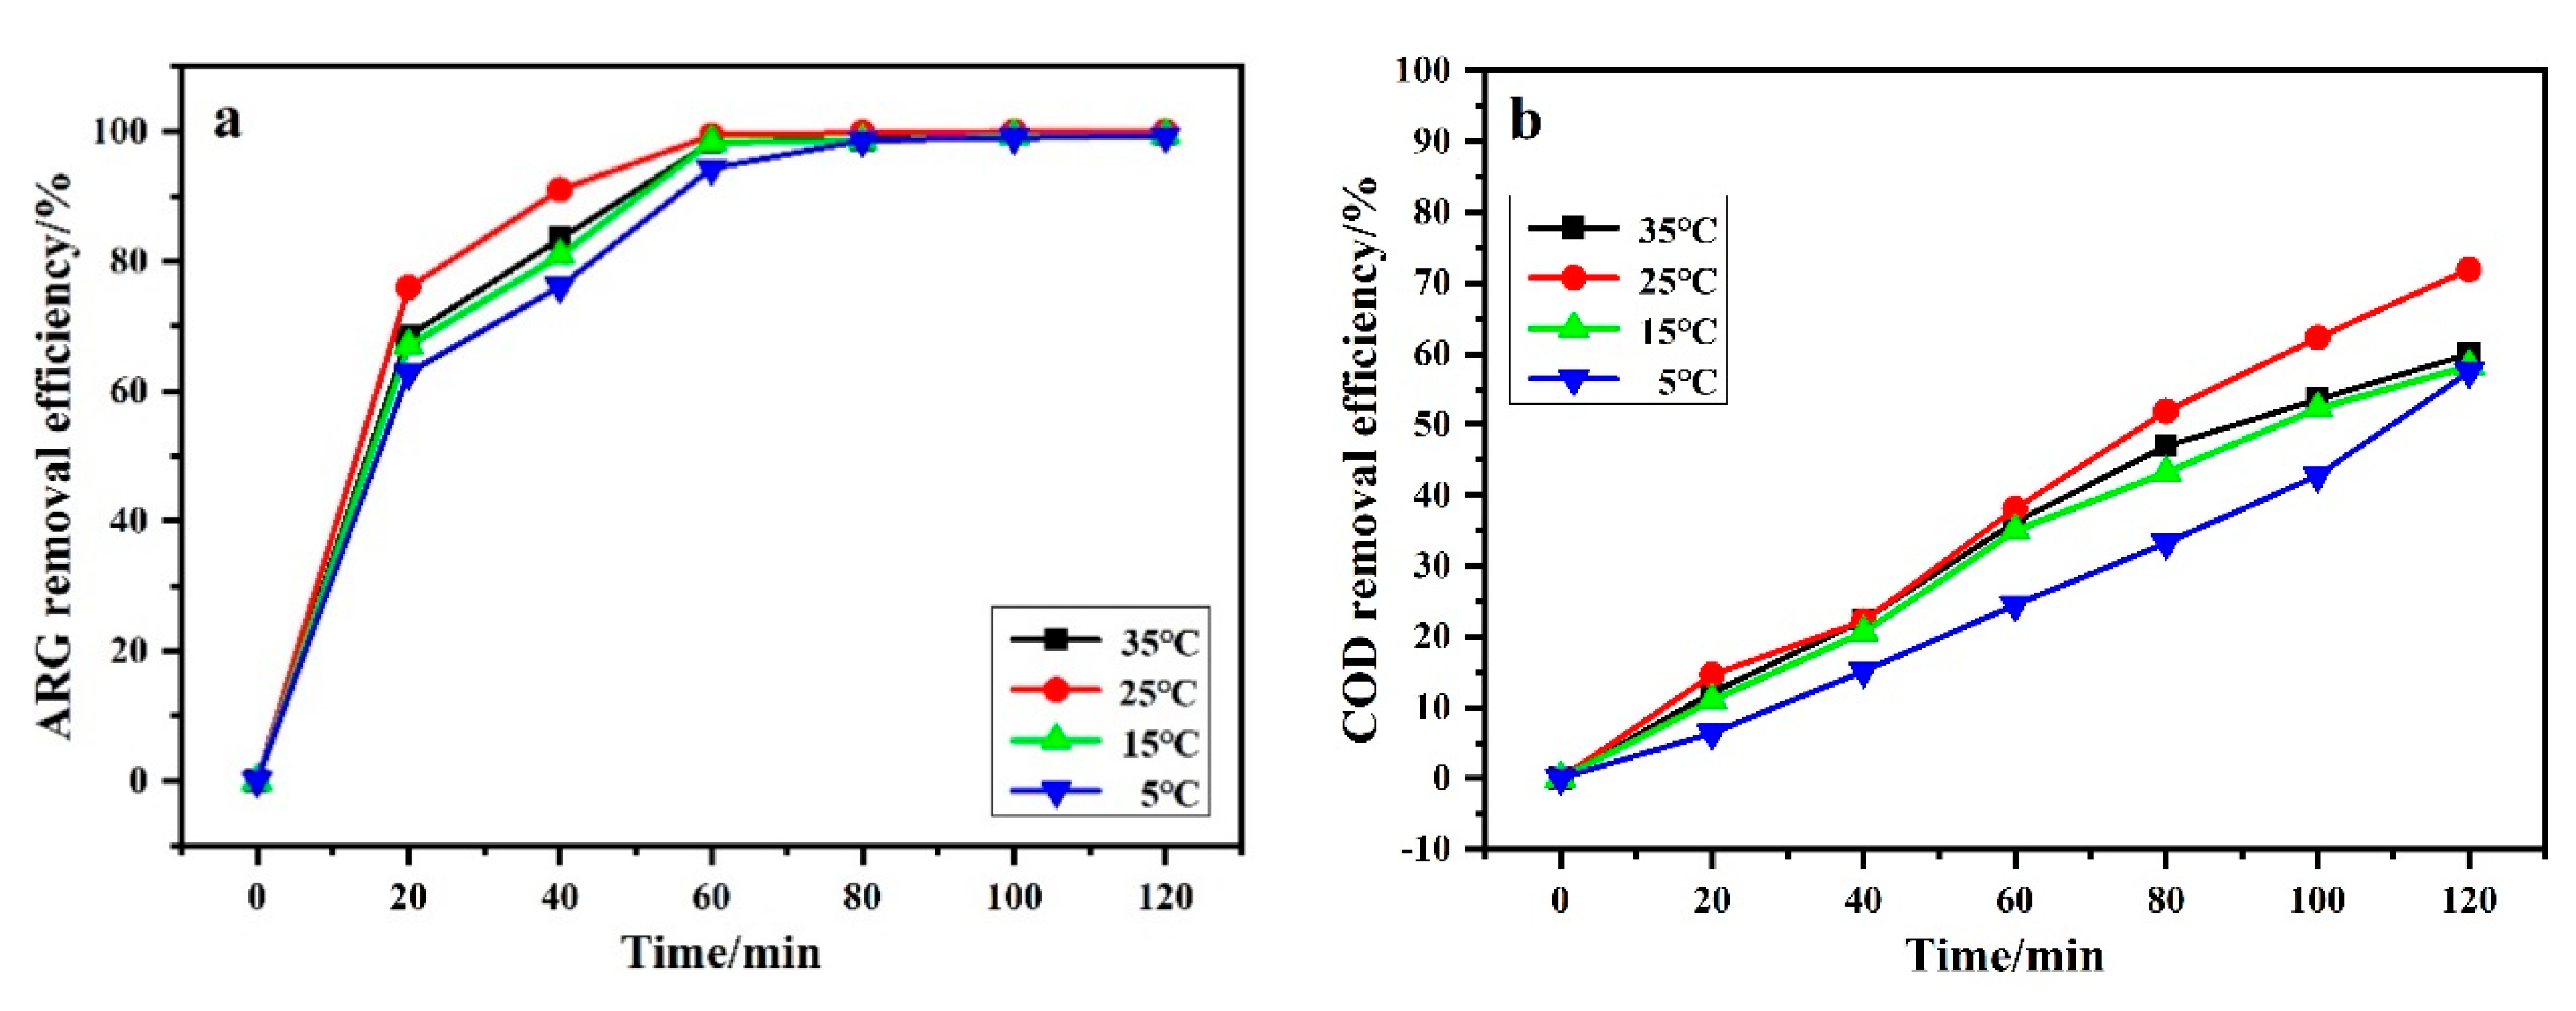
3.2.3. Effect of Temperature

Figure 8 shows the effect of temperature on ARG removal efficiency and COD removal efficiency. One can find that when the temperature was lower than 25 °C, ηARG and ηCOD increased as the temperature rose. However, ηARG and ηCOD declined when the temperature rose to 35 °C. As shown in Table 2, ηTOC follows the same rules. Generally speaking, when the temperature is higher, the chemical reaction rate increases, thereby increasing the utilization of •OH. When the temperature does not exceed 25 °C, the experimental results prove this. However, when the temperature exceeds 25 °C, all chemical reactions in the electrolytic cell are accelerated, including various side reactions. The oxygen evolution side reaction reduced the utilization rate of hydroxyl radical and current efficiency, and finally reduced the overall reaction effect.

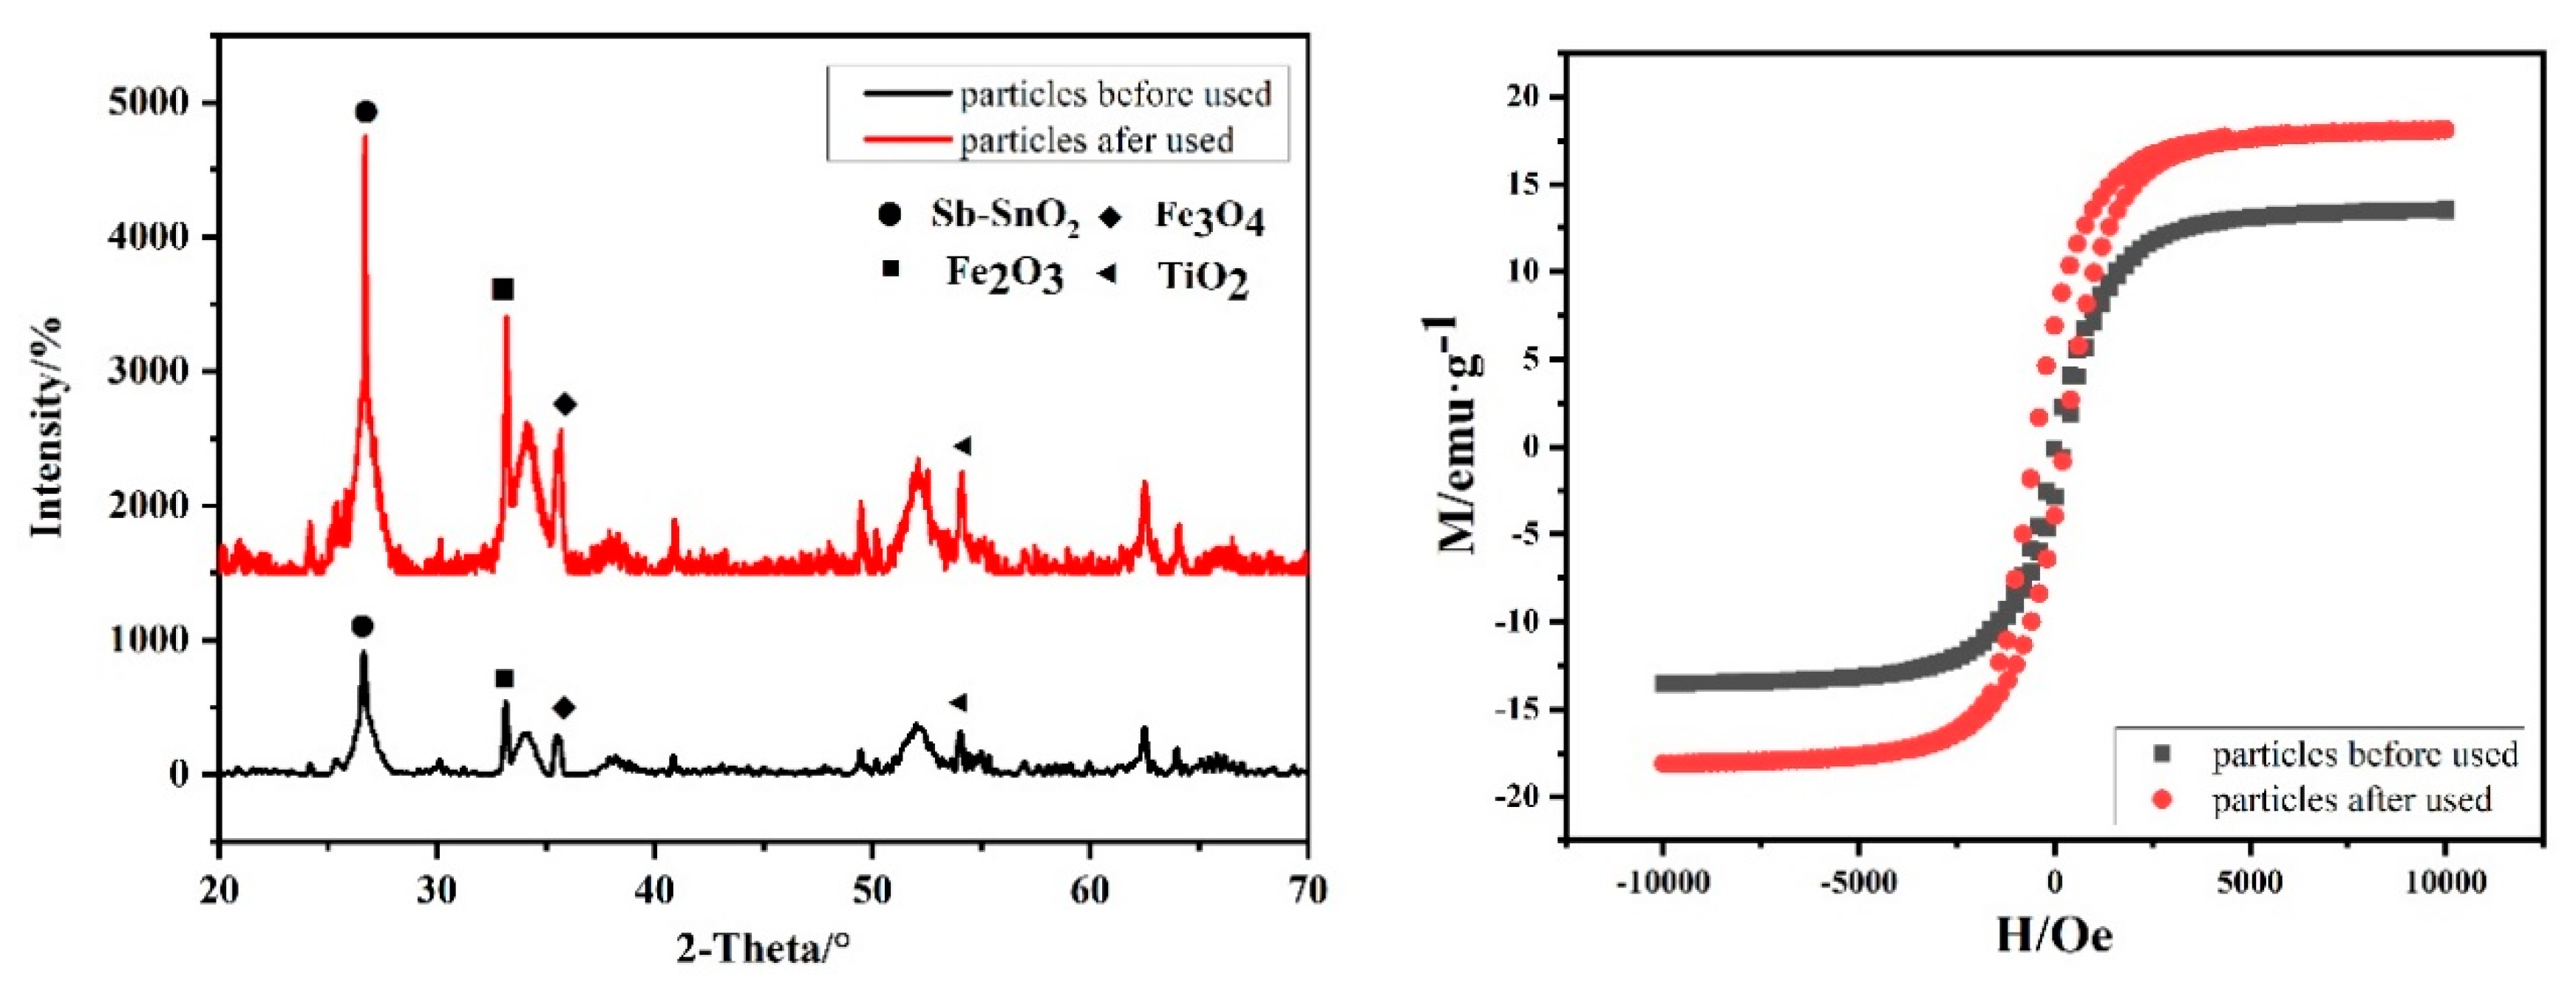
3.3. The Stability of Fe3O4/Sb–SnO2

The XRD patterns, magnetization curves, and surface element content of the magnetic particles before and after 50 h-electrolysis are shown in Figure 9 and Table 3. As shown in Figure 9a, there were the diffraction peaks of Fe3O4 (35.51°), Fe2O3 (33.1°), TiO2 (62.8°), Sb–SnO2 (26.6° and 51.8°), which were consistent with previous researches. After the electrolysis for 50 h, there was no change in particle diffraction peak. It can be seen from Table 3 that, after electrolysis, the element content on the surface of particles changed slightly. Sn and Sb decreased, while Fe and Ti increased. It indicates that the surface of magnetic particles dissolved to a certain extent after electrolysis for 50 h, resulting in increased exposure of ferric oxide. As shown in Figure 9b, the magnetic properties of the particles increased after use. These results indicate that Sb–SnO2 magnetic particles had better stability than Sb–SnO2 electrodes. More importantly, this 2.5D electrode system provides excellent convenience for particle replacement and is conducive to the continuity of the electrocatalytic process improvement.

4. Conclusions

In this study, the PbO2 electrode and the Sb–SnO2 electrode were combined by a magnet to construct a newly assembled 2.5D electrode. Due to the existence of Fe3O4/Sb–SnO2 particles, it proved that the 2.5D electrode could improve the mass transfer coefficient and increase •OH content, relative to the traditional 2D electrode. The degradation experiments showed that the 2.5D electrode could improve the performance of decolorization, degradation, and mineralization for ARG, reduce the energy consumption significantly, and increase the current efficiency, indicating the superiority of the 2.5D electrode in ARG removal from wastewater. Through the experiments of temperature, concentration, and current density, it was found that the removal efficiency of ARG is more favorable at higher current density, average temperature, and lower concentration. Toxicity experiments revealed that, compared with the 2D electrode, the 2.5D electrode could significantly reduce the toxicity of wastewater, indicating the potential for reducing the toxicity of the dyeing wastewater.

Author Contributions

Conceptualization, M.Y. and H.X.; Data curation, M.Y. and H.G.; Methodology, M.Y. and H.X.; Resources, Z.L.; Writing – original draft, M.Y., H.G. and H.X.; Writing – review & editing, N.M.S., Z.X., H.X., W.Y., Z.L. and Y.W.

Funding

This research was funded by Key R&D Programs in Shaanxi Province (Program No. 2018SF-372) and Water Science and Technology Projects Foundation of SWAG (Program No. 2018SWAG0203).

Conflicts of Interest

The authors declare no conflict of interest.

References

  1. Sarkka, H.; Bhatnagar, A.; Sillanpaa, M. Recent developments of electro-oxidation in water treatment—A review. J. Electroanal. Chem. 2015, 754, 46–56. [Google Scholar] [CrossRef]
  2. Hao, X.; Hua, G.; Jiangtao, F.; Dan, W.; Zhengwei, L.; Yu, W.; Wei, Y. Electrochemical Oxidation Combined with Adsorption: A Novel Route for Low Concentration Organic Wastewater Treatment. Int. J. Electrochem. Sci. 2019. [Google Scholar] [CrossRef]
  3. Chaplin, B.P. Critical review of electrochemical advanced oxidation processes for water treatment applications. Environ. Sci.-Proc. Impacts 2014, 16, 1182–1203. [Google Scholar] [CrossRef] [PubMed]
  4. Zhang, M.; Shi, Q.; Song, X.; Wang, H.; Bian, Z. Recent electrochemical methods in electrochemical degradation of halogenated organics: A review. Environ. Sci. Pollut. Res. Int. 2019, 26, 10457–10486. [Google Scholar] [CrossRef] [PubMed]
  5. Radjenovic, J.; Sedlak, D.L. Challenges and Opportunities for Electrochemical Processes as Next-Generation Technologies for the Treatment of Contaminated Water. Environ. Sci. Technol. 2015, 49, 11292–11302. [Google Scholar] [CrossRef]
  6. Jia, W.; Kai, Z.; Hao, X.; Wei, Y. Electrochemical oxidation of rhodamine B by PbO2/Sb-SnO2/TiO2 nanotube arrays electrode. Chin. J. Catal. 2019, 40, 917–927. [Google Scholar]
  7. Xiaoliang, L.; Hao, X.; Wei, Y. Fabrication and characterization of a PbO2-TiN composite electrode by co-deposition method. J. Electrochem. Soc. 2016, 163, 592–602. [Google Scholar] [CrossRef]
  8. Wu, W.; Huang, Z.-H.; Lim, T.-T. Recent development of mixed metal oxide anodes for electrochemical oxidation of organic pollutants in water. Appl. Catal. A Gen. 2014, 480, 58–78. [Google Scholar] [CrossRef]
  9. Yao, Y.; Ren, B.; Yang, Y.; Huang, C.; Li, M. Preparation and electrochemical treatment application of Ce-PbO2/ZrO2 composite electrode in the degradation of acridine orange by electrochemical advanced oxidation process. J. Hazard. Mater. 2019, 361, 141–151. [Google Scholar] [CrossRef]
  10. Liu, S.; Cui, T.; Xu, A.; Han, W.; Li, J.; Sun, X.; Shen, J.; Wang, L. Electrochemical treatment of flutriafol wastewater using a novel 3D macroporous PbO2 filter: Operating parameters, mechanism and toxicity assessment. J. Hazard. Mater. 2018, 358, 187–197. [Google Scholar] [CrossRef]
  11. Zhou, X.; Liu, S.; Yu, H.; Xu, A.; Li, J.; Sun, X.; Shen, J.; Han, W.; Wang, L. Electrochemical oxidation of pyrrole, pyrazole and tetrazole using a TiO2 nanotubes based SnO2-Sb/3D highly ordered macro-porous PbO2 electrode. J. Electroanal. Chem. 2018, 826, 181–190. [Google Scholar] [CrossRef]
  12. Duan, P.; Hu, X.; Ji, Z.; Yang, X.; Sun, Z. Enhanced oxidation potential of Ti/SnO2-Cu electrode for electrochemical degradation of low-concentration ceftazidime in aqueous solution: Performance and degradation pathway. Chemosphere 2018, 212, 594–603. [Google Scholar] [CrossRef] [PubMed]
  13. Zaviska, F.; Drogui, P.; Blais, J.F.; Mercier, G.; d’Auzay, S.D. Electrochemical Oxidation of Chlortetracycline Using Ti/IrO2 and Ti/PbO2 Anode Electrodes: Application of Experimental Design Methodology. J. Environ. Eng. 2013, 139, 810–821. [Google Scholar] [CrossRef]
  14. Kaur, R.; Kushwaha, J.P.; Singh, N. Amoxicillin electro-catalytic oxidation using Ti/RuO2 anode: Mechanism, oxidation products and degradation pathway. Electrochim. Acta 2019, 296, 856–866. [Google Scholar] [CrossRef]
  15. Alcocer, S.; Picos, A.; Uribe, A.R.; Perez, T.; Peralta-Hernandez, J.M. Comparative study for degradation of industrial dyes by electrochemical advanced oxidation processes with BDD anode in a laboratory stirred tank reactor. Chemosphere 2018, 205, 682–689. [Google Scholar] [CrossRef]
  16. Siedlecka, E.M.; Ofiarska, A.; Borzyszkowska, A.F.; Bialk-Bielinska, A.; Stepnowski, P.; Pieczynska, A. Cytostatic drug removal using electrochemical oxidation with BDD electrode: Degradation pathway and toxicity. Water Res. 2018, 144, 235–245. [Google Scholar] [CrossRef]
  17. He, Y.; Wang, X.; Huang, W.; Chen, R.; Zhang, W.; Li, H.; Lin, H. Hydrophobic networked PbO2 electrode for electrochemical oxidation of paracetamol drug and degradation mechanism kinetics. Chemosphere 2018, 193, 89–99. [Google Scholar] [CrossRef]
  18. Comninellis, C.; Vercesi, G.P. Characterization of DSA-type oxygen evolving electrodes Choice of a coating. J. Appl. Electrochem. 1991, 21, 335–345. [Google Scholar] [CrossRef]
  19. Xiaoliang, L.; Hao, X.; Wei, Y. Electrochemical oxidation of aniline by a novel Ti-TixHy-Sb-SnO2 electrode. Chin. J. Catal. 2016, 37, 1860–1870. [Google Scholar]
  20. Wachter, N.; Aquino, J.M.; Denadai, M.; Barreiro, J.C.; Silva, A.J.; Cass, Q.B.; Rocha-Filho, R.C.; Bocchi, N. Optimization of the electrochemical degradation process of the antibiotic ciprofloxacin using a double-sided beta-PbO2 anode in a flow reactor: Kinetics, identification of oxidation intermediates and toxicity evaluation. Environ. Sci. Pollut. Res. Int. 2019, 26, 4438–4449. [Google Scholar] [CrossRef]
  21. Pieczyńska, A.; Ossowski, T.; Bogdanowicz, R.; Siedlecka, E. Electrochemical degradation of textile dyes in a flow reactor: Effect of operating conditions and dyes chemical structure. Int. J. Environ. Sci. Technol. 2018, 16, 929–942. [Google Scholar] [CrossRef]
  22. Pacheco-Álvarez, M.O.A.; Picos, A.; Pérez-Segura, T.; Peralta-Hernández, J.M. Proposal for highly efficient electrochemical discoloration and degradation of azo dyes with parallel arrangement electrodes. J. Electroanal. Chem. 2019, 838, 195–203. [Google Scholar] [CrossRef]
  23. Sun, W.; Sun, Y.; Shah, K.J.; Chiang, P.C.; Zheng, H. Electrocatalytic oxidation of tetracycline by Bi-Sn-Sb/gamma-Al2O3 three-dimensional particle electrode. J. Hazard. Mater. 2019, 370, 24–32. [Google Scholar] [CrossRef] [PubMed]
  24. Mengelizadeh, N.; Pourzamani, H.; Saloot, M.K.; Hajizadeh, Y.; Parseh, I.; Parastar, S.; Niknam, N. Electrochemical Degradation of Reactive Black 5 Using Three-Dimensional Electrochemical System Based on Multiwalled Carbon Nanotubes. J. Environ. Eng. 2019, 145. [Google Scholar] [CrossRef]
  25. Alighardashi, A.; Aghta, R.S.; Ebrahimzadeh, H. Improvement of Carbamazepine Degradation by a Three-Dimensional Electrochemical (3-EC) Process. Int. J. Environ. Res. 2018, 12, 451–458. [Google Scholar] [CrossRef]
  26. Hao, X.; Wei, Y.; Honghui, Y. Surface Analysis of Ti/Sb-SnO2/PbO2 Electrode after Long Time Electrolysis. Rare Met. Mater. Eng. 2015, 44, 2637–2641. [Google Scholar] [CrossRef]
  27. Shao, D.; Yan, W.; Li, X.; Xu, H. Fe3O4/Sb–SnO2Granules Loaded on Ti/Sb–SnO2Electrode Shell by Magnetic Force: Good Recyclability and High Electro-oxidation Performance. ACS Sustain. Chem. Eng. 2015, 3, 1777–1785. [Google Scholar] [CrossRef]
  28. Shao, D.; Zhang, X.; Lyu, W.; Zhang, Y.; Tan, G.; Xu, H.; Yan, W. Magnetic Assembled Anode Combining PbO2 and Sb-SnO2 Organically as An Effective and Sustainable Electrocatalyst for Wastewater Treatment with Adjustable Attribution and Construction. ACS Appl. Mater. Interfaces 2018, 10, 44385–44395. [Google Scholar] [CrossRef]
  29. Yao, Y.; Li, M.; Yang, Y.; Cui, L.; Guo, L. Electrochemical degradation of insecticide hexazinone with Bi-doped PbO2 electrode: Influencing factors, intermediates and degradation mechanism. Chemosphere 2019, 216, 812–822. [Google Scholar] [CrossRef]
  30. Li, X.; Shao, D.; Xu, H.; Lv, W.; Yan, W. Fabrication of a stable Ti/TiOxHy/Sb−SnO2 anode for aniline degradation in different electrolytes. Chem. Eng. J. 2016, 285, 1–10. [Google Scholar] [CrossRef]
  31. Shao, D.; Yan, W.; Li, X.L.; Yang, H.H.; Xu, H. A Highly Stable Ti/TiHx/Sb-SnO2 Anode: Preparation, Characterization and Application. Ind. Eng. Chem. Res. 2014, 53, 3898–3907. [Google Scholar] [CrossRef]
  32. Hao, X.; Wuqi, G.; Jia, W.; Jiangtao, F.; Honghui, Y.; Wei, Y. Preparation and characterization of titanium-based PbO2 electrodes modified by ethylene glycol. Rsc Adv. 2016, 6, 7610–7617. [Google Scholar] [CrossRef]
  33. Xu, H.; Yuan, Q.S.; Shao, D.; Yang, H.H.; Liang, J.D.; Feng, J.T.; Yan, W. Fabrication and characterization of PbO2 electrode modified with [Fe(CN)(6)](3-) and its application on electrochemical degradation of alkali lignin. J. Hazard. Mater. 2015, 286, 509–516. [Google Scholar] [CrossRef]
  34. Wilk, J.; Grosicki, S. Experimental study of electrochemical mass transfer in an annular duct with the electrolyte nanofluid. Int. J. Therm. Sci. 2018, 129, 280–289. [Google Scholar] [CrossRef]
  35. Wilk, J. A review of measurements of the mass transfer in minichannels using the limiting current technique. Exp. Therm. Fluid Sci. 2014, 57, 242–249. [Google Scholar] [CrossRef]
  36. Dalle, A.A.; Domergue, L.; Fourcade, F.; Assadi, A.A.; Djelal, H.; Lendormi, T.; Soutrel, I.; Taha, S.; Amrane, A. Efficiency of DMSO as hydroxyl radical probe in an Electrochemical Advanced Oxidation Process—Reactive oxygen species monitoring and impact of the current density. Electrochim. Acta 2017, 246, 1–8. [Google Scholar] [CrossRef]
  37. Tai, C.; Peng, J.-F.; Liu, J.-F.; Jiang, G.-B.; Zou, H. Determination of hydroxyl radicals in advanced oxidation processes with dimethyl sulfoxide trapping and liquid chromatography. Anal. Chim. Acta 2004, 527, 73–80. [Google Scholar] [CrossRef]
  38. Yingwu, Y.; Ganggang, T.; Yang, Y.; Chunjiao, H.; Baicheng, L.; Lin, G. Electrochemical oxidation of acetamiprid using Yb-doped PbO2 electrodes: Electrode characterization, influencing factors and degradation pathways. Sep. Purif. Technol. 2019, 211, 456–466. [Google Scholar] [CrossRef]
Scheme 1. The structure of 2D, 2.5D, and 3D electrode system.
Catalysts 09 00875 sch001
Figure 1. (a) Ampere–voltage of different particle dosage (b) the corresponding mass transfer coefficient.
Catalysts 09 00875 g001
Figure 2. The •OH content under different Sb–SnO2 magnetic particle dosage.
Catalysts 09 00875 g002
Figure 3. The cyclic voltammetry curve of 2.5D electrode system under different Sb–SnO2 magnetic particle dosage.
Catalysts 09 00875 g003
Figure 4. The removal efficiency (a) and relative luminance before and after electrolysis (b) of Acid Red G (ARG) by 2.5D and 2D electrode (electrolysis condition: ARG 100 ppm, 10 mA/cm2, 0.1 mol/L Na2SO4, room temperature, and electrolysis time of 1 h).
Catalysts 09 00875 g004
Figure 5. The Chemical Oxygen Demand (COD) removal efficiency of three organic target by 2.5D and 2D electrode (electrolysis condition: concentration 100 ppm, 50 mA/cm2, 0.1 mol/L Na2SO4, room temperature).
Catalysts 09 00875 g005
Figure 6. Effect of current density on ARG removal efficiency (a) and COD removal efficiency (b). Other operating conditions: ARG concentration of 100 ppm and temperature of 25 °C.
Catalysts 09 00875 g006
Figure 7. Effect of dye concentration on ARG removal efficiency (a) and COD removal efficiency (b). Other operating conditions: Current density of 50 mA/cm2 and temperature of 25 °C.
Catalysts 09 00875 g007
Figure 8. Effect of temperature on ARG removal efficiency (a) and COD removal efficiency (b). Other operating conditions: Current density of 50 mA/cm2 and ARG concentration of 100 ppm.
Catalysts 09 00875 g008
Figure 9. XRD patterns (a) and magnetization curves (b) of magnetic particles before and after electrolysis.
Catalysts 09 00875 g009
Table 1. The parameters comparison of 2.5D and 2D electrode.
CE/%ECCOD/kWh/gCODηTOC/%
ARG a2D7.101.7115.6
2.5D12.20.96122.6
Salicylic acid2D5.040.4540.85
2.5D7.300.3254.68
Phenol2D6.970.3427.04
2.5D8.640.2752.77
Aniline2D10.050.2328.92
2.5D12.060.1956.01
a The applied current density was 10 mA/cm2 for ARG and 50 mA/cm2 for three other organisms. The electrolysis time was 1 h for ARG and 2 h for three other microorganisms.
Table 2. Effect of different factors on ARG degradation by using the 2.5D electrode system.
CE/%ECCOD/kWh/gCODηTOC/%MCE/%ECTOC/kWh/gTOC
Current density (mA/cm2)105.900.2218.643.281.43
203.480.4623.762.522.28
302.560.7127.051.903.46
402.450.8337.351.973.74
502.071.0652.511.624.94
Dye concentration (mg/L)500.892.4341.770.869.13
1002.071.0652.521.624.94
2003.080.735.222.553.09
3003.390.6617.701.455.60
Temperature (°C)55.761.7240.696.84.60
156.481.4646.077.924.03
258.291.0652.529.013.81
355.791.4562.9711.113.24
Table 3. The surface element content of magnetic particles before and after electrolysis.
SnSbFeTiCO
Before electrolysis23.573.037.2311.8910.2644.01
After 50 h electrolysis20.472.8611.2412.6710.3842.38

