1. Introduction
Oscillatory chemical reactions [
1,
2], which are very sensitive, are disturbed by various small interfering factors, making them useful as an advanced analytic technique for trace substances. These systems generally include the Belousov–Zhabotinsky(BZ) [
3,
4,
5], Bray–Liebhafsky(BL) [
6], and Briggs-Rauscher(BR) [
7] oscillation systems. In particular, BZ reactions have been extensively studied to elucidate their mechanisms and to model the wider range of excitable media.
In recent years, it was proposed that light affects the BZ oscillation reaction [
8,
9], and experiments that combined light and BZ oscillation reactions have proved the photosensitive properties of this reaction, making it a hot topic for the scientific community. Photochemical reactions [
10] are one of the most important reaction processes in the life cycle. For example, both photosynthesis [
11] and visual reactions are photochemical reactions. Therefore, the study of the effect of light interference on the BZ oscillation system can provide insight into many poorly understood phenomena in biological systems.
Many hypothetical mechanisms of the photosensitive BZ oscillation reaction [
12] have been proposed and discussed, gradually deepening the understanding of the reaction. Additionally, the BZ oscillating photochemical reaction catalyzed by Ru(bpy)
32+ [
13,
14] has drawn significant attention; this reaction is highly sensitive to disturbance by light and can transition from photoinhibition to photoexcitation, so the response to light can be used to explore the mechanism of this reaction. The perturbation of the BZ oscillation system, which is caused by light irradiation, changes how both light intensity and light source distribution affect the original amplitude and period; within a certain range, the light intensity increases, and the oscillation reaction gradually decreases and then terminates. It can be seen that the interference effect of the light during oscillation-limits oscillatory behavior. A photosensitive BZ oscillatory reaction mechanism is a slight modification of the typical Oregonator(FKN) mechanism [
15] that is described by the following three formulas:
Here, C
x is a catalyst (where x represents its state, oxi means oxidation, and red means reduction). According to the FKN mechanism, in the absence of light, BZ oscillations exhibit stable fluctuations through the above three reactions. Ru(bpy) (II) is used as a catalyst for sensitization, and the sensitometric properties of B-Z chemical oscillations are strongly related to the characteristics of pyridinium ruthenium (II)-3,4. Experimentally, it was found that the optical interference of the B-Z oscillation effect may be mainly due to the following reaction:
The Ru(bpy)
32+● produced by this reaction is strongly reducing, reacts with various substances throughout the process and gives rise to the light interference reaction. Ru(bpy)
32+● reacts with other substances as follows:
For processes a–f, although Ru(bpy)32+● reacts with substances such as BrO3−, HBrO2, BrMA, and Br2MA, the common feature of all the reactions is that Br− is present in the final product. It is observed that the position of Br− in the entire reaction cannot be ignored, and Br− hinders the oscillating reaction, which is the key factor that hinders the oscillating phenomenon after light perturbs the oscillating reaction.
Chemical oscillations can reflect the characteristics of non-linear phenomena and simulate biological behaviors. Based on a previous report, to expand the family of photochemical oscillatory systems, we study the H
2SO
4-NaBrO
3-Acetone-Glucose B-Z oscillation system catalyzed by [CuL](ClO
4)
2 [
16,
17] and predict that the system exhibits photosensitivity. Compared to some chemical oscillations (systems catalyzed by Mn
2+, Ce
4+), the oscillation reaction of [CuL](ClO
4)
2 is particularly relevant, because the macrocyclic complex has a structure similar to an enzyme, where ligand L is 5,7,7,12,14,14-hexemethyl-1,4,8,11-tetraazacyclo tetradeca_4,11-diene. Therefore, the study of [CuL](ClO
4)
2 participating in the redox reaction is particularly valuable for exploring the chemical changes in the process. In this experiment, a mixture of glucose and acetone was chosen. Glucose is an indispensable substance in biological processes. Thus, this chemical oscillation system is related to a biological system.
In the present work, we explored the photochemical properties of the above system. The system has an ultra-sensitive response to ultraviolet light, and the amplitude changes significantly but the frequency remained unaffected under ultraviolet light with a wavelength of 245 nm and light intensity of 450–1300 Lux. At a constant light intensity (1250 Lux), the concentrations of NaBrO3, glucose, acetone, and [CuL](ClO4)2 are favored. The photochemical phenomena of the system were studied by using platinum electrode and a bromide ion selective electrode as the working electrodes in the same oscillating solution.
Most importantly, we mathematically simulated of the behavior of the chemical oscillations based on the photosensitive reaction equation. We analyzed and simplified the chemical reaction mechanism, and established a model of chemical oscillation, and a series of chemical oscillation processes after mathematical processing. This set of equations provides the mathematical model of chemical oscillations. By selecting the appropriate mathematical software (i.e., Mathematics) to solve the equations, the solutions of the differential equations are expressed as images to reflect the oscillations [
18].
2. Results and Discussion
2.1. Optimization of the Reactant Concentration
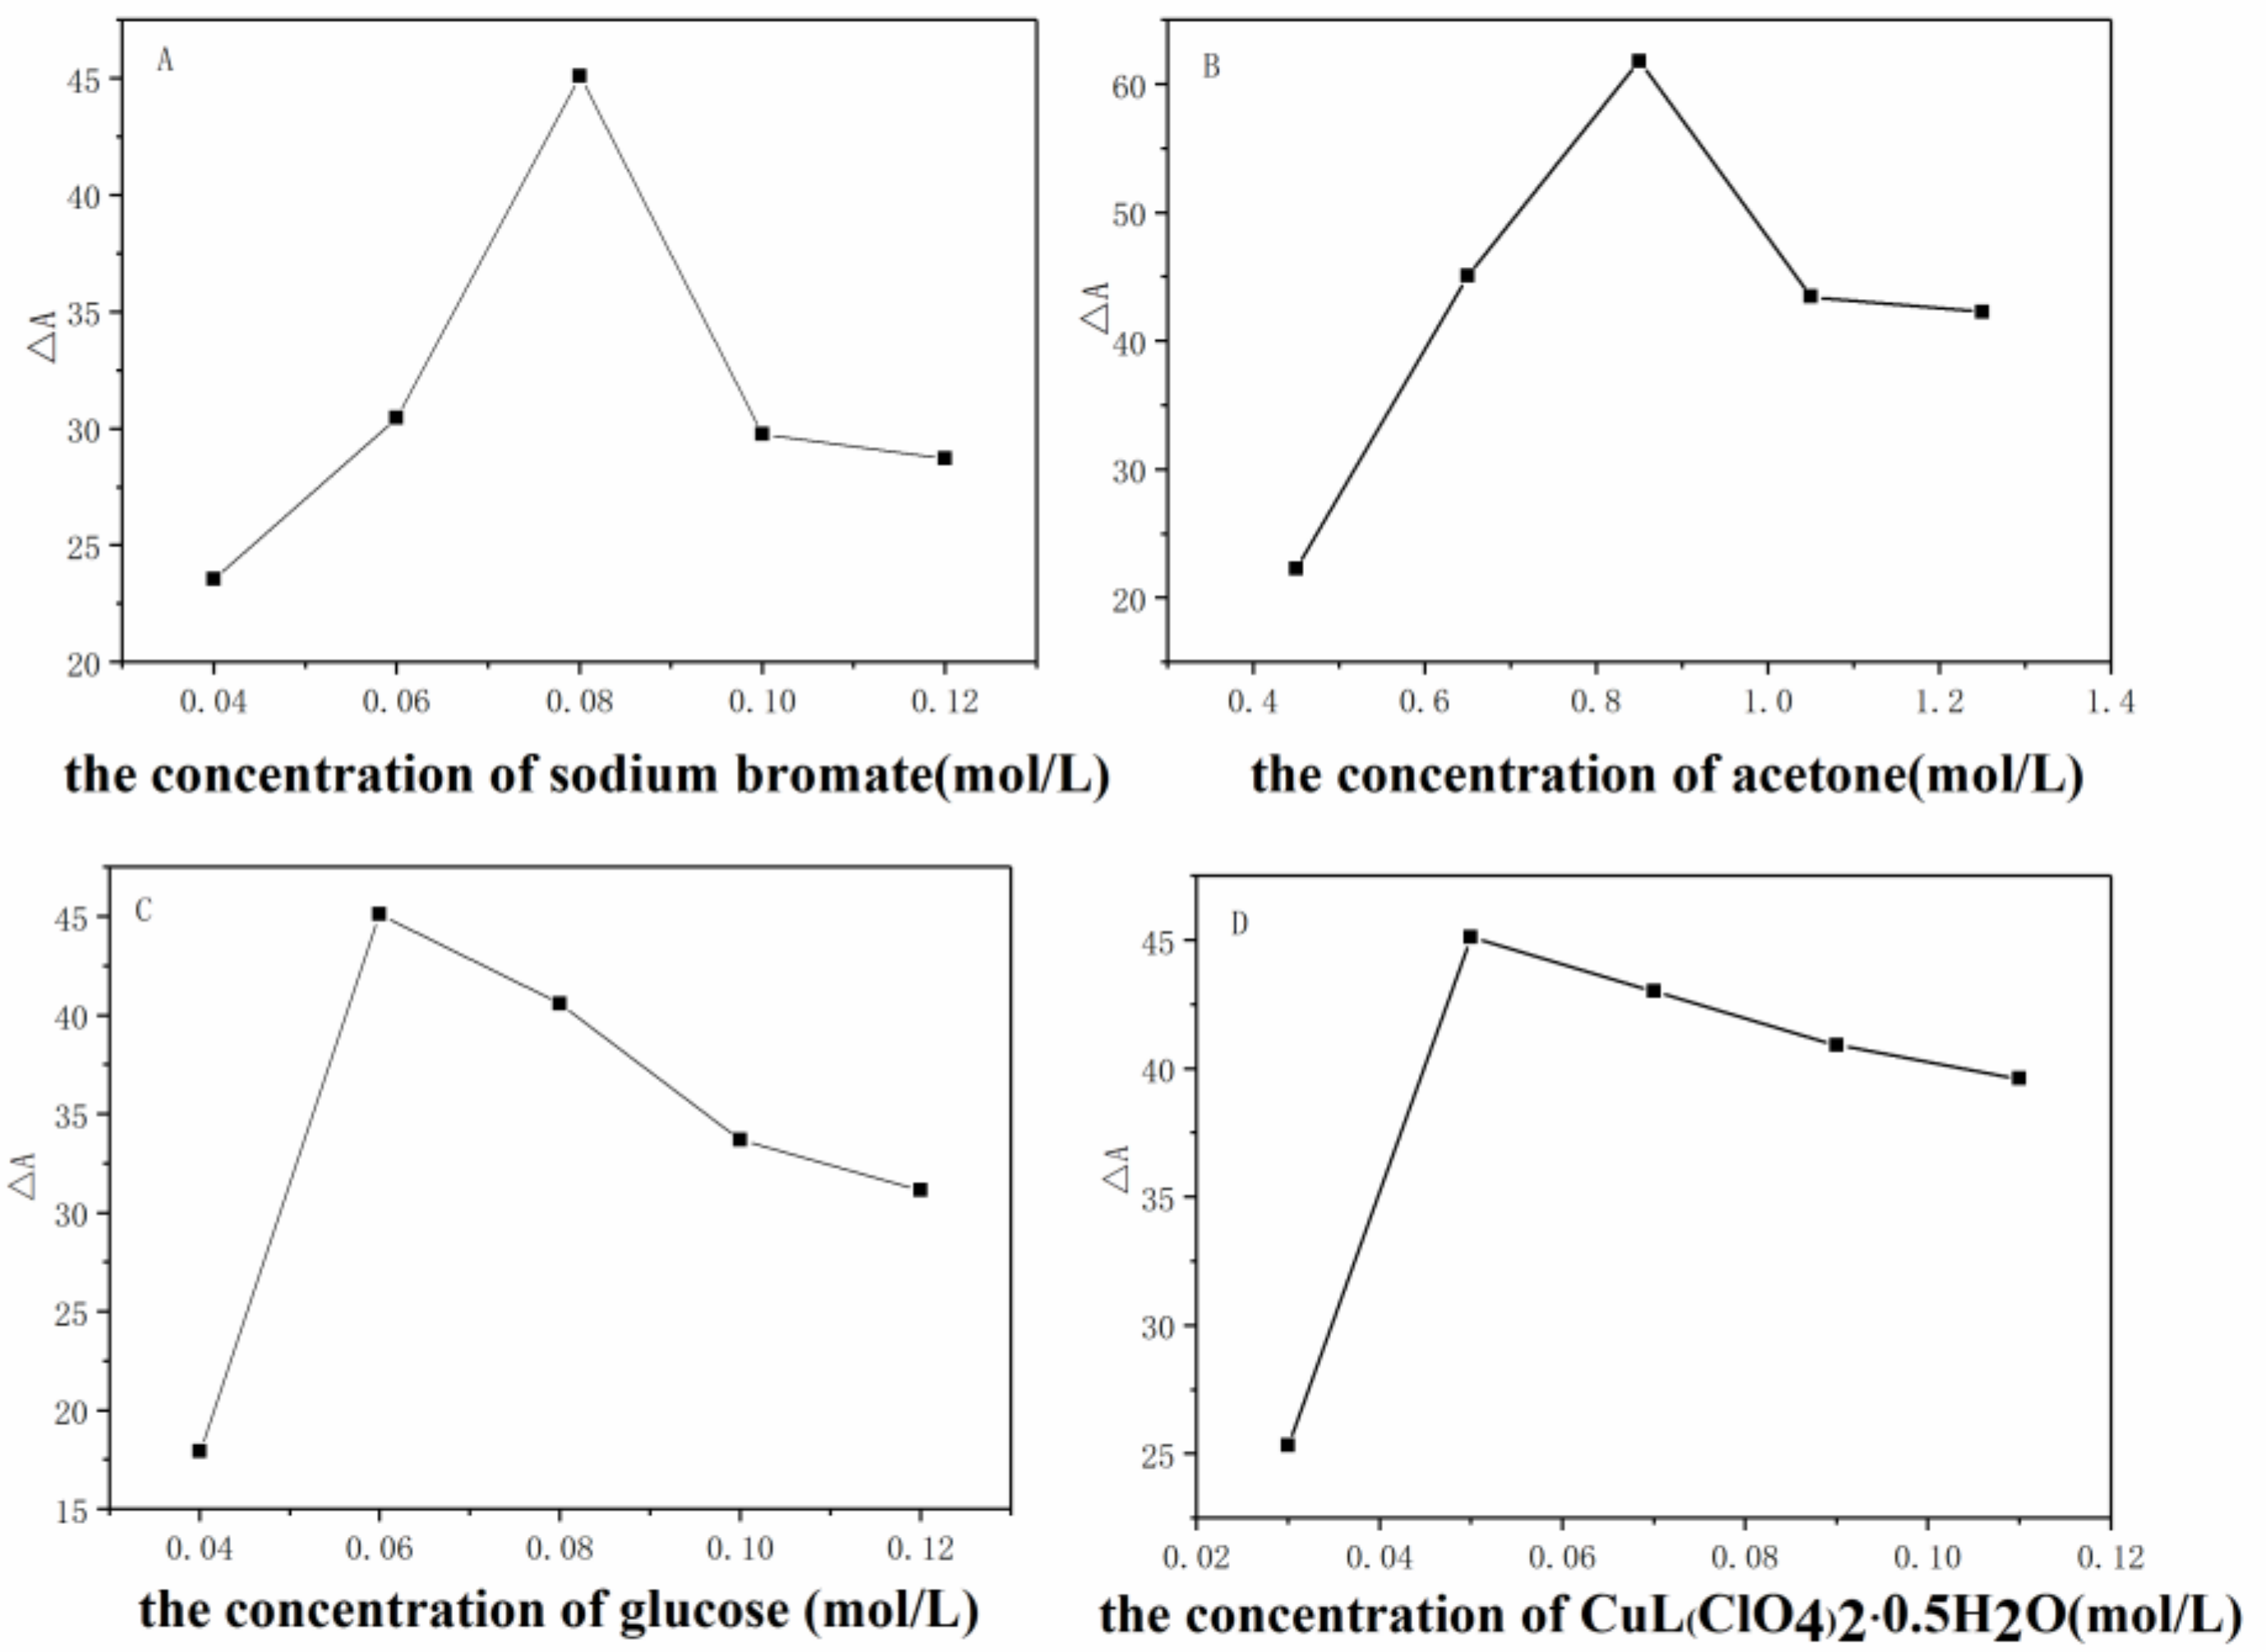
The concentrations of sodium bromate, glucose, acetone and [CuL](ClO4)2 in the oscillating system were optimized under constant light exposure (1250 Lux). We assume that A0 is the amplitude at the initial concentration, Ax is the amplitude at the other concentration, and ΔA is the difference between them, i.e., ΔA = A0 − Ax.
The experiments were conducted under a constant light intensity (1250 Lux) and with the initial concentrations [H2SO4]0 = 1.05 M, [Acetone]0 = 0.65 M, [Glucose]0 = 0.06 M, and [[CuL](ClO4)2]0 = 0.05 M. A single variable method was used to optimize the concentrations of H2SO4, acetone, glucose and [CuL](ClO4)2.
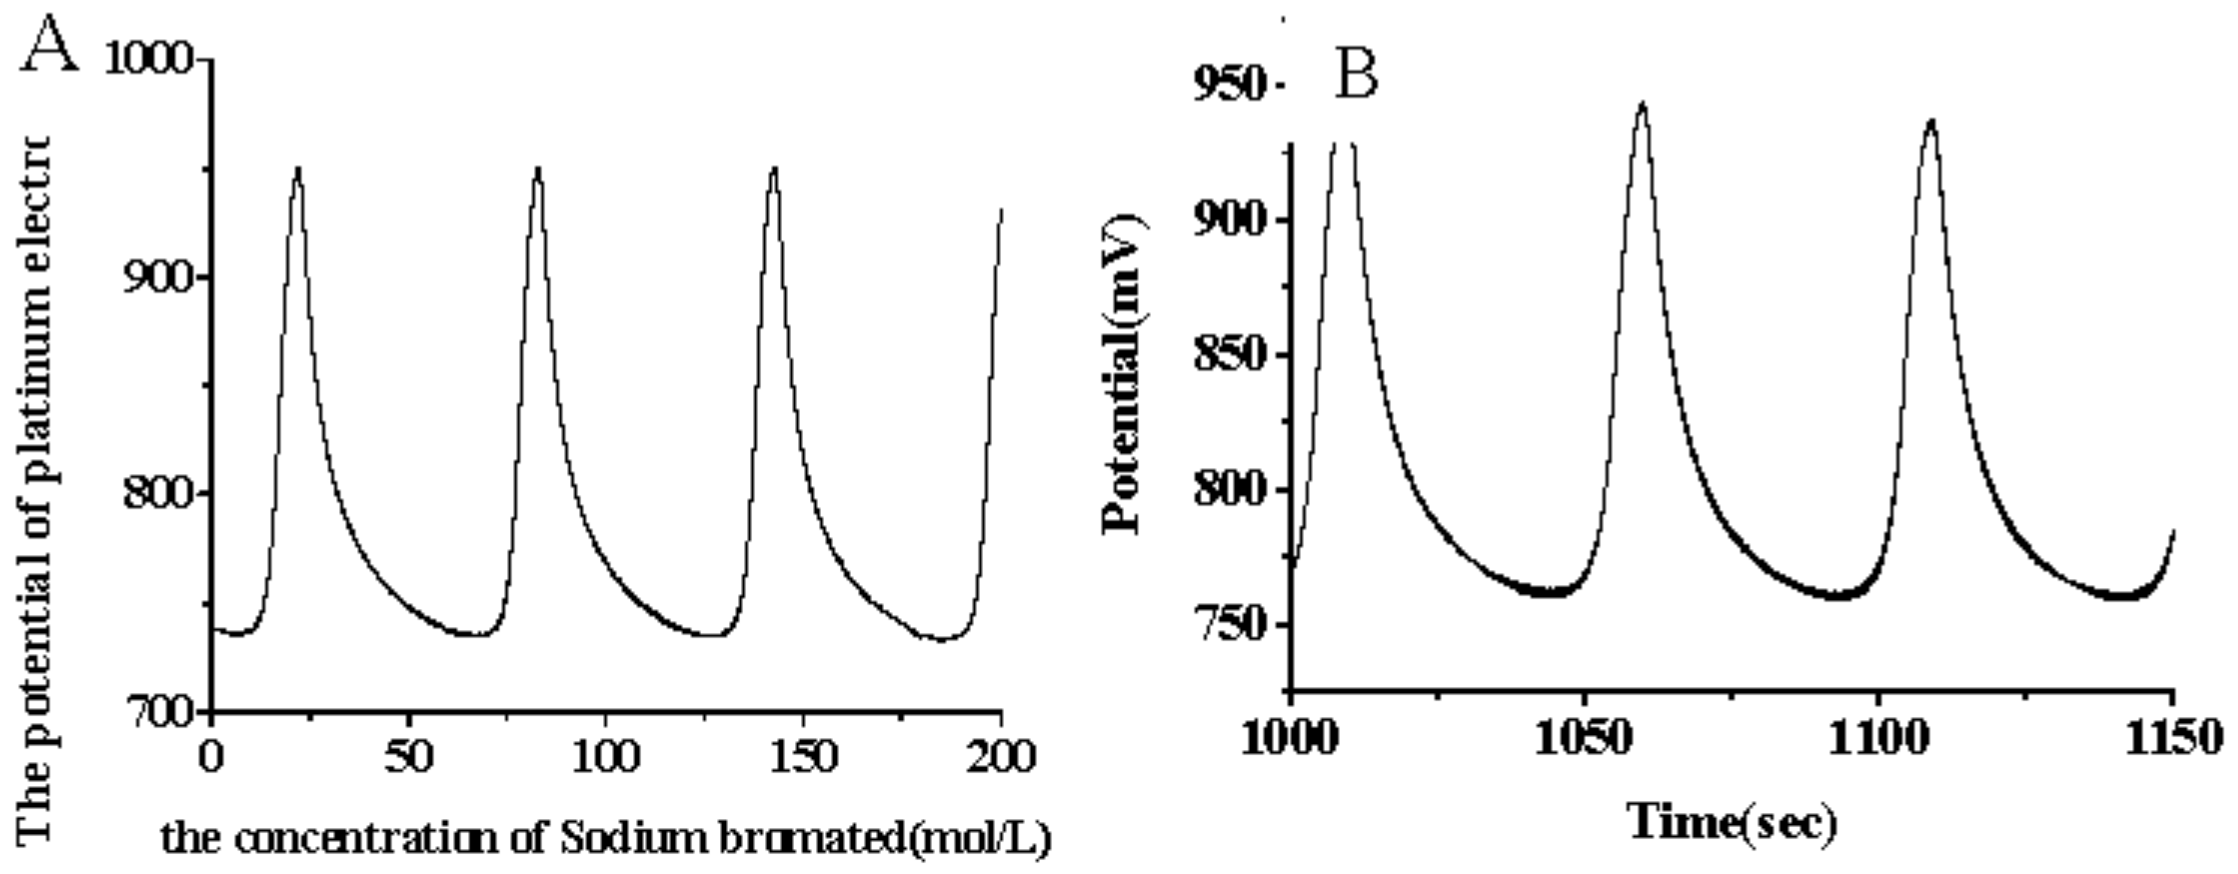
The initial concentrations of other substances did not change, the effect of the optical interference oscillating system was studied for initial concentrations of sodium bromate ([Sodium Bromate]
0) from 0.04 M to 0.14 M, and the relationship between the reaction of the optical interference oscillating system and the concentration of sodium bromate was determined. The results show that as concentration increases, ΔA first increases and then decreases before reaching a maximum value. (
Figure 1A). This method was also used to study the effects of the changes in the concentrations of acetone (0.45 M to 1.25 M), glucose (0.04 M to 0.12 M) and [CuL](ClO
4)
2 (0.03 M to 0.11 M), and the optimal concentrations were determined (
Figure 1B–D, respectively).
The experimental results show that, as concentration increases, ΔA first increases, and then when the concentration reaches a critical value, ΔA decreases with further increase in concentration. The optimal concentrations of the substances are: [H2SO4]0 = 1.05 M, [Acetone]0 = 0.65 M, [Glucose]0 = 0.06 M, [Sodium Bromate]0 = 0.08 M, and [[CuL](ClO4)2]0 = 0.05 M.
2.2. Analysis of B-Z Oscillation System Behavior under UV Light
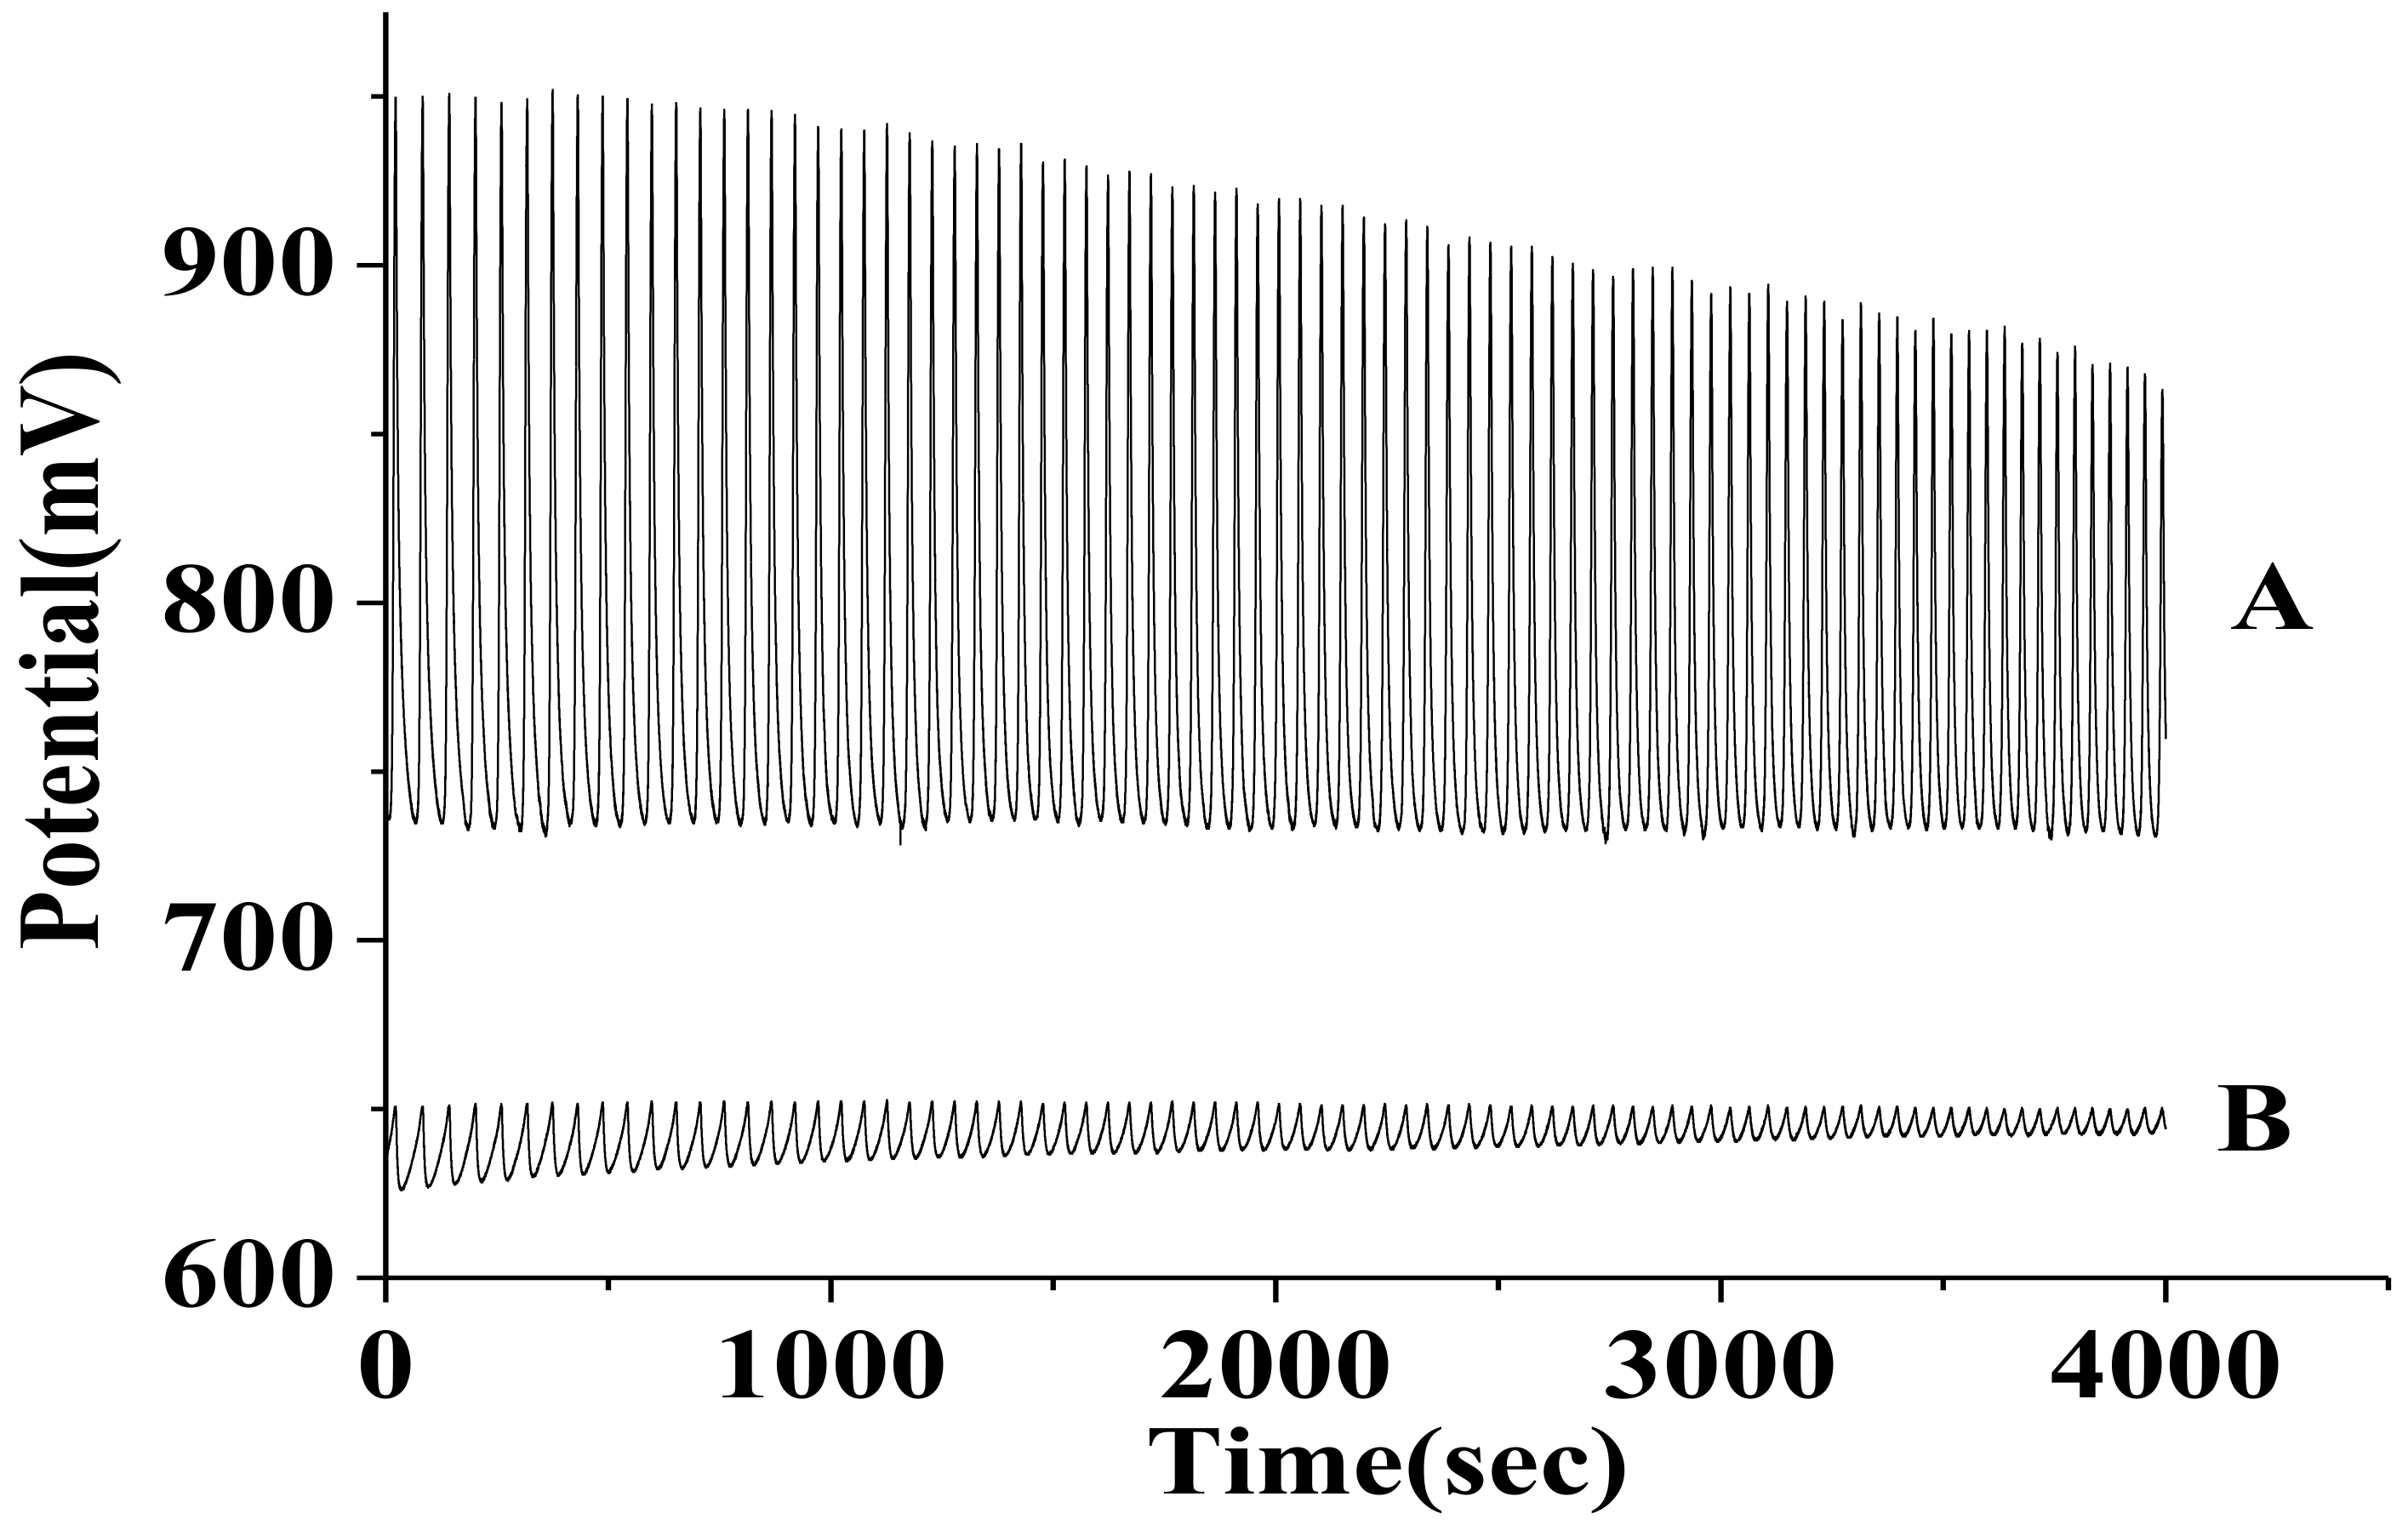
The initial concentrations of the components in the oscillating system are: [Sulfuric acid]
0 = 1.05 M, [Acetone]
0 = 0.65 M, [Glucose]
0 = 0.06 M, [Sodium Bromate]
0 = 0.08 M, and [[CuL](ClO
4)
2]
0 = 0.05 M. The platinum electrode and the Br-electrode are used as the working electrodes, and oscillation patterns with different effects were obtained. At typical oscillation plot in the absence of ultraviolet radiation is shown in
Figure 2.
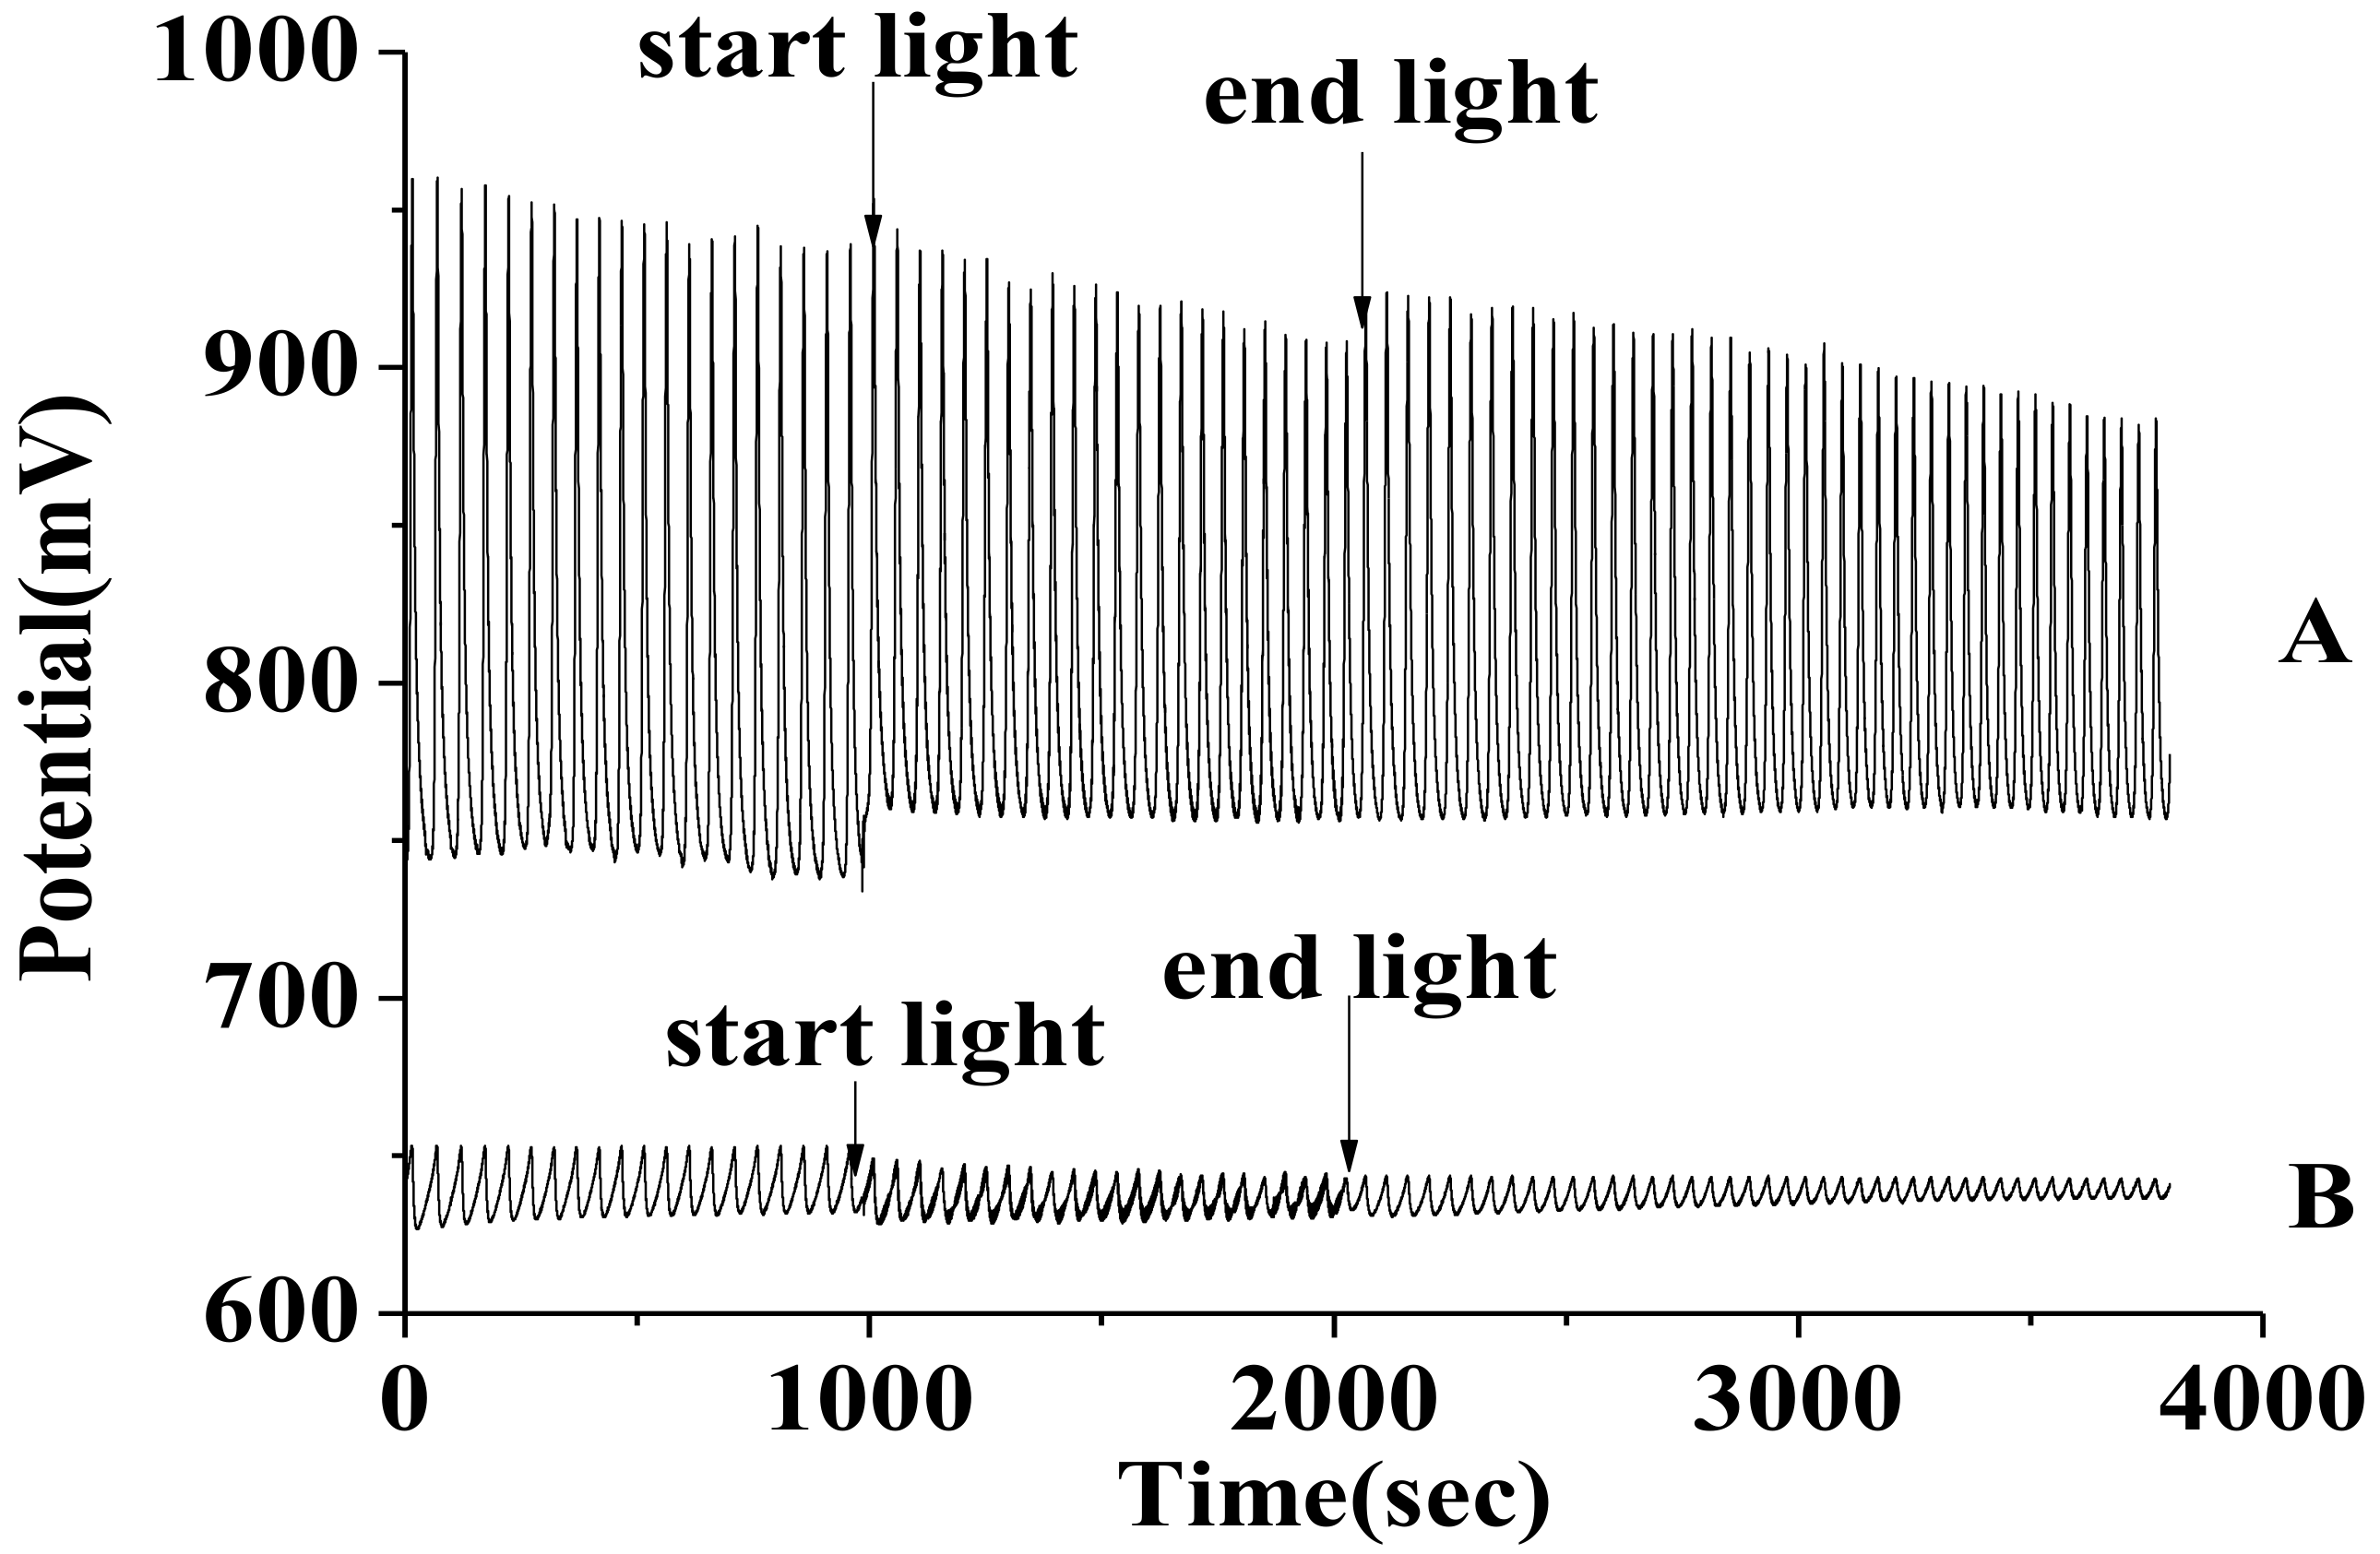
After the oscillation was stable for 1000 s, we turned on the UV lamp (UV wavelength of 245 nm, light intensity of 1250 Lux) to irradiate the oscillating solution and studied the effects of ultraviolet light on the oscillating system. We found that the amplitude of oscillation is significantly reduced by ultraviolet light, but the frequency is not substantially affected. When the UV lamp was turned off, the oscillation returns to the typical oscillation state (
Figure 3).
According to the Nernst equation given by
, the absolute voltage of oscillation increases with bromide ion concentration (
Figure 2A), and it was found that the absolute voltage of oscillation rose when light irradiation started, showing that applied light can perturb oscillation. When the light was turned on, the absolute voltage increased but the change in voltage (i.e., amplitude) decreased, implying that the rage of change of bromide ion concentration was decreasing, which indicated that the bromide ion concentration in the system was related to the change in the amplitude.
2.3. Analysis of Different Light Intensity Interference Oscillation Systems
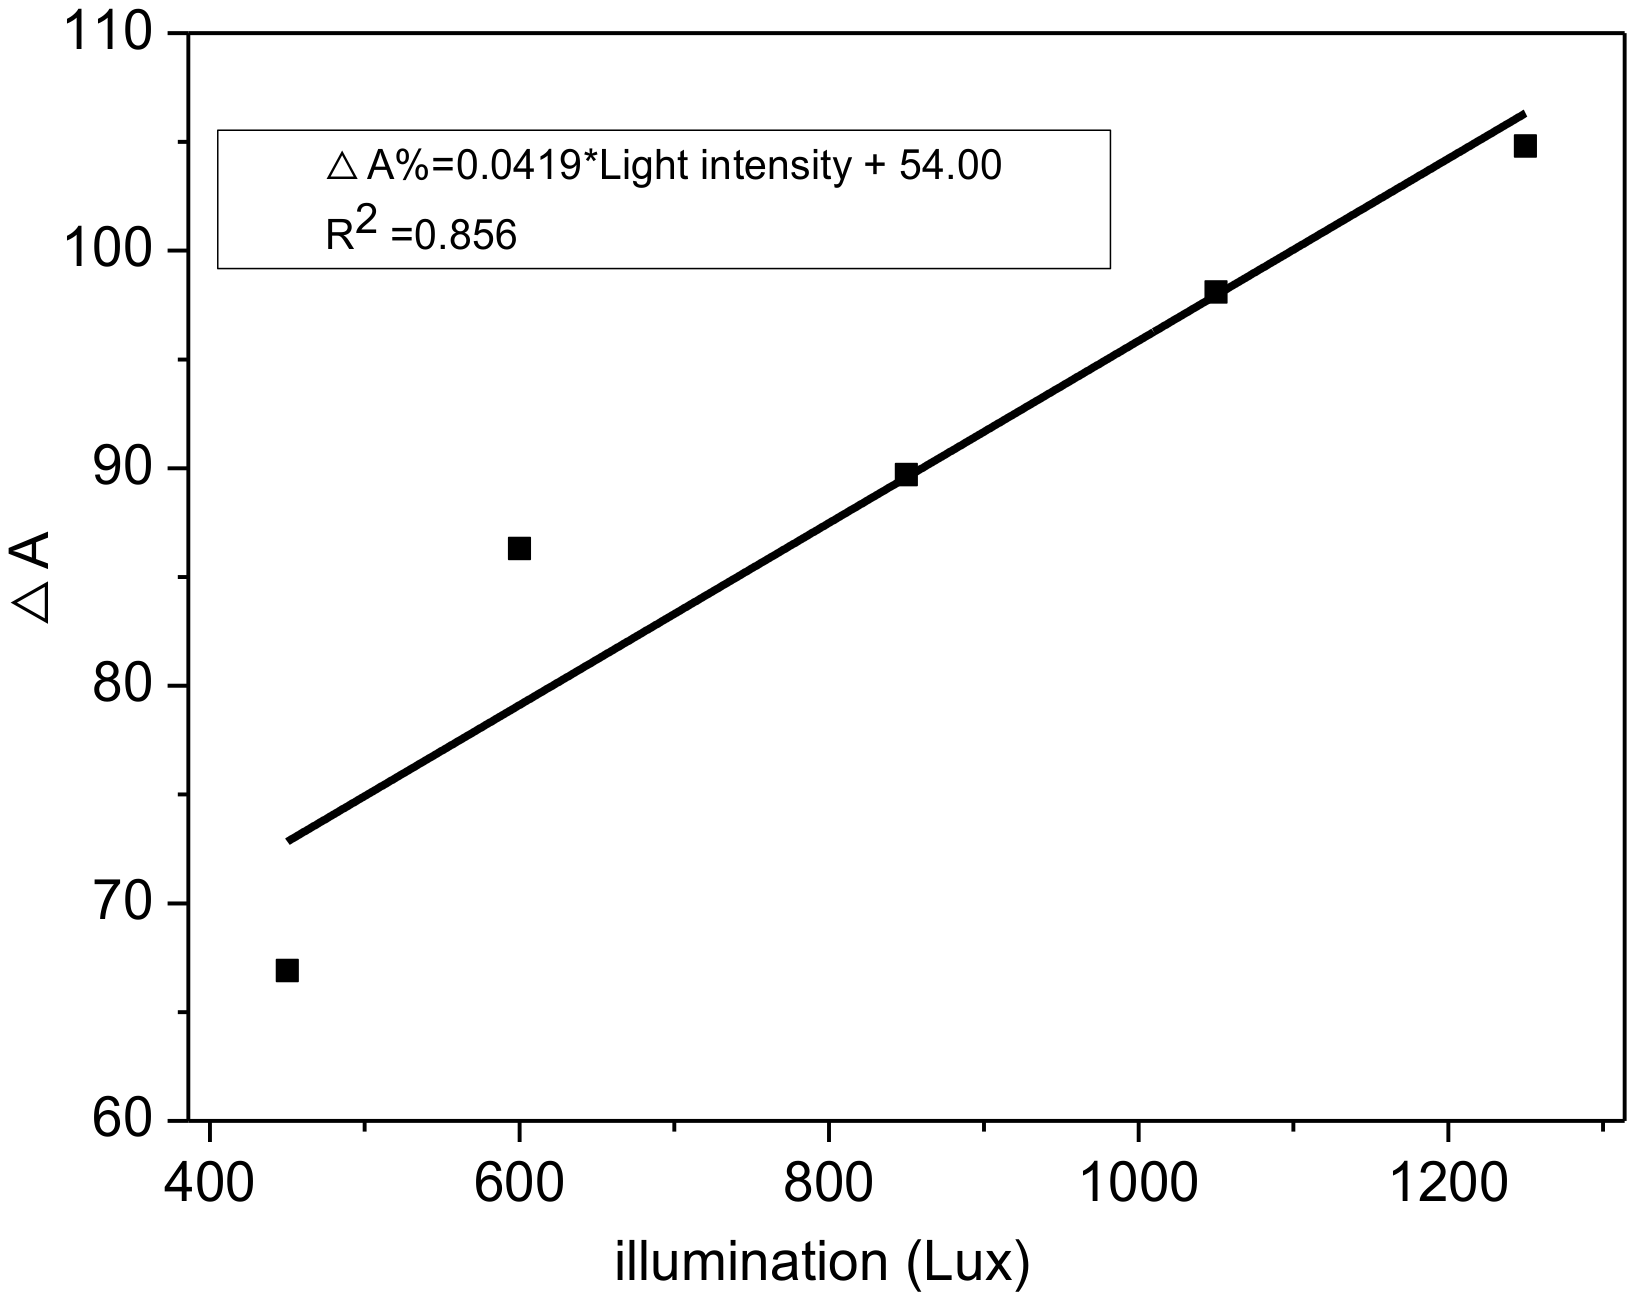
Using the optimized concentrations ([H2SO4]0 = 1.05 M, [acetone]0 = 0.65 M, [glucose]0 = 0.06 M, [sodium bromate]0 = 0.08 M, [[CuL](ClO4)2]0 = 0.05 M), we studied the effects of different light intensities on the BZ oscillation system. Here, A is the actual amplitude oscillation under UV illumination, and A0 is the ideal amplitude that is assumed to be simulated without UV illumination. ΔA is the difference between the actual amplitude under illumination and the ideal amplitude, i.e., ΔA = A0 − A, and ΔA% = (A0 − A)/A. Positive ΔA and ΔA% indicate the inhibitory effect of light on the oscillating reaction.
Then, we studied the disturbance of the oscillation behavior at different light intensities. The change in amplitude of oscillation (ΔA) increased with increasing light intensity from 450 Lux to 1250 Lux (
Figure 4), indicating that increased light intensity can increase the inhibition of oscillation. The effect of light intensity found in this work on the amplitude of the oscillating system is described by the following linear expression:
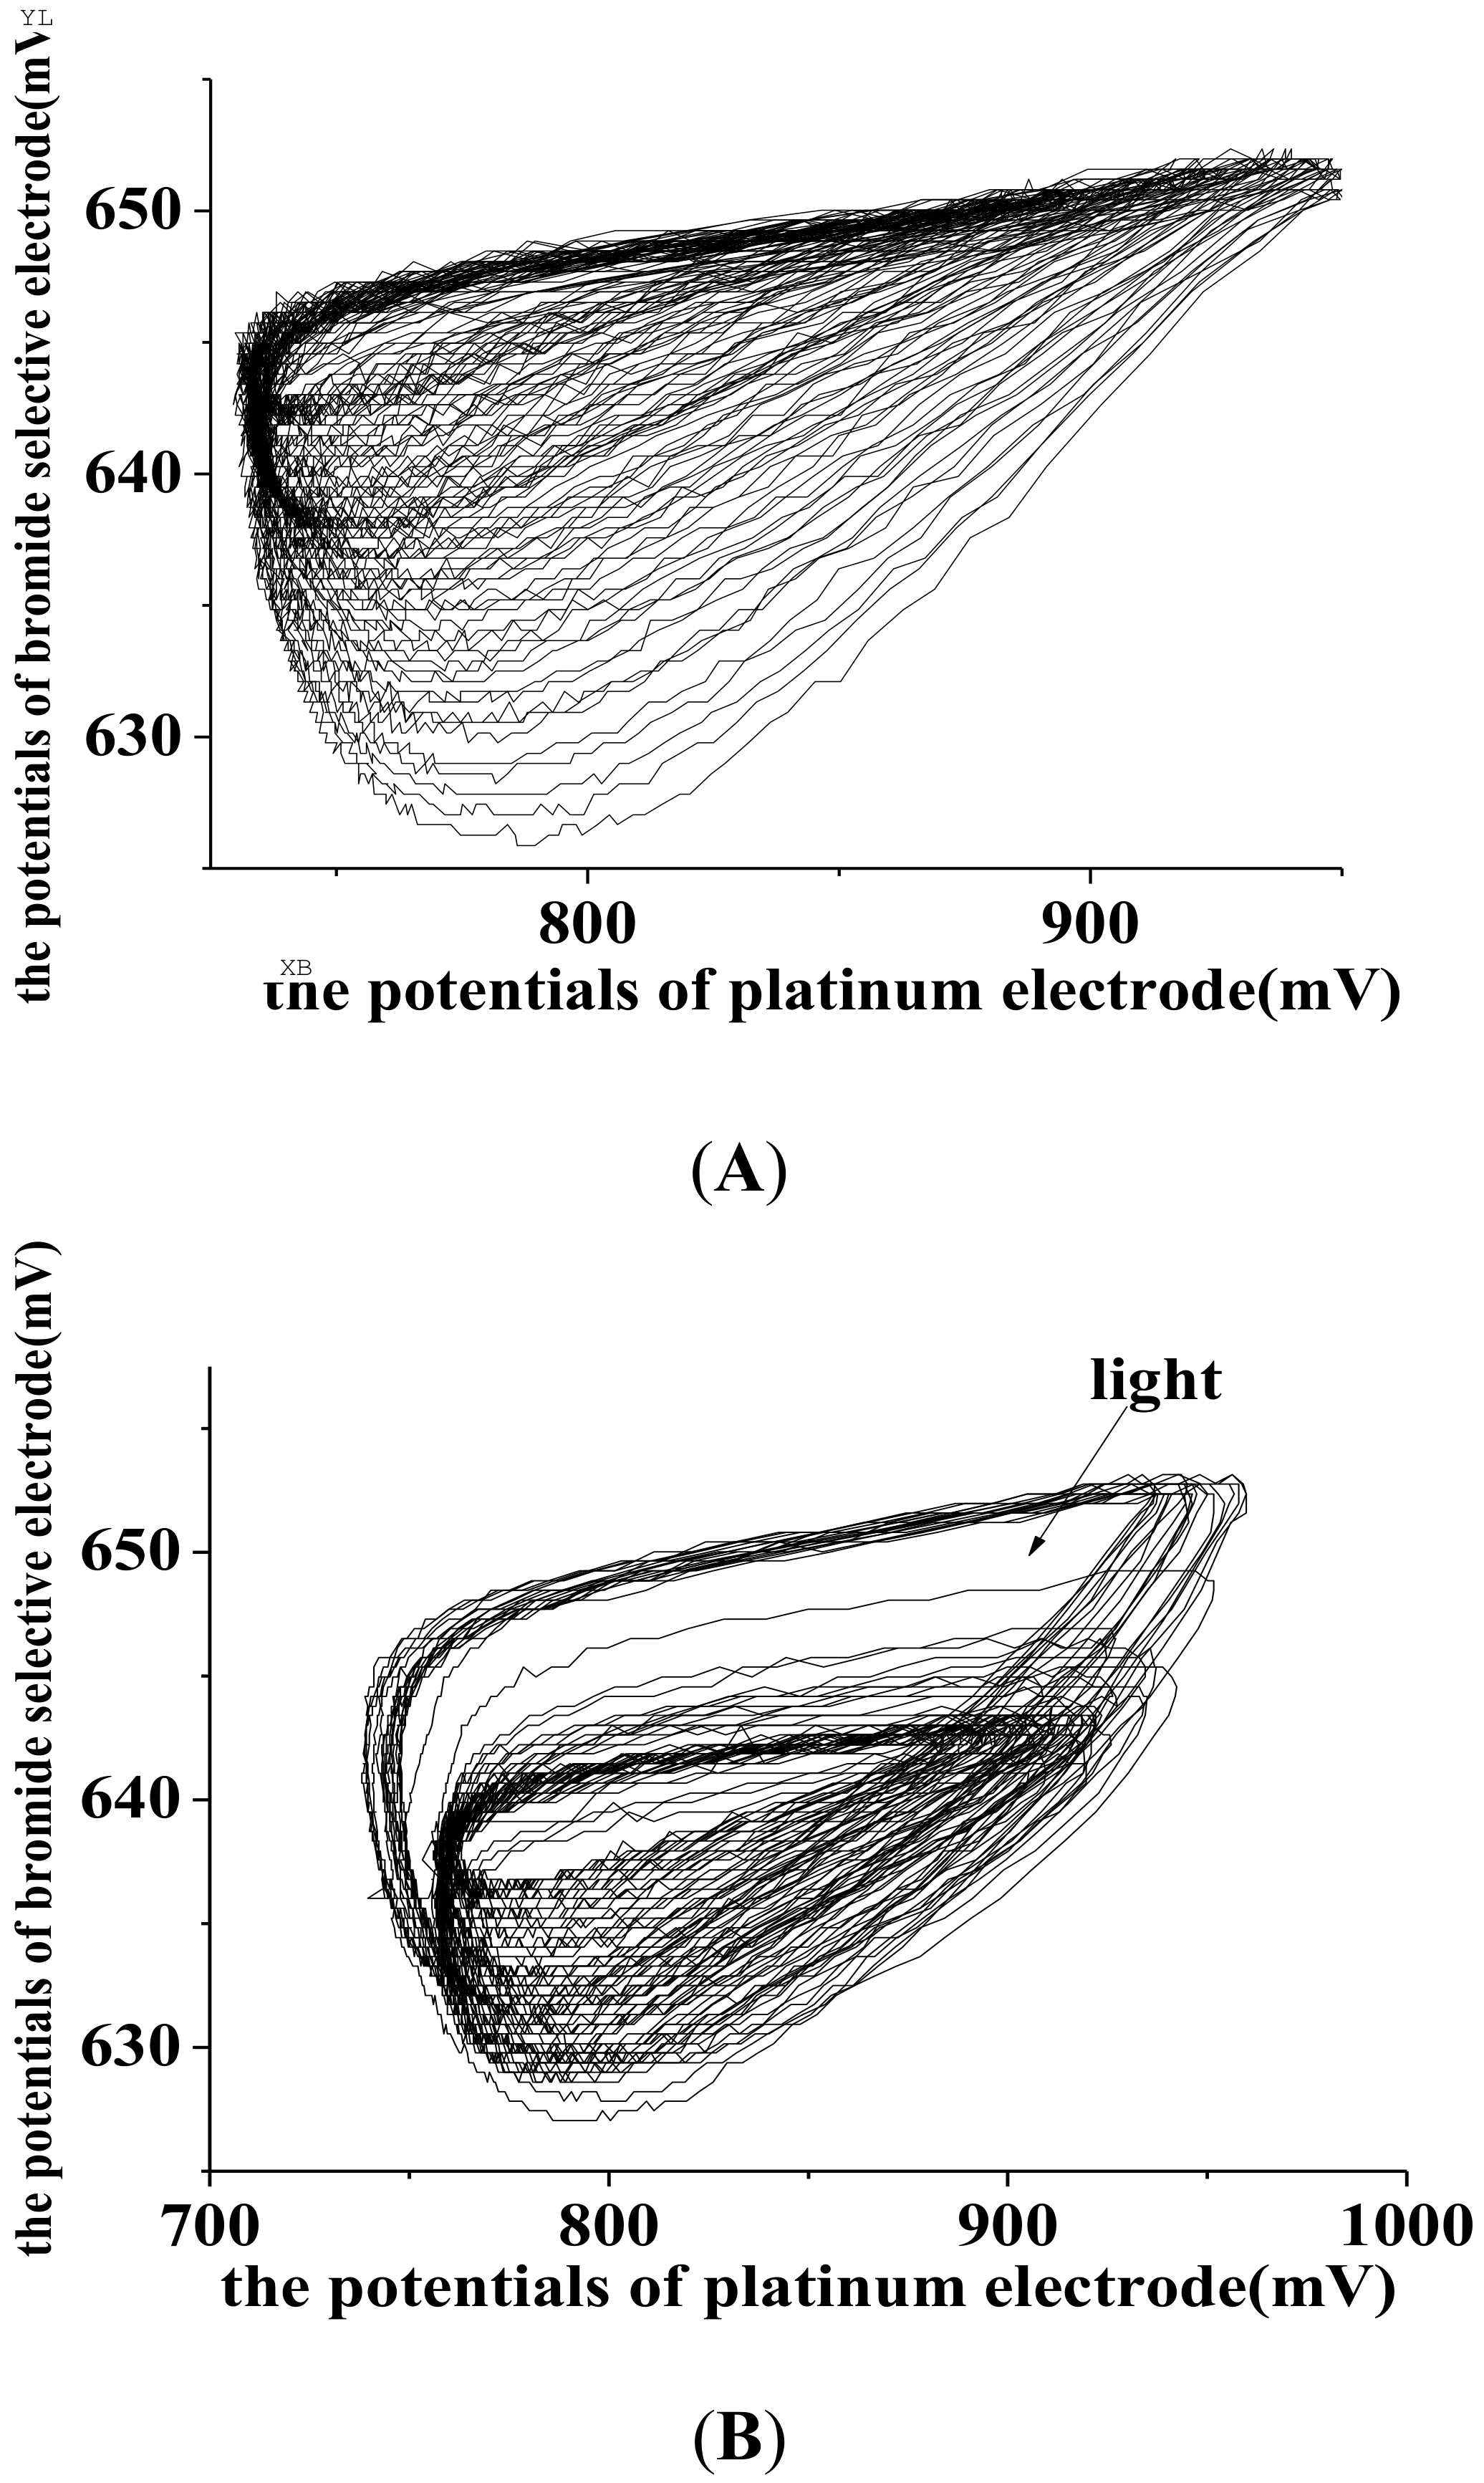
In addition, we created a correlation diagram for the potential of the platinum electrode and the Br-selective electrode at each same time point, and observed the effect of light on the overall oscillation response trajectory (
Figure 5). As seen in the figure, when UV light irradiates the oscillating system, there are signs of losing track (
Figure 5).
This effect may be explained as follows: under light irradiation, the bromide ion concentration in the oscillating system changes rapidly, increasing the bromide ion potential. Large changes in bromide ion potential lead to large changes in the correlation between the platinum electrode potential and the bromine electrode potential, generating a clear gap in the figure.
3. Proposed Mechanism
The mechanism for the Cu(II)—H2SO4—Acetone—Glucose—NaBrO3 system in the absence of light was proposed to be expressed by the following Equations (1)–(9).
The reaction process of (8) and (9) are quite complex, and the products are diverse, which can be ultimately simplified into equation C in
Section 4. When light irradiates the oscillating system, the possible mechanism of the light irradiation effect may be described by:
Under UV light irradiation, Br2 in reaction (3) will generate bromine radicals that are highly unstable and strongly oxidizing; these radicals oxidize [CuL]2+ to [CuL]3+, and at the same time are reduced to bromide ions. Overall, the concentration of oxidizing substances ([CuL]3+, BrO3−, Br, etc.) increases and the concentration of reducing substances ([CuL]2+, Br−) decreases under irradiation. In the special equation, the absolute voltage of the system rises, in agreement with experimental observations.
4. Oregonator Model
The FKN mechanism discussed above and the Oregonator model [
19] based on the FKN mechanism are well-known. The model involves three processes (including five chemical reactions) and can be expressed by the following reaction equations:
The k
x in the above equations are the rate constants, where x represents the first few steps and n is the number of Br(II) produced by Cu(II) throughout the oscillation. Here, we use symbols for the above substances: BrO
3− is denoted by A, HOBr is denoted by P, HBrO
2 is denoted by X, Br
− is denoted by Y, and Cu
2+ is denoted by Z; the ordinary differential equations are written using these symbols. In Equation C, [CuL]3+ and Br
− are not deterministic quantitative relations. N represents the number of Br- that can be catalyzed by [CuL]3
+. The equations can be expressed as follows:
In the above ordinary differential equations, the expressions are related to the dimension of the units (time-concentration relationship). When the simulation is performed, the equation must be processed dimensionlessly (i.e., converted to a unit with a dimension of 1). Using x, y, z, τ, ε, p, and q to represent various substances, we obtain:
After processing, a unit of 1 is obtained, and the equations are given by:
The mathematical calculation software Mathematica 5.0 [
20] is suitable for simulating the entire oscillation process. In the computational simulations, the concentration of each substance in the oscillating reaction system at any time point is used as the simulation standard, and the component substances are calculated by the software. Using the software, the numerical solution of the concentration is then converted into a graphical solution to represent the entire oscillation process in a visual manner.
Based on the oscillation experiment, a simple model diagram was created based on the actual oscillation diagram using Mathematica 5.0, and the proposed mechanism was analyzed by analyzing the model diagram.
The observed oscillation B-Z in the absence of light is shown in
Figure 6A, and the observed oscillation pattern (potential-time) of the system under light irradiation is shown in
Figure 6B.
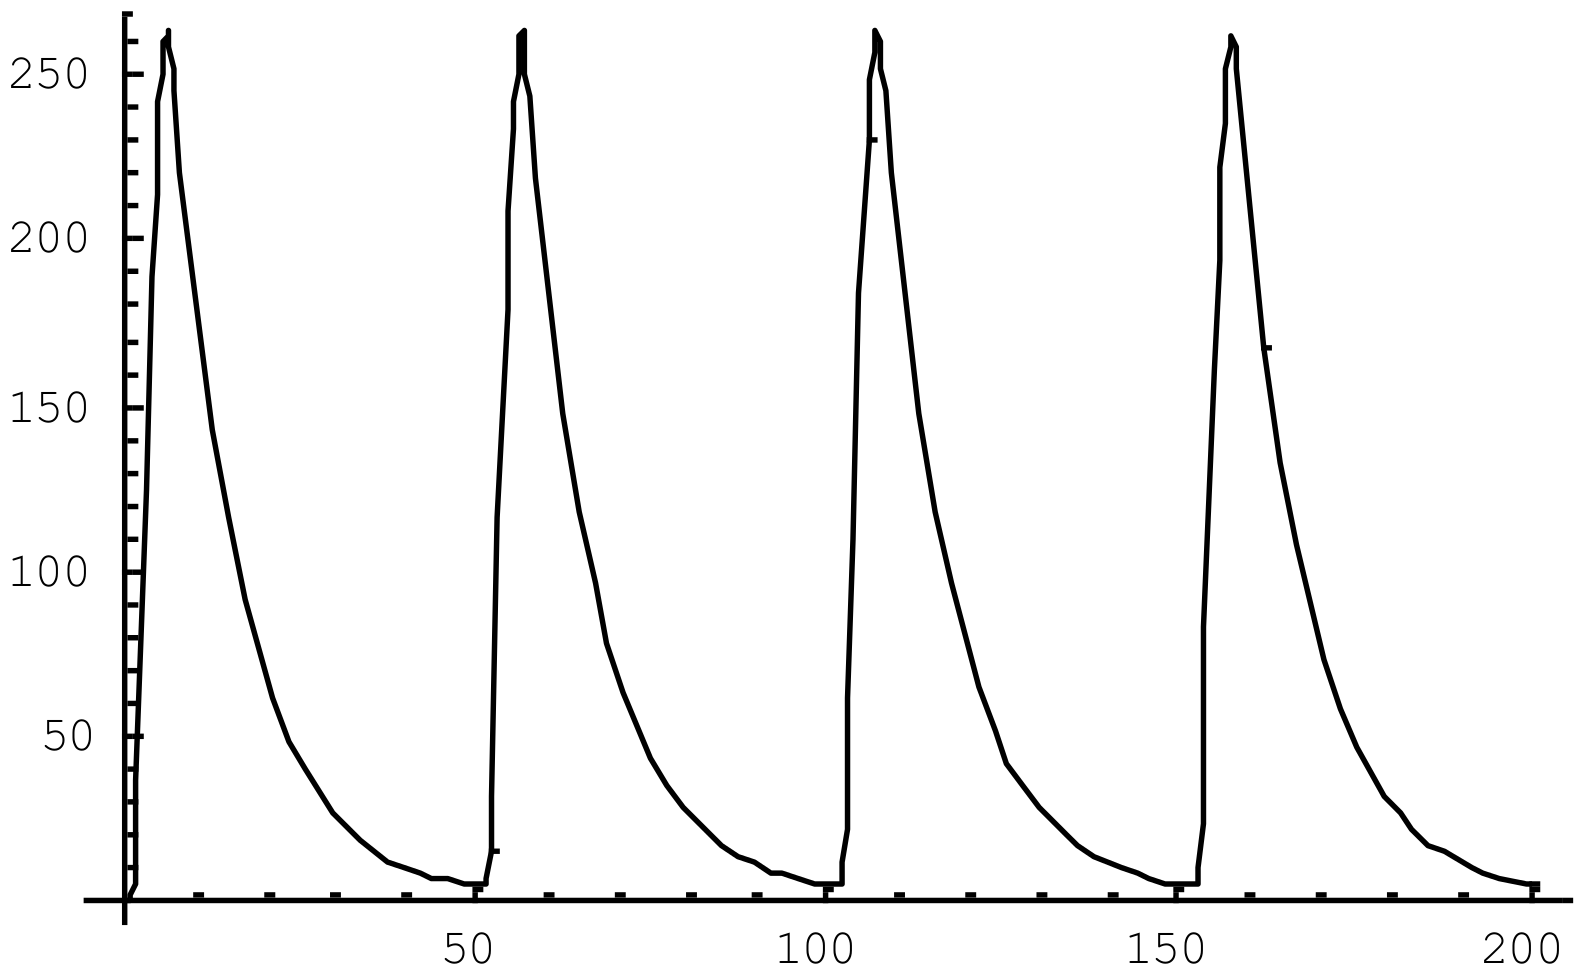
First, we simulated the basic chemical oscillation model without light, as shown in
Figure 7.
The parameters of the simulation graph are: k1 = 2 M−1s−1, k2 = 2 × 10⁸ M−1s−1, k3 = 0.25 M−1s−1, k4 = 1.25 × 10⁶ M−1s−1, k5 = 0.3 M−1s−1, ε = 8, p = 0.1, q = 0.001, n = 0.55, A = 0.015 mol/L.
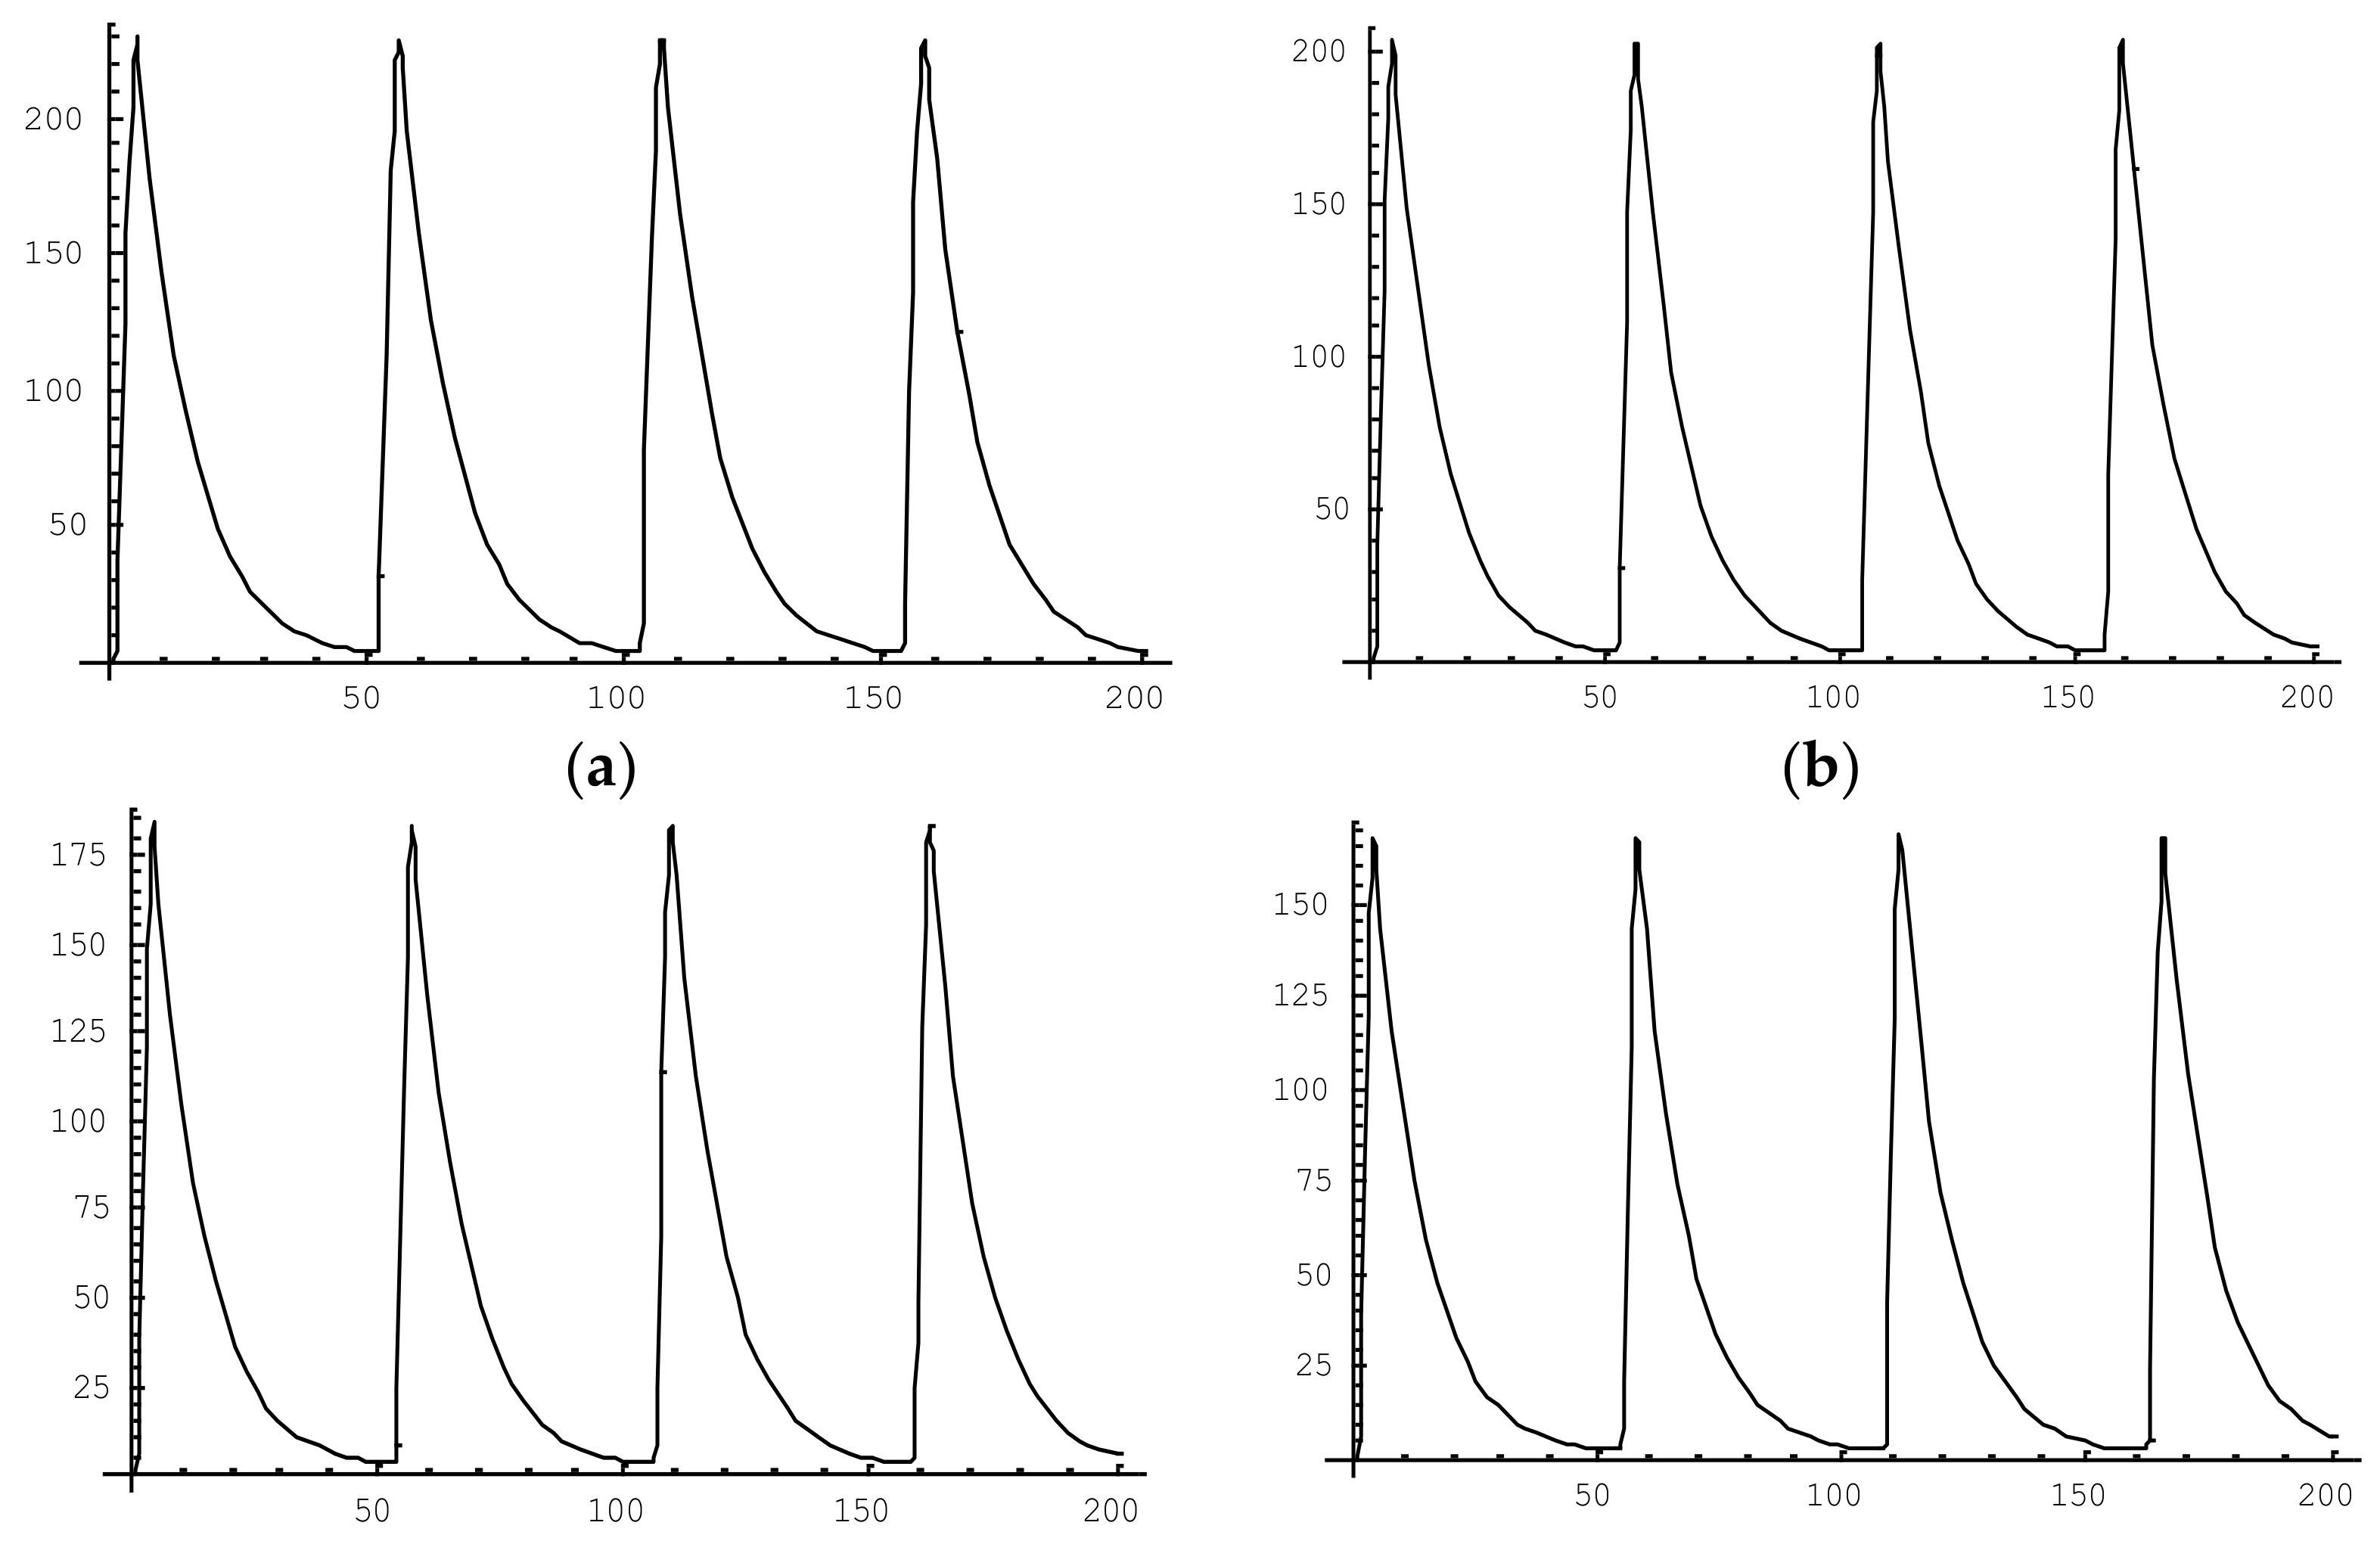
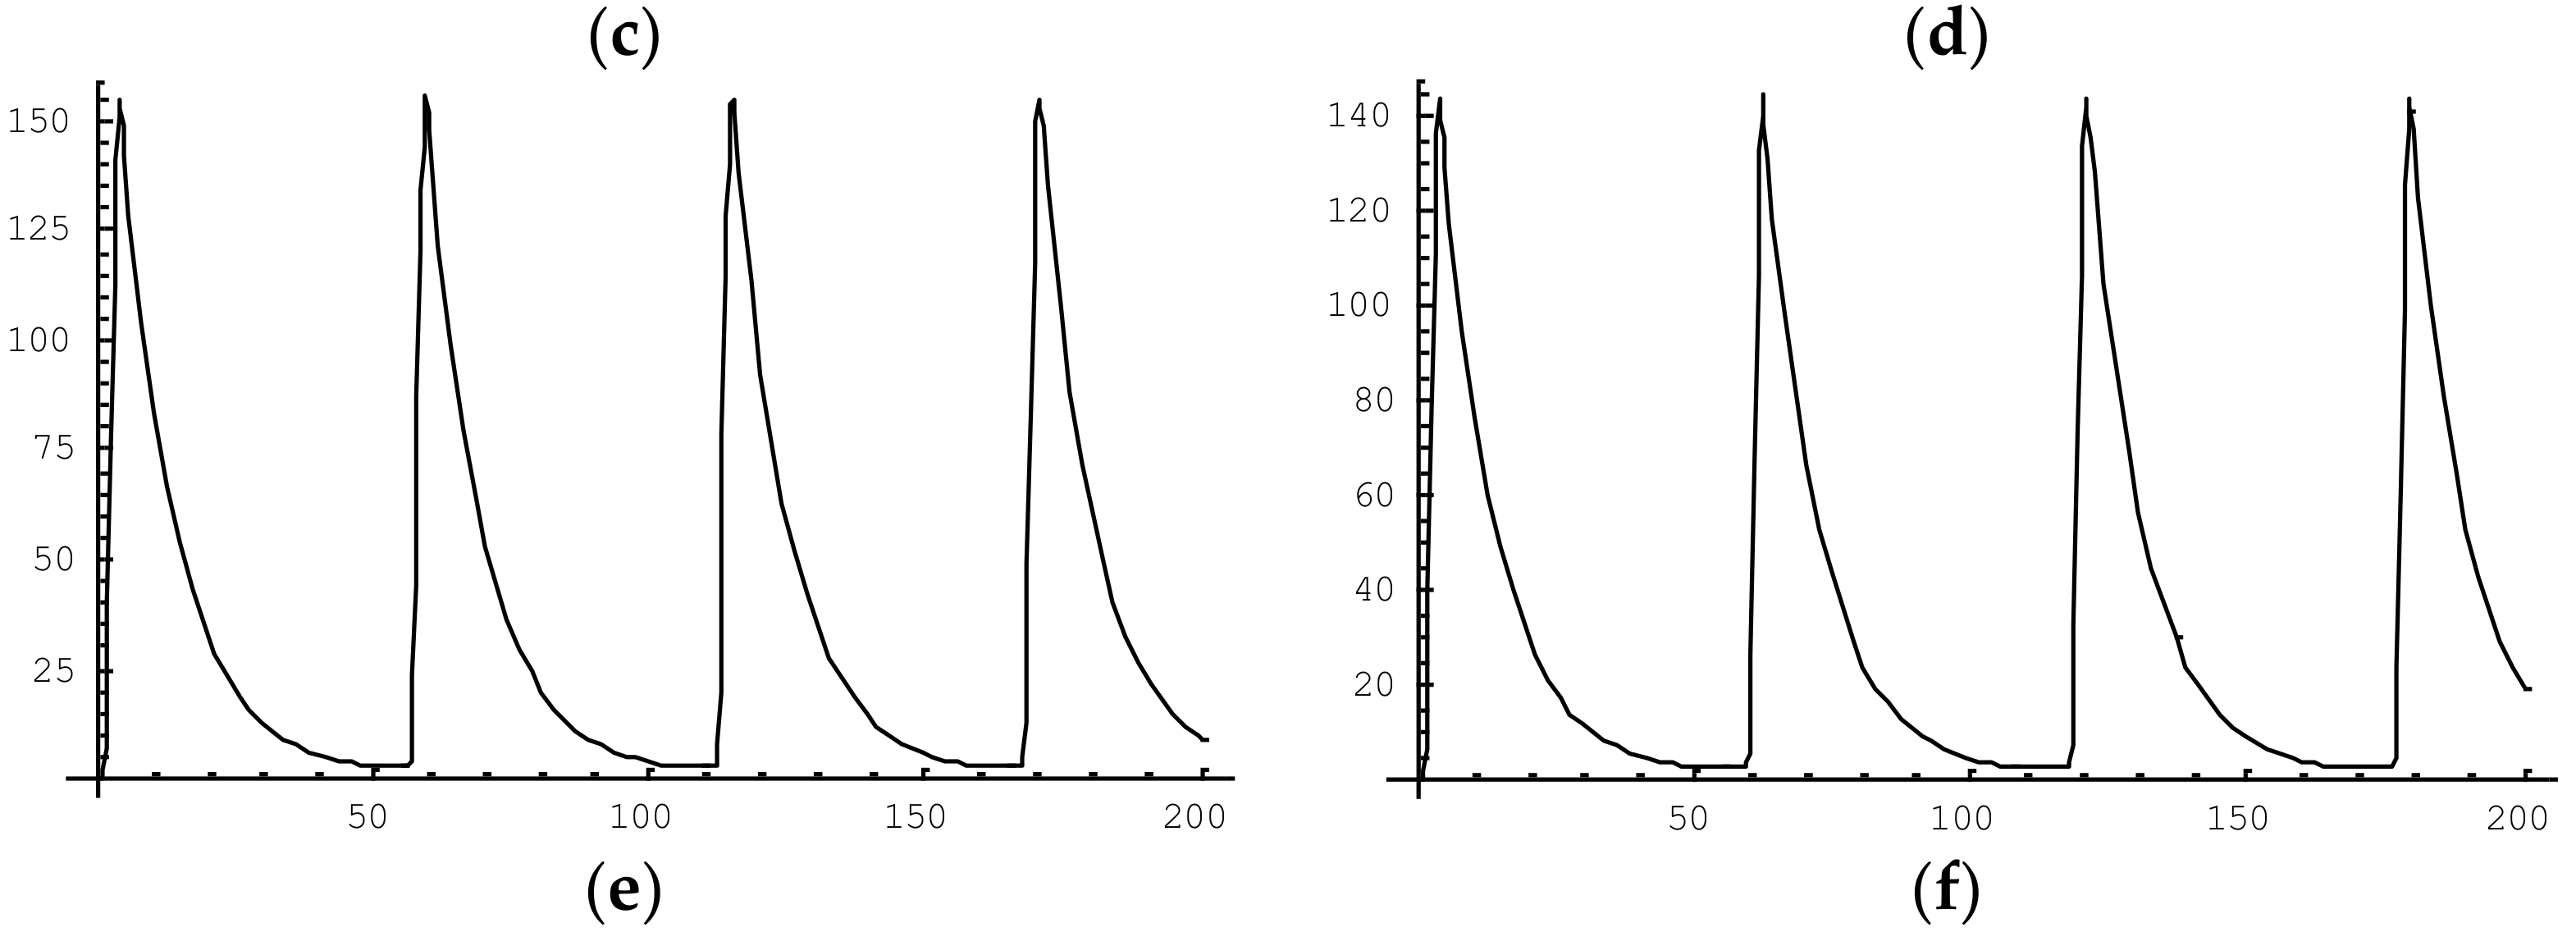
Based on the examination of the chemical oscillation diagram obtained by the illumination chemical oscillation system, it was concluded that the amplitude of the oscillating reaction will be reduced but the period has no significant change. Therefore, by changing the parameters of the above model, we can obtain a model diagram for which the period is unchanged, but the amplitude is reduced (
Figure 8).
The parameters used to obtain
Figure 8a are as follows: k
1 = 2 M
−1s
−1, k
2 = 3,000,000 M
−1s
−1, k
3 = 10,000 M
−1s
−1, k
4 = 6,750,000 M
−1s
−1, k
5 = 0.0027 M
−1s
−1, ε = 0.0002, p = 11.1, q = 0.0009, n = 0.65, A = 0.015 mol/L.
The parameters used to obtain
Figure 8b are as follows: k
1 = 2 M
−1s
−1, k
2 = 3,000,000 M
−1s
−1, k
3 = 10,000 M
−1s
−1, k
4 = 6,750,000 M
−1s
−1, k
5 = 0.0027 M
−1s
−1, ε = 0.0002, p = 11.1, q = 0.0009, n = 0.75, A = 0.015 mol/L.
The parameters used to obtain
Figure 8c are as follows: k
1 = 2 M
−1s
−1, k
2 = 3,000,000 M
−1s
−1, k
3 = 10,000 M
−1s
−1, k
4 = 6,750,000 M
−1s
−1, k
5 = 0.0027 M
−1s
−1, ε = 0.0002, p = 11.1, q = 0.0009, n = 0.85, A = 0.015 mol/L.
The parameters used to obtain
Figure 8d are as follows: k
1 = 2 M
−1s
−1, k
2 = 3,000,000 M
−1s
−1, k
3 = 10,000 M
−1s
−1, k
4 = 6,750,000 M
−1s
−1, k
5 = 0.0027 M
−1s
−1, ε = 0.0002, p = 11.1, q = 0.0009, n = 0.95, A = 0.015 mol/L.
The parameters used to obtain
Figure 8e are as follows: k
1 = 2 M
−1s
−1, k
2 = 3,000,000 M
−1s
−1, k
3 = 10,000 M
−1s
−1, k
4 = 6,750,000 M
−1s
−1, k
5 = 0.0027 M
−1s
−1, ε = 0.0002, p = 11.1, q = 0.0009, n = 0.105, A = 0.015 mol/L.
The parameters used to obtain
Figure 8f are as follows: k
1 = 2 M
−1s
−1, k
2 = 3,000,000 M
−1s
−1, k
3 = 10,000 M
−1s
−1, k
4 = 6,750,000 M
−1s
−1, k
5 = 0.0027 M
−1s
−1, ε = 0.0002, p = 11.1, q = 0.0009, n = 0.115, A = 0.015 mol/L.
In the above parameters, n represents the light intensity. It can be seen from subfigures (a) to (f) that the amplitude decreases with the increase of n and the oscillation period remains unchanged.
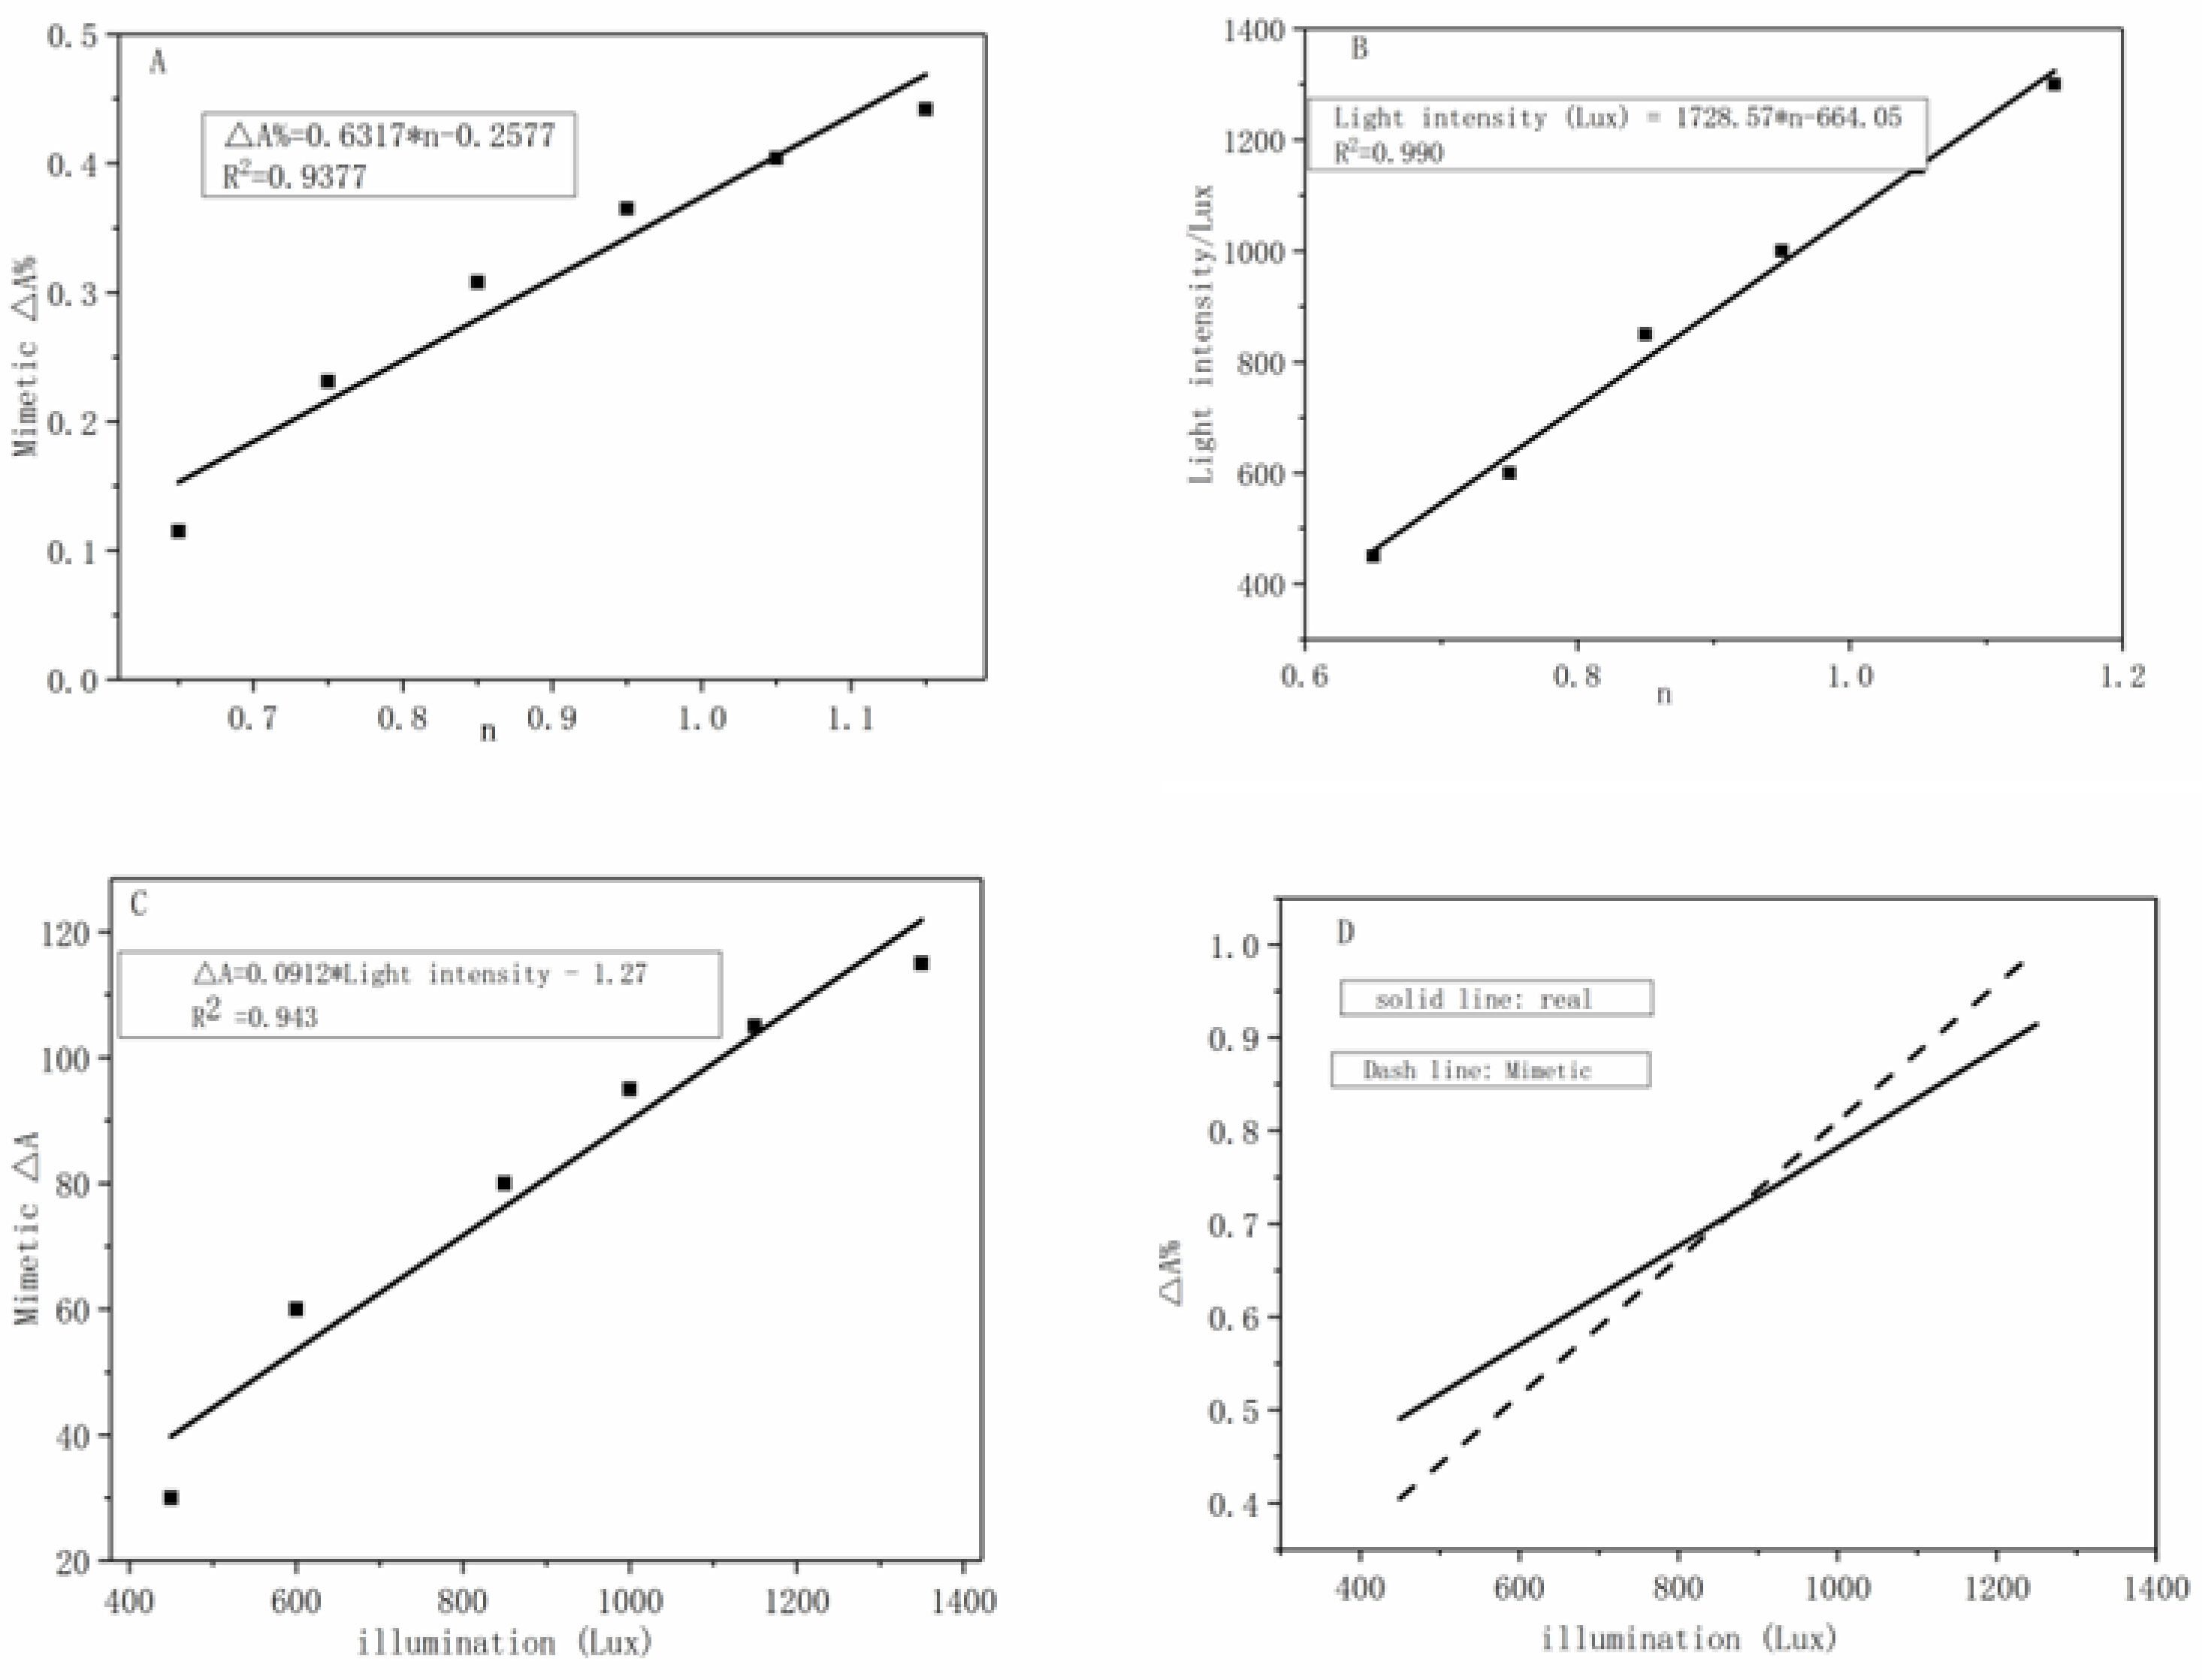
An examination of the diagram of the observed chemical oscillation (
Figure 9) shows that, in the absence of light, the amplitude of the chemical oscillation is approximately 250 mV, which corresponds to the amplitude of the oscillation pattern simulated when n = 0.55, so that n is set to 0.55. For a graph of simulated oscillation in the absence of light, as n increases, the amplitude of the simulated oscillation decreases, with a good linear relationship between the rate of change of the amplitude and n (
Figure 9A). According to
Figure 9B, n of the simulation system increases with the increase in the light intensity, and there is a good linear relationship between n and light intensity. Furthermore, we can obtain the relationship between the light intensity and the rate of change of the amplitude of the simulated oscillation graph. Comparing the rate of change of the amplitude obtained experimentally with the rate of change obtained via simulation shows that the simulation system is similar to the experimental system, indicating that the use of simulation is valid. The system illustrates the reaction mechanism of the experiment.
The simulations show that other parameters in the light simulation map do not change. This result is because n changes, and this change gives rise to a change in Br-, in turn increasing n and giving rise to an increase in Br- concentration, which hinders the oscillation reaction. The effect of the oscillating reaction results in a decrease in the amplitude as a result of an increase in the bromide ion concentration.
Of course, more complex mechanisms still need to be explored.
5. Materials and Methods
5.1. Materials and Instruments
An electronic analytical balance (JM-B2006) was purchased from Zhuji Chaozehengqi Equipment Co., Ltd., Zhuji, China. 217 double salt bridge calomel electrodes, platinum electrodes and bromide ion selective electrodes were purchased from Wuhan Gaoss Union Technology Co., Ltd., Wuhan, China. An electrochemical workstation (CHI660D) was purchased from Shanghai Chenhua Instrument Co., Ltd., shanghai, China. An ultraviolet light was purchased from Hangzhou Qiwei Instrument Co., Ltd., hangzhou, China. A digital display temperature control magnetic stirring instrument was purchased from Xiangtan Zhongda Equipment Factory Co., Ltd., Xiangtan, China. The H2SO4(AR), Acetone(AR), [CuL](ClO4)2(AR), Glucose(AR) and sodium bromate (AR) were purchased from Tianjin Damao Chemical Reagent Factory Co., Ltd., Tianjin, China.
5.2. Methods
A 50-mL beaker, which was used as a container for the oscillation reaction, was held at a temperature of 25 ± 0.5 °C. A 217 double salt bridge calomel electrode and a platinum electrode (or bromide ion selective electrode) were used as the reference electrode and the working electrode, respectively. H2SO4 (20.00 mL, 1.05 M), acetone (5.00 mL, 0.65 M), [CuL](ClO4)2 (5.00 mL, 0.05 M), glucose (5.00 mL, 0.06 M), and sodium bromate (5.00 mL, 0.08 M) were mixed in the 50-mL beaker, and the total mixed solution is an oscillating system. To stabilize the chemical oscillating system, the mixed solution was stirred with a digital temperature-controlled magnetic stirrer. The water bath was controlled at a temperature of 25 ± 0.5 °C, and the stirring rate was 540 rpm. The reaction was performed by monitoring the potential changes of the platinum electrode and the Br selective electrode. The run time and sample interval parameters of the electrochemical workstation software were set to 3500 s and 0.05, and the oscillatory reaction was recorded; as shown by the general B-Z oscillation diagrams, a period of steady oscillation was quickly reached.
To determine the effect of light on the BZ chemical oscillations, a continuously variable light UV lamp was used as a light source to irradiate the oscillating system when oscillation was relatively stable (usually approximately 1000 s). The distance between the lamp and the beaker was 5 cm. After a period of time, the effect of light on the BZ chemical oscillation system was observed, and the corresponding parameters (i.e., amplitude and period) were recorded. Finally, under these optimal conditions, the functional relationship between different light intensities and the parameters of the oscillating system was examined.
6. Conclusions
For the first time, the effect of light on the [CuL](ClO4)2–glucose (Glu)–Acetone (NaBrO3)–sulfuric acid (H2SO4) system was studied; in this system, [CuL](ClO4)2 has a catalytic effect, and glucose and acetone are mixed substrates. To better understand this new type of chemical oscillation system and the effect of light on this system, we conducted experiments to optimize the effect of light on the system. Under optimal concentration conditions, the relationship among oscillation amplitude, oscillation period, and light intensity were studied, and experimental analysis revealed the linear relationship between the amplitude change and the light intensity. In addition, the correlation diagram of the voltage of the oscillating system simultaneously measured by a platinum electrode and a bromide ion selective electrode was obtained, and the possible mechanism of the oscillating system was proposed.
Based on the experiments, using Mathematica 5.0, we obtained a simple model diagram using the actual oscillation diagram, and analyzed the proposed mechanism using the model diagram. The other parameters in the light simulation map do not change, because n has changed, and the change in n gives rise to the change of Br− concentration, in turn increasing n, which then increases the Br− concentration; the bromide ion hinders the oscillating reaction. The subsequent increase in the amount of bromide ions results in a decrease in the amplitude. More complicated mechanisms should be explored in future work.

 ,
, 


