Article

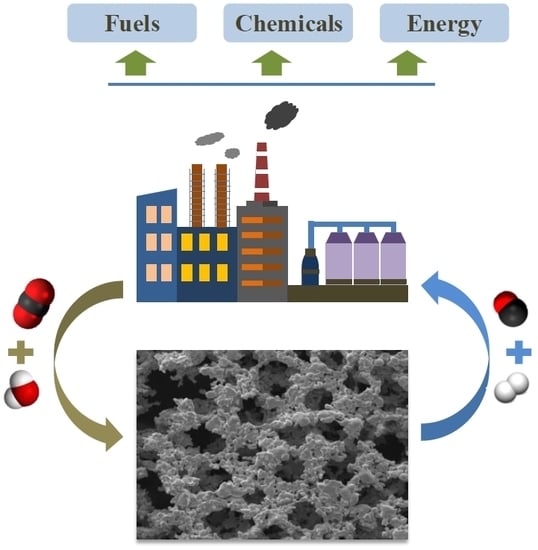
Comparative Study between Pristine Ag and Ag Foam for Electrochemical Synthesis of Syngas with Carbon Dioxide and Water

College of Environmental, Zhejiang University of Technology, Hangzhou 310032, China
*
Author to whom correspondence should be addressed.
Catalysts 2019, 9(1), 57; https://doi.org/10.3390/catal9010057
Submission received: 14 December 2018 / Revised: 1 January 2019 / Accepted: 3 January 2019 / Published: 8 January 2019
(This article belongs to the Special Issue Electro-Catalysts for Energy Conversion and Storage Devices)

Abstract

:
The electrosynthesis of syngas (H2 + CO) from CO2 and H2O can reduce greenhouse gas emissions and address the energy crisis. In the present work, silver (Ag) foam was employed as a catalytic electrode for the electrochemical reduction of CO2 in aqueous solution to design different syngas ratios (H2:CO). In addition to H2 and CO, a small amount of formic acid was found in the liquid phase. By contrast, the planar polycrystalline Ag yields CO, formic acid, methane and methanol as the carbon-containing products. During the potential-controlled electrolysis, the Ag foam displayed a relatively higher activity and selectivity in the electroreduction of aqueous CO2 to CO compared with its smooth surface counterpart, as evidenced by the lower onset potential, higher partial current density and Faradic efficiency at the same bias voltage. Moreover, the electrode remained stable after three successive cycles. Based on the characterization using X-ray diffraction, field-emission scanning electron microscopy, high-resolution transmission electron microscopy, potential step determination and density functional theory calculations, superior performance was credited to the three-dimensional structure of Ag foam constructed with coral-like Ag particles, in which the numerous edge sites are beneficial for the stabilization of the surface adsorbed COOH species and the exposed {111} facets favor the desorption of adsorbed CO species.

Graphical Abstract

1. Introduction

The exponential increase in anthropogenic carbon dioxide (CO2) emissions to the Earth’s atmosphere, has become one of the most urgent problems for the human society [1,2]. Many feasible methods for decreasing the concentration of CO2 in the atmosphere have been carried out, such as CO2 capture, utilization and storage [3,4,5,6,7,8,9]. Among these methods, the conversion of CO2 to useful chemicals with the aid of renewable energy sources (wind, solar, tidal, etc.) plays an important role in addressing current environmental and energy challenges associated with the continued use of fossil fuels [10,11]. However, a major challenge in the implementation of direct renewable energy source-driven CO2 reduction is the intermittency of energy input, leading to a mismatch between energy supply and demand [12]. Since solar energy, as well as wind and tidal energy, can be stored in the form of electricity, the electrochemical reduction of CO2 to value-added chemicals is recognized as a potential way to minimize CO2 emissions and replace fossil fuels [13,14]. In this manner, CO2 can be transformed to various carbon compounds, including CO, methane, formic acid, alcohols and higher molecular weight hydrocarbons, such as oxalic acid [12,15]. In particular, CO, as a main component of syngas, is an attractive product because of the two-electron reduction process of CO2, which seems to provide the best chance for potential industrial application [16,17].
Syngas is a versatile feedstock for producing bulk chemicals and synthetic fuels. The H2:CO ratio in syngas mixtures can be tuned to 0.6, 0.3–1.0 and 2.0 for Fischer−Tropsch synthesis of hydrocarbons, emerging fermentation and short-chain thermochemical and methanol syntheses, respectively [18]. The co-electrolysis of aqueous CO2 is desired for large-scale processes and offers a viable alternative to adjust the syngas mixture composition [19].
One bottleneck in the CO2-water electrochemical reduction to syngas is the preference of the hydrogen evolution reaction (HER). This is because the standard reduction potential for H+/H2O reduction to H2 at pH 7.0 is −0.41 V versus NHE at pH 7.0, higher than that for CO2 electroreduction to CO (−0.53 V vs. NHE at pH 7.0) [13,20]. To overcome this limitation, the selection of a suitable electrode that could selectively produce CO seems to be an effective approach for the controllable preparation of syngas. Gold (Au) and silver (Ag) are the two most favorable metal electrodes, with a preference to reduce CO2 to CO [21]. Compared with Au, Ag is less expensive and thus is considered as a promising metallic material for translating CO2 into a tunable syngas by varying the electrolyzing potential [22]. Another challenge in the electroreduction of CO2 is that the reactor should operate at a current density of at least 100 mA cm−2, while still maintaining the CO Faradic efficiency at > 50% [23]. To this end, numerous efforts have been devoted to resolving the mass transfer and reaction kinetics of the electroreduction of CO2 by improving the electrode, electrolyte and reactor configuration [24,25].
Ag foam is a low density solid with a highly porous structure, providing a large specific area and enabling high permeability. Compared with the flat electrode, the electrons in Ag foam can disperse in a three-dimensional space rather than confined within a two-dimensional space [26]. It is expected that the Ag foam would yield syngas with excellent selectivity at a relatively high current density. Thus, detailed work is required to determine the electroreduction of CO2 in aqueous solution on Ag foam cathodes.
In the current work, we compare the electrochemical performance of Ag foam and pristine Ag in a CO2-saturated KHCO3 solution with a concentration of 0.1 M. The catalytic electrode was characterized using X-ray diffraction (XRD), field-emission scanning electron microscopy (FESEM), transmission electron microscopy (TEM) and potential step determination. The Faradic efficiency (FE), partial current density (PCD) and cyclic use of the electrode were determined via potentiostatic electrolysis. Finally, the possible advantage of Ag foam over pristine Ag was elucidated with the help of density functional theory (DFT) calculations, as well as structural and morphological characterization.

2. Results and Discussion

2.1. Electrode Characterization
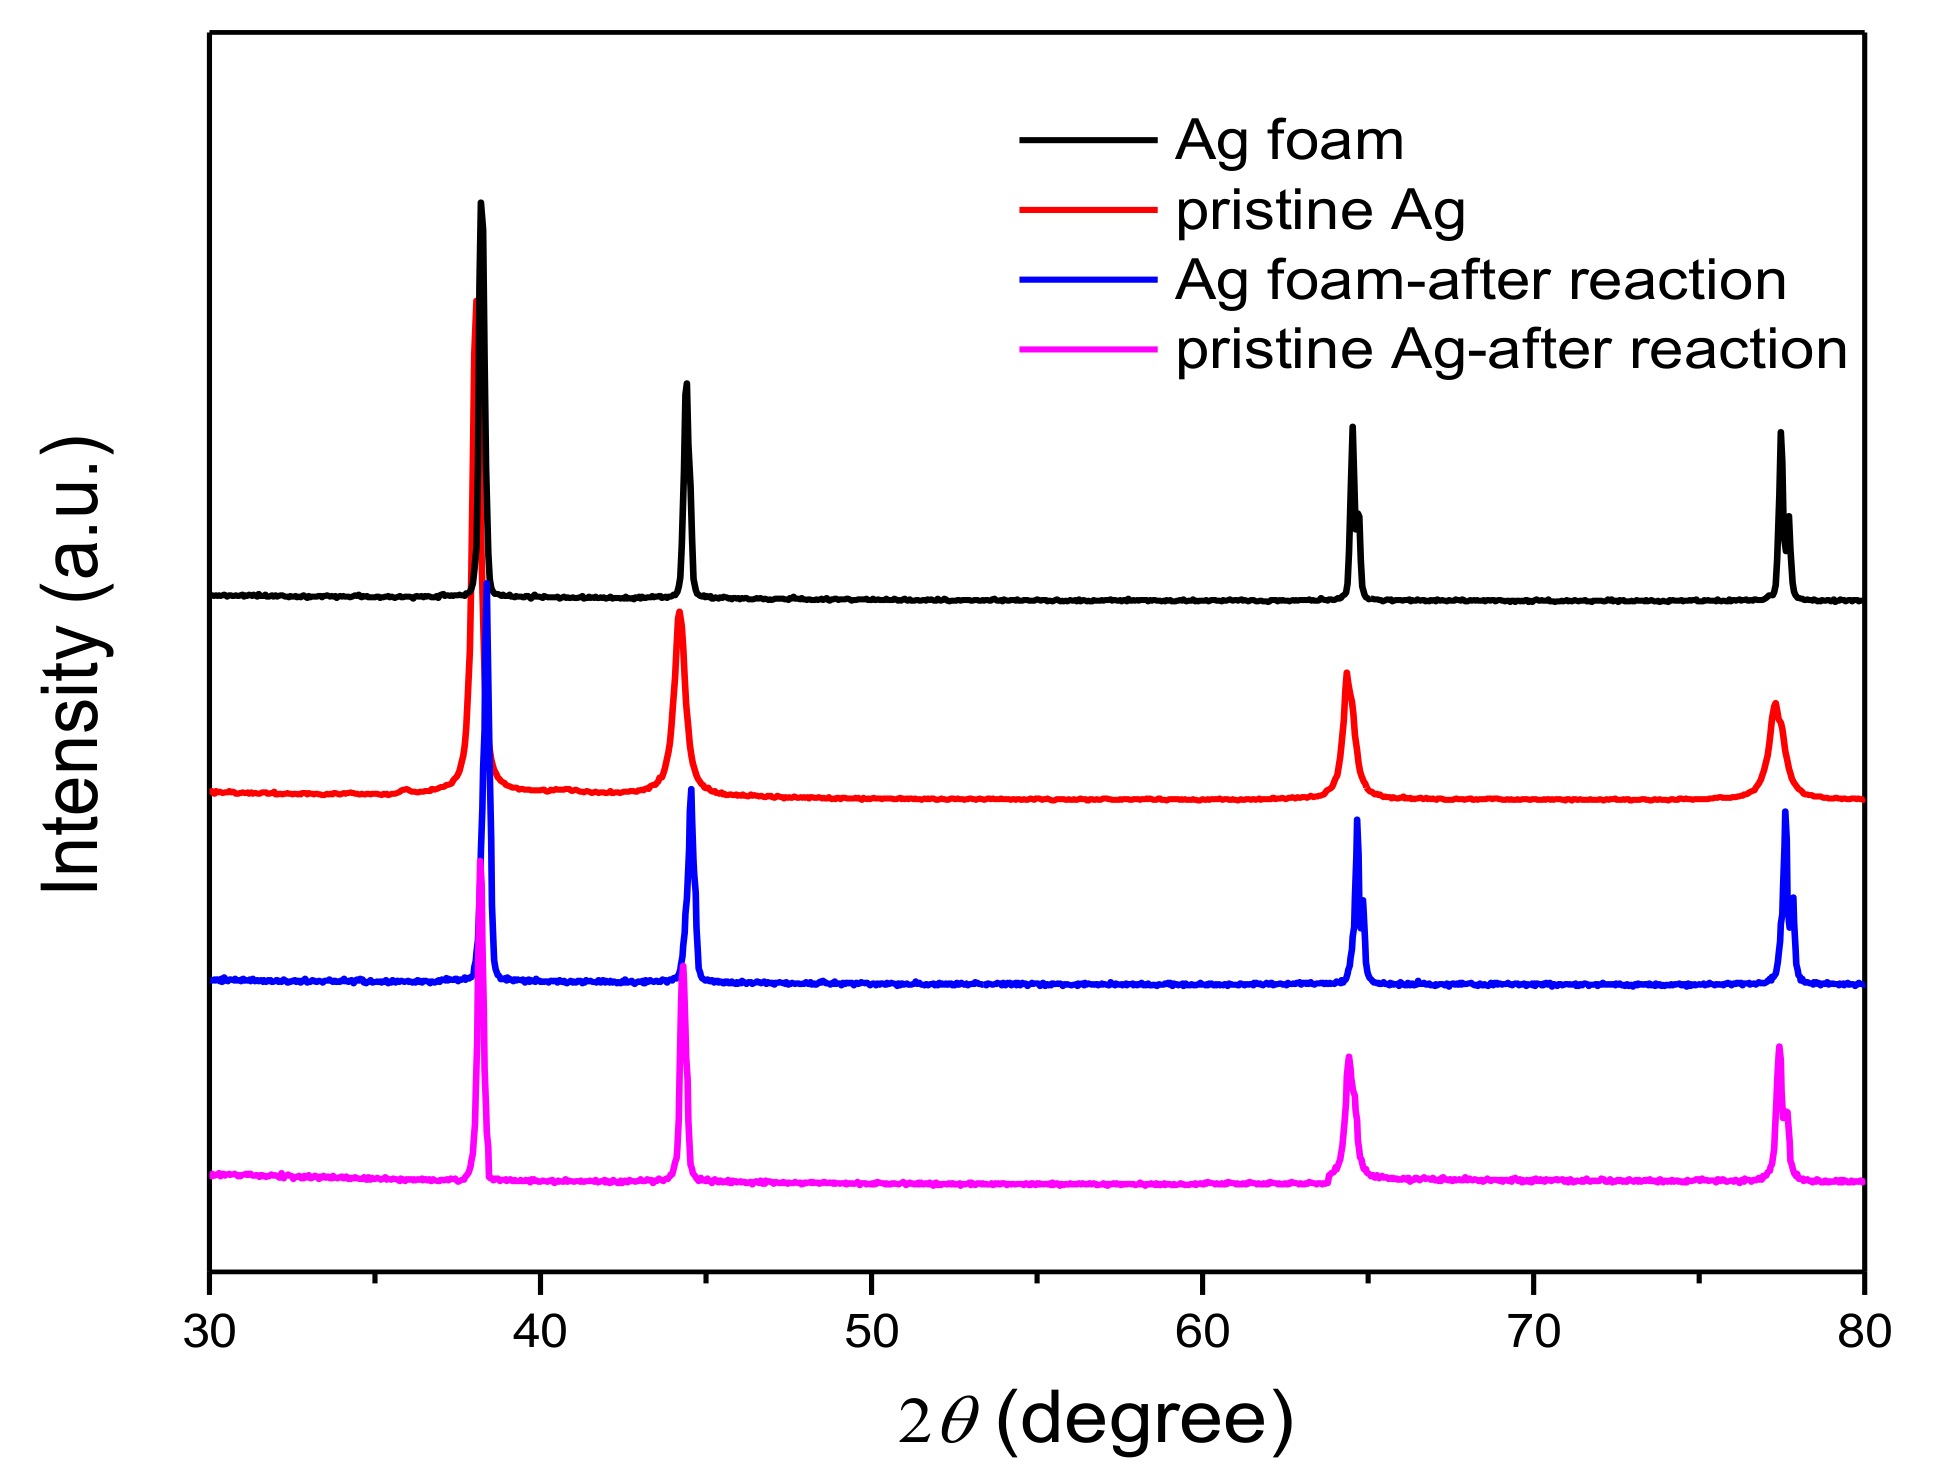
2.1.1. XRD

The crystallographic structure of Ag electrodes was investigated by XRD. All the peaks for the Ag foam and pristine Ag were indexed to the cubic phase of Ag (JCPDS card 01-1167). The peaks at 38.1°, 44.37°, 64.18° and 77.55° corresponded to (111), (200), (220) and (311) diffraction planes. No additional obvious characteristic peak was obtained, suggesting the purity of Ag electrodes. Compared with pristine Ag, the relatively sharp peaks of the Ag foam indicate the high crystallinity of the sample (Figure 1). In addition, 2θ values of peak maxima remained unchanged before and after the reaction either for Ag foam or for pristine Ag, suggesting that the crystal structure of the catalyst was sustained during the electro-reduction of CO2.

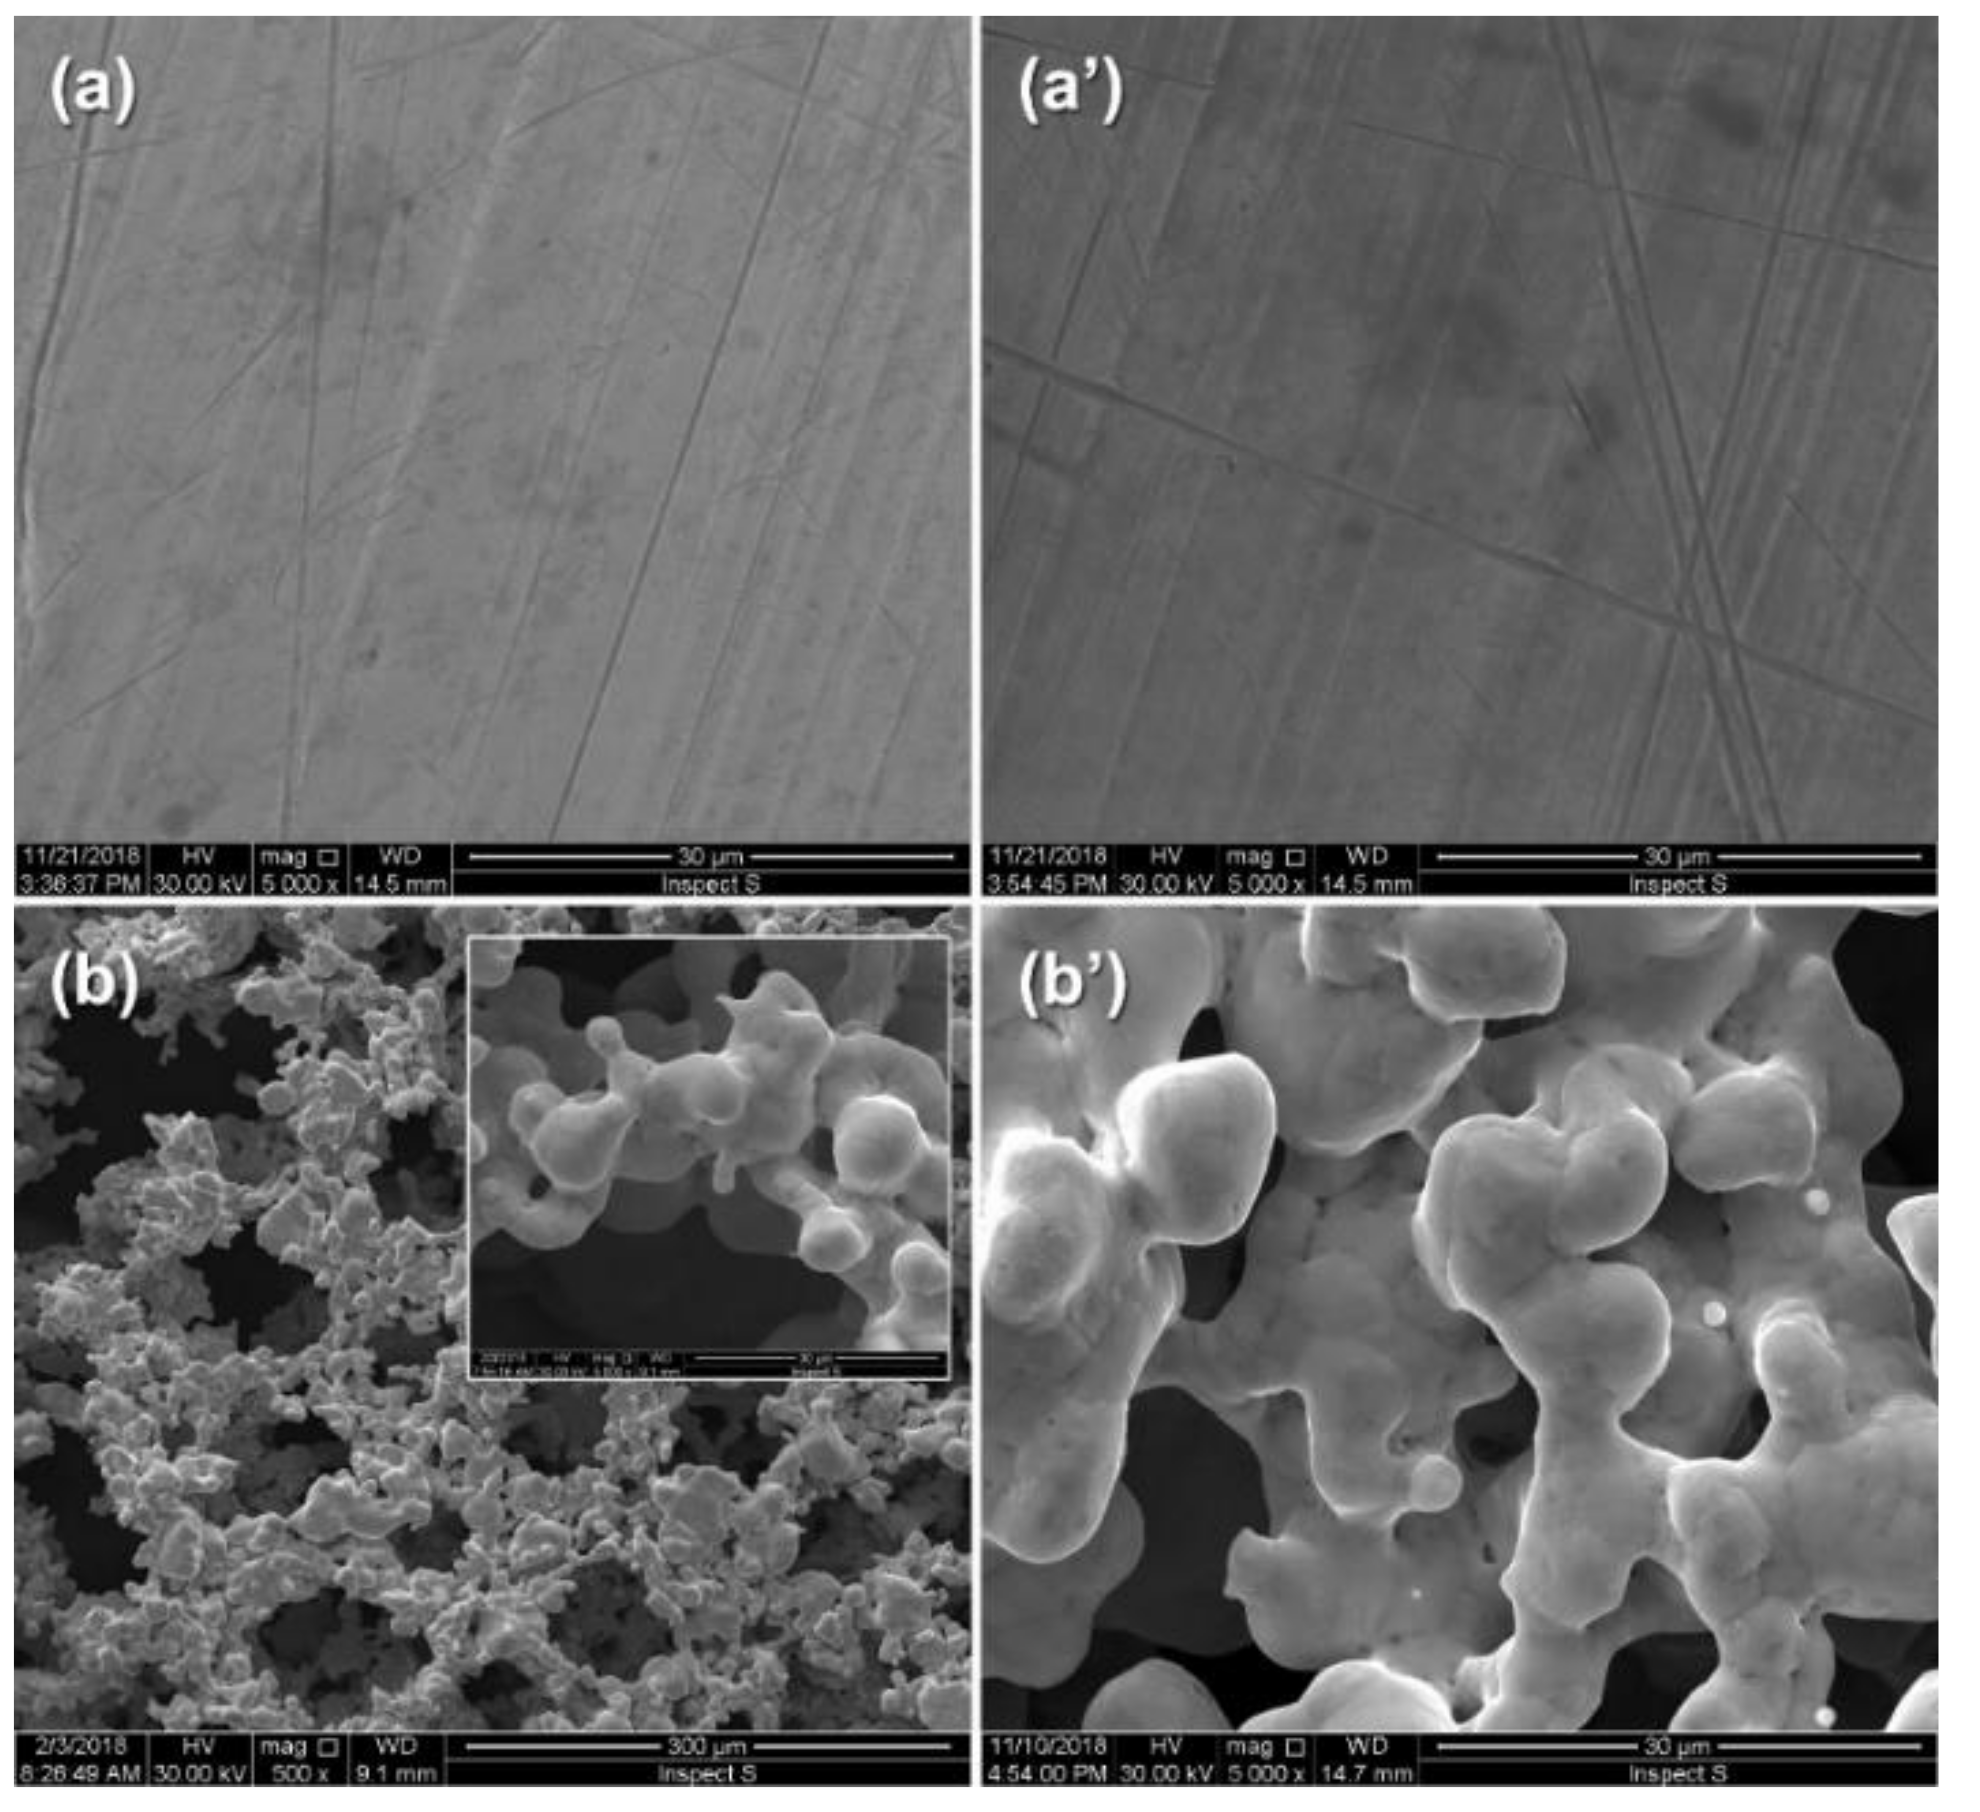
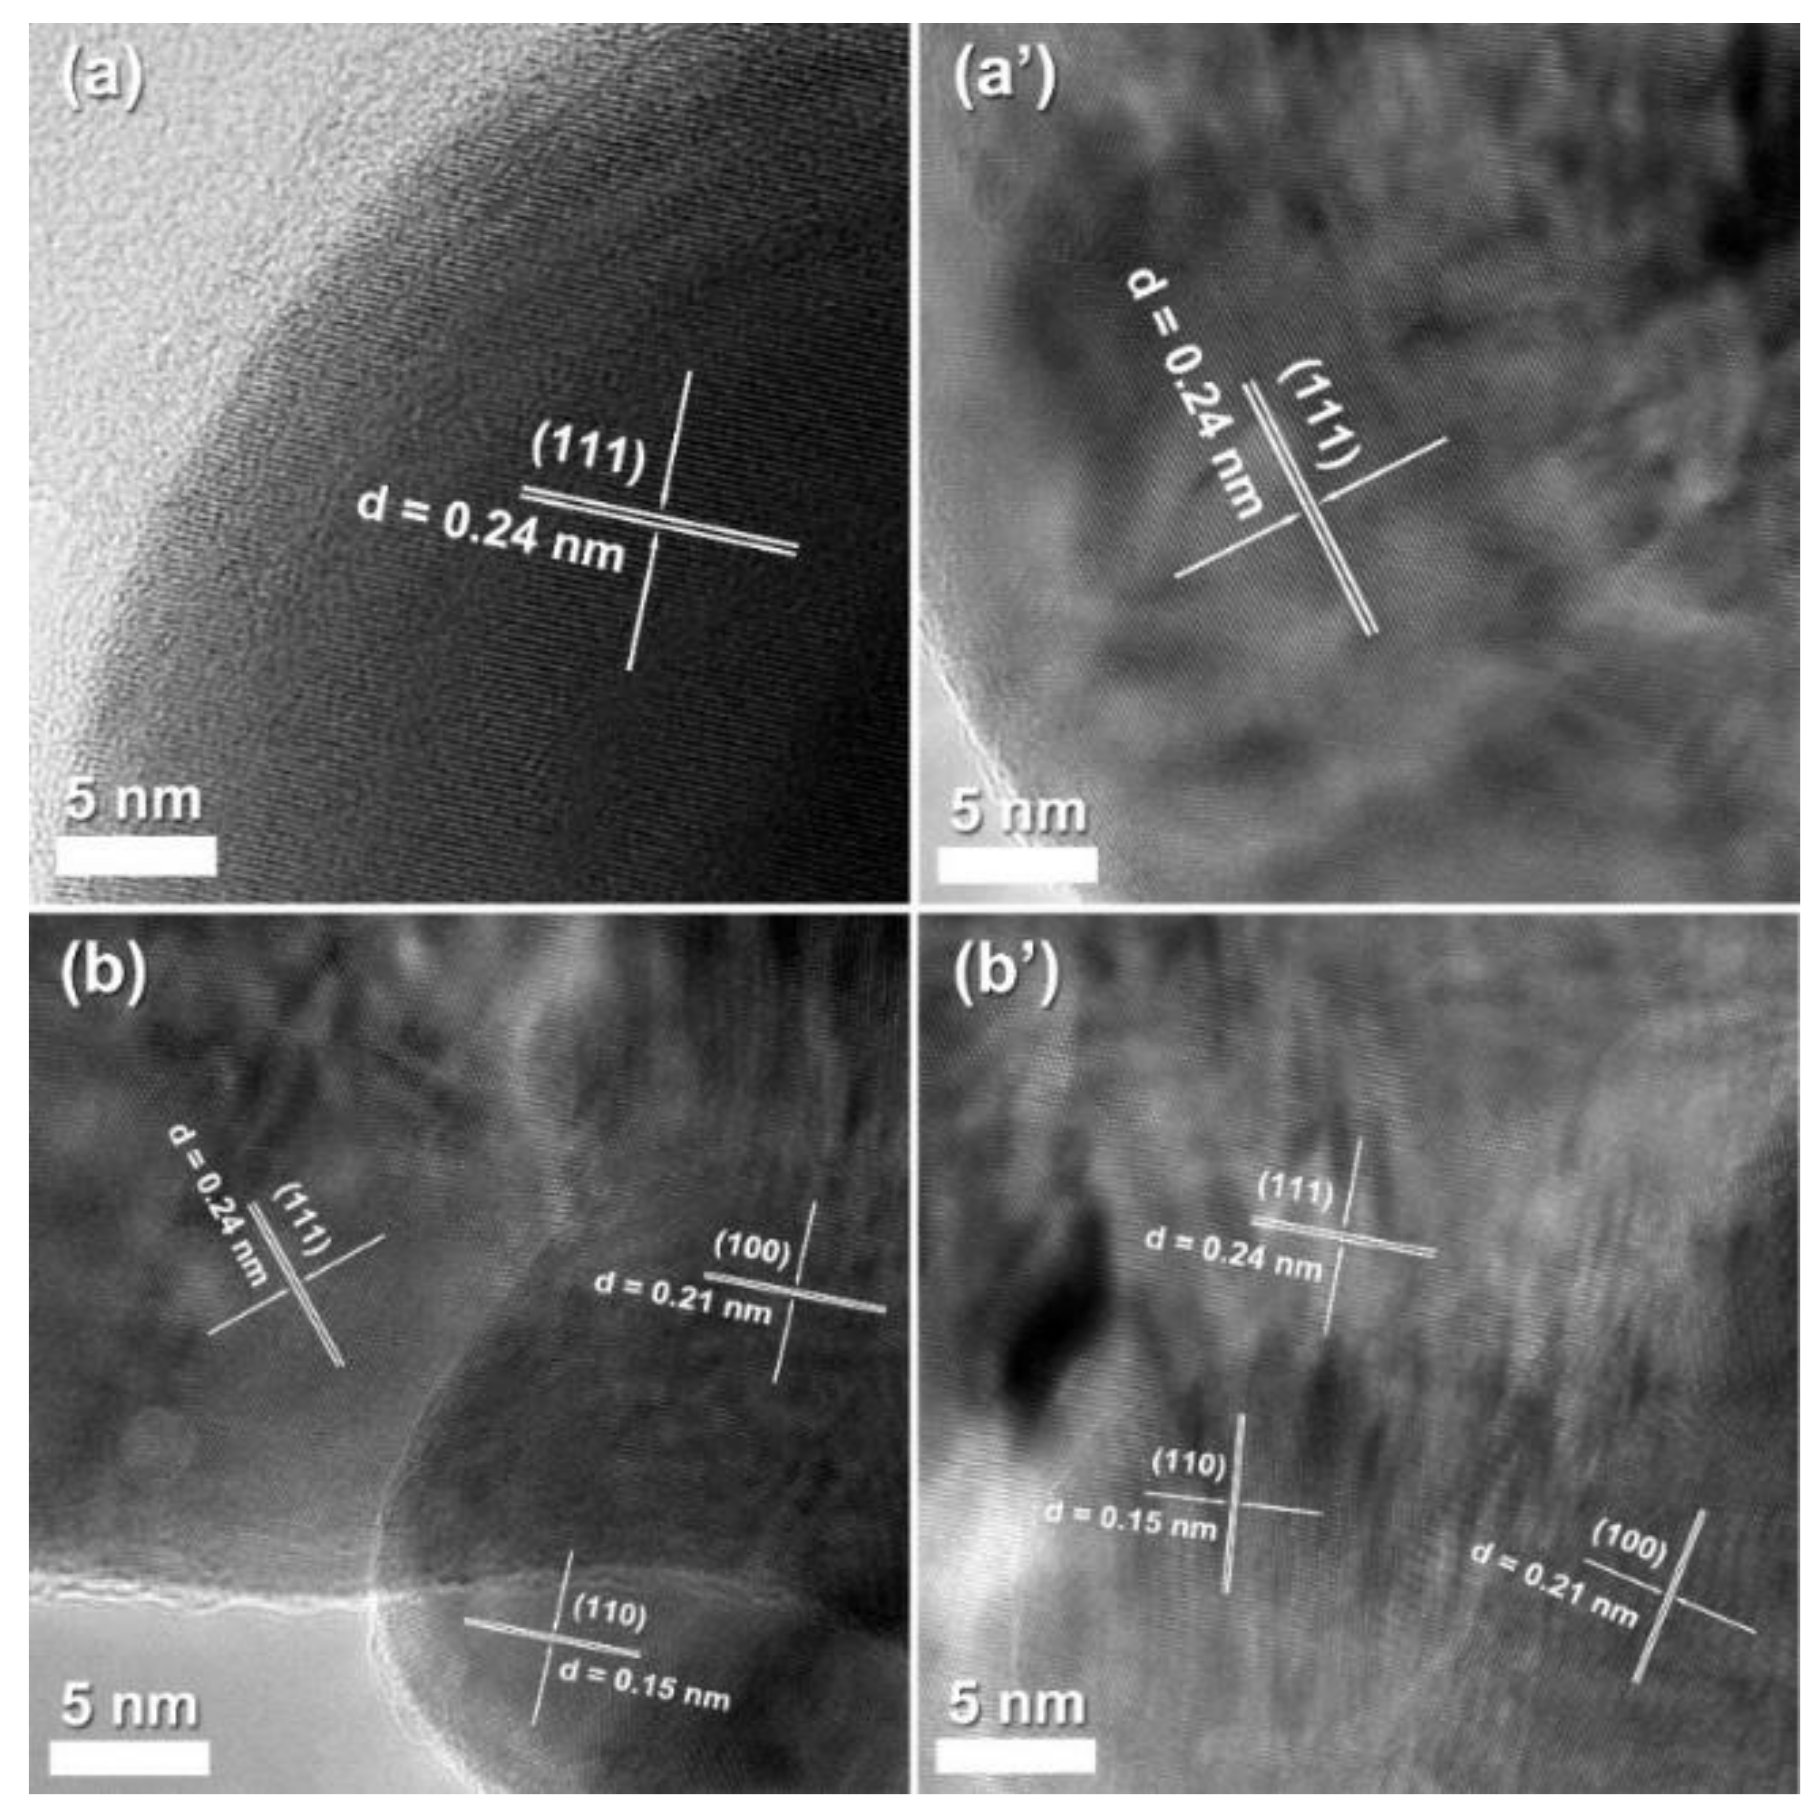
2.1.2. FESEM and High-Resolution TEM (HR-TEM)

The morphology of Ag electrodes was visualized by FESEM. Figure 2a displayed the image of pristine Ag with a rather flat surface and no special morphology. By contrast, a cross-linked grid structure was observed for the Ag foam, as shown in Figure 2b. Furthermore, the typical high magnification scanning electron microscopy (SEM) image of the inset of Figure 2b showed that the Ag foam was constructed of coral-like Ag particles with a particle size of 3–15 μm. Furthermore, it can be observed that the morphology of pristine Ag and Ag foam (Figure 2(a’,b’)) remained unchanged after the reaction, indicating that the electrodes exhibit excellent structural stability.
To gain a deeper understanding, Ag foam and pristine Ag were further analyzed using HR-TEM. As depicted in Figure 3a, the measured d spacing of 0.24 nm in the HR-TEM image corresponds to the (111) plane of Ag and no other lattice fringes were measured [27,28], indicating that the Ag foam was completely bound by {111} facets. Contrarily, in addition to (111) facet, the d-spacing of 0.21 and 0.15 nm in the pristine Ag can be observed in Figure 3b, corresponding to the (100) and (110) facet, respectively. In other words, the surface of pristine Ag was enclosed by a mix of {111}, {100} and {110} facets. It is worthwhile noting that no obvious change in exposed facet was found for the fresh and spent electrodes. These results demonstrated that the facet restructure induced by the electro-reduction process hardly occurred.

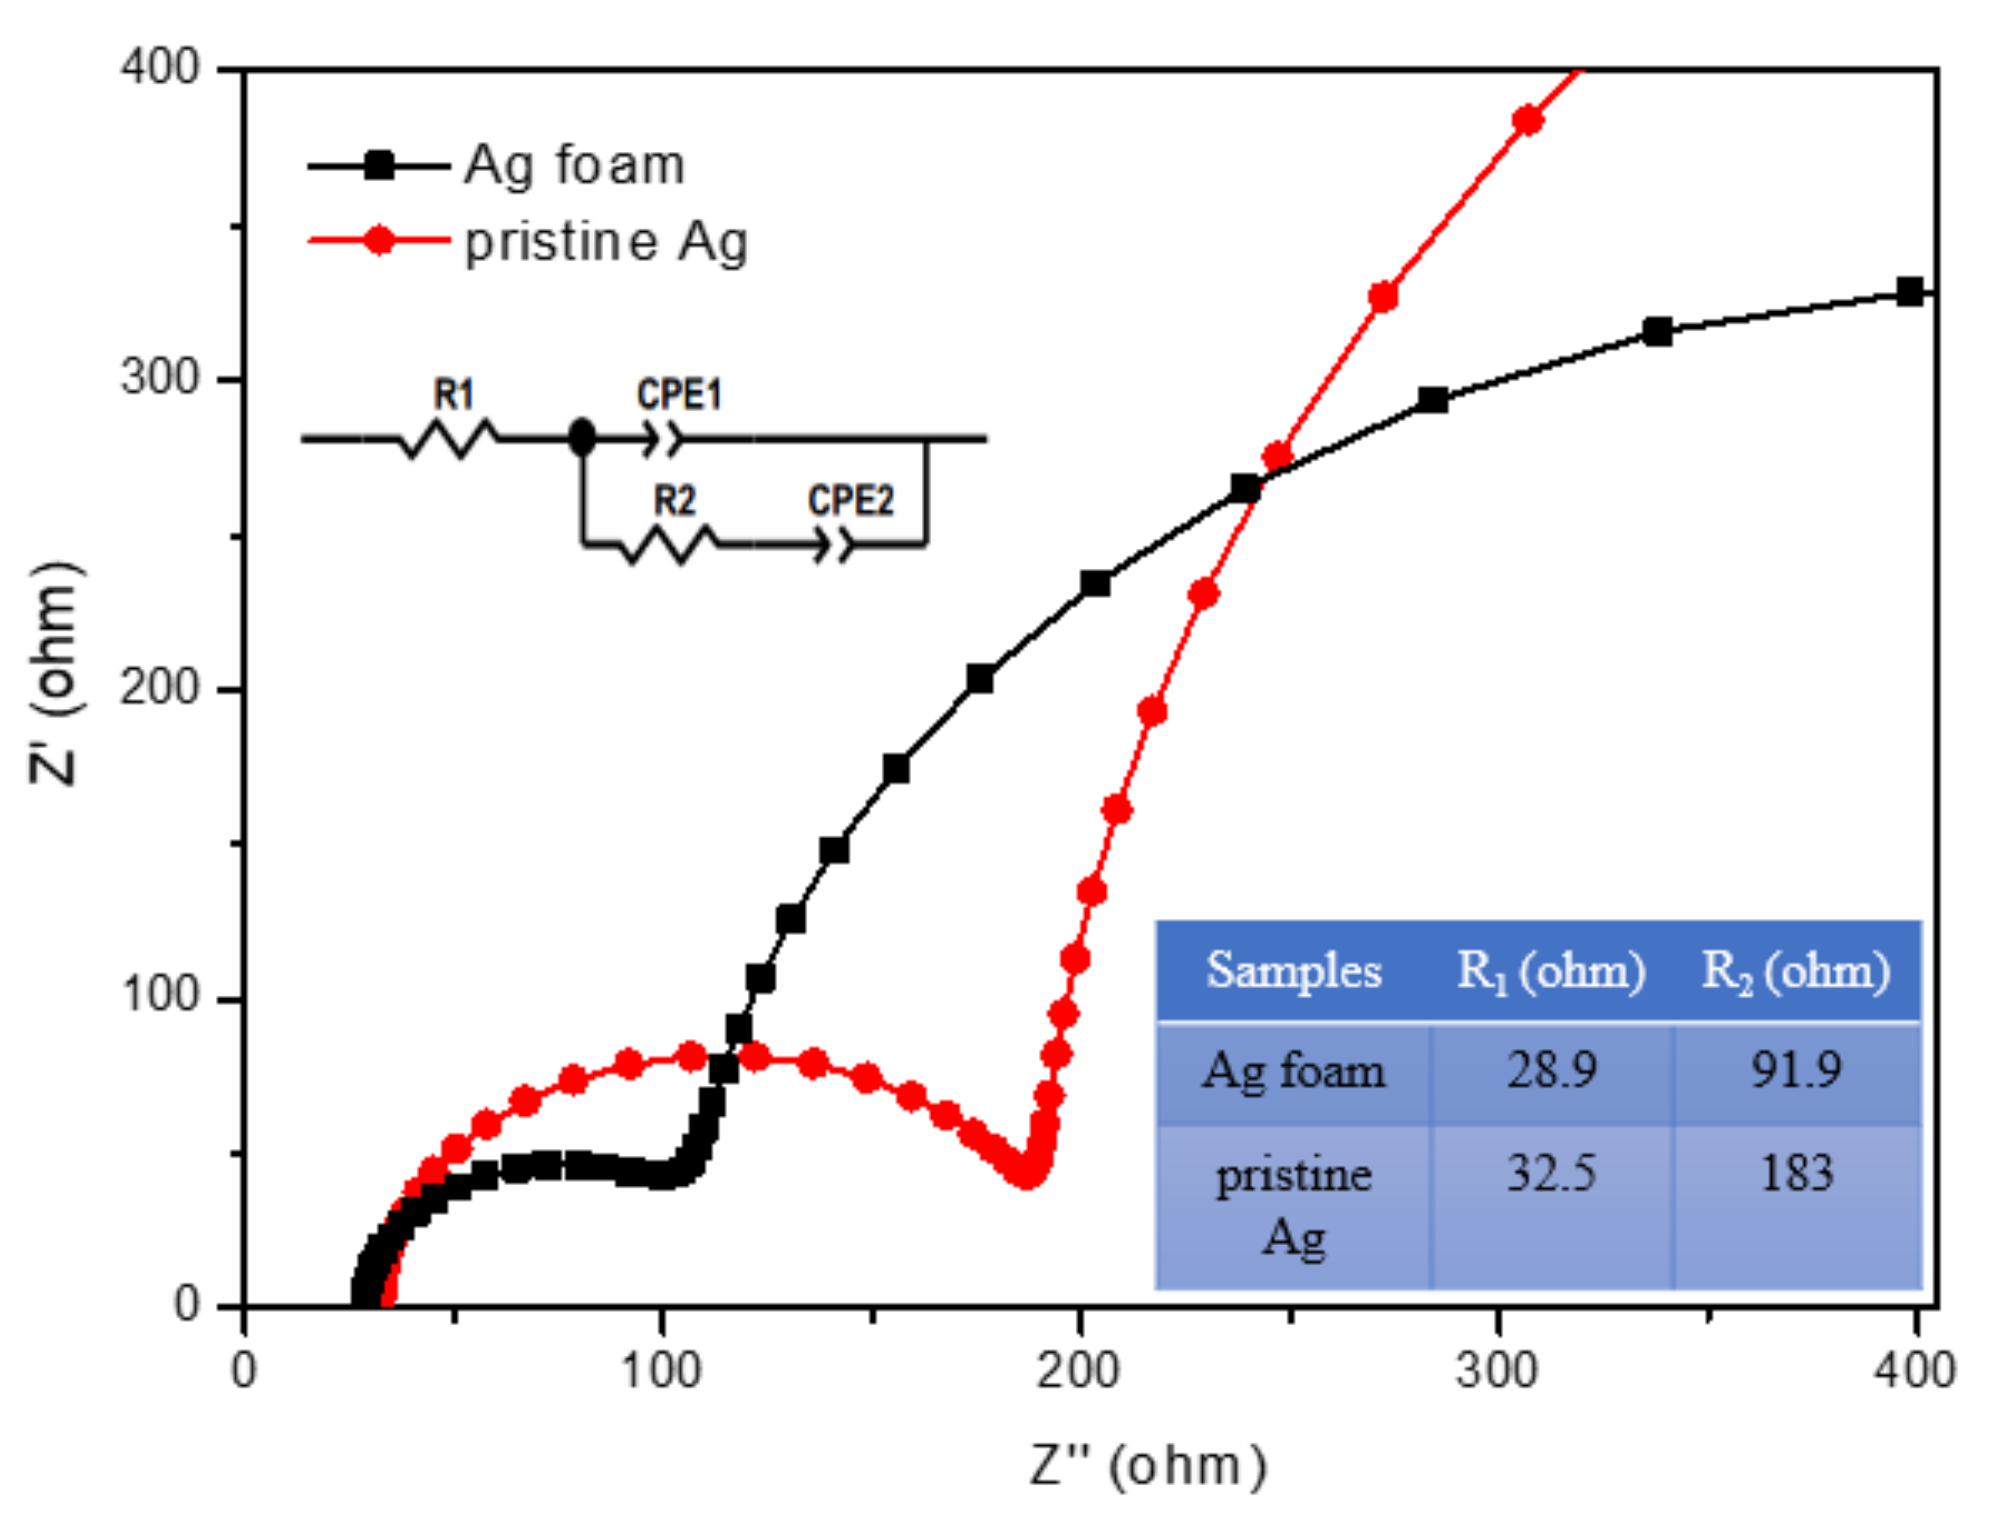
2.1.3. Roughness Factor and Uncompensated Solution Resistance

The electrochemical area of the electrodes was evaluated by calculating the roughness factor. The roughness factor values for pristine Ag and Ag foam were calculated to be 33.4 and 44.5 cm2 cm−2, respectively. Obviously, the former is slightly less than the latter. It should be noted that the pore size at the range of <2.0 nm (micropores) and 2–50 nm (mesopores) contribute mostly to the specific surface area of a material. In this work, the Ag foam electrode contained large amount of pores in micrometer level. Therefore, the roughness factor of the Ag foam was not obviously greater than that of pristine Ag.
Figure 4 presents the Nyquist plots of Electrochemical Iimpedance Spectroscopy (EIS) for the Ag foam and pristine Ag. The Ru of pristine Ag and Ag foam, derived from the fitting with ZView software (version 3.3, Scribner Associates, Southern Pines, NC, USA), was 28.9 and 32.5 ohm, respectively.

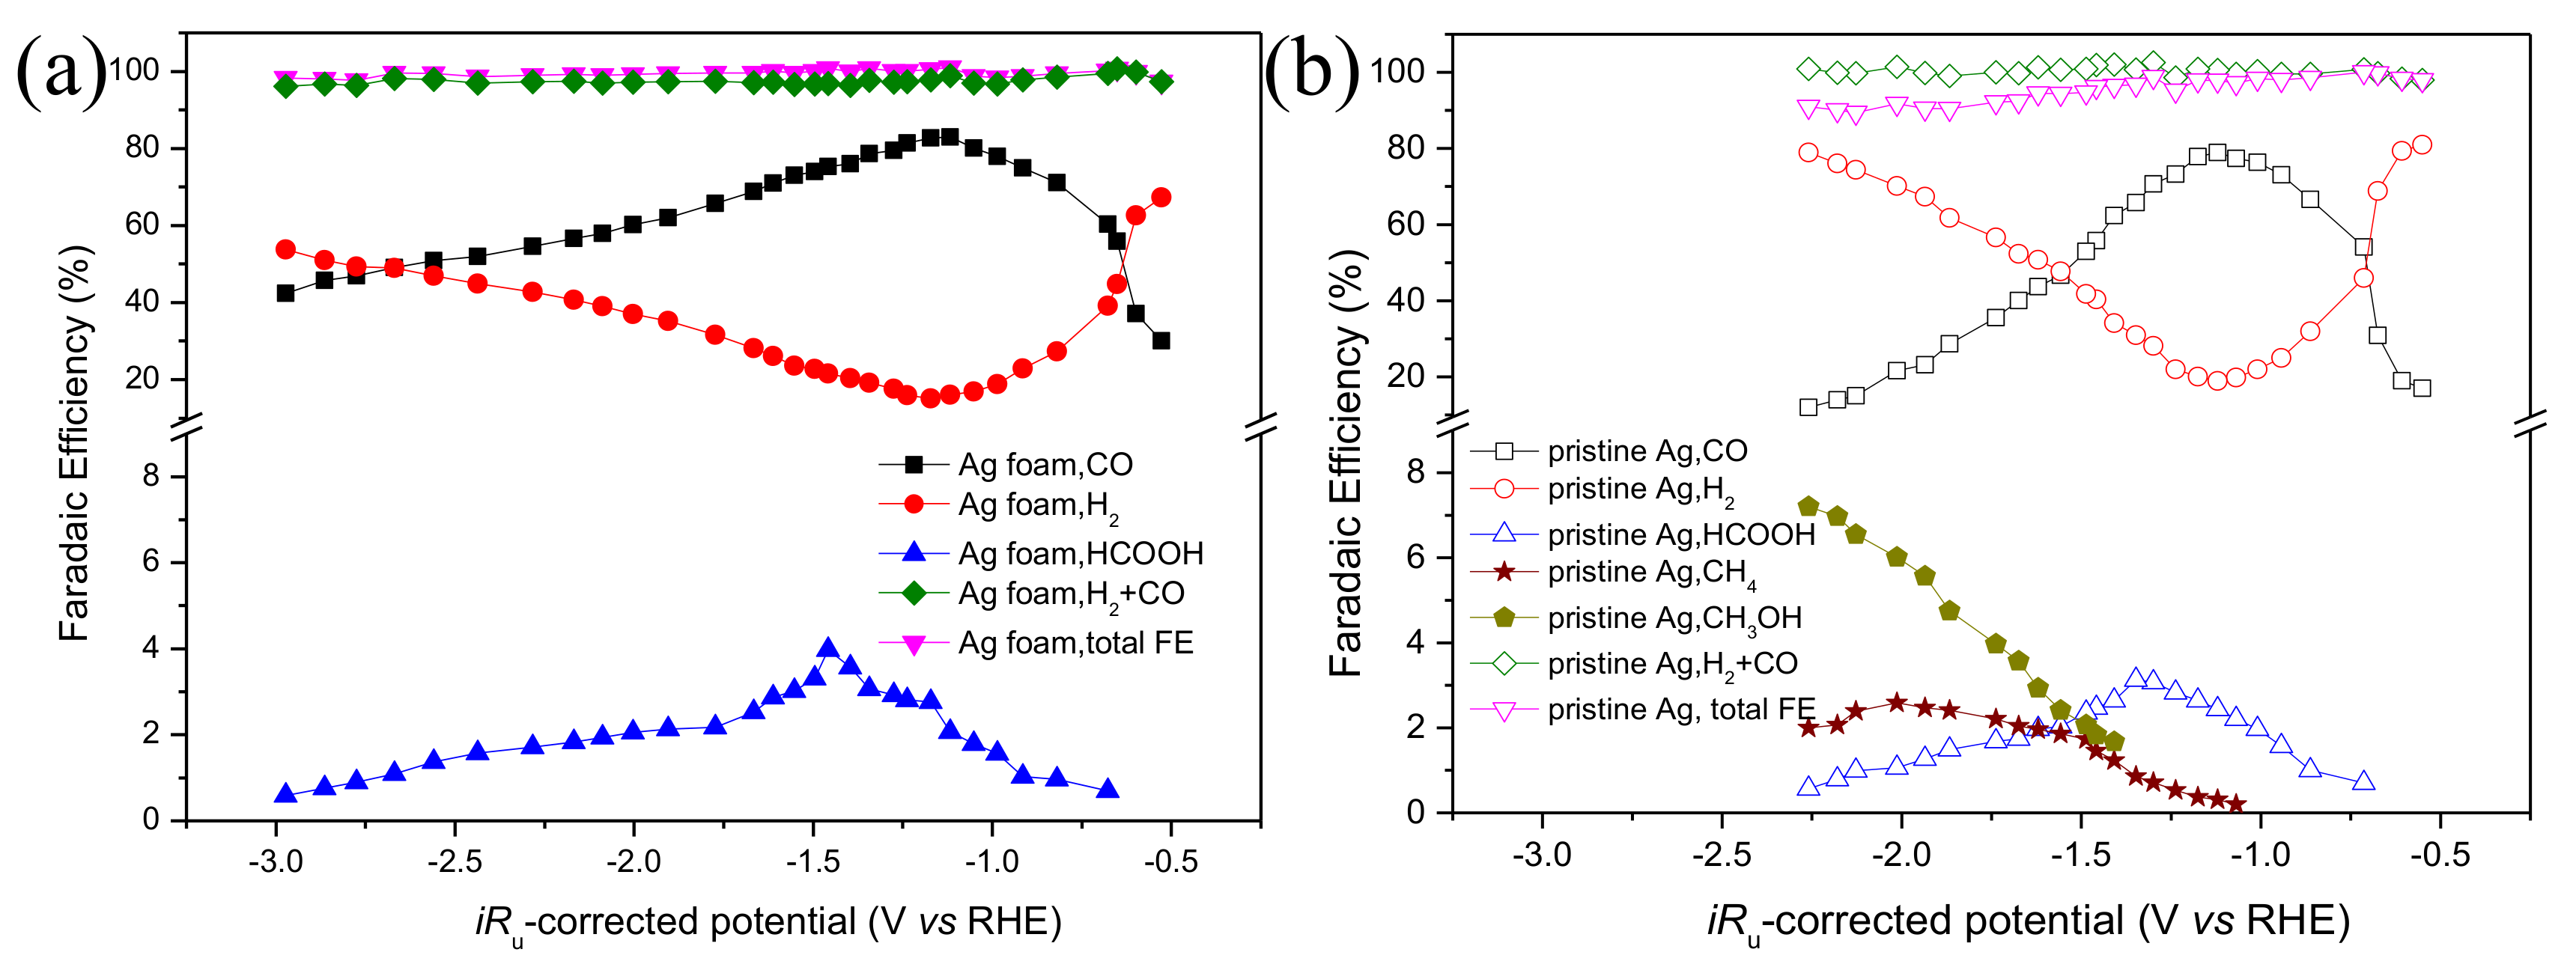
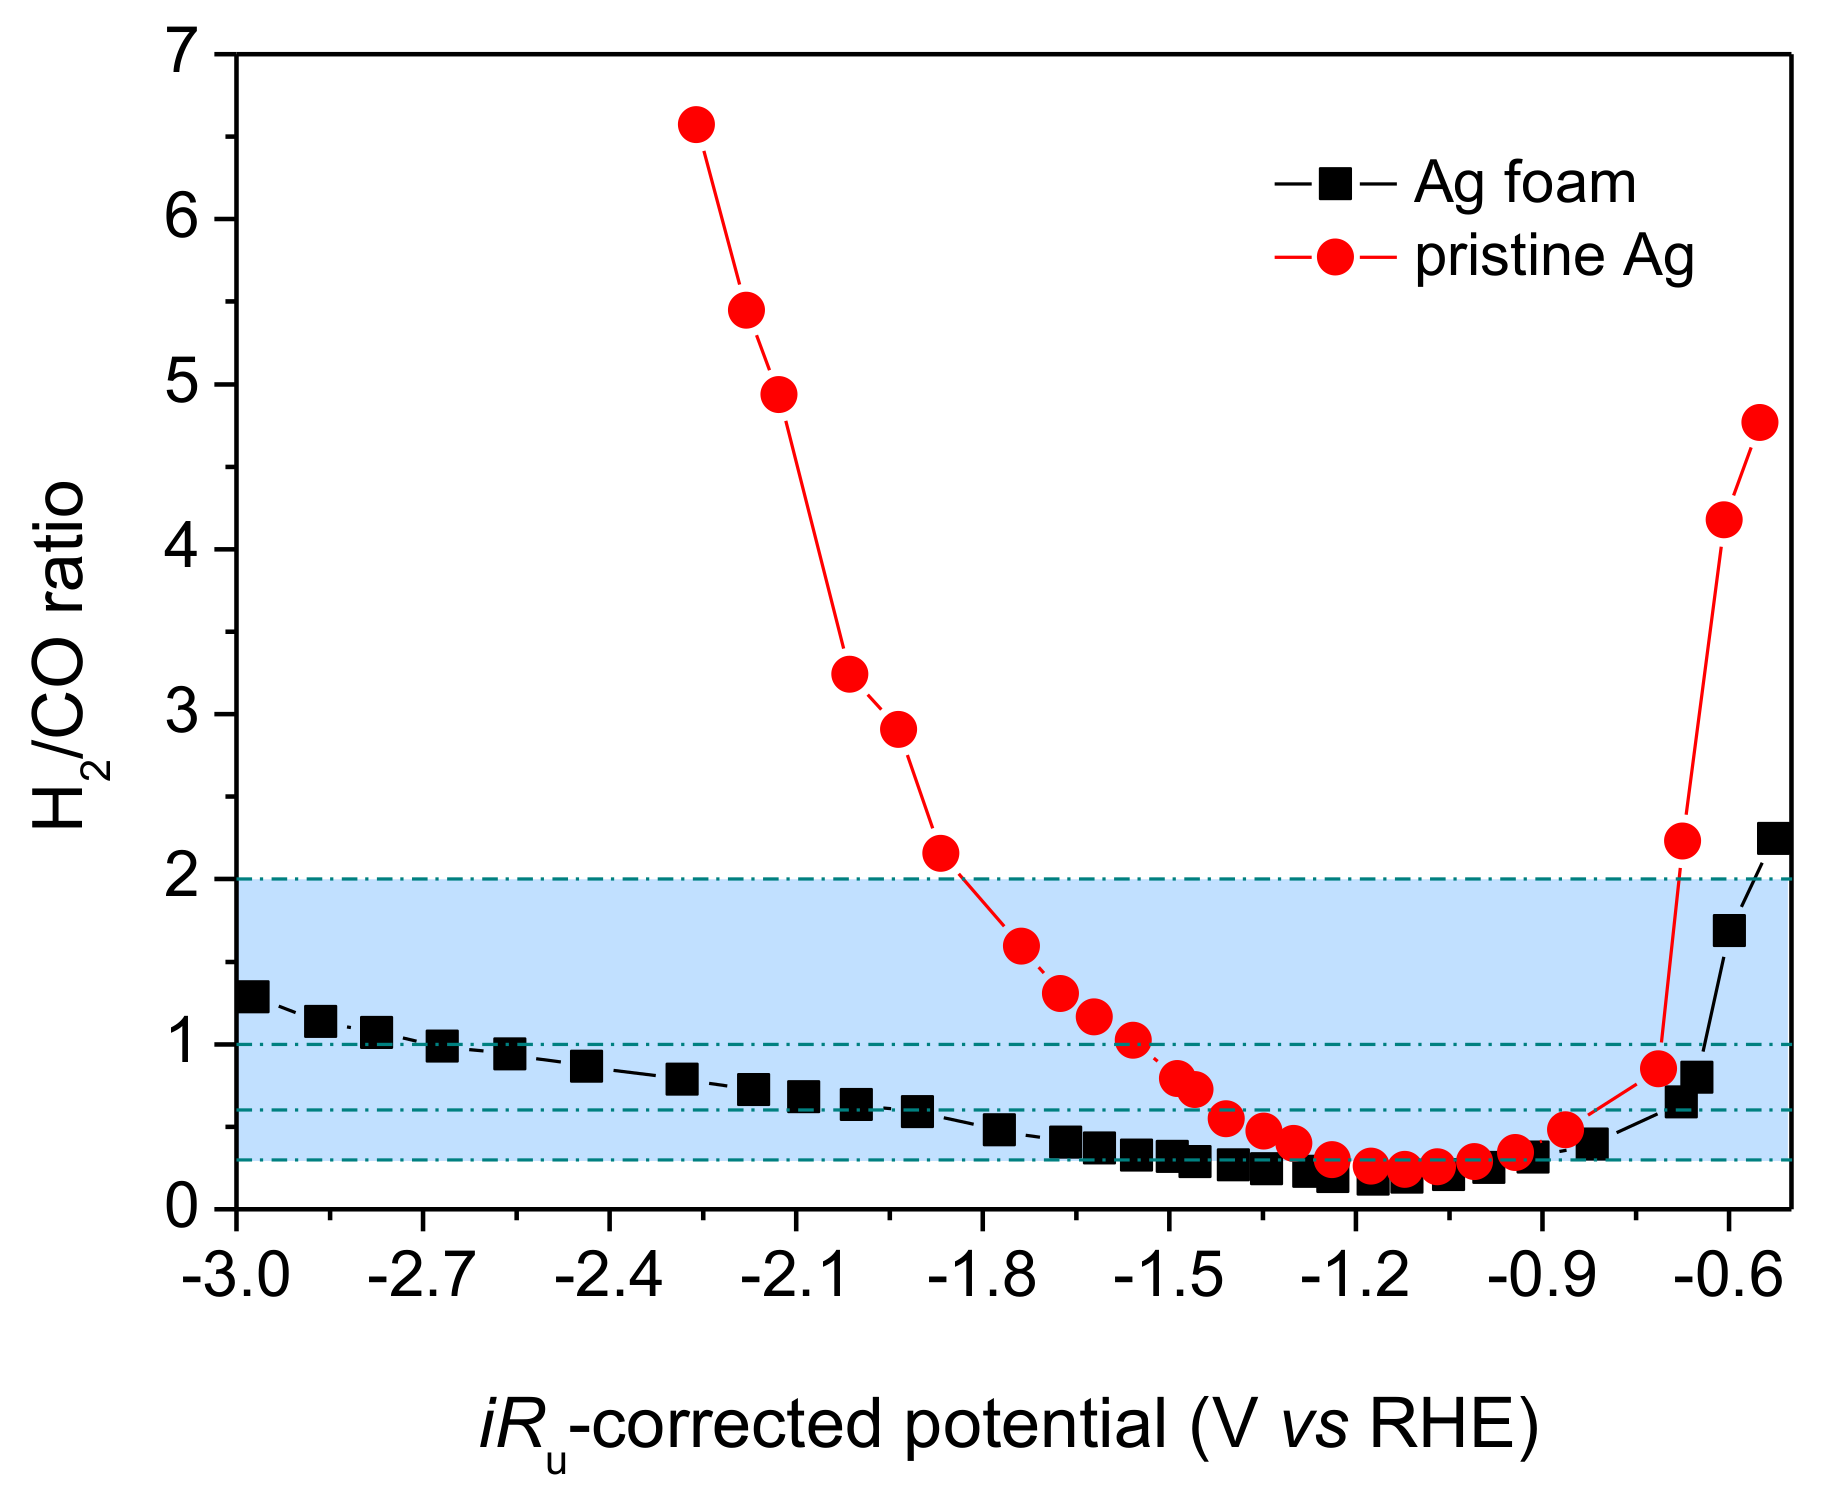
2.2. Electrode Selectivity

The applied potential is usually used for controlling the selectivity of an electrochemical reaction. The FE was examined to investigate the effect of applied potential on the overall CO2 conversion process. A typical variation in FE of CO, methane, formic acid, methanol and H2 as a function of potential is shown in Figure 5a,b, in which the potentials ranged from −0.53 to −2.97 V for Ag foam and −0.56 to −2.26 V for pristine Ag. It can be seen that Ag foam produces CO and H2 as major products, accompanied by less solution phase product of formic acid over the entire investigated potential range. Different to pristine Ag, in addition to H2, CO and formic acid, methane and methanol were accurately detected when the potential was greater than −1.07 and −1.41 V, respectively. During the electroreduction of CO2 in aqueous solution, the HER inevitably occurred as hydrogen evolution becomes thermodynamically possible at 0 V versus RHE (at any pH) [20,29,30,31]. Consequently, the HER would compete with the CO2 reduction at all negative potentials. The evolved H2 combining with the major product CO became the main composition of so-called syngas [12,15,18,19,22,32,33,34]. For both electrodes, the total calculated FE of (H2 + CO) gaseous products was above 90% and other products, such as formic acid, methane and methanol, accounted for no more than 10% of the total FE. In other words, the Ag electrode seems to be a proper alternative for supplying syngas via the electroreduction of aqueous CO2.
For Ag foam, CO and formic acid were detected at the starting potentials of −0.53 and −0.68 V, respectively. Methane or methanol was not detected in this work. FECO and FEHCOOH showed maximum values of 82.9% at −1.12 V and 4.0% at −1.46 V in the potential range of −0.53–−2.97 V. The pristine Ag afforded different onset potentials with respect to Ag foam, which were −0.56 and −0.72 V for CO and formic acid, respectively. The variation in FECO and FEHCOOH with applied potential exhibited a trend similar to that for Ag foam with maximum values of 79.0% and 3.1% at −1.12 and −1.35 V, respectively. Obviously, the onset potential for the reduction of CO2 to CO and formic acid on Ag foam shifted ~30 and ~40 mV and was more positive than that on pristine Ag, suggesting that the Ag foam electrode was more active than the polycrystalline Ag electrode.
It should be noted that the onset potential for CO, formic acid, methanol and methane formation on the pristine Ag electrode was at variance with the trend in their redox potentials. The redox potentials of the two-electron reduction of CO2 to form CO or formic acid, the six-electron reduction of CO2 to methanol and the eight-electron reduction of CO2 to methane are −0.53, −0.42, −0.38 and −0.24 V, respectively [22,27,33,35,36,37]. Therefore, the CO2 electrochemical reduction reaction was truly under kinetic control compared with thermodynamic control in this study.
Greater differences in the CO2 reduction selectivity between Ag foam and pristine Ag were observed at the potential window for providing synthetic gas (H2 + CO). From Figure 6, it can be seen that an increased H2 to CO ratio was obtained at more negative potentials. This is because the mass transfer of CO2 molecules from the bulk solution to the electrode surface dominated the CO2 electroreduction process with gradually increasing overpotentials, whereas the water reduction to H2 was rarely mass transfer limited. As an example, if we want to obtain syngas with a H2:CO ratio of 0.3–1.0 (corresponding to 50.0–76.9% selectivity of CO), the potential ranges would be approximately −0.65–−2.77 V and −0.72–−1.56 V for Ag foam and pristine Ag, respectively. Obviously, Ag foam afforded a wider potential window than pristine Ag in the electrochemical reduction of aqueous CO2 to syngas.
The electrochemical reduction of CO2 on the Ag electrode proceeded via a series of steps as follows:
Step 1: CO2 (g) + H+ (aq) + e + * → *COOH
Step 2: *COOH + H+ (aq) + e → *CO + H2O (l)
Step 3: *CO → CO (g) + *
*COOH and *CO are important intermediates during the reduction of CO2 [21,22,24,32,38,39,40]. The binding energy of reaction intermediate plays a vital role in the reaction selectivity [41]. Therefore the binding energy of COOH and CO on different Ag surfaces were calculated and summarized in Table 1. As shown in Table 1, COOH binds the strongest with Ag(100), followed by Ag(110) and Ag(111) surfaces. The strong interaction of COOH on Ag surfaces allowed COOH to stay on the surface and undergo the following reaction steps, which would facilitate the formation of *CO. However, as shown in Table 1, Ag(100) and Ag(110) present strong binding energy of CO among the three Ag surfaces, preventing the desorption of CO from Ag(100) and Ag(110) surface. Different from the case on Ag(110) and Ag(100), once *CO was formed, it would desorb from the Ag(111) surface rapidly due to its weak binding energy on this surface, leading to a higher reaction selectivity on Ag(111).
In addition, the number of edge sites and corner sites of Ag is another factor influencing the CO2 reduction reaction. The catalytic activity of Ag differed significantly with active sites of edge, corner and facet, in the order of edge > corner> facet [21,38,42]. The Ag foam consisted of coral-like particles on the micrometer scale, providing more low-coordinated edge and corner atoms than pristine Ag for CO2 electroreduction. This property combined with the positive effect of Ag(111) facets for liberating *CO from the surface resulted in higher selective reduction of CO2 to syngas by Ag foam than pristine Ag.

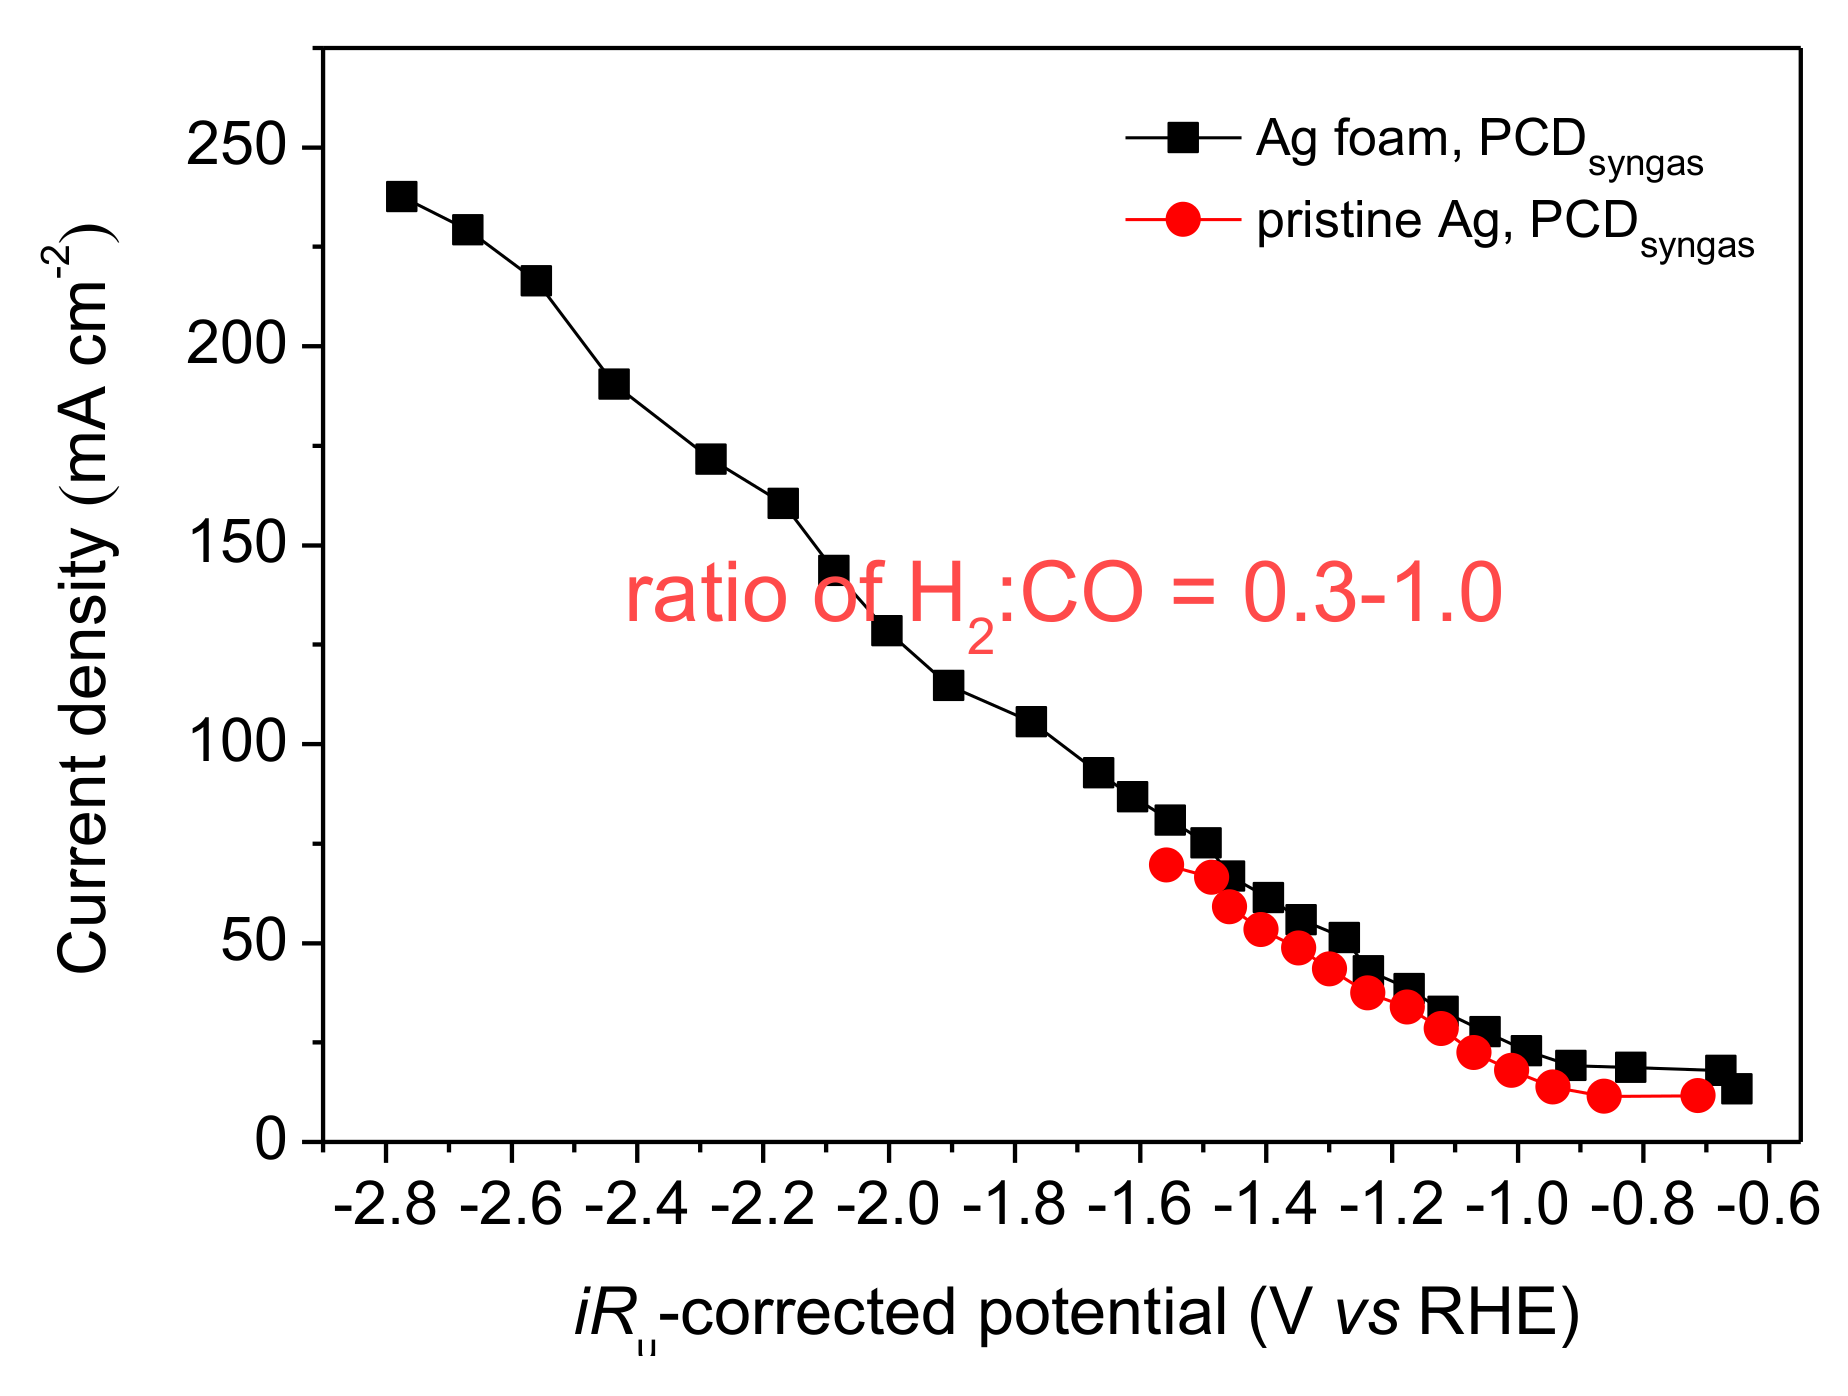
2.3. Electrode Activity

The catalytic activity of the electrochemical reduction of CO2 can be compared by the current density. In Figure 7a,b, the PCDCO, PCDH2, PCDsyngas (PCDCO + PCDH2) and the total current density are plotted as a function of cathode potential. Obviously, the total current density gradually increased with increasing applied negative potential for pristine Ag and Ag foam electrodes. In addition, Ag foam displayed ~1.2-fold higher total current density compared with pristine Ag in the range investigated.
At a H2:CO molar ratio of 0.3–1.0, PCDsyngas of pristine Ag and Ag foam showed a similar increasing trend with negatively shifted the electrolysis voltage, as shown in Figure 8. Pristine Ag produced the maximum current density of 69.58 mA cm−2 at −1.56 V, at the same current density, the potential on the Ag foam cathode was shifted positively by 180 mV. As a consequence, Ag foam displayed an elevated preference for the electroreduction of CO2 to syngas. It should be noted that the maximum current density of 237.58 mA cm−2 for PCDsyngas production was reached on Ag foam at a potential of −2.77 V, which was ~3.4-fold greater than that observed on pristine Ag (69.58 mA cm−2 at −1.56 V). Therefore, Ag foam resulted in a much higher current density in the electrochemical reduction of CO2 to CO and thus seems to be a promising electrode with great potential for industrial applications.
To exclude the influence of surface area, the values of the PCD per unit of electrochemical surface area of electrode were calculated and the results are shown in Table 2 and Figure 9. As one of the components of syngas, CO was produced on Ag foam with a SA greater than that on pristine Ag. Consequently, the intrinsic properties other than surface area, such as exposed crystal faces, edges and corner sites, contributed to the improved activity of the electroreduction of CO2 to CO.
As discussed previously, Ag(111) is a suitable electrocatalyst for stabilizing *COOH and liberating *CO. Furthermore, the edge sites of Ag would enhance the activation of CO2 to *COOH. Consequently, the Ag foam electrode with fully exposed {111} facets and more edge sites, in comparison with polycrystalline pristine Ag electrode, quickly reduced CO2 to *COOH and *CO and released *CO from the electrode surface in the form of CO. A comparison of the activity and selectivity achieved with these Ag electrocatalysts with previous references is provided in Table 3. It demonstrated that the performance of Ag foam have a superior activity and comparable selectivity of CO production to similar reported materials [7,27,30,39,42,43]. In other words, the Ag foam afforded a higher PCDsyngas than pristine Ag in the aqueous electrochemical reduction of CO2.

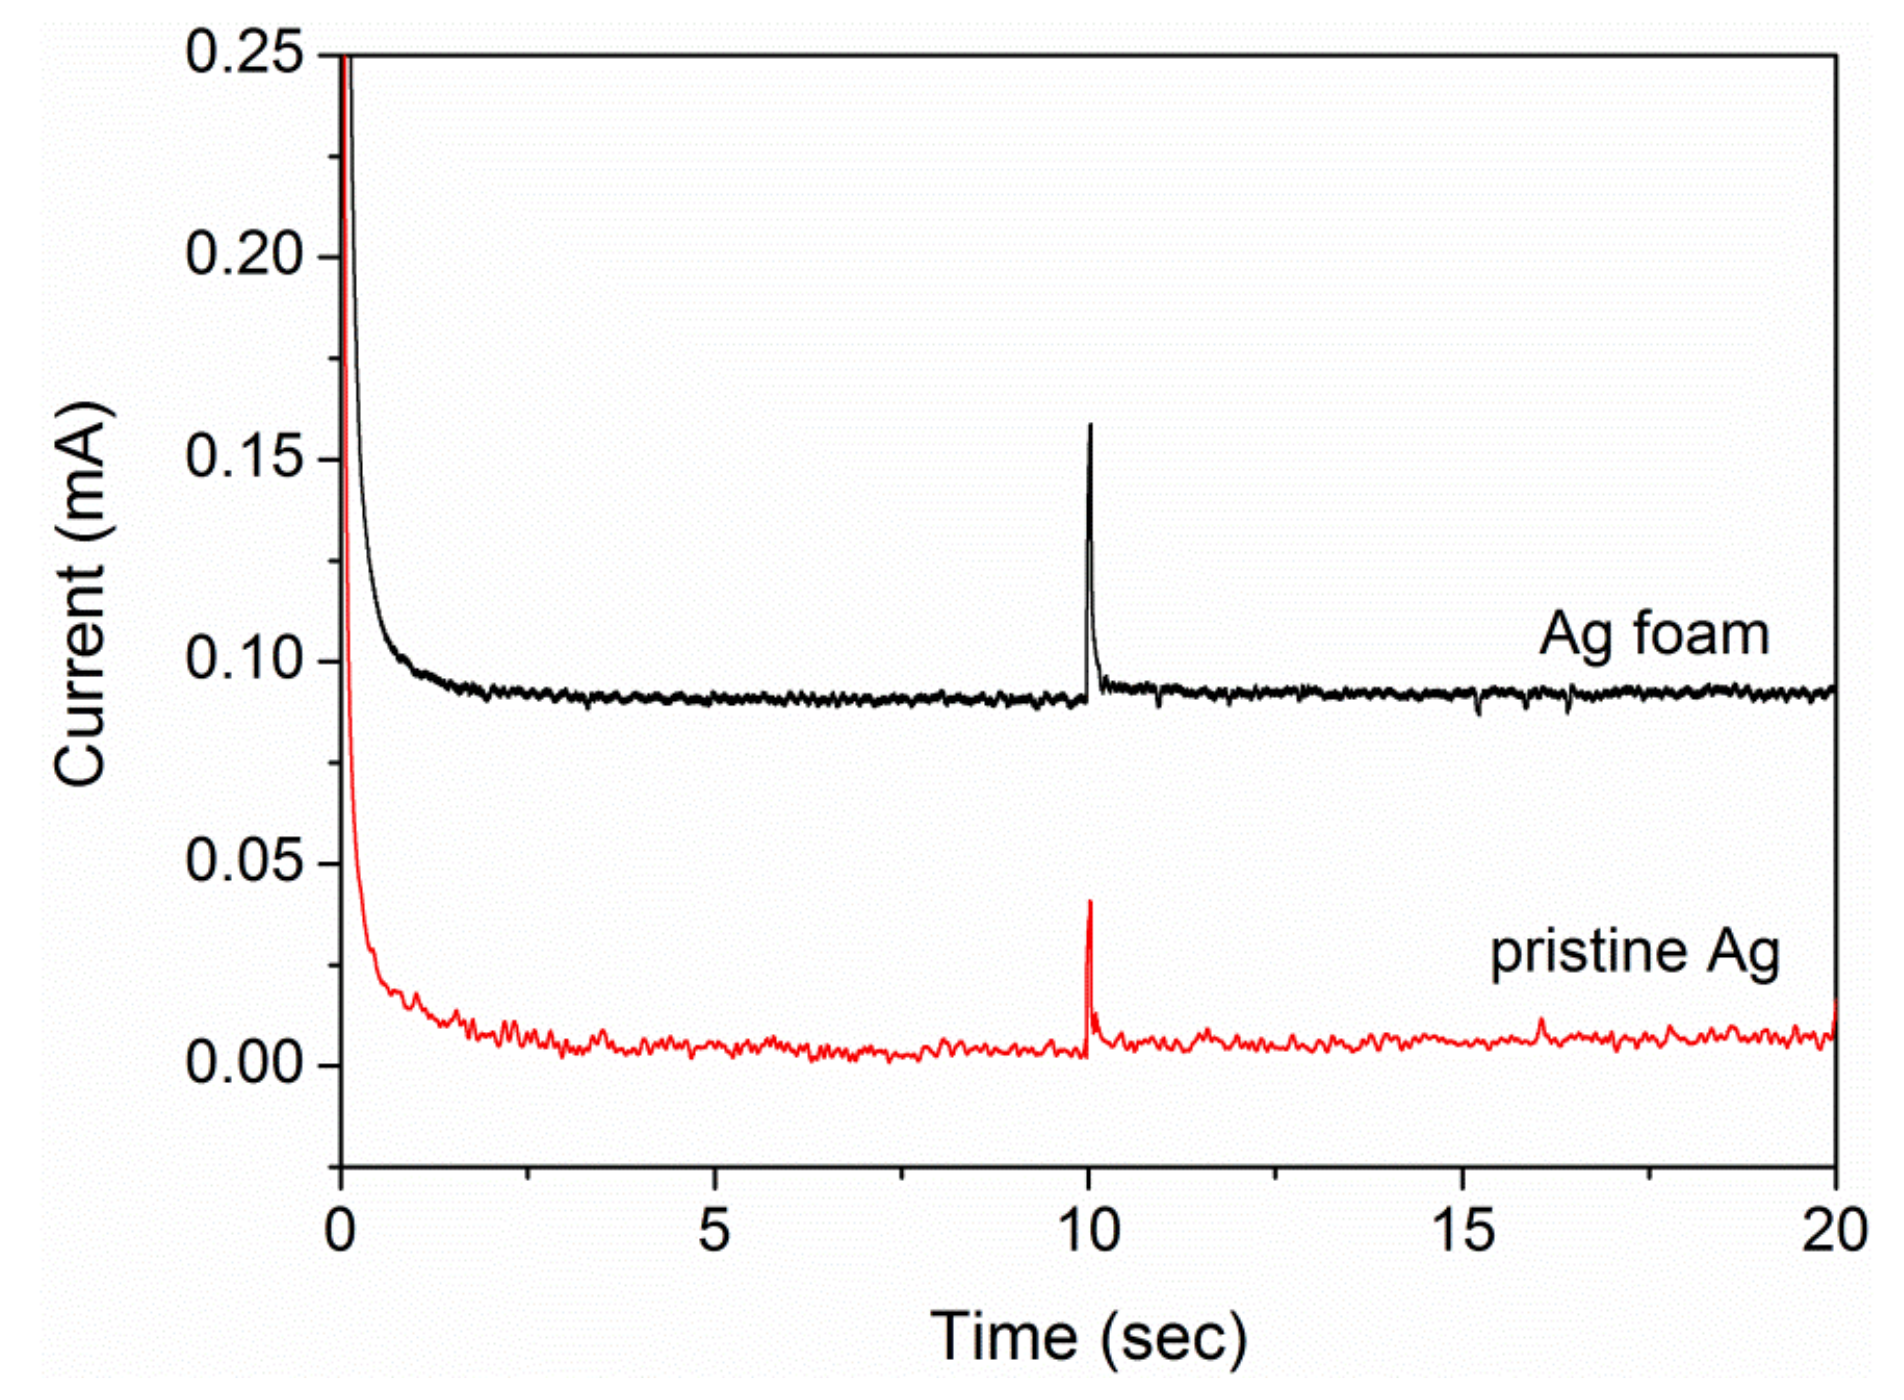
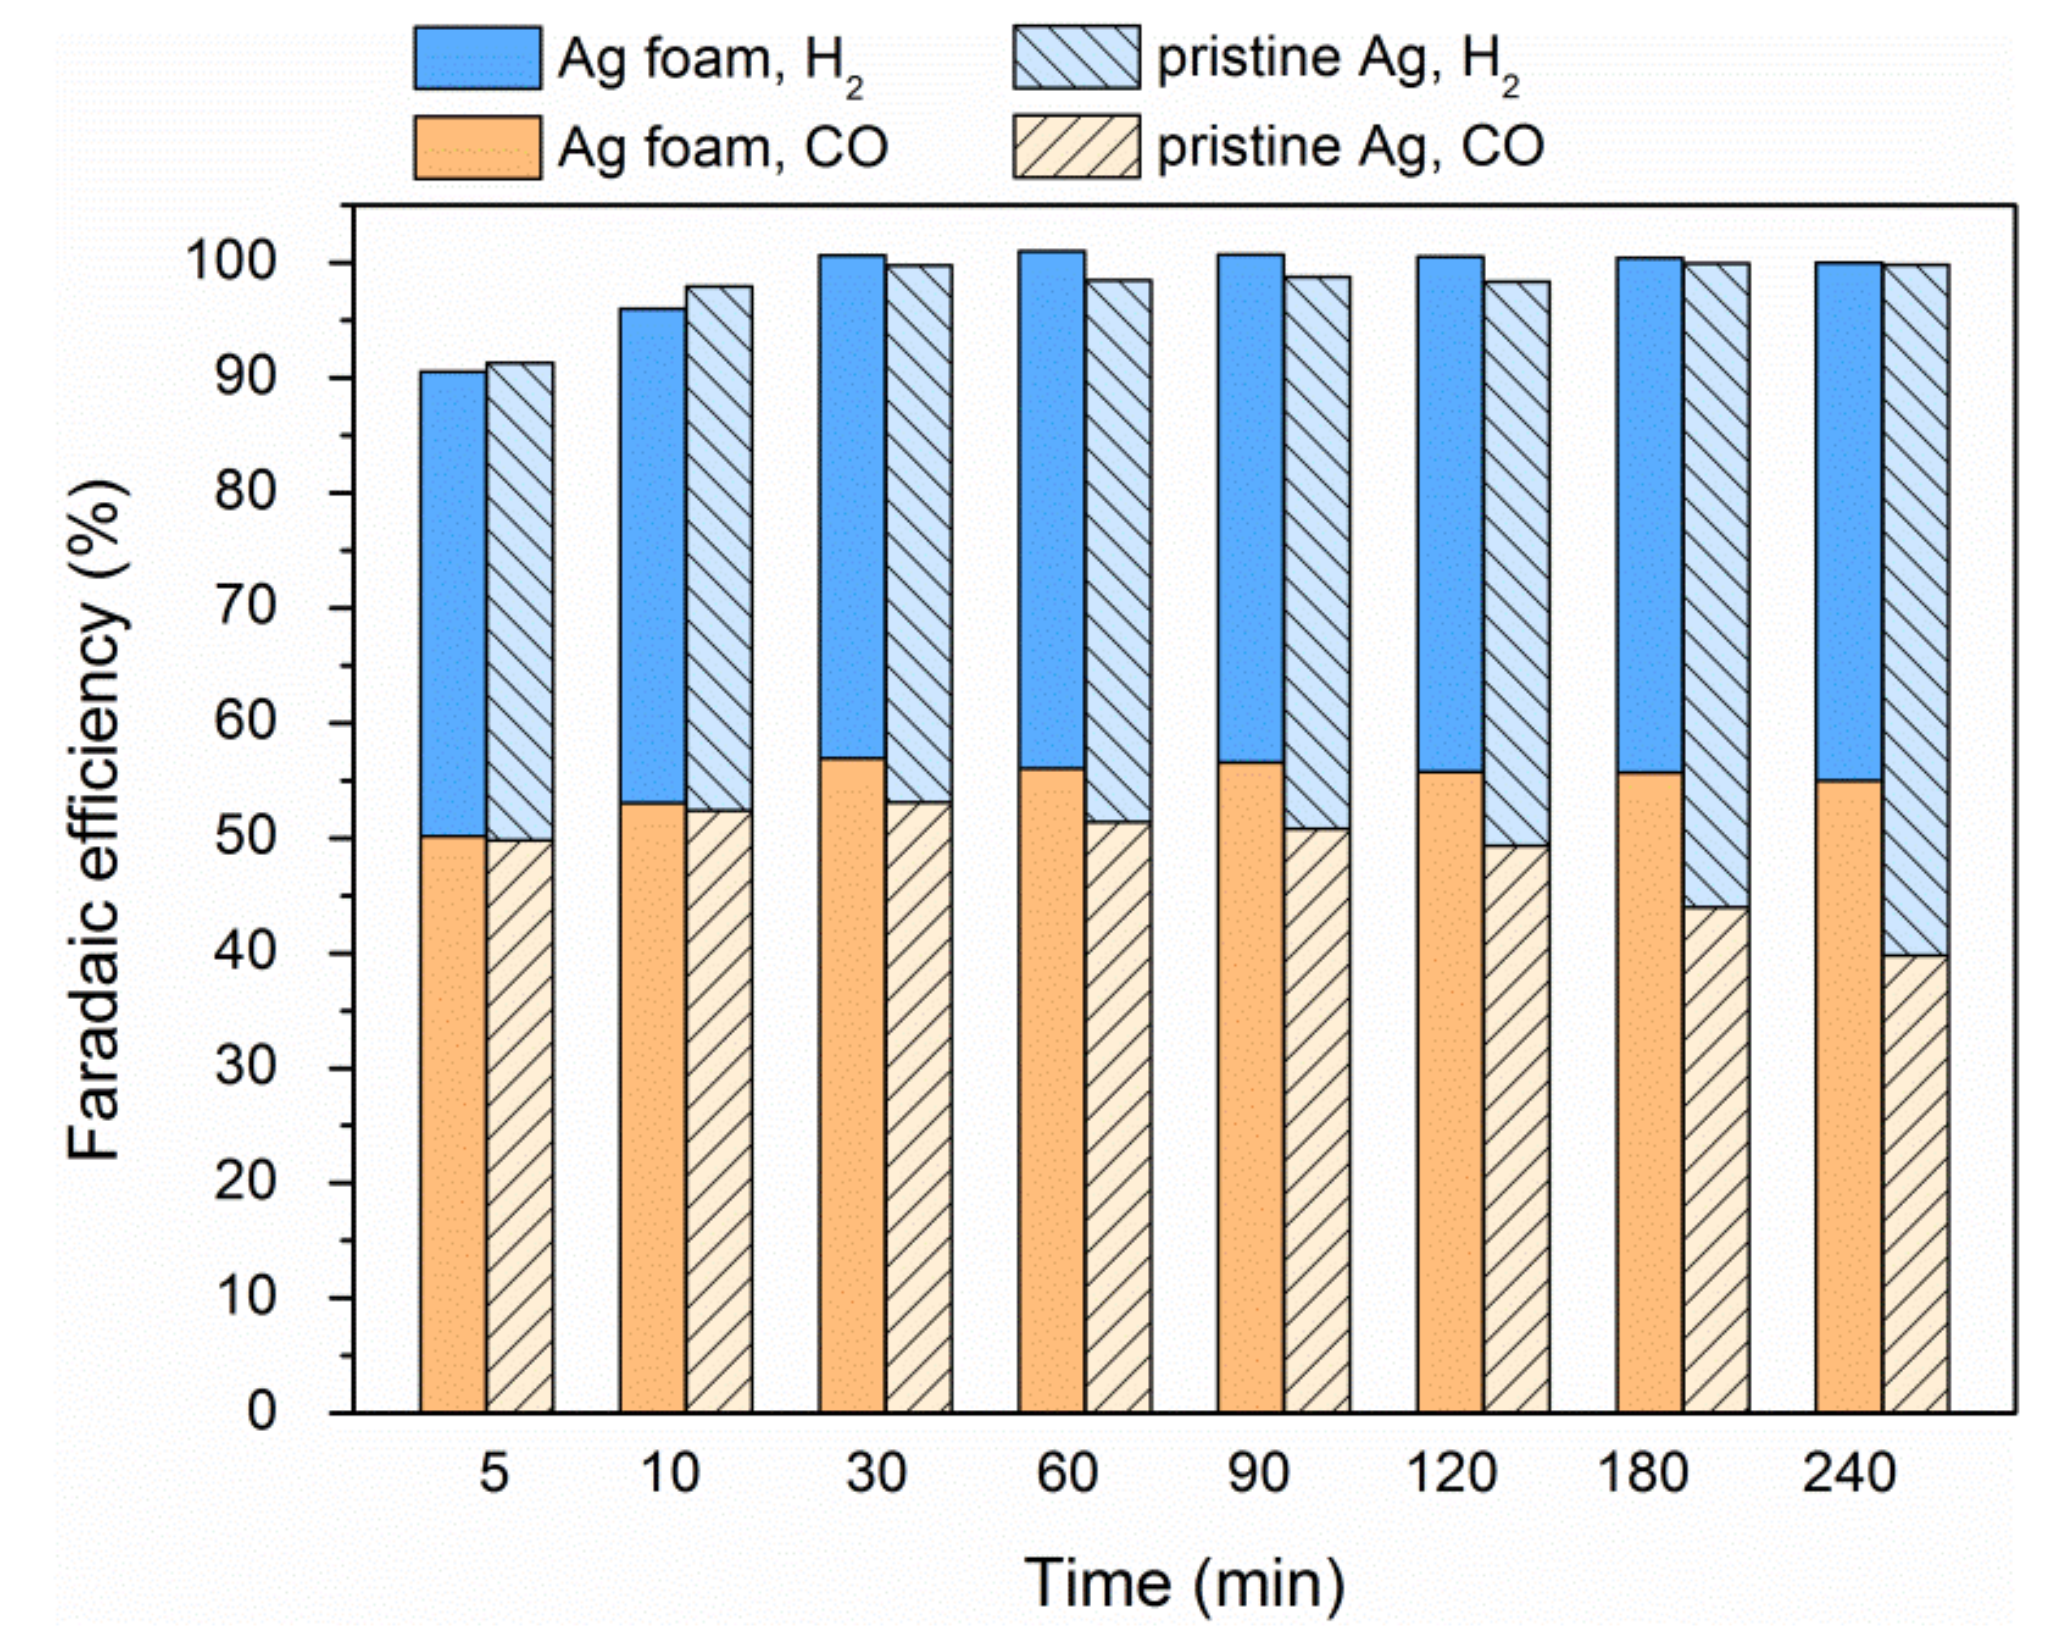
2.4. Electrode Stability

The stability of an electrode is a critical challenge in commercial applications. Taking the first applied potential with the syngas H2:CO molar ratio of 1 as an example, the variation in FECO and FEH2 as a function of time are plotted in Figure 10. During the 4-h reaction period, the variation in FECO and FEH2 on Ag foam compared with pristine Ag showed a different tendency. For Ag foam, the FECO rapidly increased to the maximum value of 56.94% in the first 30 min of electrolysis and then slowly weakened to 54.96% in the next reaction period. By contrast, the FECO reached the maximum value of 54.39% at 60 min and promptly dropped to 39.78% at the end of the reaction with pristine Ag. The slight decrease in FECO with the Ag foam electrode may have been due to the mass transfer limitation of CO2 in the batch experiment, as seen previously [9,20,23,24,35]. Different to Ag foam, we believe that the striking decrease in FECO on pristine Ag stemmed from a poisoning effect rather than the limitation of mass transfer.
The Ag foam had a higher PCDCO at −0.65 V (7.38 mA cm−2) than pristine Ag at −0.72 V (6.23 mA cm−2). Thus, Ag foam consumed more soluble CO2 in the catholyte than pristine Ag. Theoretically, the concentration decrease in CO and the corresponding concentration increase in H2 on pristine Ag should be slower than those on the Ag foam electrode. Nonetheless, the curves in Figure 10 clearly display the opposite trend.
As shown in previous studies, the overbinding of *CO and/or protonated *CO can lead to surface poisoning of the Ag electrode [20,44,45]. It is well known that the stability of adsorbed species is closely related to the exposed facets of the crystals, which directly affect the properties of the catalysts. As previously mentioned, the binding energy of CO for different crystal planes of Ag follows the order: Ag(110) > Ag(100) > Ag(111). Therefore, *CO was desorbed more easily on Ag(111) than on Ag(110). Thus, relative to pristine Ag enclosed with mixed (111), (110) and (100) facets, Ag foam with only a single exposed facet of (111) could maintain its activity and prolong the electrolysis time.
To further elucidate the high stability of the Ag foam electrode, we performed recycling experiments at a high potential of −2.67 V, where the molar ratio of H2 to CO was ~1. As displayed in Figure 11, no obvious difference in the variation of FECO and FEH2 was observed for Ag foam over three runs of electrochemical reduction of CO2. After each run, FECO returned to its original activity upon resaturation of the catholyte with CO2. The results of the time-dependent experiments confirmed that the Ag foam was not deactivated during the course of electroreduction of CO2 in aqueous solution.

3. Experimental

3.1. Materials and Reagents

Ag foam and pristine Ag (99.99% purity) were purchased from Kunshan Jiayisheng Electronics Co., Ltd., Kunshan, China and Jinjiang Dongyin Jewelry Co., Ltd., Jinjiang, China, respectively. CO2 (purity 99.995%), CO (purity 99.99%), H2 (purity 99.999%) and methane (purity 99.99%) were provided by Hangzhou Jingong Special Gas Co., Ltd., Hangzhou, China. All the reagents used in the present study, including NaOH, KHCO3, KCl, acetone and ethanol, were of analytical grade and were obtained from Huadong Medical Co., Ltd., Hangzhou, China. Milli-Q water (18.2 MΩ) was used in all experiments.

3.2. Electrode Characterization

XRD patterns were recorded by a PANalytical X’Pert Pro X-ray diffractometer using Cu Kα radiation (k = 1.5406 Å) with a scan step of 0.05° between 10° and 80°. FESEM was performed on a Hitachi S-4800 operating at an accelerating voltage of 5 kV. TEM and high-resolution TEM (HR-TEM) images were observed with a Philips-FEI Tecnai G2 F30 S-Twin microscope with an accelerating voltage of 300 kV.
The surface roughness of the electrodes was obtained by calculating the roughness factor (ρ) according to Equation (1).
ρ = 0 t ( I I ) d t Δ φ × C × S
where I and I denote the current and stable current value after a step, respectively, S is the geometric area of the electrode, which is 0.25 cm2 (0.5 cm × 0.5 cm in length and width) for both pristine Ag and Ag foam and C is equal to 20 µF cm−2, representing the double-layer capacitance for an ideally smooth electrode. I and I were obtained by using the multi-potential step mode of an electrochemical workstation (CHI760E, CH Instrument, Bee Cave, TX, USA) in a 0.5 mol L−1 NaClO4 aqueous solution at 20 °C. The potential of the electrodes was held at 0.10 V versus the saturated calomel electrode (SCE) for 10 s and then stepped to 0.095 V versus SCE for 10 s. Consequently, the t and Δφ in Equation (1) were 10 s and 5 mV, respectively.
The uncompensated solution resistance (Ru) were determined from EIS measurements. The EIS experiments were conducted in the dark at room temperature, with a frequency range of 1000 kHz to 0.01 Hz and AC amplitude of 0.005 V.
The DFT calculations of ECO and ECOOH were performed by the Vienna Ab initio Simulation Package with PW-91 functions in the generalized gradient approximation calculation. A kinetic cutoff energy of 396 eV was used for the plane wave truncation and a periodic 3 × 3 unit cell with a 3 × 3 × 1 Monkhorst-Pack k-point grid were used for all calculations. All surfaces were modelled by adding six equivalent layers of vacuum onto four layers of metal atoms corresponding to the most close-packed configurations. The two bottom layers of the slab were fixed, a lattice parameter of 4.09 Å was used for Ag, whereas the top two layers were allowed to relax to reach the lowest energy configuration. The binding energy was calculated using the equation:
E adsorbate / slab = E adsorbate / slab E slab E adsorbate
where Eadsorbate/slab is the binding energy of adsorbate on the given slab, Eadsorbate/slab is the energy of the surface with adsorbate, Eslab is the energy of the slab in vacuum and Eadsorbate is the energy of adsorbate in the gas phase. Different adsorption sites, such as atop, bridge, fcc and hcp, were calculated for CO. ECOOH investigated the formate chemisorption in a symmetric bidentate configuration at the bridge on Ag surfaces.

3.3. Electrochemical Reduction of CO2

All electrochemical reduction experiments were conducted using a three-electrode configuration controlled by a CHI 760E potentiostat. The reactor was a gas-tight two-compartment electrochemical cell with a cation-exchange membrane (Nafion-117) as the separator. Ag foam or pristine Ag (50 mm × 50 mm × 0.3 mm) was used as the working electrode, which was cleaned and degreased with acetone, ethanol and Milli-Q water for 1.5 h, washed thoroughly and dried by N2. A platinum sheet was employed as the counter electrode. All potentials were measured against the SCE and converted to a reversible hydrogen electrode (RHE) scale based on the Nernst equation. The anolyte and catholyte were 0.5 M NaOH and 0.1 M KHCO3 with solution saturated with CO2 (pH 6.8), respectively.
Potential conversion to a RHE scale and iRu corrections were made to assess the activity and selectivity of the electrode on the same bias, as shown in Equation (3).
E = E (vs. SCE) + 0.2412 V + 0.0591 V × pH − iRu
where E and E (vs. SCE) are the final reported potential and applied potential, respectively, i is the average current and Ru is the uncompensated solution resistance.
The FE value of the electrode catalyst for CO2 electroreduction was calculated using the following equation:
FE = z × n × F Q
where z represents the number of electrons exchanged (z is equal to 2 for the reduction of CO2 to HCOOH and H2, respectively), n is the number of moles of a given product, F is Faraday’s constant (96485 C mol−1) and Q is the charge passed (C).
The PCD of productions was calculated from the gas chromatograph (GC) peak area as follows:
PCD = j total × FE = j total . z × n × F Q
where jtotal is the total current density, n is the molar of productions and Q is the amount of charge passed during the reaction.

3.4. Analytical Procedures

The GC (7890B, Agilent, Santa Clara, CA, USA) was equipped with a HP-MOLESIEVE capillary column (30 m × 0.32 mm × 12 mm). Helium (99.999%) was used as the carrier gas. A thermal conductivity detector was used to quantify the H2 and CO concentrations. The amount of methane in the gas phase was measured using GC (GC-2014, Shimadzu, Tokyo, Japan) equipped with a flame ionization detector (FID) and an HPPLOT/Q column (30 m × 0.32 mm × 20 mm). The concentration of methanol volatilized from the liquid phase to the gas phase was quantified by GC (7890B, Agilent, USA) equipped with a FID and an HP-INNOWAX capillary column (30 m × 0.25 mm × 25 mm). The liquid phase product formic acid dissolved in the catholyte was determined using ion chromatography (ICS2000, Dionex, Sunnyvale, CA, USA) equipped with a conductivity detector (DS6, Dionex), a guard column (IonPac AG19, Dionex, Sunnyvale, CA, USA), an analytical column (IonPac AS19, Dionex, Sunnyvale, CA, USA) and a dual-piston (in series) pump. Suppression of the eluent was achieved using a Dionex anion ASRS electrolytic suppressor (4 mm) in the auto-suppression external water mode.

4. Conclusions

We demonstrated that Ag foam is an efficient catalyst for the electrochemical reduction of CO2 to syngas in aqueous solution. Ag foam was superior to pristine Ag in terms of the onset potential of CO, Faradic efficiency and partial current density of syngas. When producing CO (one of the main components of syngas), Ag foam showed a ~30 mV more positive onset potential than pristine Ag. The FECO and PCDsyngas of Ag foam were maximum at −1.12 and −2.77 V (82.9% and 237.58 mA cm−2, respectively), compared to a maximal FECO value of 79.0% at −1.12 V and PCDsyngas of 69.58 mA cm−2 at −1.56 V for pristine Ag, respectively. For the molar ratio of H2:CO at 0.3–1.0, Ag foam showed a wider potential window of 2.12 V than pristine Ag (0.84 V). In addition, Ag foam displayed fairly stable electrolysis performance in the three cyclic durability tests. DFT calculations demonstrated that the low-index Ag (111) plane favors the desorption of *CO. Furthermore, the edge sites govern the stabilization of *COOH. Namely, the abundant edge sites of coral-like Ag with large number of {111} facets could increase the selectivity, activity and stability of the Ag foam electrode. This Ag foam electrode provides an option for obtaining a flexible ratio of H2:CO in the production of syngas to meet the requirements of downstream products.

Author Contributions

Conceptualization, S.S.; Data curation, Y.Y. and N.Z.; Formal analysis, J.F. and X.Y.; Software, S.T.; Supervision, Z.H.; Writing—original draft, Y.Y.

Funding

This research received no external funding.

Acknowledgments

This work was supported by the National Science Foundation of China (21477117 and 21607130), the Zhejiang Provincial Natural Science Foundation of China (LZ18B070001, LGF18E080017 and LR14E080001) and the China Postdoctoral Science Foundation (2017T100436).

Conflicts of Interest

The authors declare no conflict of interest.

References

  1. Olah, G.A.; Prakash, G.K.S.; Goeppert, A. Anthropogenic chemical carbon cycle for a sustainable future. J. Am. Chem. Soc. 2011, 133, 12881–12898. [Google Scholar] [CrossRef] [PubMed]
  2. Luo, P.P.; Zhang, Y.T.; Chen, B.L.; Yu, S.X.; Zhou, H.W.; Qu, K.G.; Kong, Y.X.; Huang, X.Q.; Zhang, X.X.; Lu, J.X. Electrocarboxylation of dichlorobenzenes on a silver electrode in DMF. Catalysts 2017, 7, 274. [Google Scholar] [CrossRef]
  3. Zhang, S.H.; Shen, Y.; Shao, P.J.; Chen, J.M.; Wang, L.D. Kinetics, thermodynamics, and mechanism of a novel biphasic solvent for CO2 capture from flue gas. Environ. Sci. Technol. 2018, 52, 3660–3668. [Google Scholar] [CrossRef] [PubMed]
  4. Zhao, J.; Ye, J.H.; Zhu, N.; Hong, H.L.; Ma, L.; Yang, J.R.; Zhang, J.B. Amine phase-transfer chemistry: A green and sustainable approach to the nonbiological mineralization of CO2. ACS Sustain. Chem. Eng. 2018, 6, 7105–7108. [Google Scholar] [CrossRef]
  5. Zhang, S.H.; Lu, Y.Q. Surfactants facilitating carbonic anhydrase enzyme-mediated CO2 absorption into a carbonate solution. Environ. Sci. Technol. 2017, 51, 8537–8543. [Google Scholar] [CrossRef] [PubMed]
  6. Zhang, S.H.; Du, M.E.; Shao, P.J.; Wang, L.D.; Ye, J.X.; Chen, J.; Chen, J.M. Carbonic anhydrase enzyme-MOFs composite with a superior catalytic performance to promote CO2 absorption into tertiary amine solution. Environ. Sci. Technol. 2018, 52, 12708–12716. [Google Scholar] [CrossRef]
  7. Qiu, J.P.; Tang, J.T.; Shen, J.; Wu, C.W.; Qian, M.Q.; He, Z.Q.; Chen, J.M.; Song, S. Preparation of a silver electrode with a three-dimensional surface and its performance in the electrochemical reduction of carbon dioxide. Electrochim. Acta 2016, 203, 99–108. [Google Scholar]
  8. Wang, J.L.; Zhou, S.Y.; Bei, K.; Zhang, D.; Chou, I.M.; Chen, Z.H.; Lin, C.M.; Pan, Z.Y. Using a fused silica capillary cell and in situ raman spectroscopy to develop a setup for measurement of the volume expansion of carbon dioxide + n-hexane. Energy Fuel 2017, 31, 6314–6319. [Google Scholar] [CrossRef]
  9. Ma, L.; Fan, S.; Zhen, D.X.; Wu, X.M.; Liu, S.S.; Lin, J.J.; Huang, S.Q.; Chen, W.; He, G.H. Electrochemical reduction of CO2 in proton exchange membrane reactor: The function of buffer layer. Ind. Eng. Chem. Res. 2017, 56, 10242–10250. [Google Scholar] [CrossRef]
  10. Zhong, H.; Fujii, K.; Nakano, Y.; Jin, F.M. Effect of CO2 bubbling into aqueous solutions used for electrochemical reduction of CO2 for energy conversion and storage. J. Phys. Chem. C 2014, 119, 55–61. [Google Scholar] [CrossRef]
  11. Yuan, J.; Zhang, J.J.; Yang, M.P.; Meng, W.J.; Wang, H.; Lu, J.X. CuO nanoparticles supported on TiO2 with high efficiency for CO2 electrochemical reduction to ethanol. Catalysts 2018, 8, 171. [Google Scholar] [CrossRef]
  12. Foit, S.R.; Vinke, I.C.; de Haart, L.G.J.; Eichel, R.A. Power-to-syngas: An enabling technology for the transition of the energy system? Angew. Chem.-Int. Ed. 2017, 56, 5402–5411. [Google Scholar] [CrossRef] [PubMed]
  13. Fu, Y.S.; Li, Y.N.; Zhang, X.; Liu, Y.Y.; Qiao, J.L.; Zhang, J.J.; Wilkinson, D.P. Novel hierarchical SnO2 microsphere catalyst coated on gas diffusion electrode for enhancing energy efficiency of CO2 reduction to formate fuel. Appl. Energy 2016, 175, 536–544. [Google Scholar] [CrossRef]
  14. Yuan, J.; Liu, L.; Guo, R.R.; Zeng, S.; Wang, H.; Lu, J.X. Electroreduction of CO2 into ethanol over an active catalyst: Copper supported on titania. Catalysts 2017, 7, 220. [Google Scholar] [CrossRef]
  15. Kang, P.; Chen, Z.F.; Nayak, A.; Zhang, S.; Meyer, T.J. Single catalyst electrocatalytic reduction of CO2 in water to H2 + CO syngas mixtures with water oxidation to O2. Energy Environ. Sci. 2014, 7, 4007–4012. [Google Scholar] [CrossRef]
  16. Costentin, C.; Drouet, S.; Robert, M.; Saveant, J.M. A local proton source enhances CO2 electroreduction to CO by a molecular Fe catalyst. Science 2012, 338, 90–94. [Google Scholar] [CrossRef] [PubMed]
  17. Feng, D.M.; Zhu, Y.P.; Chen, P.; Ma, T.Y. Recent advances in transition-metal-mediated electrocatalytic CO2 reduction: From homogeneous to heterogeneous systems. Catalysts 2017, 7, 373. [Google Scholar] [CrossRef]
  18. Ross, M.B.; Dinh, C.T.; Li, Y.; Kim, D.; De Luna, P.; Sargent, E.H.; Yang, P. Tunable Cu enrichment enables designer syngas electrosynthesis from CO2. J. Am. Chem. Soc. 2017, 139, 9359–9363. [Google Scholar] [CrossRef]
  19. Fu, Q.; Mabilat, C.; Zahid, M.; Brisse, A.; Gautier, L. Syngas production via high-temperature steam/CO2 co-electrolysis: An economic assessment. Energy Environ. Sci. 2010, 3, 1382. [Google Scholar] [CrossRef]
  20. Sheng, W.C.; Kattel, S.; Yao, S.Y.; Yan, B.H.; Liang, Z.X.; Hawxhurst, C.J.; Wu, Q.Y.; Chen, J.G.G. Electrochemical reduction of CO2 to synthesis gas with controlled CO/H2 ratios. Energy Environ. Sci. 2017, 10, 1180–1185. [Google Scholar] [CrossRef]
  21. Back, S.; Yeom, M.S.; Jung, Y. Active sites of Au and Ag nanoparticle catalysts for CO2 electroreduction to CO. ACS Catal. 2015, 5, 5089–5096. [Google Scholar] [CrossRef]
  22. Hernández, S.; Amin Farkhondehfal, M.; Sastre, F.; Makkee, M.; Saracco, G.; Russo, N. Syngas production from electrochemical reduction of CO2: Current status and prospective implementation. Green Chem. 2017, 19, 2326–2346. [Google Scholar] [CrossRef]
  23. Oloman, C.; Li, H. Electrochemical processing of carbon dioxide. ChemSusChem 2008, 1, 385–391. [Google Scholar] [CrossRef]
  24. Verma, S.; Hamasaki, Y.; Kim, C.; Huang, W.; Lu, S.; Jhong, H.-R.M.; Gewirth, A.A.; Fujigaya, T.; Nakashima, N.; Kenis, P.J.A. Insights into the low overpotential electroreduction of CO2 to CO on a supported gold catalyst in an alkaline flow electrolyzer. ACS Energy Lett. 2017, 3, 193–198. [Google Scholar] [CrossRef]
  25. Schmid, B.; Reller, C.; Neubauer, S.S.; Fleischer, M.; Dorta, R.; Schmid, G. Reactivity of copper electrodes towards functional groups and small molecules in the context of CO2 electro-reductions. Catalysts 2017, 7, 161. [Google Scholar] [CrossRef]
  26. Costentin, C.; Robert, M.; Savéant, J.-M. Catalysis of the electrochemical reduction of carbon dioxide. Chem. Soc. Rev. 2013, 42, 2423–2436. [Google Scholar] [CrossRef]
  27. He, Z.Q.; Liu, T.; Tang, J.T.; Zhou, C.Y.; Wen, L.S.; Chen, J.M.; Song, S. Highly active, selective and stable electroreduction of carbon dioxide to carbon monoxide on a silver catalyst with truncated hexagonal bipyramidal shape. Electrochim. Acta 2016, 222, 1234–1242. [Google Scholar] [CrossRef]
  28. Zhang, P.; Shao, C.L.; Zhang, Z.Y.; Zhang, M.Y.; Mu, J.B.; Guo, Z.C.; Liu, Y.C. In situ assembly of well-dispersed Ag nanoparticles (AgNPs) on electrospun carbon nanofibers (CNFs) for catalytic reduction of 4-nitrophenol. Nanoscale 2011, 3, 3357–3363. [Google Scholar] [CrossRef]
  29. Peterson, A.A.; Nørskov, J.K. Activity descriptors for CO2 electroreduction to methane on transition-metal catalysts. J. Phys. Chem. Lett. 2012, 3, 251–258. [Google Scholar] [CrossRef]
  30. Lu, Q.; Rosen, J.; Zhou, Y.; Hutchings, G.S.; Kimmel, Y.C.; Chen, J.G.G.; Jiao, F. A selective and efficient electrocatalyst for carbon dioxide reduction. Nat. Commun. 2014, 5, 3242. [Google Scholar] [CrossRef] [Green Version]
  31. Gao, D.F.; Zhang, Y.; Zhou, Z.W.; Cai, F.; Zhao, X.F.; Huang, W.G.; Li, Y.S.; Zhu, J.F.; Liu, P.; Yang, F.; et al. Enhancing CO2 electroreduction with the metal-oxide interface. J. Am. Chem. Soc. 2017, 139, 5652–5655. [Google Scholar] [CrossRef] [PubMed]
  32. Li, W. Electrocatalytic reduction of CO2 to small organic molecule fuels on metal catalysts. Cheminform 2010, 1056, 55–76. [Google Scholar]
  33. Zhao, S.; Jin, R.X.; Jin, R.C. Opportunities and challenges in CO2 reduction by gold- and silver-based electrocatalysts: From bulk metals to nanoparticles and atomically precise nanoclusters. ACS Energy Lett. 2018, 3, 452–462. [Google Scholar] [CrossRef]
  34. Kumar, B.; Brian, J.P.; Atla, V.; Kumari, S.; Bertram, K.A.; White, R.T.; Spurgeon, J.M. Controlling the product syngas H2:CO ratio through pulsed-bias electrochemical reduction of CO2 on copper. ACS Catal. 2016, 6, 4739–4745. [Google Scholar] [CrossRef]
  35. Zhang, W.J.; Hu, Y.; Ma, L.B.; Zhu, G.Y.; Wang, Y.R.; Xue, X.L.; Chen, R.P.; Yang, S.Y.; Jin, Z. Progress and perspective of electrocatalytic CO2 reduction for renewable carbonaceous fuels and chemicals. Adv. Sci. 2018, 5, 1700275. [Google Scholar] [CrossRef] [PubMed]
  36. Jiang, B.; Zhang, X.G.; Jiang, K.; Wu, D.Y.; Cai, W.B. Boosting formate production in electrocatalytic CO2 reduction over wide potential window on Pd surfaces. J. Am. Chem. Soc. 2018, 140, 2880–2889. [Google Scholar] [CrossRef]
  37. Qiu, J.P.; Tong, Y.W.; Zhao, D.M.; He, Z.Q.; Chen, J.M.; Song, S. Electrochemical reduction of CO2 to methanol at TiO2 nanotube electrodes. Acta Phys.-Chim. Sin. 2017, 33, 1411–1420. [Google Scholar]
  38. Rosen, J.; Hutchings, G.S.; Lu, Q.; Rivera, S.; Zhou, Y.; Vlachos, D.G.; Jiao, F. Mechanistic insights into the electrochemical reduction of CO2 to CO on nanostructured Ag surfaces. ACS Catal. 2015, 5, 4293–4299. [Google Scholar] [CrossRef]
  39. Hsieh, Y.-C.; Senanayake, S.D.; Zhang, Y.; Xu, W.; Polyansky, D.E. Effect of chloride anions on the synthesis and enhanced catalytic activity of silver nanocoral electrodes for CO2 electroreduction. ACS Catal. 2015, 5, 5349–5356. [Google Scholar] [CrossRef]
  40. Wang, Y.; Liu, J.; Wang, Y.; Al-Enizi, A.M.; Zheng, G. Tuning of CO2 reduction selectivity on metal electrocatalysts. Small 2017, 13, 1701809. [Google Scholar] [CrossRef]
  41. Bui, L.; Chakrabarti, R.; Bhan, A. Mechanistic origins of unselective oxidation products in the conversion of propylene to acrolein on Bi2Mo3O12. ACS Catal. 2016, 6, 6567–6580. [Google Scholar] [CrossRef]
  42. Ma, M.; Trzesniewski, B.J.; Xie, J.; Smith, W.A. Selective and efficient reduction of carbon dioxide to carbon monoxide on oxide-derived nanostructured silver electrocatalysts. Angew. Chem.-Int. Ed. 2016, 55, 9748–9752. [Google Scholar] [CrossRef] [PubMed]
  43. Kim, C.; Jeon, H.S.; Eom, T.; Jee, M.S.; Kim, H.; Friend, C.M.; Hwang, Y.J. Achieving selective and efficient electrocatalytic activity for CO2 reduction using immobilized silver nanoparticles. J. Am. Chem. Soc. 2015, 137, 13844–13850. [Google Scholar] [CrossRef] [PubMed]
  44. Delacourt, C.; Ridgway, P.L.; Kerr, J.B.; Newman, J. Design of an electrochemical cell making syngas (CO + H2) from CO2 and H2O reduction at room temperature. J. Electrochem. Soc. 2008, 155, B42–B49. [Google Scholar] [CrossRef]
  45. Yano, J.; Yamasaki, S. Pulse-mode electrochemical reduction of carbon dioxide using copper and copper oxide electrodes for selective ethylene formation. J. Appl. Electrochem. 2008, 38, 1721–1726. [Google Scholar] [CrossRef]
Figure 1. XRD patterns of pristine Ag and Ag foam.
Catalysts 09 00057 g001
Figure 2. FESEM images of pristine Ag (a), pristine Ag-after reaction (a’), Ag foam (b) and Ag foam-after reaction (b’).
Catalysts 09 00057 g002
Figure 3. HR-TEM images of Ag foam (a), Ag foam -after reaction (a’), pristine Ag (b) and pristine Ag -after reaction (b’).
Catalysts 09 00057 g003
Figure 4. The Nyquist diagrams obtained for Ag foam and pristine Ag. The inset is the equivalent electrical circuit used to fit the EIS data (R1 denotes the uncompensated electrolyte resistance, CPE1 is the double-layer capacitance at the electrode-electrolyte interface, R2 is the charge transfer resistance and CPE2 denotes the Warburg-type impedance arising from the diffusion of redox-active species to the electrode interface). Experimental conditions: anolyte, 0.5 M NaOH; catholyte, CO2-saturated 0.1 M KHCO3; 25 °C.
Catalysts 09 00057 g004
Figure 5. Faradic efficiency of the CO2 reduction products for Ag foam (a) and pristine Ag (b) electrodes as a function of electrode potential during the electrolysis process. Experimental conditions: anolyte, 0.5 M NaOH; catholyte, CO2-saturated 0.1 M KHCO3; 25 °C.
Catalysts 09 00057 g005
Figure 6. Ratio of H2:CO in Ag foam and pristine Ag electrodes as a function of electrode potential. Experimental conditions: anolyte, 0.5 M NaOH; catholyte, CO2-saturated 0.1 M KHCO3; 25 °C.
Catalysts 09 00057 g006
Figure 7. Partial current density of each reduction product for Ag foam (a) and pristine Ag (b) electrodes as a function of potential. Experimental conditions: anolyte, 0.5 M NaOH; catholyte, CO2-saturated 0.1 M KHCO3; 25 °C.
Catalysts 09 00057 g007
Figure 8. Current density of syngas at the ratio of 0.3–1.0 H2:CO for Ag foam and pristine Ag electrodes as a function of potential. Experimental conditions: anolyte, 0.5 M NaOH; catholyte, CO2-saturated 0.1 M KHCO3; 25 °C.
Catalysts 09 00057 g008
Figure 9. Potential-step curves of the Ag foam and pristine Ag electrodes.
Catalysts 09 00057 g009
Figure 10. Faradic efficiency of CO and H2 at different time intervals during polarization at −0.65 and −0.72 V with H2:CO = 1 for Ag foam and pristine Ag, respectively. Experimental conditions: anolyte, 0.5 M NaOH; catholyte, CO2-saturated 0.1 M KHCO3; 25 °C.
Catalysts 09 00057 g010
Figure 11. Cyclic yield curve of CO and H2 on Ag foam electrode from re-saturated used electrolyte at −2.67 V. Experimental conditions: anolyte, 0.5 M NaOH; catholyte, CO2-saturated 0.1 M KHCO3; 25 °C.
Catalysts 09 00057 g011
Table 1. The binding energy of COOH and CO on Ag surfaces.
FacetsECO (eV)ECOOH (eV)
Ag(111)−0.15−1.15
Ag(110)−0.33−1.44
Ag(100)−0.35−1.62
Table 2. The specific activity for the formation of CO on Ag foam and pristine Ag.
SampleRoughness Factor (cm2 cm−2)Potential (V vs. RHE)PCDCO (mA cm−2)SACO (10−5 A cm−2)
Ag foam44.5−0.531.202.70
−0.602.976.68
−0.657.3816.59
pristine Ag33.4−0.560.341.02
−0.611.153.46
−0.683.119.32
Table 3. The comparison of the activity and selectivity with different Ag electrodes.
Morphology of Ag ElectrodesElectrolyteSelective Production of CO
Applied Potential V (vs. RHE)Faradaic Efficiency (%)Current Density (mA cm−2)Ref.
Nanoparticles0.5 M KHCO3−0.7579143
Nanoporous0.5 M KHCO3−0.60921830
Nanocorals0.1 M KHCO3−0.60956.6239
Oxide-derived0.1 M KHCO3−0.80891.1544
Compact grains0.1 M KHCO3−1.188.875.737
Truncated hexagonal bipyramidal0.1 M KHCO3−0.9389.44.9227
Plate0.1 M KHCO3−1.1279.022.93In our work
Foam0.1 M KHCO3−1.1282.927.43In our work

