Article

Pt–Ni Seed-Core-Frame Hierarchical Nanostructures and Their Conversion to Nanoframes for Enhanced Methanol Electro-Oxidation

1
Department of Chemistry and Biochemistry, University of Arkansas, Fayetteville, AR 72701, USA
2
Condensed Matter Physics and Materials Science Department, Brookhaven National Laboratory, Upton, NY 11973, USA
3
Center for Functional Nanomaterials, Brookhaven National Laboratory, Upton, NY 11973, USA
*
Author to whom correspondence should be addressed.
Catalysts 2019, 9(1), 39; https://doi.org/10.3390/catal9010039
Submission received: 1 December 2018 / Revised: 25 December 2018 / Accepted: 26 December 2018 / Published: 3 January 2019
(This article belongs to the Special Issue Catalysis for Electro-oxidation of Ethanol & Methanol)

Abstract

:
Pt–Ni nanostructures are a class of important electrocatalysts for polymer electrolyte membrane fuel cells. This work reports a systematic study on the reaction mechanism of the formation of Pt–Ni seed-core-frame nanostructures via the seeded co-reduction method involving the Pt seeds and selective co-reduced deposition of Pt and Ni. The resultant structure consists of a branched Pt ultrafine seed coated with a pure Ni as rhombic dodecahedral core and selective deposition of Pt on the edges of the cores. Both the type of Pt precursor and the precursor ratio of Pt/Ni are critical factors to form the resulting shape of the seeds and eventually the morphology of the nanostructures. These complex hierarchical structures can be further graved into hollow Pt–Ni alloy nanoframes using acetic acid etching method. The larger surface area and higher number of low coordinate sites of the nanoframes facilitate the electrocatalytic activity and stability of Pt–Ni alloy for methanol oxidation as compared to their solid counterparts. This study elucidates the structural and compositional evolution of the complex nanoarchitectures and their effects on the electrocatalytic properties of the nanostructures.

1. Introduction

Platinum (Pt)-containing nanoparticles have attracted tremendous attentions in recent years because of their intriguing properties and broad potential applications in polymer electrolyte membrane fuel cells (PEMFCs) [1,2]. To improve electrocatalytic activity with cost effectiveness, 3d-transition metals are incorporated into the pure Pt lattice to form Pt-based bimetallic catalysts for PEMFC. For example, Pt3Ni(111) surface was demonstrated to be 10- and 90-fold more active than the Pt(111) surface and the commercial Pt/C catalysts, respectively, for the cathodic oxygen reduction reaction (ORR) of PEMFCs [3]. Since then, many efforts have been made to synthesize Pt–Ni nanoparticles with various sizes, shapes, and compositions for improvement of ORR catalytic activity. The Pt3Ni octahedral nanoparticles showed ~4 times better than the commercial Pt/C catalysts [4,5] while the ORR activity of Pt3Ni octahedra was found ~5-fold higher than that of the nanocubes with similar size [6]. A nominal composition of PtNi nanoparticles displayed a 3-fold more active than Pt3Ni nanoparticles and 15 times better than Pt/C [7]. Similar findings were reported that the activity varied with composition with PtNi octahedra 10-fold better than Pt/C [8]. Further extended study from the thin-film to the nanoscale showed that PtNi/multilayer Pt-skin nanoparticles had higher activity than PtNi/Pt-skeleton and PtNi nanoparticles [9,10]. More recently, an open-framework, Pt3Ni nanoframe, was demonstrated an enhancement factor of 36 in mass activity and 22 in specific activity, respectively for ORR compared to Pt/C due to the large surface areas from both the interior and exterior of the frame structure [11,12]. The electrocatalytic activity of nanoframes could be further tuned by the anisotropic phase segregation of migration of Pt during synthesis and by controlling the architecture of the nanoframes [13,14,15]. The shape of the nanoframes could be tuned by the use of different surface ligands to yield tetrahedral and rhombic dodecahedral nanoframes, respectively [16]. On the other hand, studies reported that Pt rich {111} surface on Ni-rich subsurface showed better electrocatalytic activity for ORR compared to Pt-rich corners/edges and slightly concave Ni-rich {111} facets [17]. The electrocatalytic activity of the Pt–Ni nanostructures could be tuned by a thermal annealing process due to the structural reconstruction [18]. In addition to skin/skeleton surfaces and nanoframes, other morphologies with highly open nanoarchitectures such as porous structures [19,20,21], ultrathin nanowires [22,23,24], and atomic surfaces [25,26,27,28,29] could also facilitate adequate exposure of the active surfaces and the feasible mass transport for ORR [30,31].
Apart from the enhancement of ORR reaction, Pt–Ni nanoparticles have been demonstrated to improve the cathodic methanol oxidation reaction (MOR) of PEMFC [32]. The modification of Pt electronic structure by Ni was attributed to the charge transfer from Ni to Pt atoms, thereby weakening CO poisoning of Pt, and the Pt3Ni nanoparticles was found more active than Pt2Ni and PtNi for MOR [33]. The Pt–Ni octahedra with {111} facets were more active then Pt–Ni/C and Pt/C [34]. The open frame structures were more active catalysts than the solid nanoparticles for alcohol oxidations [16,35,36]. We demonstrated that other nanostructures with highly accessible surfaces including Pt–Cu nanodendrites [37], nanowires [38], core-frame and frame structures could enhance MOR activity [39]. In this work, we reported a seeded co-reduction method to synthesize the rhombic dodecahedral, hierarchical structure. Different from the previously-reported one-pot synthesis [11,12,13,15,16], the heterogeneous nucleation of Ni on Pt seeds dominated, followed by selectively deposition of Pt on the edges and corners of the resulting seed-core rhombic dodecahedra to yield the seed-core-frame structures. The reaction mechanism was further investigated in detail in order to elucidate the important parameters for controlling the morphology of the complex structure. These nanoarchitectures could be further graved into hollow structures using the acetic acid etching method. The composition and degree of hollowing out could be controlled through both reaction temperature and time. Lastly, the electrocatalytic properties of these nanostructures were evaluated for MOR. The morphology-composition-activity-stability relationship was established and in all cases this unique set of nanostructures have better performance than the commercially-available Pt/C catalysts.

2. Results and Discussion

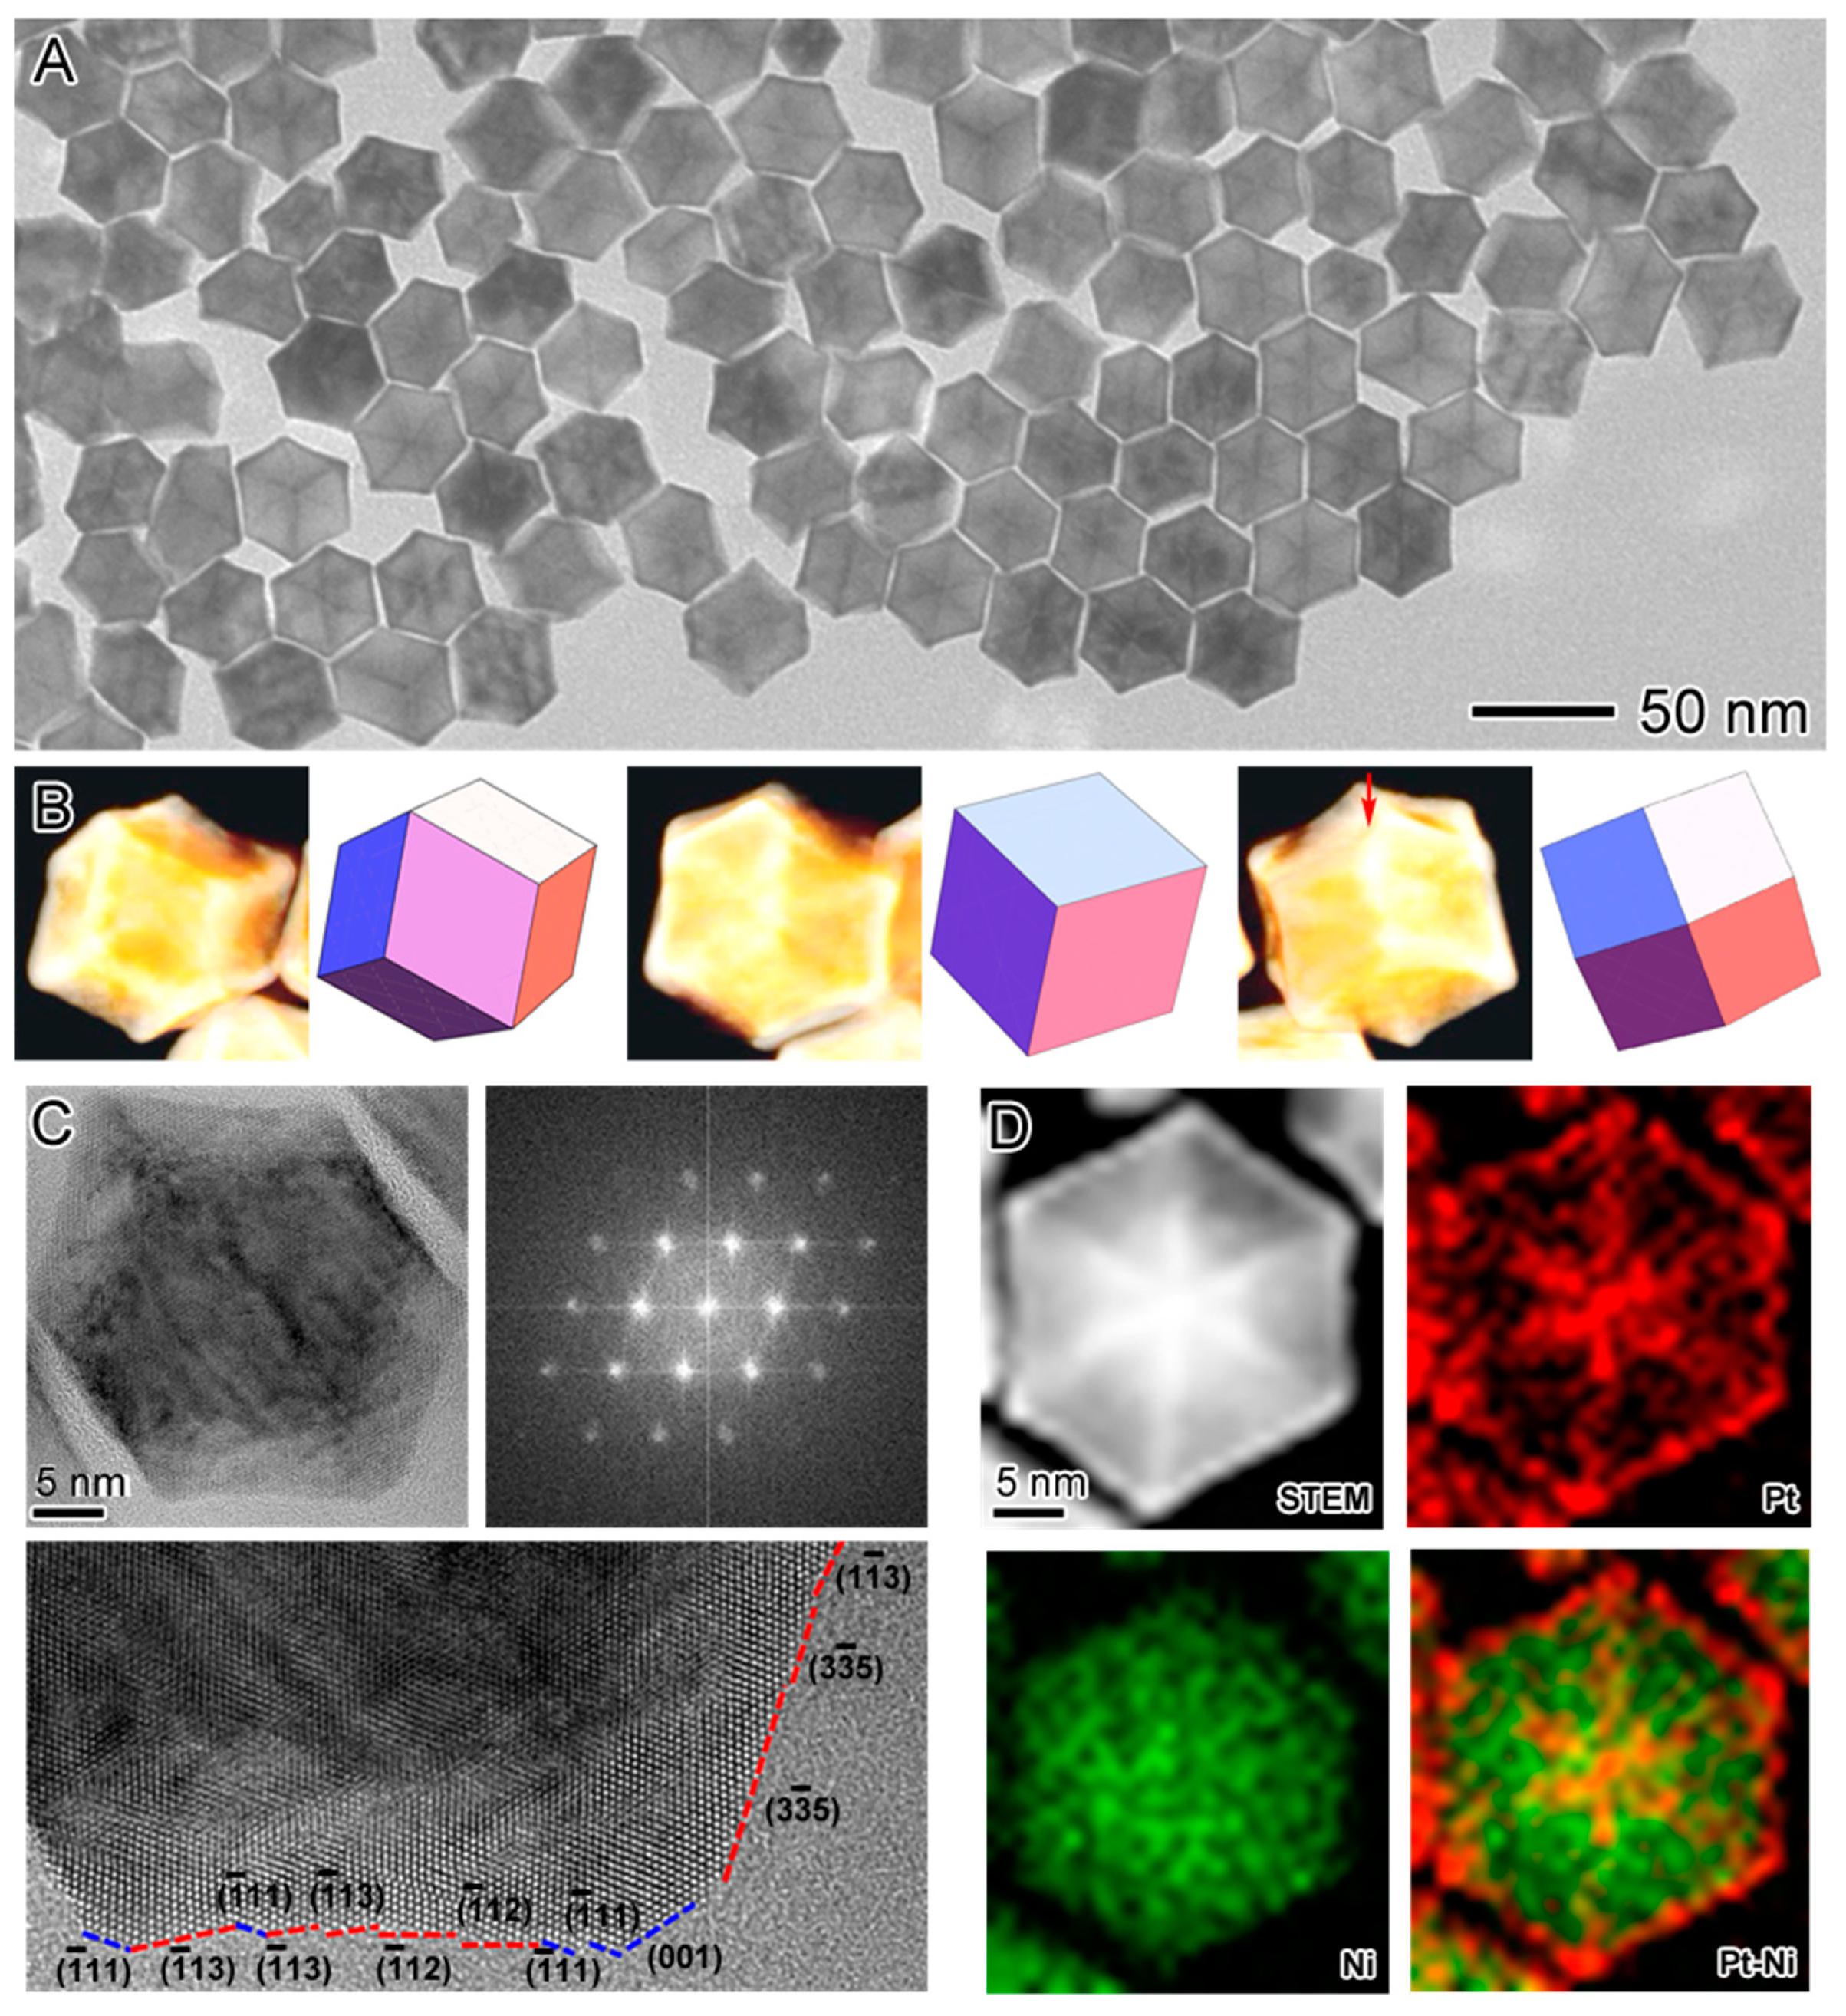
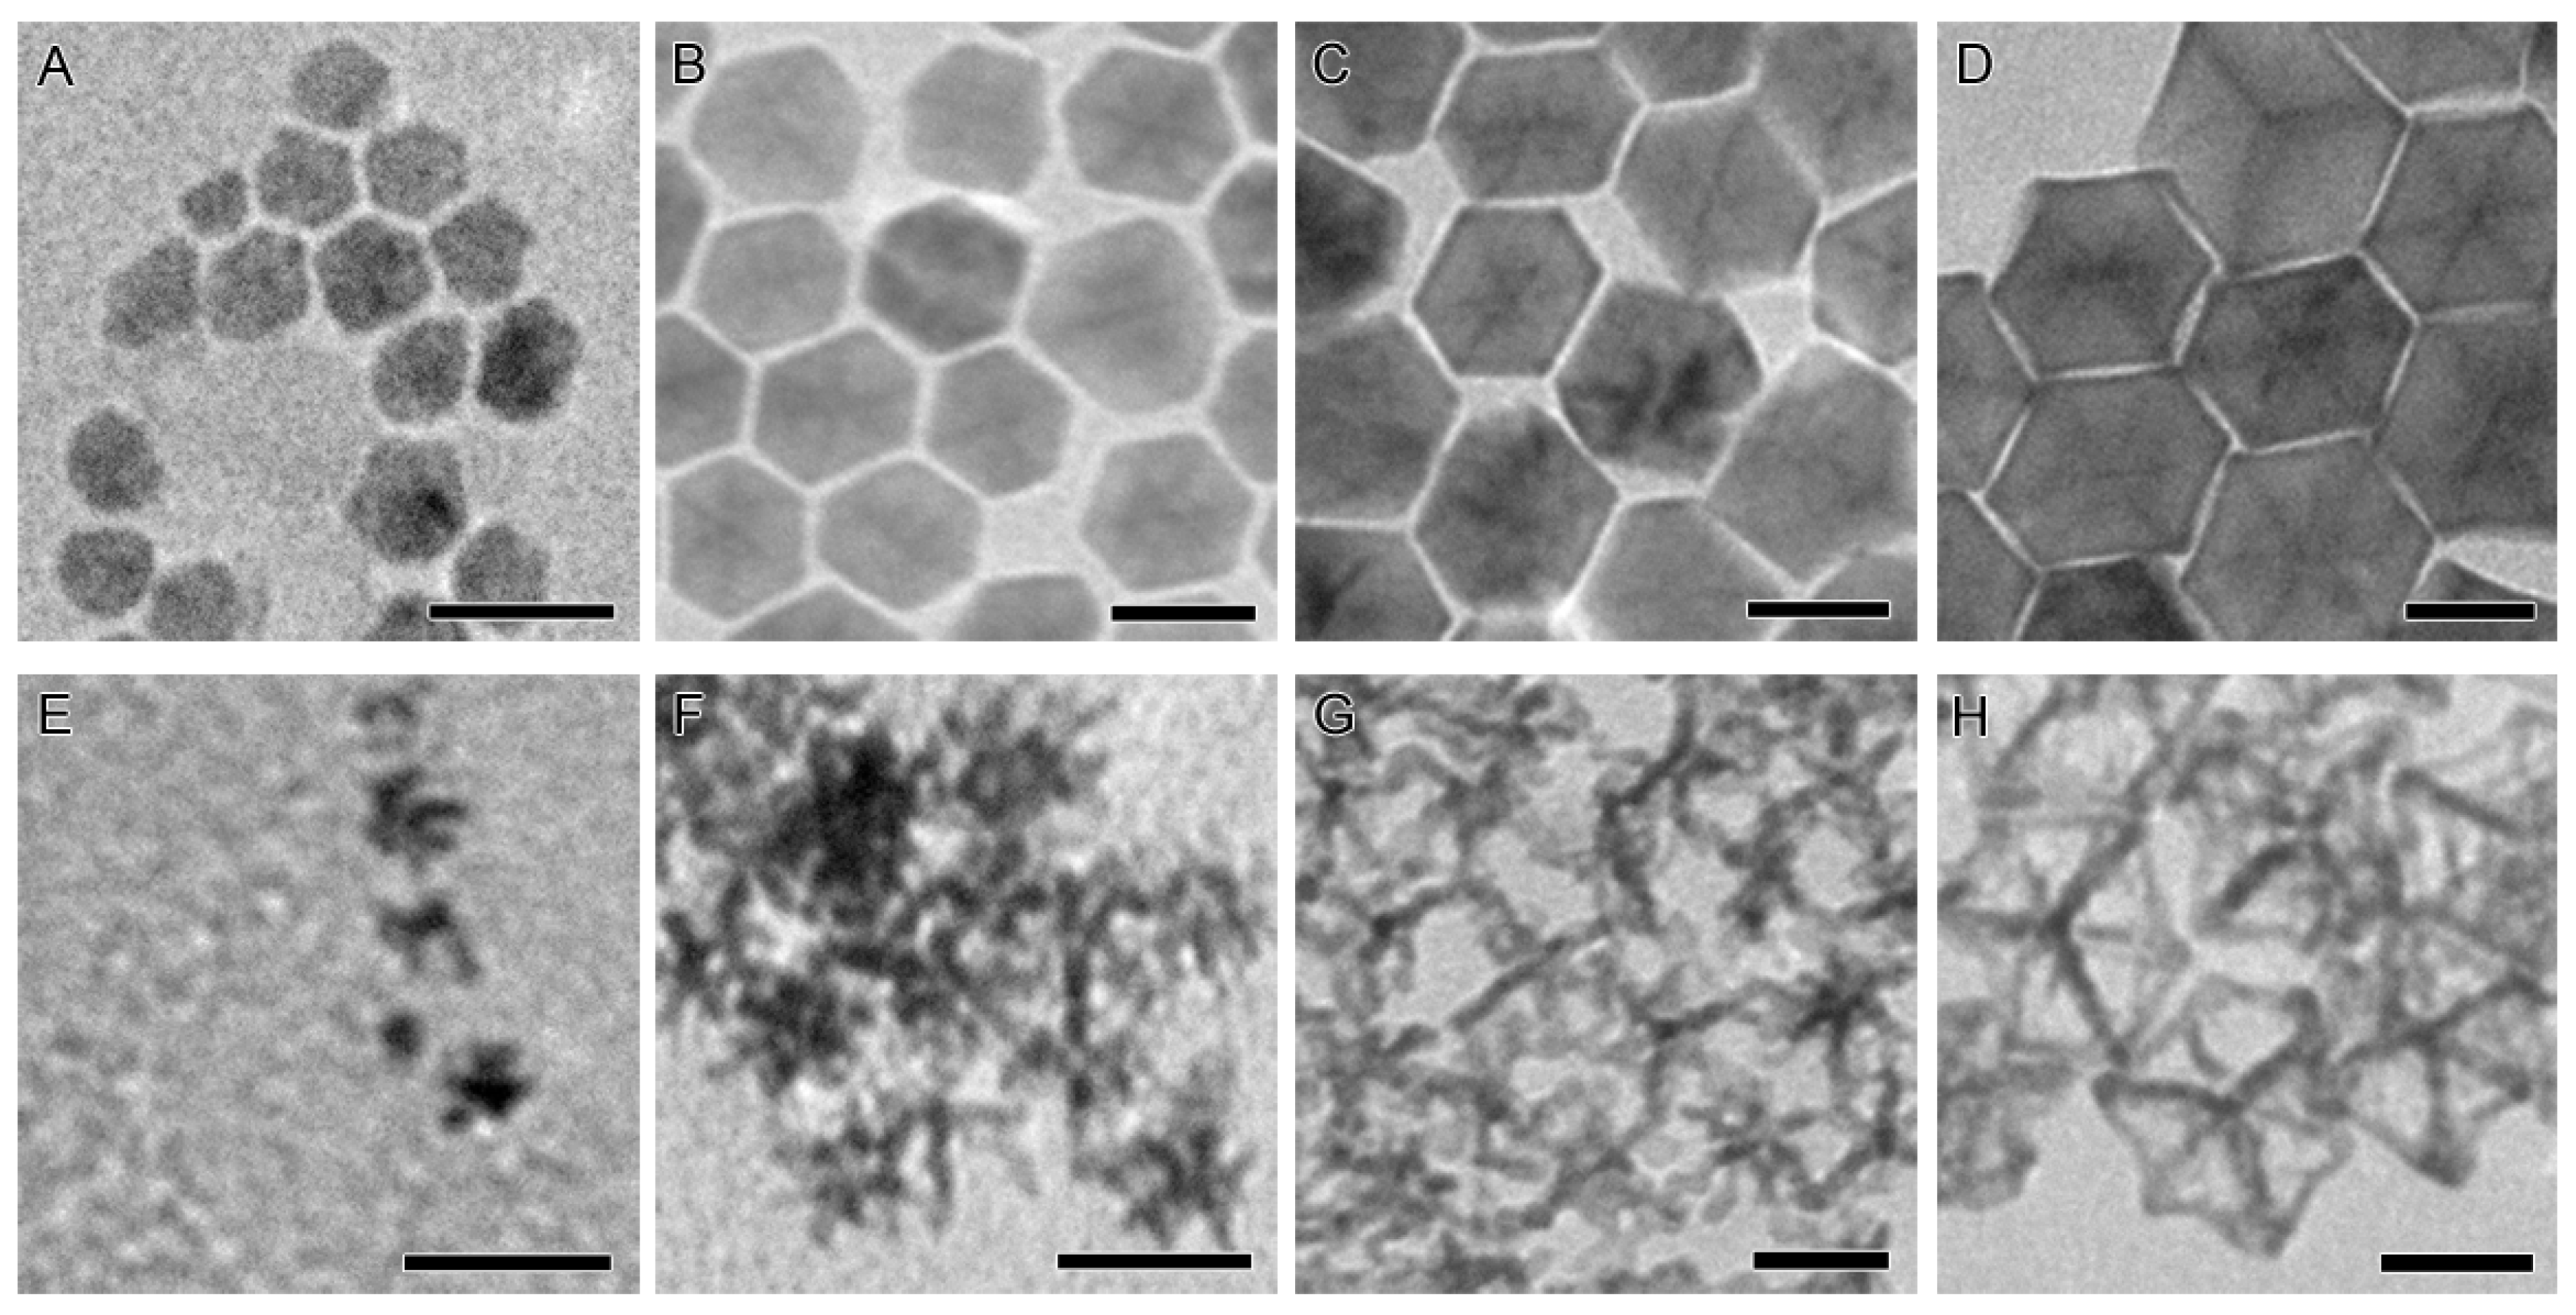
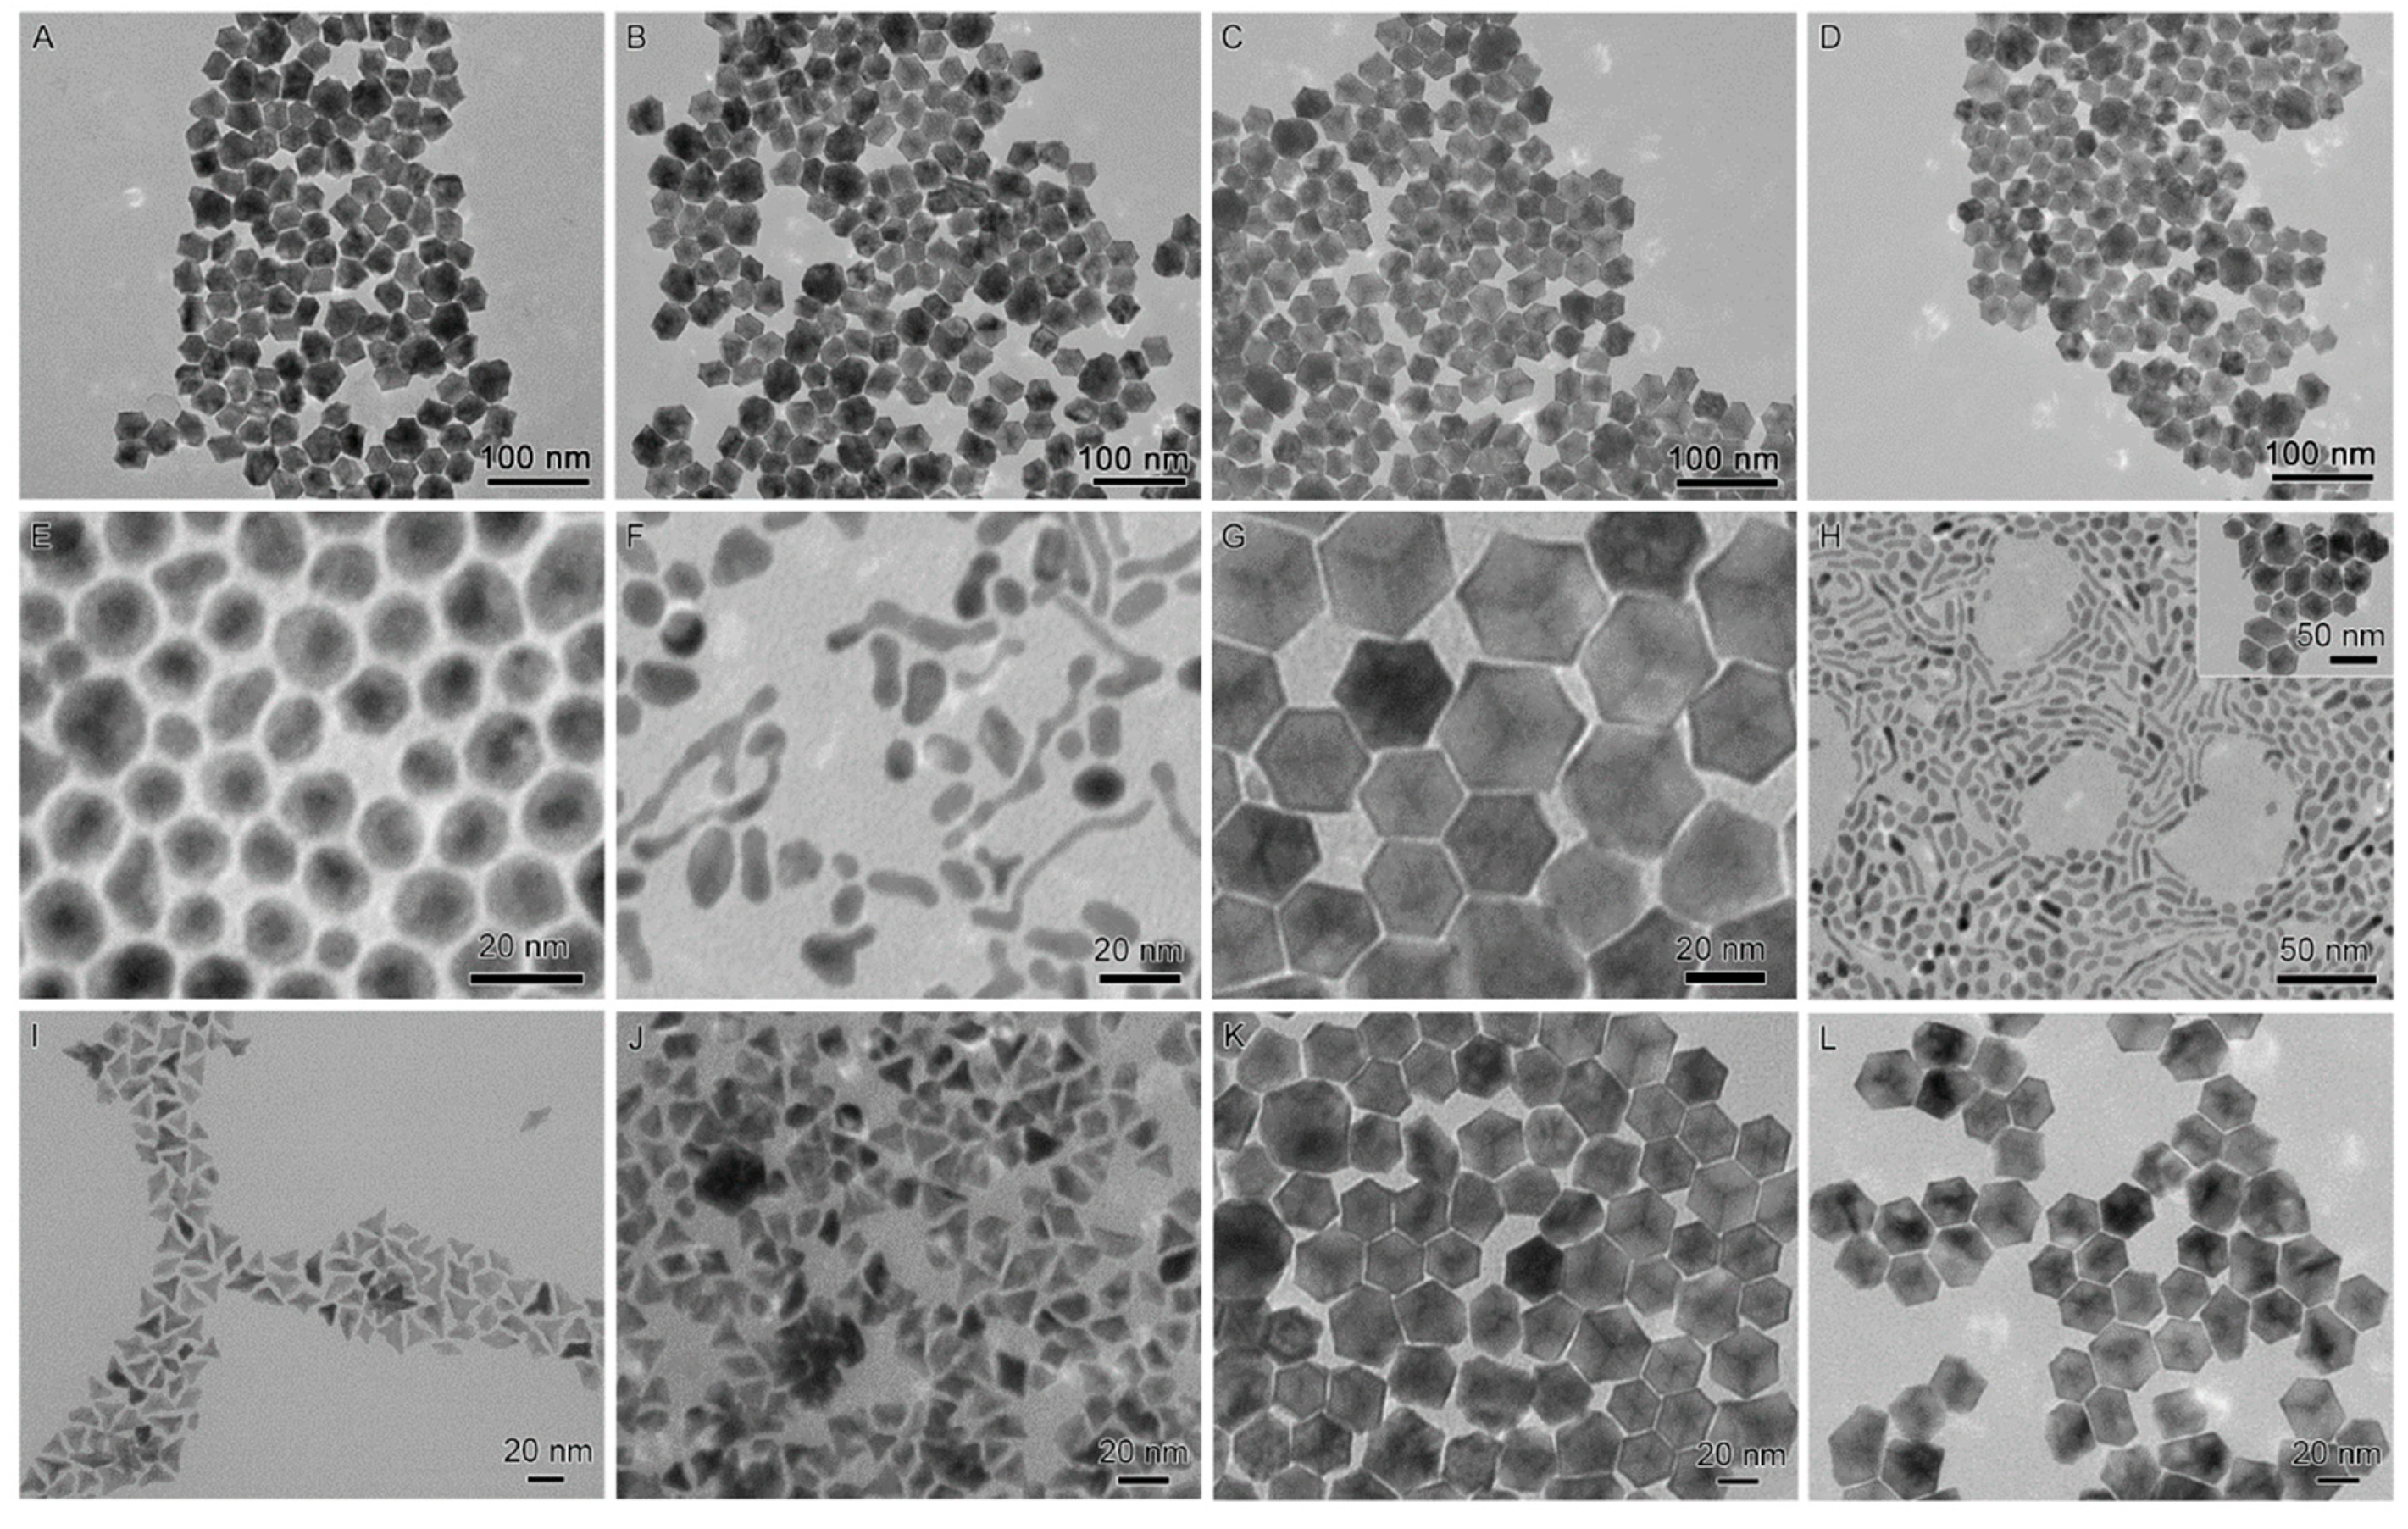
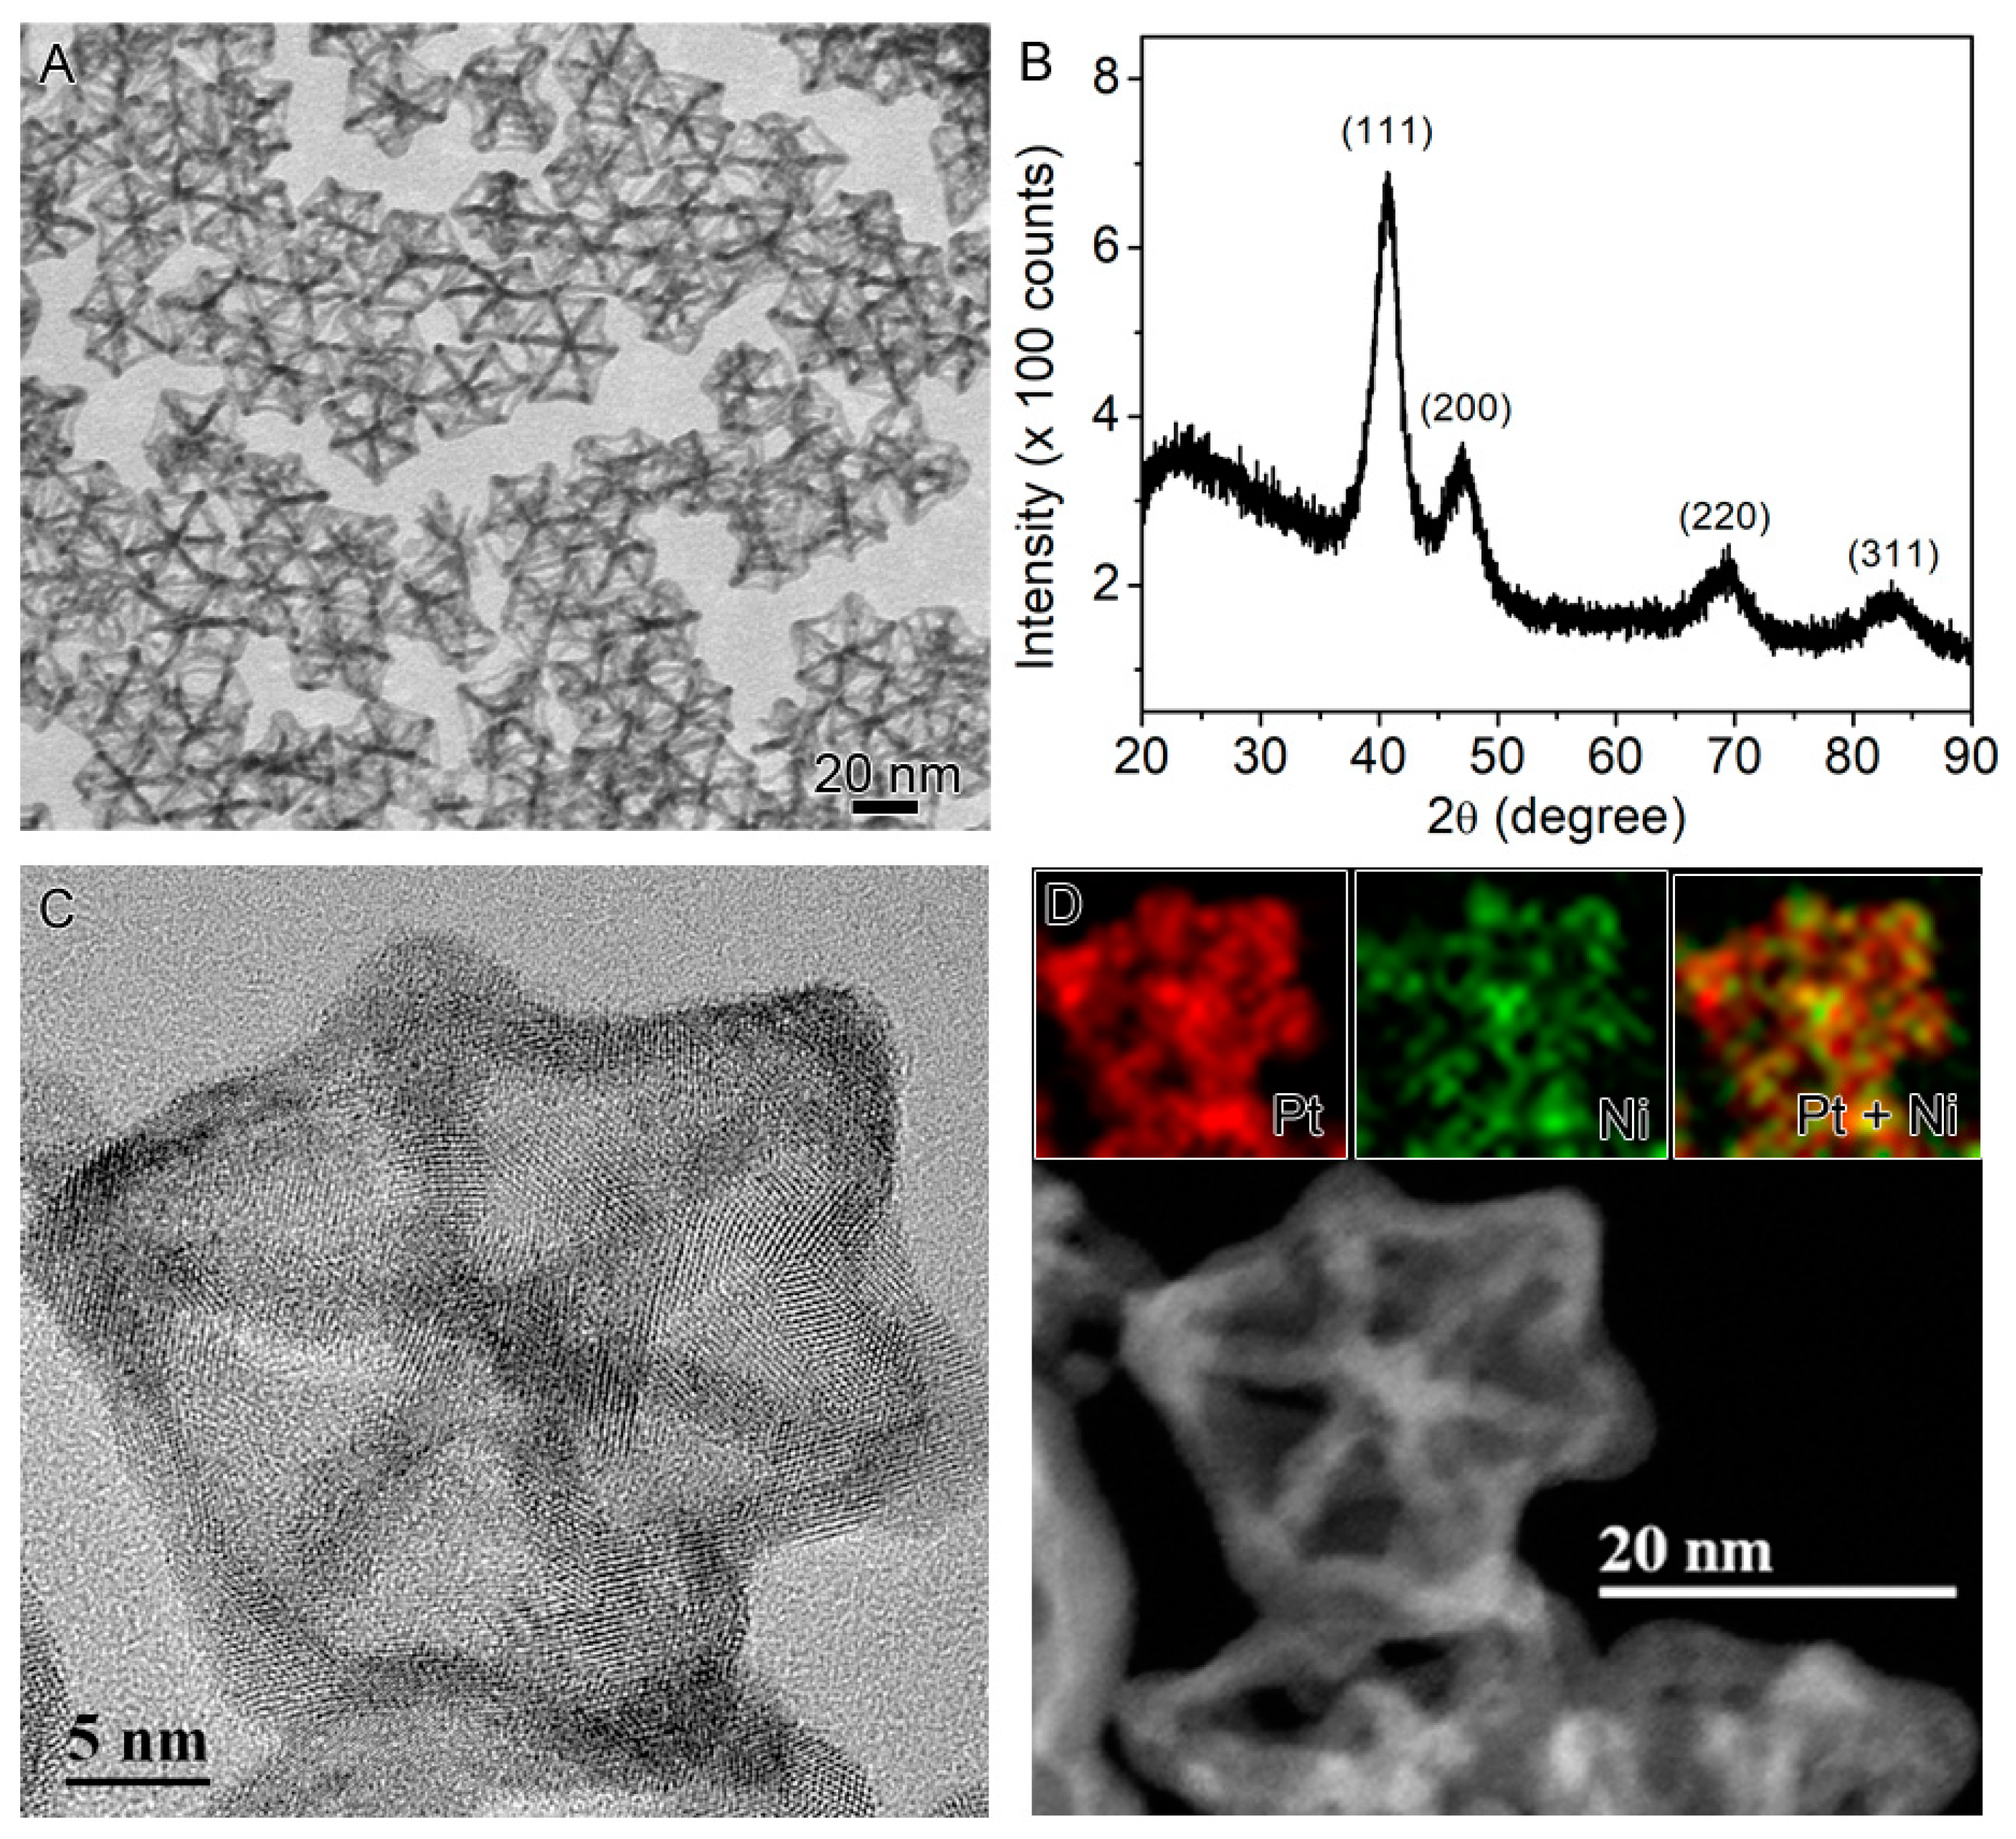
2.1. Synthesis of the Seed-Core-Frame Nanostructures

The seed-core-frame nanostructures were synthesized by modifying our previously-developed seeded co-reduction method for bimetallic nanorods [40]. In this synthesis, aliphatic amines were used as both reductant and solvent, and a sequential injection method was applied to control the growth of the desired nanostructures. A two-step procedure was involved by first forming the Pt seeds prior to the injection of Ni precursors to yield the Pt–Ni nanostructures. Figure 1 displays the electron microscopy characterization of the complex core-frame nanostructures, consisting of a branched Pt seed, a Ni core surrounding the seed, and a Pt-rich frame. The overall structure adopts a rhombic dodecahedral shape with the edge length of 20 nm as shown in the transmission electron microscope (TEM) overview image of the sample (Figure 1A) and the tomography snapshots of a single particle (Figure 1B). The high-resolution TEM (HRTEM) image of a representative nanostructure indicates that the nanostructure is single crystalline and its surface is rich in high Miller index facets (Figure 1C). The composition of each part of the nanostructure is visualized in the energy dispersive X-ray spectroscopy (EDS) mapping of Pt and Ni that matches well with the Z-contrast in the high-angle annular dark-field scanning transmission electron microscopy (HAADF-STEM) image, confirming the elemental distribution of Pt and Ni in the nanostructure (Figure 1D).
The anatomy of the seed-core-frame hierarchical structures was carried out by the removal of Ni from the aliquot samples taken from the synthesis. Figure 2A–D, displays the TEM images of the aliquot samples obtained from the synthesis after the sequential injection at different time periods. These images clearly shows that the rhombic dodecahedral nanoparticles forms immediately after the injection of Ni precursor and then gradually grows into larger nanoparticles. The size of these rhombic dodecahedra by measuring the diagonal of the nanoparticles gradually evolves from 10 nm to 20, 30, and 40 nm within 20 min after the injection of Ni precursor. To confirm the seed-core-frame structure, these aliquot samples were further soaked in acetic acid that could remove pure Ni from the nanoparticles. Figure 2E–H, displays the TEM images of the corresponding etching products. Small branched Pt seeds (<10 nm) were found in the sample immediately after the injection of Ni precursors. Samples obtained at 2 min and 10 min after the Ni precursor injection contained larger branch-like structures as a result of the collapse of the frame nanostructures that were not well developed in the early stage of the synthesis. At 20 min later, the well-constructed nanoframes were observed in the sample. These results elucidate the morphology evolution during the formation of the seed-core-frame hierarchical structure.
The key to form the seed-core-frame hierarchical structure was further investigated by systematically altering the reaction conditions. The use of different aliphatic amines (C8–C18) and oleylamine has little effect on the resultant structures which all retain the rhombic dodecahedral shape (Figure 3A–D). However, the choice of Pt precursors is one of the key factors to obtain the branched Pt seeds as the foundation to form the rhombic dodecahedra and thus the core-frame structure. Figure 3E–H, displays the TEM images of the products from the synthesis using Pt(acac)2, K2PtCl4, K2PtCl4 with oleic acid containing equivalent moles of H as K, and H2PtCl6. The results suggest that the shape of the seeds (in the inset of Figure 3E–H) dictates the final bimetallic structure and the stronger the acidic condition the more favorable to the hierarchical structure. Furthermore, the feeding ratio of H2PtCl6:Ni(acac)2 also plays a role in the formation of the hierarchical structure (Figure 3I–L). The pure H2PtCl6 and pure Ni(acac)2 yielded highly branched Pt sea urchin nanostructures and irregular Ni nanoparticles, respectively. The high ratio of H2PtCl6:Ni(acac)2 (≥ 1:1) resulted in slightly branched nanostructures or concave tetrahedra/octahedra while the ratio of H2PtCl6:Ni(acac)2 ranging from >1:1 to 1:6 generated the hierarchical rhombic dodecahedra. In the latter, the size of the rhombic dodecahedra decreased with increased ratio of H2PtCl6:Ni(acac)2. This size decrease could be attributed to the presence of Pt–Ni co-reduction from homogeneous nucleation in addition to heterogeneous nucleation on the Pt seeds as the concentration of Ni(acac)2 increases. The homogeneous nucleation depletes the concentration of both precursors for heterogeneous growth, resulting in the reduction of the particle size similar to those reported in the literature from homogeneous nucleation [11,12,13,15,16].

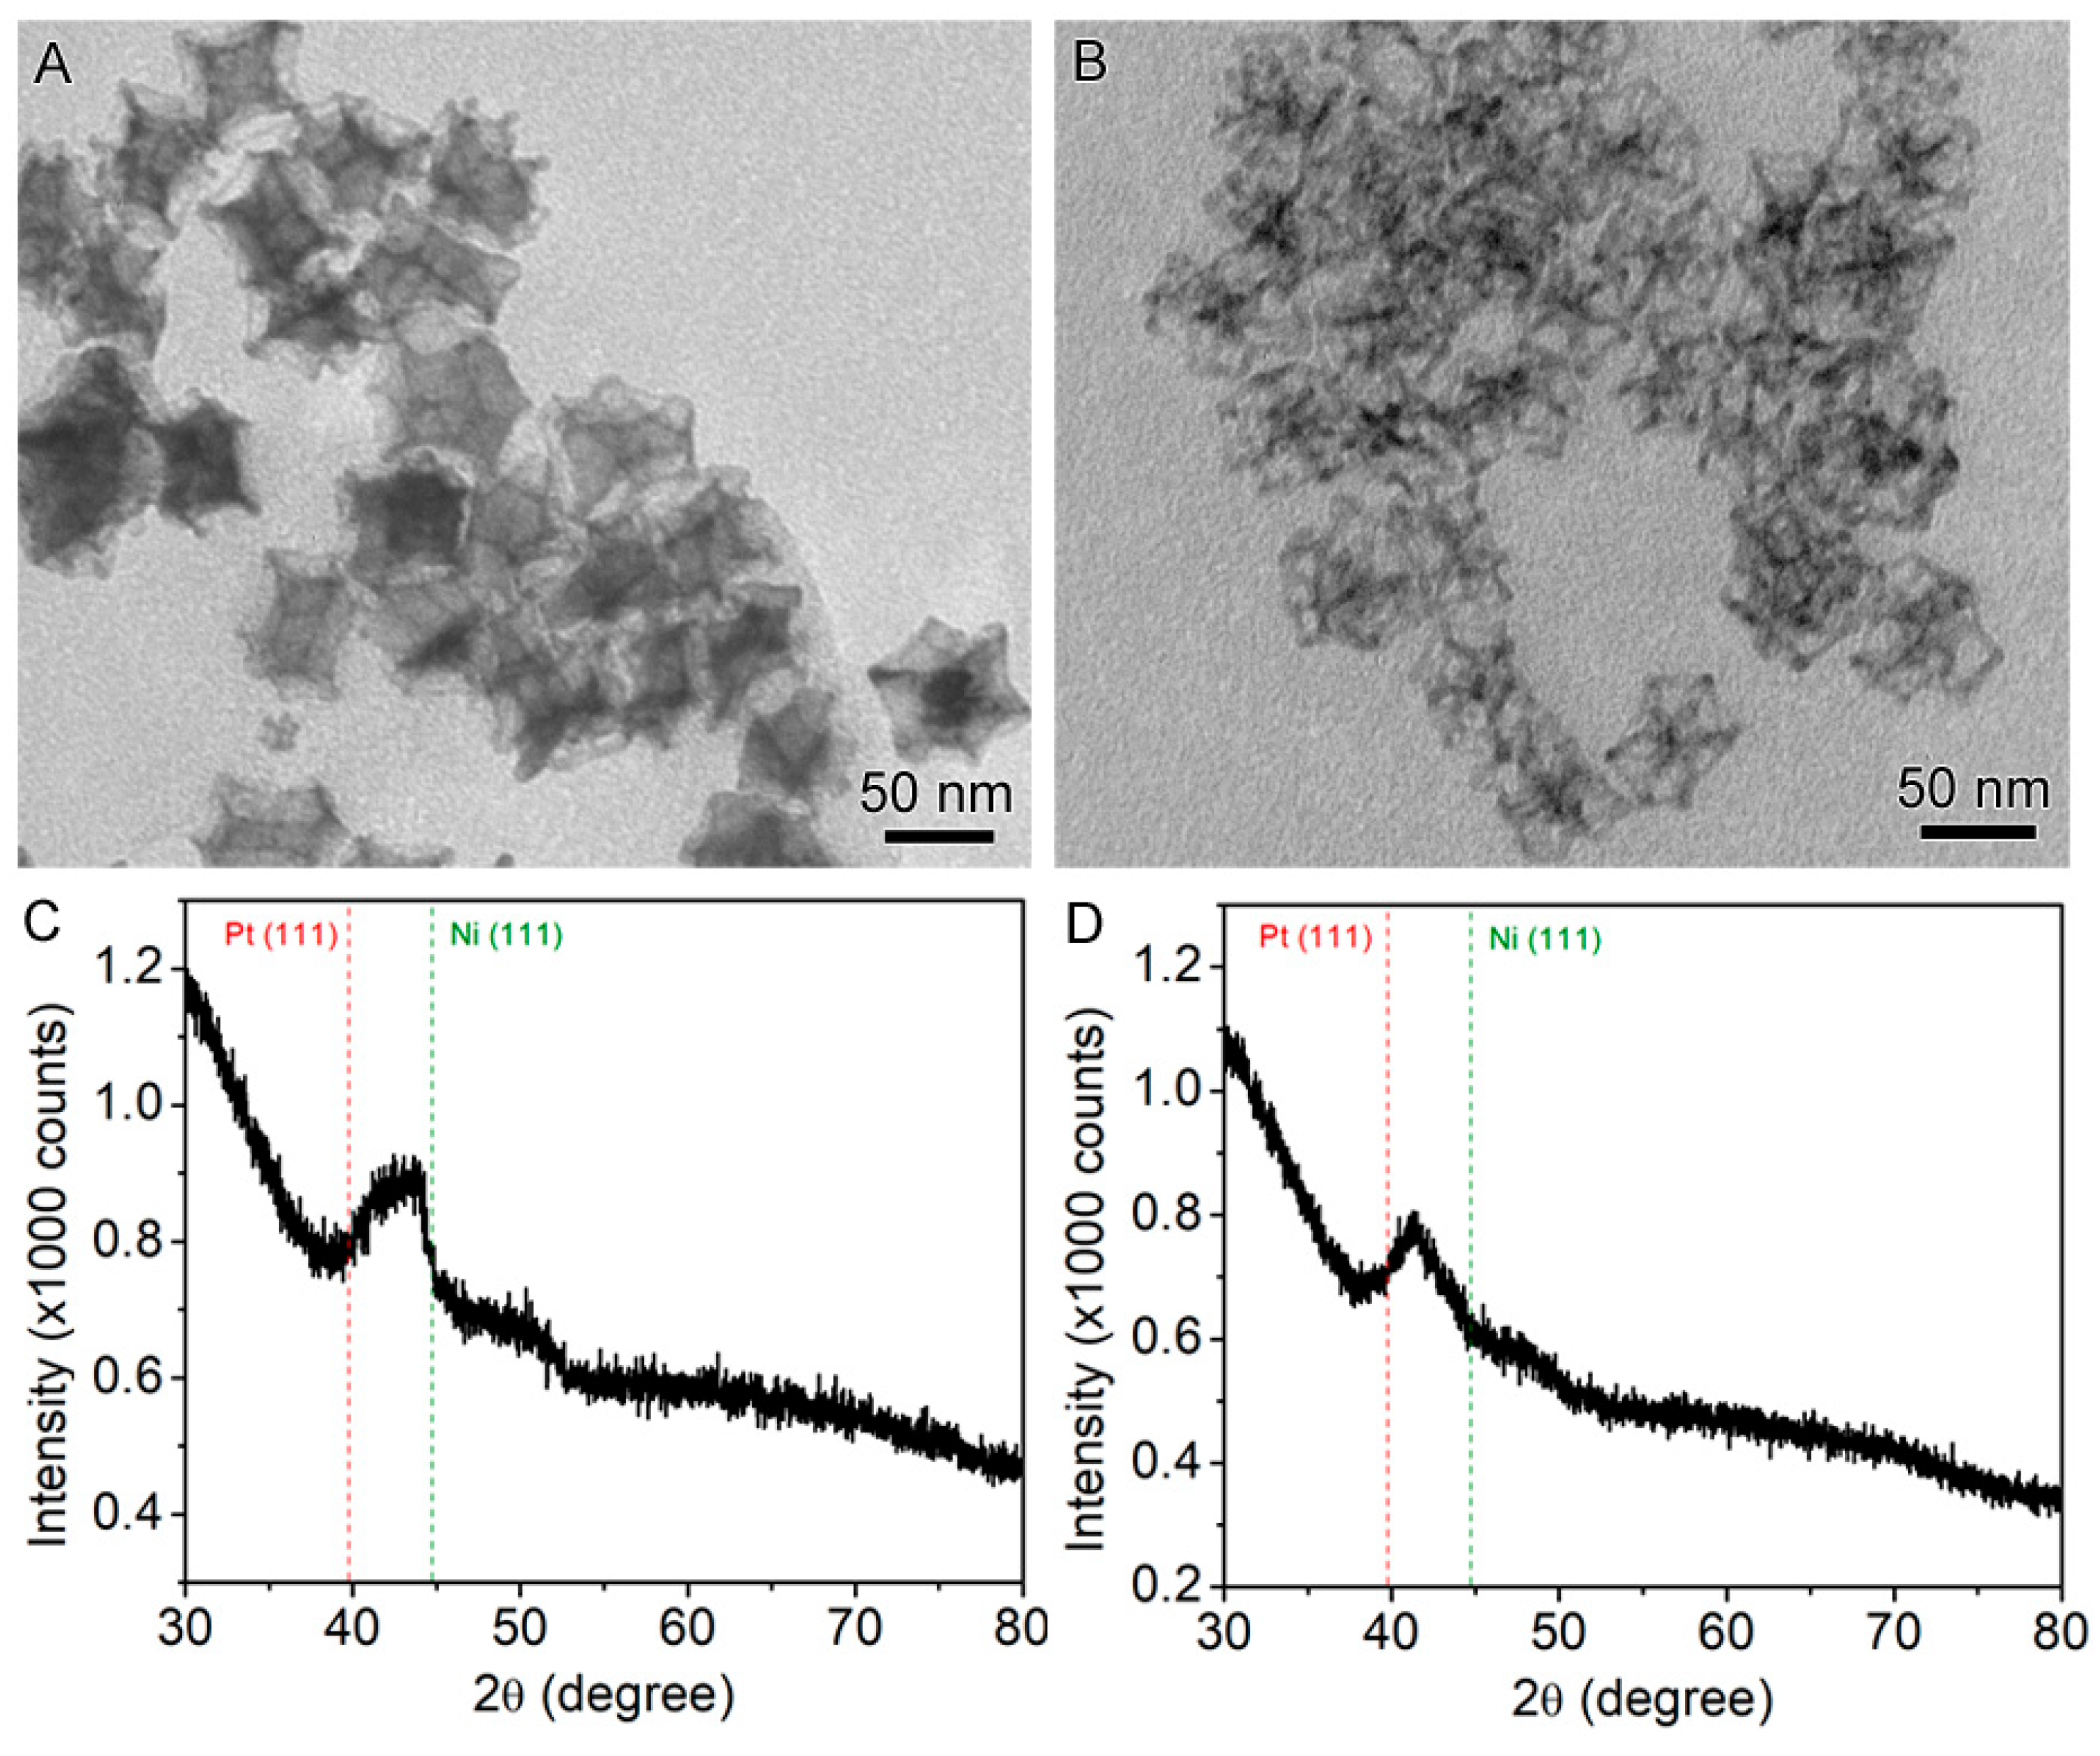
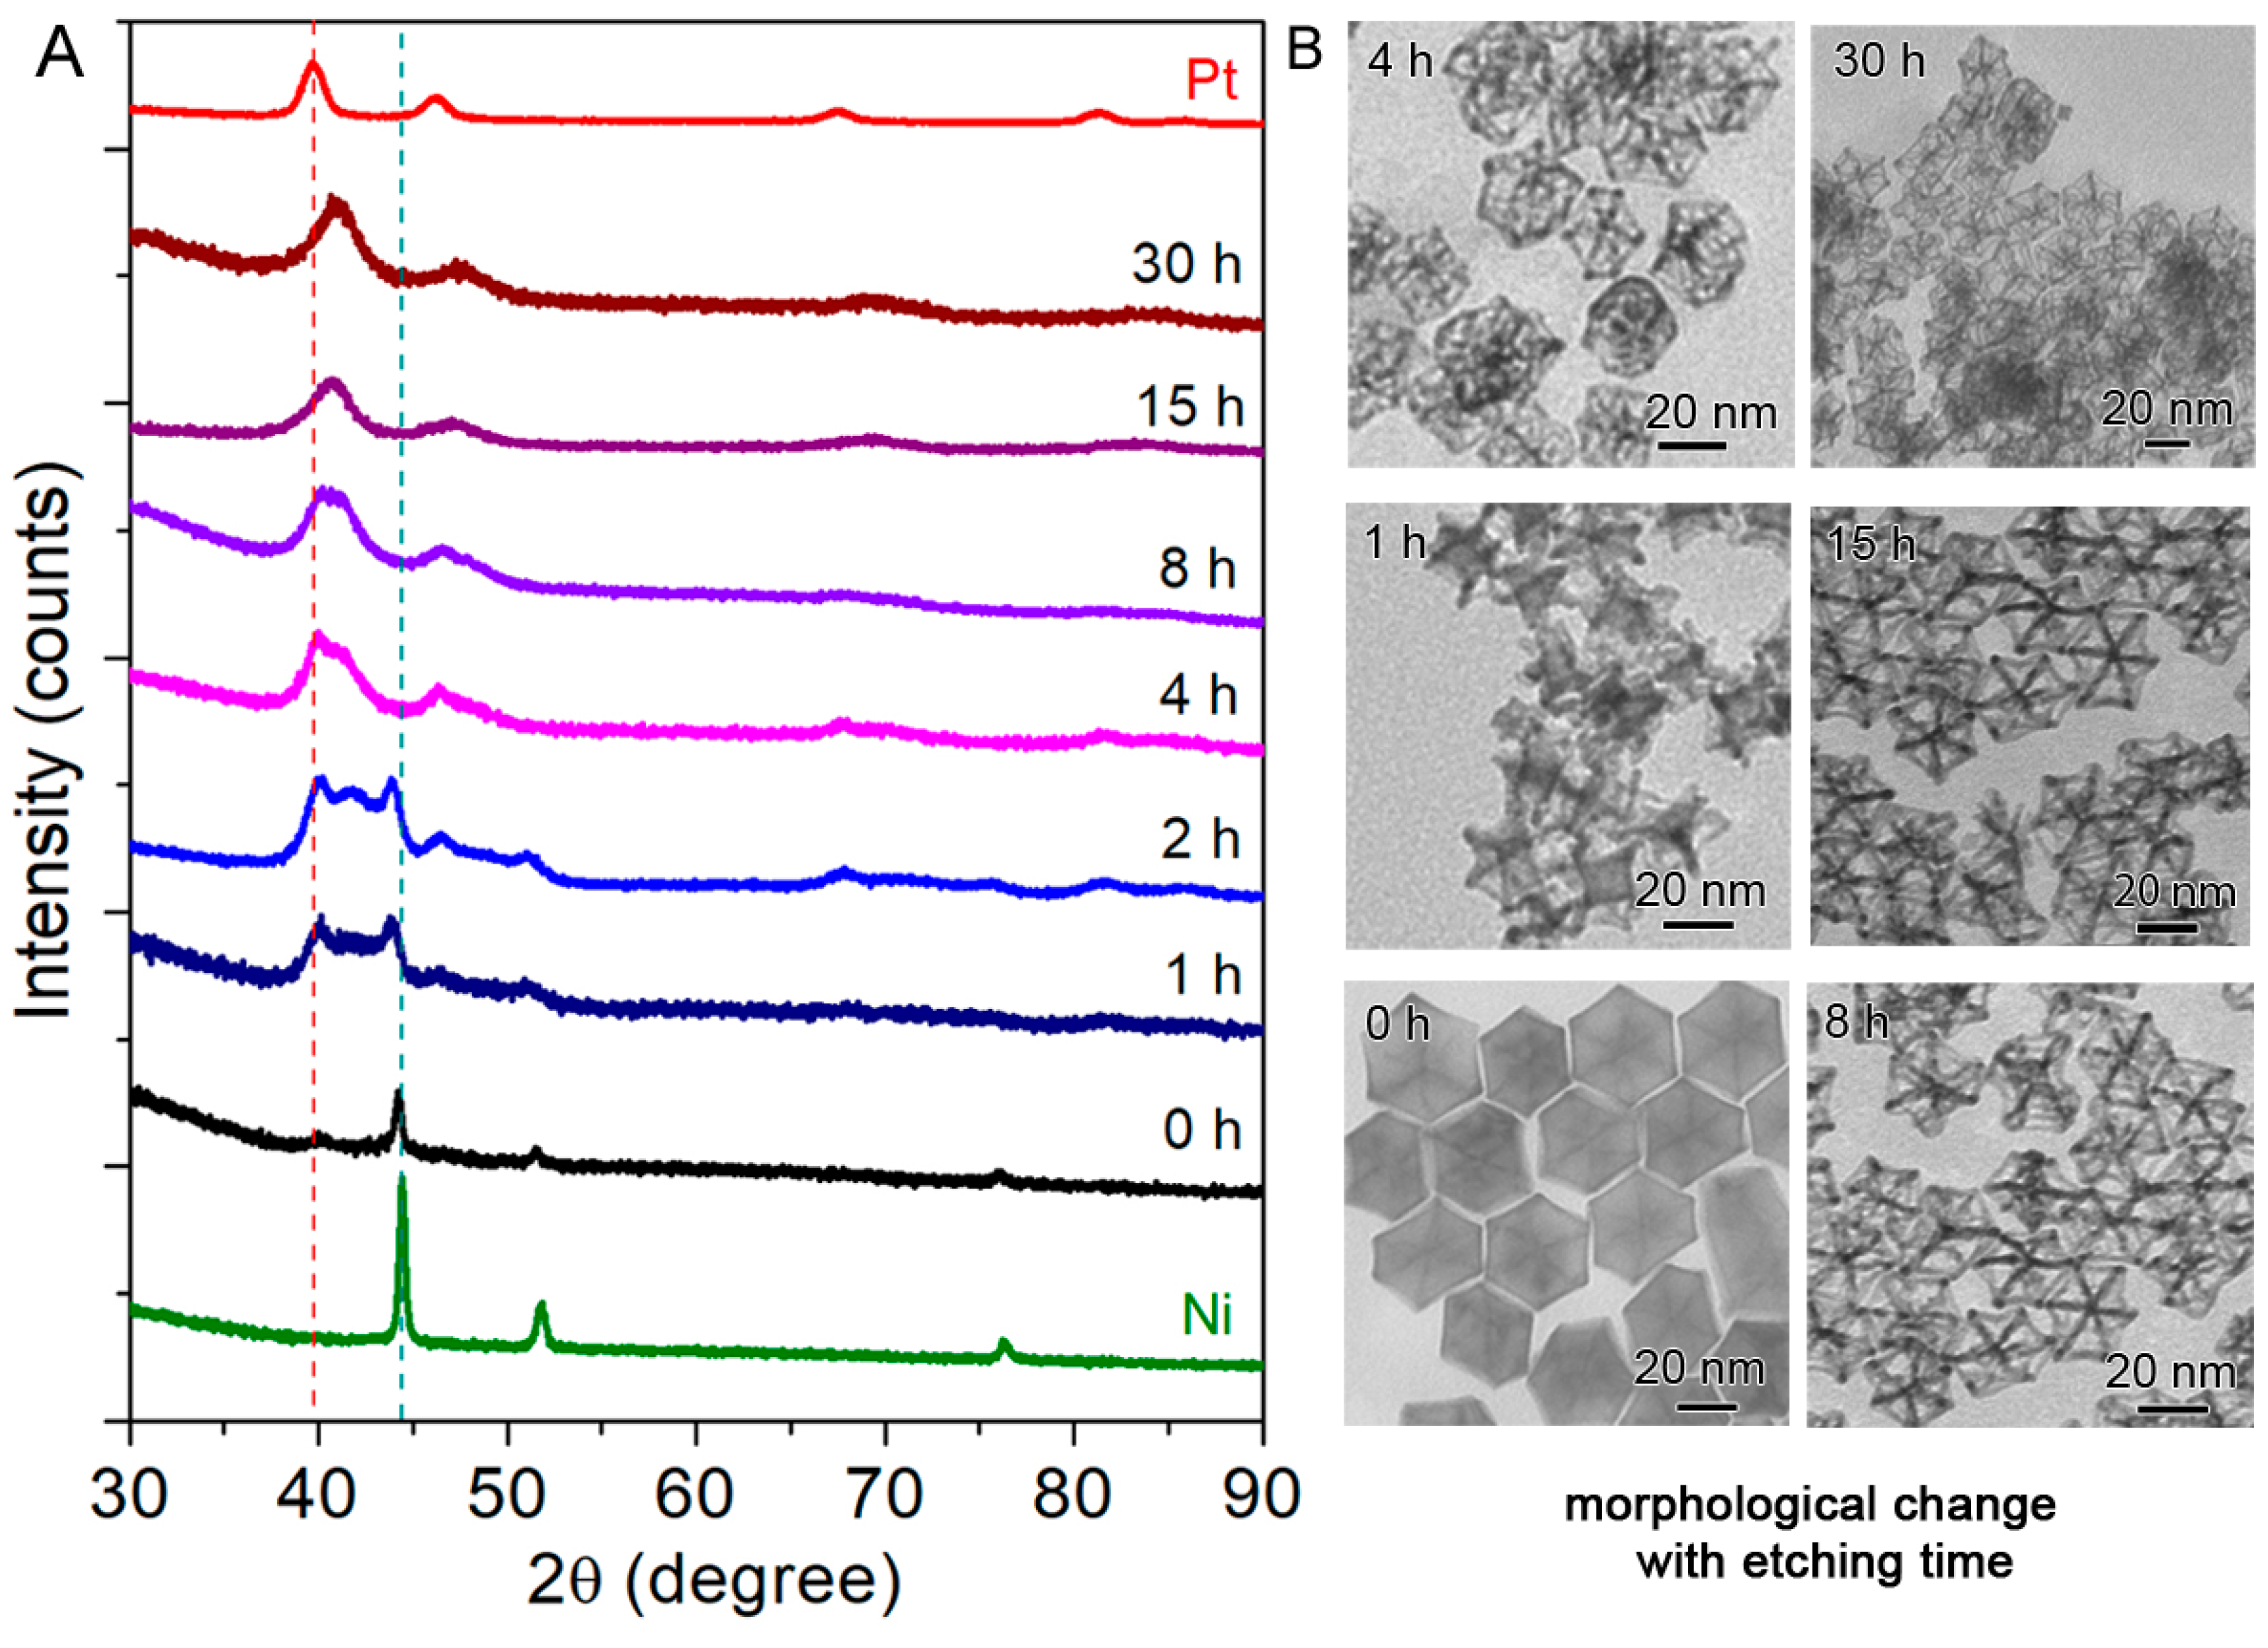
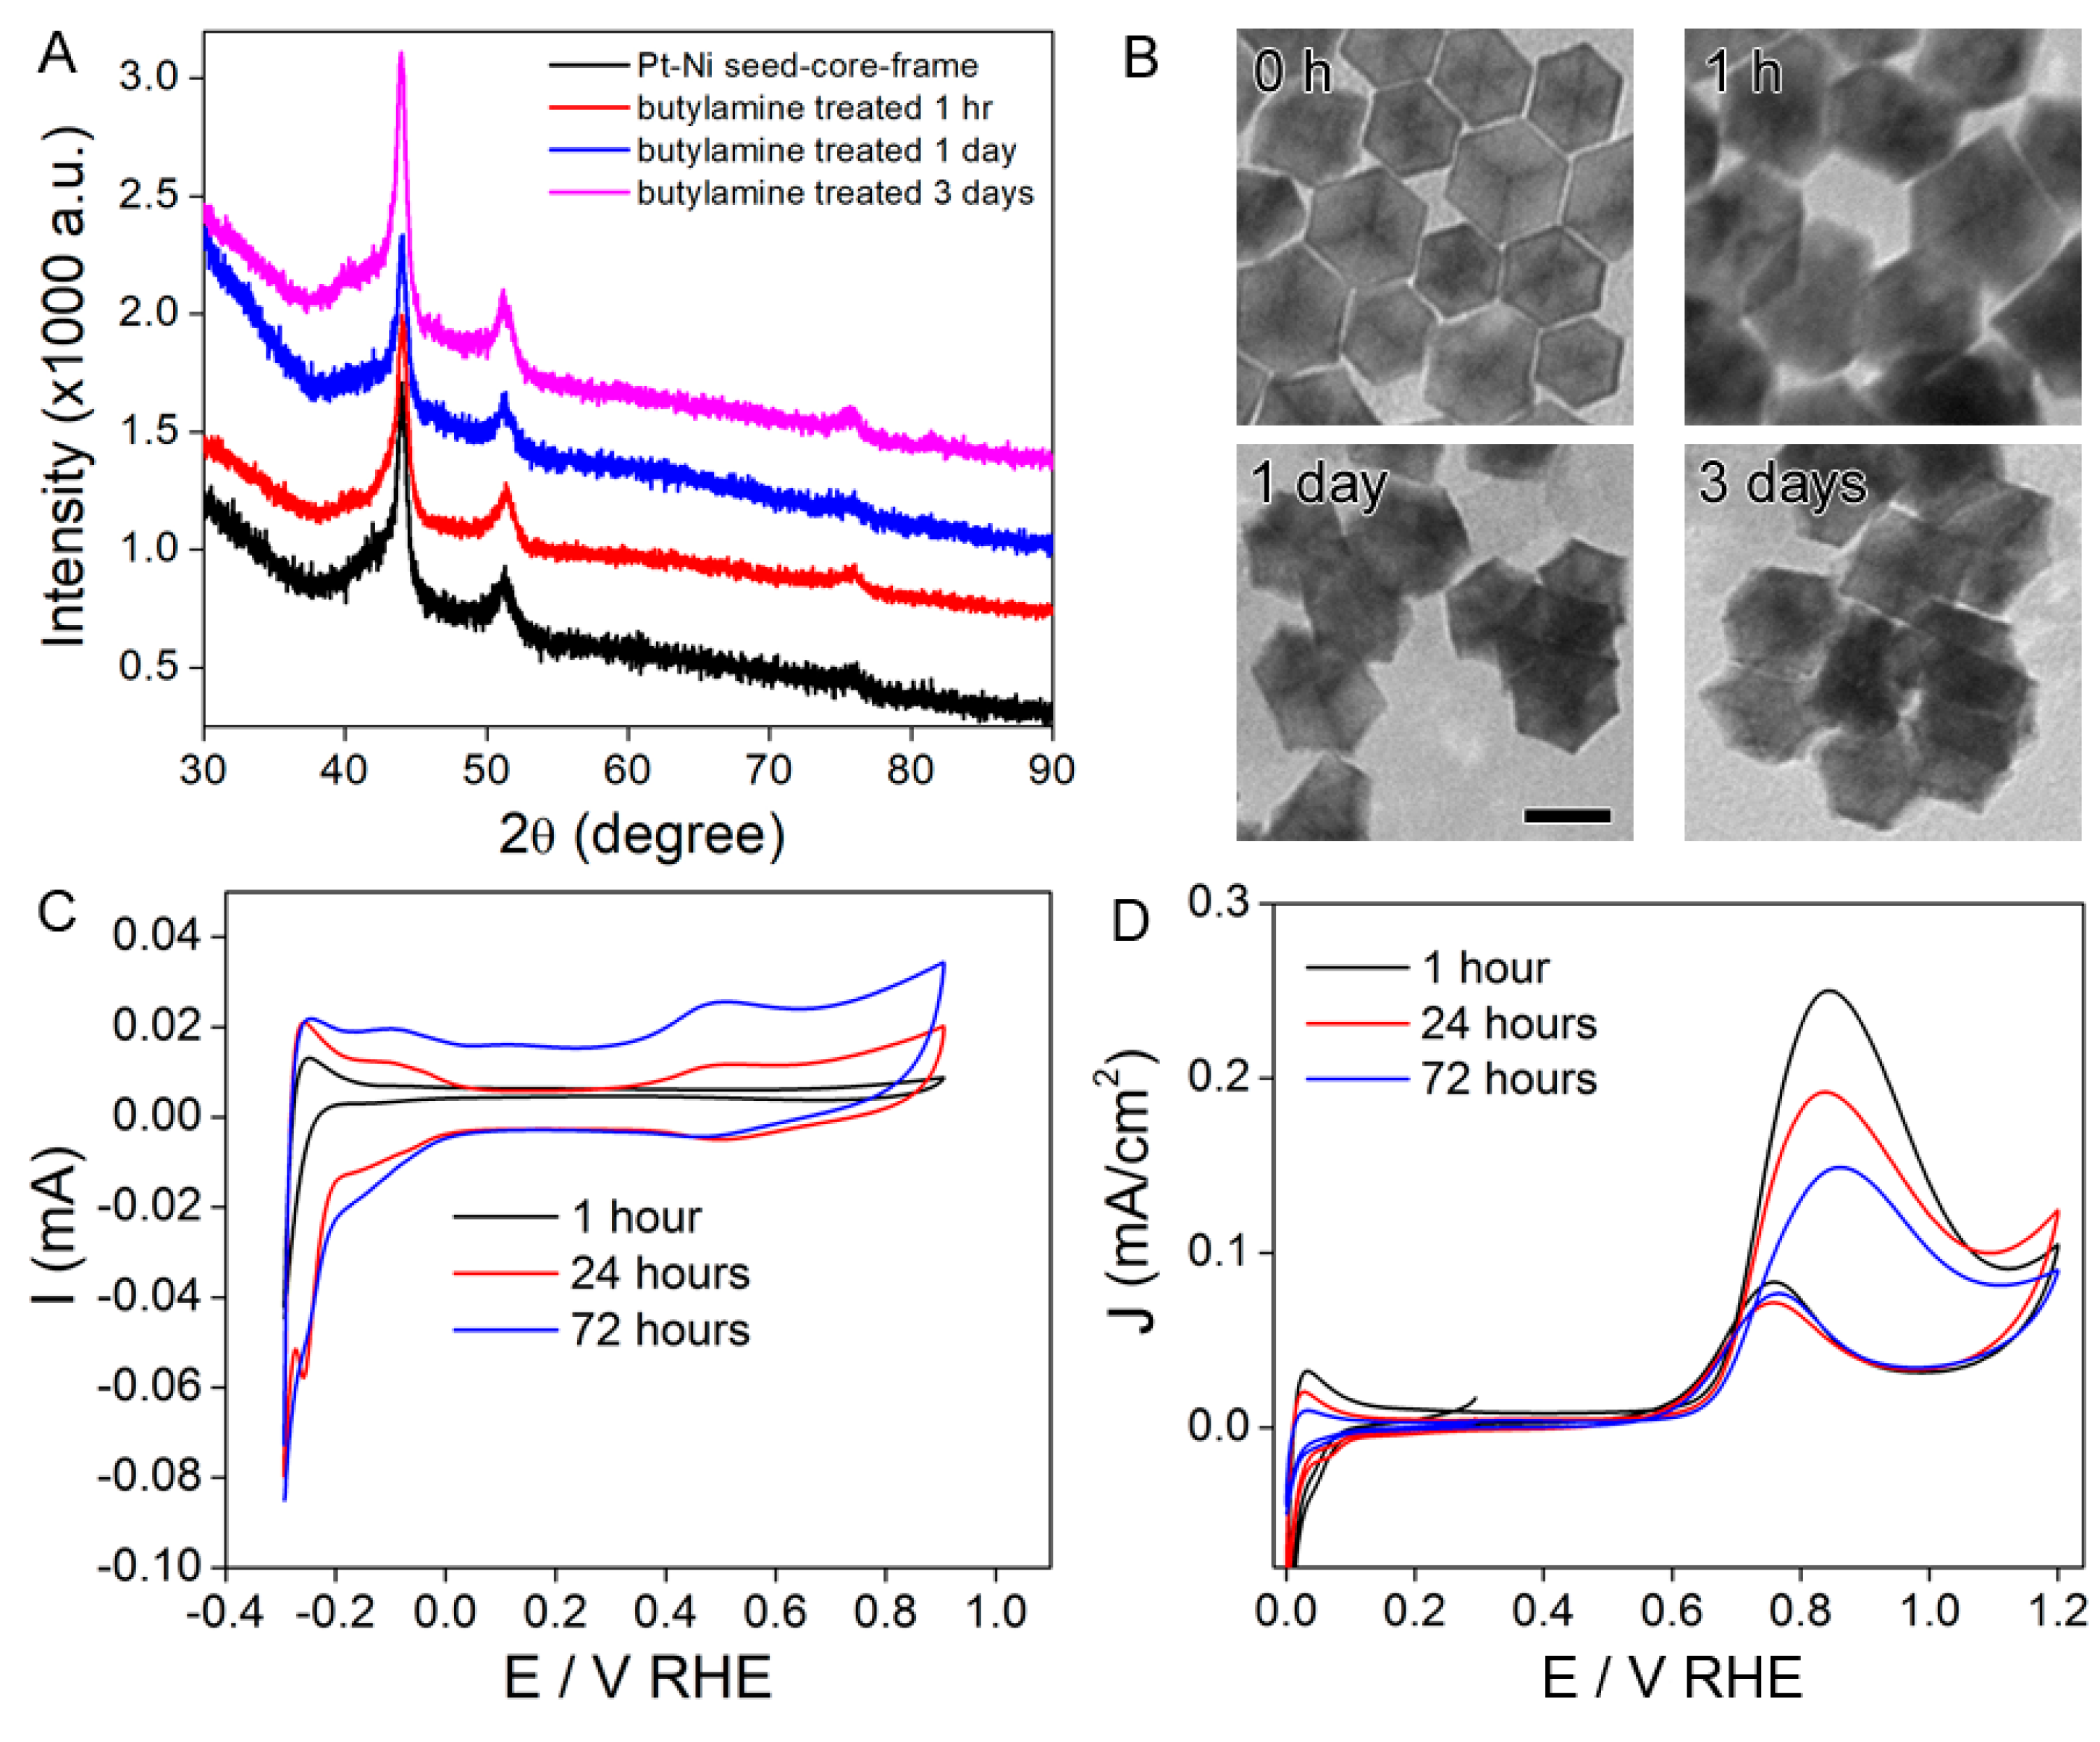
2.2. Conversion of the Seed-Core-Frame Hierarchical Nanostructures to Nanoframes

The seed-core-frame hierachical nanostructures could be converted to nanoframe structure through the etching method using 50% v/v acetic acid aqueous solution. After the etching process at 60 °C for 12 h, the reaction yielded Pt–Ni nanoframes with an average edge length of 18.0 ± 2.1 nm as shown in Figure 4A. The powder X-ray diffraction (XRD) pattern exhibited four peaks that could be indexed to the (111), (200), (220), and (311) diffractions of a face-centered-cubic (fcc) structure (Figure 4B). The peak positions were corresponding to 40.64, 47.08, 69.50, and 82.94 degrees located in between those of pure Pt and pure Ni metals. According to Vegard’s law of the linear relationship between latter parameter and alloy composition [41], the XRD yielded a lattice constant of a = 3.83 Å, suggesting an approximate composition of Pt3Ni given that the lattice constants of pure Pt (aPt) and pure Ni (aNi) are 3.923 Å and 3.523 Å, respectively. The elemental Pt and Ni appeared to uniformly distribute across the frame structure. The elemental analysis by atomic absorption (AA) gave a Pt/Ni ratio of 73:27 in agreement with the estimated value from the Vegard’s law. Using the Scherrer equation [42,43], the size of the crystalline domain was estimated to be ~3.0 nm based on the full width at half-maximum (FWHM) of the (111) diffraction. The HRTEM image in Figure 4C indicates that Pt3Ni nanoframes were polycrystalline and the width of each edge was approximately 2–3 nm which was consistent with the measurement from the XRD band width. The HAADF-STEM image shows a frame architecture of 24 edges which retains its primary rhombic dodecahedral structure, while the EDS mapping confirms the composition of Pt and Ni alloy (Figure 4C).
The morphology and composition of etched products could be manipulated by controlling the temperature of the etching process. Based on the standard electrode potentials, the reactivity of Ni is more active than H and thus the etching reaction is as follows: Ni(s) + 2CH3COOH(l)→Ni2+(aq) + 2CH3COO(aq) + H2(g). Figure 5 displays the TEM images and the corresponding XRD patterns of the products from the reactions at two other temperatures (0 °C in ice bath and 20 °C at room temperature) for 12 h in addition to the above condition at 60 °C. The results indicate the distinct difference in the morphology and composition of the products obtained at different temperatures. Both the rates of the etching process and diffusion are expected to increase as the temperature increases. At 0 °C, the seed-core-frame nanostructures were partially emptied, resulting in the concave polyhedral nanostructures. When the temperature increases to 20 °C, the etching process yielded the nanoframes with ultrathin skeleton having very poor mechanical strength that are easy to collapse. The XRD patterns suggest that pure Ni still remains in these nanostructures with the product from the reaction at 0 °C having more pure Ni than that from the reaction at 20 °C.
In addition to temperature, the reaction time could also affect the morphology and composition of the resultant products. The time-course study was carried out for the etching process at at 60 °C and the intermediate samples were collected and characterized by TEM and XRD. Figure 6 shows the XRD patterns of each intermediate sample indicating the compositional change during the course of etching reaction from initial Ni-rich composition to Pt–Ni alloys. The insets display the TEM images of selective samples detailing the corresponding morphological evolution from the polyhedral solid nanoparticles to nanoframes. From these results, the etching process appeared to start from the planar surface of the polyhedral nanoparticles whose (110) faces were rich in Ni, yielding concave polyhedra. A similar trend was observed during ORR under acidic conditions which the octahedral Pt–Ni nanoparticles became concave octahedra with the edge and corner intact [44]. As the reaction proceeded, more Ni atoms were oxidized to Ni2+ ion and leached out from the concave structure, resulting in the frame of the rhombic dodecahedral structure. The composition of the skeletons was changed from almost pure Pt for the polyhedral solid nanoparticles to a mixture of a Pt–Ni alloys and Pt3Ni for the nanoframes. It is implied that the diffusion rate of Ni to Pt was faster than that of Pt to Ni due to the Kirkendall effect [45,46]. Little compositional and morphological changes of the nanoframes were found after the sample were etched for 30 h, suggesting that the Pt3Ni nanoframes were relatively stable under the acidic condition.
The electronic properties of Pt and surface properties for the Pt3Ni nanoframes were further examined by X-ray photoelectron spectroscopy (XPS) and Fourier transform infrared (FTIR) spectroscopy (Figure S1). The XPS peaks attributed to Pt4f5/2, Pt4f7/2 were well resolved. Both peaks were downshifted by 0.37 and 0.38 eV for Pt4f5/2 and Pt4f7/2, respectively, as the structures evolved from polyhedra to concave polyhedra and nanoframes. It is suggested that partial charge was transferred from Ni atoms to Pt atoms as the Pt alloyed with Ni. This observation is consistent with the previous report [33]. After etching, the OLA and HDA ligands on the nanoparticles was replaced by acetic acid molecules. The FTIR characterization of the samples before and after etching with acetic acid. The spectrum of the polyhedra prior to the etching indicates the presence of OLA and/or HDA based on the assignments of characteristic peaks as follows: the oleyl and/or hexadecyl groups in the 2850–3000 cm−1 region, ν(C=C) stretch mode at 1647 cm−1, and NH2 scissoring mode at ~1590 cm−1. After etching, the spectrum of nanoframes capped by acetic acid shows the characteristic peaks of –COO at 1562 and 1423 cm−1, but no peaks of oleyl and hexadecyl groups, suggesting that neither OLA nor HDA is present.

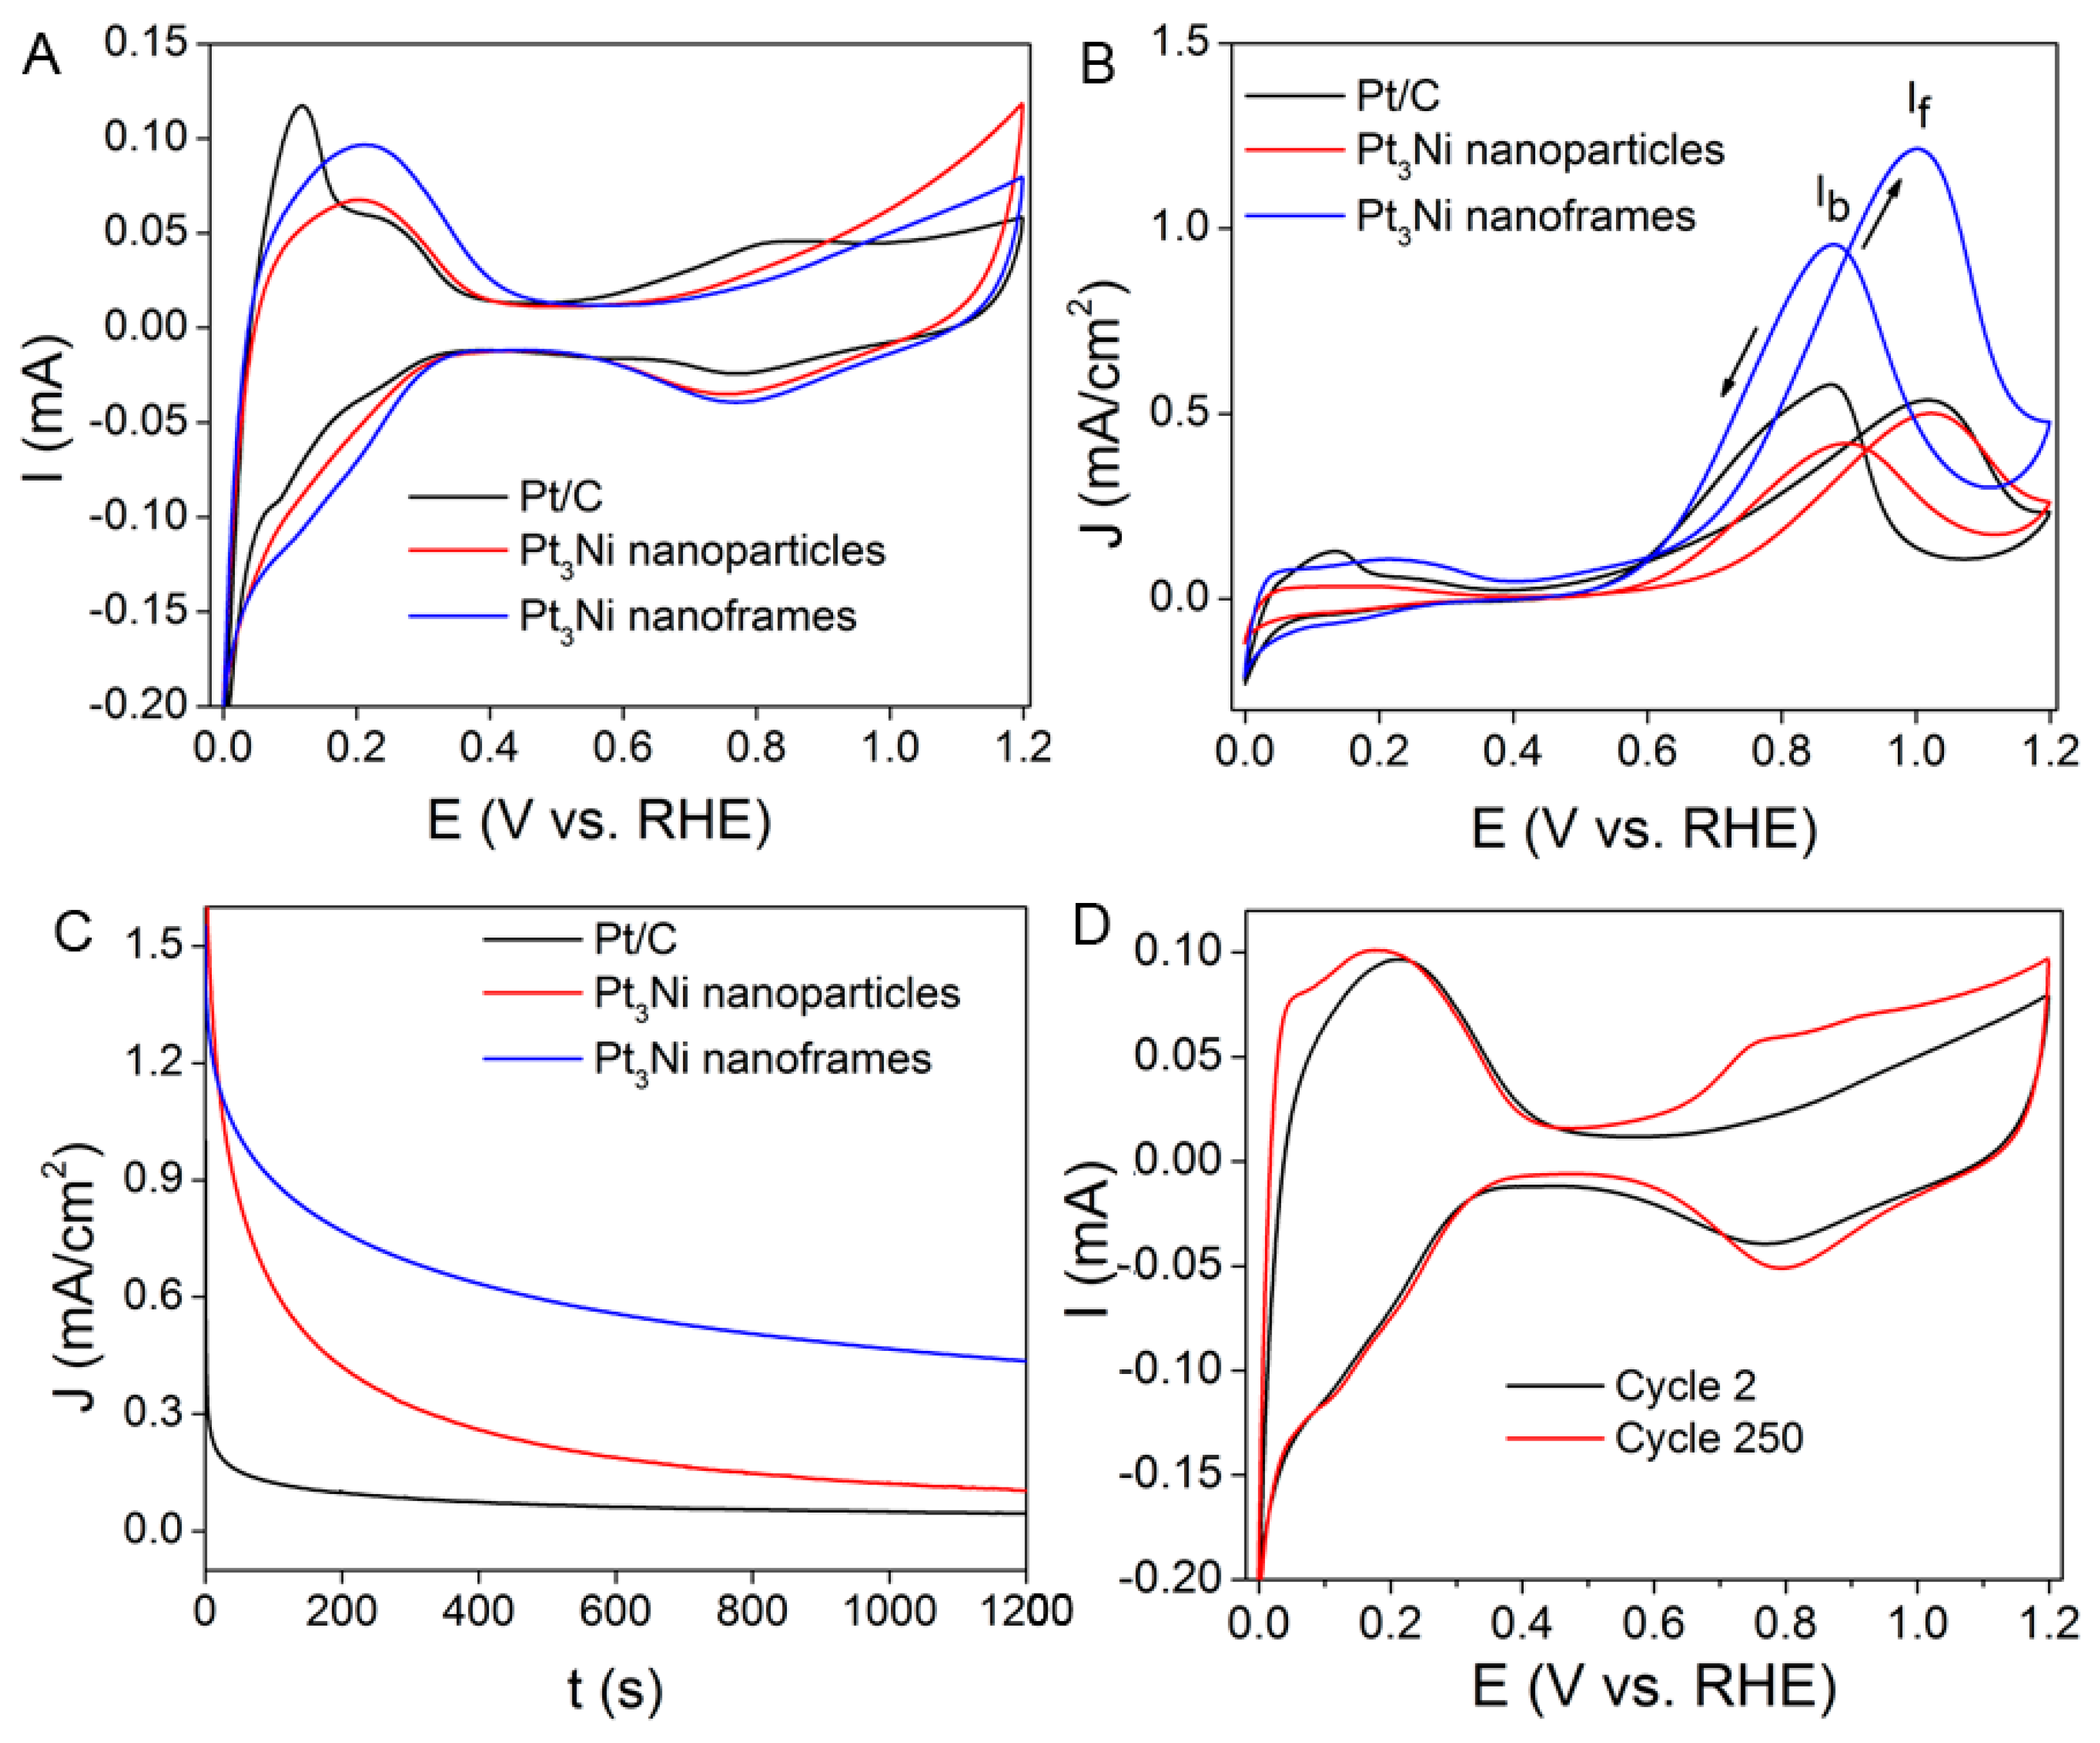
2.3. Electrocatalytic Performance of the Pt–Ni Nanostructures for Methanol Oxidation Reaction (MOR)

The electrocatalytic properties of the Pt–Ni nanostructures were studied for MOR. The electrochemical active surface area (ECSA) of these nanocatalysts were characterized by cyclic voltammetry (CV) using a 0.1 M HClO4 solution with a scan rate of 50 mV/s in a 3-electrode cell. The ECSA can be calculated by integrating the charge passing the electrode during the hydrogen adsorption/desorption with the potential ranging from 0.05 V to 0.4 V vs. reversible hydrogen electrode (RHE) after the correction of the double layer capacitive contribution [47]. The electrocatalytic activity of the nanocatalysts for MOR was examined in a 1 M CH3OH/0.1 M HClO4 solution at a scan rate of 50 mV/s. The electrocatalytic stability was evaluated by the chronoamperometry (CA) measurements performed at the peak current for 1200 s and by the ECSA changes after cycling. Figure 7 displays the structural characterization and the electrocatalytic properties of the butylamine-treated Pt–Ni seed-core-frame nanostructures. The butylamine treatment is to ensure the good dispersity of the catalysts in aqueous solution for drop-cast ink preparation by replacing the surface ligand aliphatic amine with butylamine. After the ligand exchange process, little changes in neither composition nor morphology were observed. However, as mentioned above, the Pt–Ni seed-core-frame nanostructures are unstable in acidic solution due to the leach of pure Ni and structural reconstruction to form alloy nanoframes. The ECSA increases with time in the acid solution while the MOR activity decreases as indicated by the decrease in peak current density and the CO tolerance ability (i.e., ratio of current density of forward sweep and that of backward sweep, If/Ib).
Since the Pt3Ni alloy nanostructures are more stable under the acidic condition, it is worth evaluating the structural effects on the electrocatalytic properties of the nanocatalysts. As expected, the hollow nanostructures have larger surface area and more active sites for electrocatalysis compared to their solid counterparts. The ECSA of the Pt3Ni nanoframes was characterized by CV, compare to that of the Pt3Ni nanoparticles (Figure S2) and the commercial carbon supported catalyst (Pt/C, 20 wt.% of Pt), as shown in Figure 8A. Considering the charge associated with a hydrogen-monolayer desorption on polycrystalline surface is 210 μC/cm2 [48], the ECSA were estimated to be 121.2, 80.5, and 85.0 m2 g−1 for Pt3Ni nanoframes, Pt3Ni spherical nanoparticles, and Pt/C, respectively. Without the carbon support, the ECSA of Pt3Ni nanoframes was 1.5 times larger than those of Pt3Ni and Pt/C as a result of their hollow structures. The electrocatalytic activity of the Pt3Ni nanoframes for MOR was examined and compared with Pt3Ni nanoparticles and Pt/C (Figure 8B). The current density of oxidation for the forward sweep (If) was recorded to be 1.21, 0.50, and 0.54 mA/cm2 for Pt3Ni nanoframes, Pt3Ni nanoparticles, and Pt/C. Compared to Pt3Ni nanoparticles and Pt/C, the If of nanoframes was slightly more than double, suggesting their high efficiency for methanol oxidation. The ratio of If/Ib for Pt3Ni nanoframes was 1.29, comparable with that for the Pt3Ni nanoparticles (1.19) and higher than that for Pt/C (0.93). It is implied that alloying Pt with oxiphilic transition metals such as Ni can oxidize methanol more effectively with less poisoning intermediates adsorbed on the surface compared to the pure Pt in Pt/C [49]. The enhancement of electrocatalytic stability was confirmed by the CA measurements performed at 0.90 V for 1200 s, as shown in Figure 8C. The decay rate of current density for Pt3Ni nanoframes was much slower than those for the Pt3Ni spherical nanoparticles and the Pt/C. The stability of Pt3Ni nanoframes was further evaluated by ECSA and MOR after the catalyst was continuously sweeping from 0 to 1.2 V vs. RHE at a scan rate of 50 mV/s in 0.1 M HClO4 solution. After 250 cycles, the ECSA of the Pt3Ni nanoframes remained to be 130 m2/gPt, similar to the initial ECSA (Figure 8D). TEM characterization and atomic absorption analysis revealed that there were few morphological and compositional changes of the nanoframes after the stability test (Figure S3). The electrocatalytic performance of nanoframes remained almost the same values as those obtained after 2 cycles with the If and the If/Ib ratio recorded to be 1.19 mA/cm2 and 1.24, respectively (Figure S4). This result indicated that Pt3Ni nanoframes retain their high electrocatalytic properties after 250 cycles of stability test. The high electrocatalytic activity of the Pt3Ni nanoframes could be attributed to their unique hollow structure, as well as the bifunctionality of Pt–Ni alloy, which greatly promotes MOR.

3. Materials and Methods

3.1. Chemicals

Nickel (II) 2,4-pentanedionate (Ni(acac)2, 98%) and oleylamine (OLA, 90%) were purchased from Acros Organics, part of Thermo Fisher Scientific, Waltham, MA, USA. Dihydrogen hexachloroplatinate hexahydrate (H2PtCl6·6H2O, 99.9%), platinum (II) 2,4-pentanedionate (Pt(acac)2, Pt 48.0%), potassium tetrachloroplatinate (K2PtCl4, 99.9%), butylamine (99%), dodecylamine (DDA, 98%), octadecylamine (ODA, 98%), oleic acid (90%), and acetic acid (CH3COOH, ACS) were purchased from Alfa Aesar, Haverhill, MA, USA. Hexadecylamine (HDA, 98%) and polyvinylpyrrolidone (PVP, M.W.=55,000) were purchased from Sigma-Aldrich, St. Louis, MO, USA. Tetradecylamine (TDA, 96%) was purchased from TCI America, Portland, OR, USA. All chemicals were used as received unless specified otherwise.

3.2. Synthesis of Pt–Ni Seed-Core-Frame Nanostructures

The Pt–Ni seed-core-frame nanostructures were prepared by a seeded growth method using sequential injection. Briefly, HDA (20 mmol, 5.365 g), and H2PtCl6·6H2O (0.025 mmol, 12.95 mg) were added to a 25 mL three-neck flask equipped with a magnetic stir bar. The reaction mixture was heated to 210 °C under argon. The color of the solution changed from yellow (50–100 °C), to light green yellow (100–180 °C), and gray (210 °C), indicating that the Pt(IV) was reduced to Pt(II) and then Pt(0). Immediately after the reaction the solution turned gray, Ni(acac)2 (25.2 mg, 0.1 mmol) in 1 mL of OLA was injected to the reaction. The reaction was allowed to proceed for 20 min at 210 °C. The product was purified by ethanol and resuspended in ethanol.

3.3. Synthesis of Pt3Ni Nanoframes

The Pt3Ni nanoframes were synthesized by etching the Pt–Ni polyhedral nanoparticles with acetic acid. Briefly, 8.0 mg of Pt–Ni seed-core-frame nanostructures, 4.0 mL of acetic acid (50%), 1.0 mL of PVP solution (2.0 mg/mL) were added to an 8.0 mL vial equipped with a magnetic stir bar. The mixed solution was sonicated for 1 minute, and then immersed into an oil bath set at 60 °C for different time periods. After the reaction, the product was purified by ethanol and redispersed in water.

3.4. Instrumentation

TEM images were captured using a JEOL 1011 microscope (JEOL, Tokyo, Japan) with an accelerating voltage of 100 kV. HRTEM images, HAADF-STEM images, and EDS mapping were obtained using a JEOL-ARM 200F microscope (JEOL, Tokyo, Japan) with an acceleration voltage of 200 kV. XRD patterns were acquired using a Rigaku MiniFlex X-ray diffractometer (Rigaku, Tokyo, Japan) equipped with Cu Kα radiation source operated at 30 kV/15 mA. Prior to XRD measurements, the samples were prepared by depositing nanoparticle samples on glass slides. XPS data were collected on an XPS spectrometer from PHI 500 Versa Probe (ULVAC-PHI, Kanagawa, Japan) with Al Kα radiation (1486.6 eV). FTIR spectra were obtained using Bruker Tensor 27 (Bruker, Billerica, MA, USA). The concentration of metal contents was determined using a GBC 932 atomic absorption spectrometer (GBC Scientific Equipment, Braeside VIC, Australia).

3.5. Electrocatalytic Measurement

CV and CA were recorded using a CHI760 electrochemical workstation (CH Instruments, Austin, TX, USA) at room temperature using a three-electrode cell. The Ag/AgCl/1.0 M KCl electrode (Eo = −0.294 V vs. RHE) and Pt wire were used as reference and counter electrode, respectively. Glassy carbon disk (0.070 cm2) was polished to a mirror finish and used as substrate for the working electrode. The catalyst ink was prepared by mixing 1:1 volume of 0.8 mgPt/mL nanoparticle suspension with 0.05 wt% Nafion. A 5 μL of the ink was pipetted onto the glassy carbon substrate, yielding a Pt loading of 2 μg or 28 μg/cm2 and dried at room temperature. The electrochemical active surface area (ECSA) was determined from CV profile obtained at a scan rate of 50 mV/s in 0.1 M HClO4 solution. The methanol oxidation was carried out in a solution containing 1.0 M CH3OH and 0.1 M HClO4 at a scan rate of 50 mV/s. The CA was recorded at 0.9 V vs. RHE in a solution containing 1.0 M CH3OH and 0.1 M HClO4. The electrochemical stability test was carried out at a scan rate of 50 mV/s with the potential range from 0 to 1.2 V vs. RHE in 0.1 M HClO4 solution.

4. Conclusions

In summary, we have systematically studied the reaction mechanism of the seeded coreduction method for synthesizing Pt–Ni seed-core-frame nanostructures. The key to the formation of rhombic dodecahedra and selective deposition of Pt on their edges is through the control of the shape of seeds (i.e., the formation of branched seeds using H2PtCl6 as Pt precursor) and the ratio of Pt:Ni precursors (H2PtCl6:Ni(acac)2 in the range of >1:1 to 1:6). The concentration increase of Ni(acac)2 at a fixed amount of Pt precursor results in the size decrease of the nanostructures due to the additional homogenous nucleation of co-reduced Pt and Ni. Furthermore, the Ni core of these hierarchical nanostructures could be further etched by acetic acid, leading to the formation of a concave structure and, eventually, hollow nanoframes. By controlling the rates of etching and interdiffusion between the two metals, the morphology and composition of the products could be manipulated. The resultant Pt3Ni nanoframes are stable under acidic conditions and possess electronic properties distinctly different from the primary seed-core-frame nanostructures due to the alloying of Pt with Ni. Owing to the larger surface area and higher density of active sites, the catalytic performance of Pt3Ni nanoframes was better than the counterpart Pt3Ni nanoparticles and the commercial Pt/C catalyst. The mechanism of the seeded co-reduction method can be extended to other Pt-based complex core-frame rhombic dodecahedral nanoparticles. The conversion to their corresponding hollow nanoframes using the low temperature acetic acid etching method may provide a simple means to convert other phase segregated bimetallic polyhedra in order to hollow out alloyed structures with unique morphologies.

Supplementary Materials

The following are available online at https://www.mdpi.com/2073-4344/9/1/39/s1. Figure S1: (A) XPS of the samples collected at 0, 1, and 12 h. (B) Fourier transform infrared (FTIR) spectra of OLA/HDA-capped polyhedral and acetic acid-capped nanoframes. Figure S2: (A) TEM image of Pt3Ni nanoparticles with an average diameter of ~6 nm; and (B) XRD patterns of the sample in (A) and its comparison nanoframes as shown in Figure 4. Figure S3: TEM image of Pt3Ni nanoframes after 250 cycles. The atomic absorption result indicates a Pt/Ni ratio of 79:21. Figure S4: Electrochemical characterization of methanol oxidation on Pt3Ni nanoframes in a solution containing 1 M CH3OH and 0.1 M HClO4 at a scan rate of 50 mV/s: (A) cyclic voltammetry (CV), and (B) chromoamperometry (CA). The CA curves were obtained at 0.90 V vs. RHE.

Author Contributions

S.C. and J.C. conceived and designed the experiments; S.C. and J.C. performed the experiments and analyzed the data; S.C. and H.W. performed electrochemical measurement; J.T., Y.Z., and H.X. carried out TEM characterization; all authors wrote the paper.

Funding

This research received no external funding.

Acknowledgments

This work was supported in part by the Ralph E. Powe Jr. Faculty Enhancement Award, the startup fund from the University of Arkansas to J.C. We acknowledge partial support from the Center for Advanced Surface Engineering, under the National Science Foundation Grant No. OIA-1457888 and the Arkansas EPSCoR Program, ASSET III. The work done at BNL was supported by the U.S. Department of Energy (Basic Energy Sciences) and by the Materials Science and Engineering Division under Contract No. DE-SC0012704 and through the use of CFN.

Conflicts of Interest

The authors declare no conflict of interest.

References

  1. Rabis, A.; Rodriguez, P.; Schmidt, T.J. Electrocatalysis for Polymer Electrolyte Fuel Cells: Recent Achievements and Future Challenges. ACS Catal. 2012, 2, 864–890. [Google Scholar] [CrossRef]
  2. Wang, D.; Li, Y. Bimetallic Nanocrystals: Liquid-Phase Synthesis and Catalytic Applications. Adv. Mater. 2011, 23, 1044–1060. [Google Scholar] [CrossRef] [PubMed]
  3. Stamenkovic, V.R.; Fowler, B.; Mun, B.S.; Wang, G.; Ross, P.N.; Lucas, C.A.; Marković, N.M. Improved oxygen reduction activity on Pt3Ni (111) via increased surface site availability. Science 2007, 315, 493–497. [Google Scholar] [CrossRef] [PubMed]
  4. Wu, J.; Zhang, J.; Peng, Z.; Yang, S.; Wagner, F.T.; Yang, H. Truncated Octahedral Pt3Ni Oxygen Reduction Reaction Electrocatalysts. J. Am. Chem. Soc. 2010, 132, 4984–4985. [Google Scholar] [CrossRef] [PubMed]
  5. Wu, J.; Yang, H. Synthesis and electrocatalytic oxygen reduction properties of truncated octahedral Pt3Ni nanoparticles. Nano Res. 2011, 4, 72–82. [Google Scholar] [CrossRef]
  6. Zhang, J.; Yang, H.; Fang, J.; Zou, S. Synthesis and Oxygen Reduction Activity of Shape-Controlled Pt3Ni Nanopolyhedra. Nano Lett. 2010, 10, 638–644. [Google Scholar] [CrossRef]
  7. Carpenter, M.K.; Moylan, T.E.; Kukreja, R.S.; Atwan, M.H.; Tessema, M.M. Solvothermal Synthesis of Platinum Alloy Nanoparticles for Oxygen Reduction Electrocatalysis. J. Am. Chem. Soc. 2012, 134, 8535–8542. [Google Scholar] [CrossRef]
  8. Cui, C.; Gan, L.; Li, H.-H.; Yu, S.-H.; Heggen, M.; Strasser, P. Octahedral PtNi Nanoparticle Catalysts: Exceptional Oxygen Reduction Activity by Tuning the Alloy Particle Surface Composition. Nano Lett. 2012, 12, 5885–5889. [Google Scholar] [CrossRef]
  9. Wang, C.; Chi, M.; Li, D.; Strmcnik, D.; van der Vliet, D.; Wang, G.; Komanicky, V.; Chang, K.-C.; Paulikas, A.P.; Tripkovic, D.; et al. Design and Synthesis of Bimetallic Electrocatalyst with Multilayered Pt-Skin Surfaces. J. Am. Chem. Soc. 2011, 133, 14396–14403. [Google Scholar] [CrossRef]
  10. Wang, C.; Chi, M.; Wang, G.; van der Vliet, D.; Li, D.; More, K.; Wang, H.-H.; Schlueter, J.A.; Markovic, N.M.; Stamenkovic, V.R. Correlation Between Surface Chemistry and Electrocatalytic Properties of Monodisperse PtxNi1−x Nanoparticles. Adv. Funct. Mater. 2011, 21, 147–152. [Google Scholar] [CrossRef]
  11. Chen, C.; Kang, Y.; Huo, Z.; Zhu, Z.; Huang, W.; Xin, H.L.; Snyder, J.D.; Li, D.; Herron, J.A.; Mavrikakis, M. Highly crystalline multimetallic nanoframes with three-dimensional electrocatalytic surfaces. Science 2014, 343, 1339–1343. [Google Scholar] [CrossRef] [PubMed]
  12. Becknell, N.; Kang, Y.; Chen, C.; Resasco, J.; Kornienko, N.; Guo, J.; Markovic, N.M.; Somorjai, G.A.; Stamenkovic, V.R.; Yang, P. Atomic structure of Pt3Ni nanoframe electrocatalysts by in situ X-ray absorption spectroscopy. J. Am. Chem. Soc. 2015, 137, 15817–15824. [Google Scholar] [CrossRef] [PubMed]
  13. Niu, Z.; Becknell, N.; Yu, Y.; Kim, D.; Chen, C.; Kornienko, N.; Somorjai, G.A.; Yang, P. Anisotropic phase segregation and migration of Pt in nanocrystals en route to nanoframe catalysts. Nat. Mater. 2016, 15, 1188–1194. [Google Scholar] [CrossRef] [PubMed]
  14. Becknell, N.; Son, Y.; Kim, D.; Li, D.; Yu, Y.; Niu, Z.; Lei, T.; Sneed, B.T.; More, K.L.; Markovic, N.M. Control of architecture in rhombic dodecahedral Pt–Ni nanoframe electrocatalysts. J. Am. Chem. Soc. 2017, 139, 11678–11681. [Google Scholar] [CrossRef] [PubMed]
  15. Chen, S.; Niu, Z.; Xie, C.; Gao, M.; Lai, M.; Li, M.; Yang, P. Effects of Catalyst Processing on the Activity and Stability of Pt–Ni Nanoframe Electrocatalysts. ACS Nano 2018, 12, 8697–8705. [Google Scholar] [CrossRef] [PubMed]
  16. Ding, J.; Bu, L.; Guo, S.; Zhao, Z.; Zhu, E.; Huang, Y.; Huang, X. Morphology and phase controlled construction of Pt–Ni nanostructures for efficient electrocatalysis. Nano Lett. 2016, 16, 2762–2767. [Google Scholar] [CrossRef]
  17. Gan, L.; Heggen, M.; Cui, C.; Strasser, P. Thermal facet healing of concave octahedral Pt–Ni nanoparticles imaged in situ at the atomic scale: Implications for the rational synthesis of durable high-performance ORR electrocatalysts. ACS Catal. 2015, 6, 692–695. [Google Scholar] [CrossRef]
  18. Beermann, V.; Gocyla, M.; Kuhl, S.; Padgett, E.; Schmies, H.; Goerlin, M.; Erini, N.; Shviro, M.; Heggen, M.; Dunin-Borkowski, R.E. Tuning the Electrocatalytic Oxygen Reduction Reaction Activity and Stability of Shape-Controlled Pt–Ni Nanoparticles by Thermal Annealing—Elucidating the Surface Atomic Structural and Compositional Changes. J. Am. Chem. Soc. 2017, 139, 16536–16547. [Google Scholar] [CrossRef]
  19. Li, Y.; Li, C.; Bastakoti, B.P.; Tang, J.; Jiang, B.; Kim, J.; Shahabuddin, M.; Bando, Y.; Kim, J.H.; Yamauchi, Y. Strategic synthesis of mesoporous Pt-on-Pd bimetallic spheres templated from a polymeric micelle assembly. J. Mater. Chem. A 2016, 4, 9169–9176. [Google Scholar] [CrossRef]
  20. Li, Y.; Liu, Y.; Yamauchi, Y.; Kaneti, Y.; Alsheri, S.; Ahamad, T.; Alhokbany, N.; Kim, J.; Ariga, K.; Wu, N. Micelle-Assisted Strategy for the Direct Synthesis of Large-Sized Mesoporous Platinum Catalysts by Vapor Infiltration of a Reducing Agent. Nanomaterials 2018, 8, 841. [Google Scholar] [CrossRef]
  21. Kani, K.; Zakaria, M.B.; Lin, J.; Alshehri, A.A.; Kim, J.; Bando, Y.; You, J.; Hossain, M.S.A.; Bo, J.; Yamauchi, Y. Synthesis and Characterization of Dendritic Pt Nanoparticles by Using Cationic Surfactant. Bull. Chem. Soc. Jpn. 2018, 91, 1333–1336. [Google Scholar] [CrossRef]
  22. Koenigsmann, C.; Santulli, A.C.; Gong, K.; Vukmirovic, M.B.; Zhou, W.-P.; Sutter, E.; Wong, S.S.; Adzic, R.R. Enhanced Electrocatalytic Performance of Processed, Ultrathin, Supported Pd–Pt Core–Shell Nanowire Catalysts for the Oxygen Reduction Reaction. J. Am. Chem. Soc. 2011, 133, 9783–9795. [Google Scholar] [CrossRef]
  23. Li, H.-H.; Ma, S.-Y.; Fu, Q.-Q.; Liu, X.-J.; Wu, L.; Yu, S.-H. Scalable Bromide-Triggered Synthesis of Pd@Pt Core–Shell Ultrathin Nanowires with Enhanced Electrocatalytic Performance toward Oxygen Reduction Reaction. J. Am. Chem. Soc. 2015, 137, 7862–7868. [Google Scholar] [CrossRef]
  24. Guo, S.; Zhang, S.; Su, D.; Sun, S. Seed-mediated synthesis of core/shell FePtM/FePt (M = Pd, Au) nanowires and their electrocatalysis for oxygen reduction reaction. J. Am. Chem. Soc. 2013, 135, 13879–13884. [Google Scholar] [CrossRef] [PubMed]
  25. Zhang, J.; Mo, Y.; Vukmirovic, M.B.; Klie, R.; Sasaki, K.; Adzic, R.R. Platinum Monolayer Electrocatalysts for O2 Reduction:  Pt Monolayer on Pd(111) and on Carbon-Supported Pd Nanoparticles. J. Phys. Chem. B 2004, 108, 10955–10964. [Google Scholar] [CrossRef]
  26. Adzic, R.R.; Zhang, J.; Sasaki, K.; Vukmirovic, M.B.; Shao, M.; Wang, J.X.; Nilekar, A.U.; Mavrikakis, M.; Valerio, J.A.; Uribe, F. Platinum Monolayer Fuel Cell Electrocatalysts. Top. Catal. 2007, 46, 249–262. [Google Scholar] [CrossRef]
  27. Sasaki, K.; Wang, J.X.; Naohara, H.; Marinkovic, N.; More, K.; Inada, H.; Adzic, R.R. Recent advances in platinum monolayer electrocatalysts for oxygen reduction reaction: Scale-up synthesis, structure and activity of Pt shells on Pd cores. Electrochim. Acta 2010, 55, 2645–2652. [Google Scholar] [CrossRef]
  28. Adzic, R.R. Platinum Monolayer Electrocatalysts: Tunable Activity, Stability, and Self-Healing Properties. Electrocatalysis 2012, 3, 163–169. [Google Scholar] [CrossRef]
  29. Sasaki, K.; Kuttiyiel, K.A.; Wang, J.X.; Vukmirovic, M.B.; Adzic, R.R. Recent Advances in Platinum Monolayer Electrocatalysts for the Oxygen Reduction Reaction. Electrocatal. Low Temp. Fuel Cells Fundam. Recent Trends 2017, 557–584. [Google Scholar] [CrossRef]
  30. Tian, X.L.; Xu, Y.Y.; Zhang, W.; Wu, T.; Xia, B.Y.; Wang, X. Unsupported Platinum-Based Electrocatalysts for Oxygen Reduction Reaction. ACS Energy Lett. 2017, 2, 2035–2043. [Google Scholar] [CrossRef]
  31. Li, C.; Tan, H.; Lin, J.; Luo, X.; Wang, S.; You, J.; Kang, Y.-M.; Bando, Y.; Yamauchi, Y.; Kim, J. Emerging Pt-based electrocatalysts with highly open nanoarchitectures for boosting oxygen reduction reaction. Nano Today 2018, 21, 91–105. [Google Scholar] [CrossRef]
  32. Park, K.-W.; Choi, J.-H.; Kwon, B.-K.; Lee, S.-A.; Sung, Y.-E.; Ha, H.-Y.; Hong, S.-A.; Kim, H.; Wieckowski, A. Chemical and Electronic Effects of Ni in Pt/Ni and Pt/Ru/Ni Alloy Nanoparticles in Methanol Electrooxidation. J. Phys. Chem. B 2002, 106, 1869–1877. [Google Scholar] [CrossRef]
  33. Jiang, Q.; Jiang, L.; Hou, H.; Qi, J.; Wang, S.; Sun, G. Promoting Effect of Ni in PtNi Bimetallic Electrocatalysts for the Methanol Oxidation Reaction in Alkaline Media: Experimental and Density Functional Theory Studies. J. Phys. Chem. C 2010, 114, 19714–19722. [Google Scholar] [CrossRef]
  34. Sulaiman, J.E.; Zhu, S.; Xing, Z.; Chang, Q.; Shao, M. Pt–Ni octahedra as electrocatalysts for the ethanol electro-oxidation reaction. ACS Catal. 2017, 7, 5134–5141. [Google Scholar] [CrossRef]
  35. Wu, Y.; Wang, D.; Zhou, G.; Yu, R.; Chen, C.; Li, Y. Sophisticated construction of Au islands on Pt–Ni: An ideal trimetallic nanoframe catalyst. J. Am. Chem. Soc. 2014, 136, 11594–11597. [Google Scholar] [CrossRef] [PubMed]
  36. Zhou, X.; Gan, Y.; Du, J.; Tian, D.; Zhang, R.; Yang, C.; Dai, Z. A review of hollow Pt-based nanocatalysts applied in proton exchange membrane fuel cells. J. Power Sources 2013, 232, 310–322. [Google Scholar] [CrossRef]
  37. Taylor, E.; Chen, S.; Tao, J.; Wu, L.; Zhu, Y.; Chen, J. Synthesis of Pt–Cu Nanodendrites through Controlled Reduction Kinetics for Enhanced Methanol Electro-Oxidation. ChemSusChem 2013, 6, 1863–1867. [Google Scholar] [CrossRef] [PubMed]
  38. Mathurin, L.E.; Benamara, M.; Tao, J.; Zhu, Y.; Chen, J. Tailoring the Surface Structures of CuPt and CuPtRu 1D Nanostructures by Coupling Coreduction with Galvanic Replacement. Part. Part. Syst. Charact. 2018, 35, 1800053. [Google Scholar] [CrossRef]
  39. Mathurin, L.E.; Tao, J.; Xin, H.; Li, J.; Zhu, Y.; Chen, J. Dendritic Core-Frame and Frame Multimetallic Rhombic Dodecahedra: A Comparison Study of Composition and Structure Effects on Electrocatalysis of Methanol Oxidation. ChemNanoMat 2018, 4, 76–87. [Google Scholar] [CrossRef]
  40. Chen, S.; Jenkins, S.V.; Tao, J.; Zhu, Y.; Chen, J. Anisotropic Seeded Growth of Cu–M (M = Au, Pt, or Pd) Bimetallic Nanorods with Tunable Optical and Catalytic Properties. J. Phys. Chem. C 2013, 117, 8924–8932. [Google Scholar] [CrossRef]
  41. Denton, A.R.; Ashcroft, N.W. Vegard’s law. Phys. Rev. A 1991, 43, 3161. [Google Scholar] [CrossRef] [PubMed]
  42. Scherrer, P. Göttinger Nachrichten Math. Phys. Rev. A 1918, 2, 98–100. [Google Scholar]
  43. Holzwarth, U.; Gibson, N. The Scherrer equation versus the’Debye-Scherrer equation. Nat. Nanotech. 2011, 6, 534. [Google Scholar] [CrossRef] [PubMed]
  44. Cui, C.; Gan, L.; Heggen, M.; Rudi, S.; Strasser, P. Compositional segregation in shaped Pt alloy nanoparticles and their structural behaviour during electrocatalysis. Nat. Mater. 2013, 12, 765–771. [Google Scholar] [CrossRef] [PubMed]
  45. Smigelskas, A.; Kirkendall, E. Zinc diffusion in alpha brass. Trans. Aime 1947, 171, 130–142. [Google Scholar]
  46. Yin, Y.; Rioux, R.M.; Erdonmez, C.K.; Hughes, S.; Somorjai, G.A.; Alivisatos, A.P. Formation of hollow nanocrystals through the nanoscale Kirkendall effect. Science 2004, 304, 711–714. [Google Scholar] [CrossRef] [PubMed]
  47. Biegler, T.; Rand, D.; Woods, R. Limiting oxygen coverage on platinized platinum; relevance to determination of real platinum area by hydrogen adsorption. J. Electroanal. Chem. Interfacial Electrochem. 1971, 29, 269–277. [Google Scholar] [CrossRef]
  48. Markovic, N.; Grgur, B.; Ross, P. Temperature-dependent hydrogen electrochemistry on platinum low-index single-crystal surfaces in acid solutions. J. Phys. Chem. B 1997, 101, 5405–5413. [Google Scholar] [CrossRef]
  49. Rossmeisl, J.; Ferrin, P.; Tritsaris, G.A.; Nilekar, A.U.; Koh, S.; Bae, S.E.; Brankovic, S.R.; Strasser, P.; Mavrikakis, M. Bifunctional anode catalysts for direct methanol fuel cells. Energy Environ. Sci. 2012, 5, 8335–8342. [Google Scholar] [CrossRef]
Figure 1. Transmission electron microscope (TEM) characterization of the seed-core-frame nanostructures. (A) TEM image overview of the polyhedral structure with an edge length of ~20 nm. (B) Tomography snapshots of a representative nanostructure with rhombic dodecahedral shape viewed from different zone axes [110], [111], and [100] from left to right. (C) High-resolution TEM (HRTEM) image of a representative nanostructure with its fast Fourier transformation showing a single crystalline pattern and its zoom-in view of the edges indexed with corresponding facets showing that its surface contains rich amount of high Miller index facets. (D) High-angle annular dark-field scanning transmission electron microscopy (HAADF-STEM) image and energy dispersive X-ray spectroscopy (EDS) mapping of a representative nanostructure that consists of Pt (red) and Ni (green) assembled as a seed-core-frame rhombic dodecahedron.
Catalysts 09 00039 g001
Figure 2. TEM images of the aliquot samples taken from the seeded co-reduction synthesis at different time points after the injection of Ni precursor. (AD) Aliquot samples taken from the synthesis at 30 s (A), 2 min (B), 10 min (C), and 20 min (D). (EH) Corresponding etching samples of (AD) after incubation with acetic acid at 60 °C for 15 h. The scale bars are 20 nm.
Catalysts 09 00039 g002
Figure 3. TEM images illustrating the morphology of the products from the syntheses by varying one reaction parameter at a time: (AD) different solvents such as dodecylamine (DDA) (A), tetradecylamine (TDA) (B), hexadecylamine (HDA) (C), and octadecylamine (ODA) (D); (EH) different precursors such as Pt(acac)2 (E), K2PtCl4 (F), H2PtCl6 (G), and K2PtCl4 + oleic acid (H); (IL) different molar ratio of H2PtCl6:Ni(acac)2 such as 10:1 (I), 1:1 (J), 1:4 (K), and 1:6 (L). Note that samples in (C), (G), (K) are three parallel reactions under the same condition using HDA as solvent and 1:4 molar precursor ratio of H2PtCl6:Ni(acac)2.
Catalysts 09 00039 g003
Figure 4. Characterization of Pt–Ni nanoframes: (A) TEM image showing the uniformity of the frame structure with an average edge length of 20 nm; (B) X-ray diffraction (XRD) pattern of the nanoframes indicative of a fcc structure with the composition of Pt3Ni and grain size of ~3 nm; (C) HRTEM image of a representative nanoframe showing the polycrystalline nature of the structure and the edge thickness of 2-3 nm; and (D) HAADF-STEM image and EDS mapping of Pt (red) and Ni (green) indication the rhombic dodecahedral shape and the alloy distribution of Pt and Ni.
Catalysts 09 00039 g004
Figure 5. (A,B) TEM images of the samples via acetic acid etching at different temperatures: (A) 0 °C in ice batch and (B) 20 °C room temperature. (C,D) Corresponding XRD patterns of the samples (A) and (B), respectively.
Catalysts 09 00039 g005
Figure 6. Characterization of the aliquot samples taken from the etching process at different time points: (A) XRD patterns and (B) TEM images.
Catalysts 09 00039 g006
Figure 7. (A,B) Characterization of Pt–Ni seed-core-frame nanostructure with and without butylamine treatment: (A) XRD and (B) TEM images. (C,D) Electrocatalytic measurement of the butylamine treated Pt–Ni seed-core-frame nanostructure at a scan rate of 50 mV/s: (C) cyclic voltammetry (CV) in 0.1 M HClO4 solution and (D) CV in a solution containing 1 M CH3OH and 0.1 M HClO4.
Catalysts 09 00039 g007
Figure 8. (A) CV profiles (scan rate: 50 mV/s) of Pt3Ni nanoframes, Pt3Ni nanoparticles, and Pt/C catalyst in 0.1 M HClO4 solution. Electrochemical characterization of CH3OH oxidation on Pt3Ni nanoframes, Pt3Ni nanoparticles, and Pt/C catalyst in a solution containing 1 M CH3OH and 0.1 M HClO4: (B) CV at a scan rate of 50 mV/s and (C) Chromoamperometry (CA) obtained at 0.90 V vs. RHE. (D) CV profiles of Pt3Ni nanoframes in 0.1 M HClO4 solution at a scan rate of 50 mV/s.
Catalysts 09 00039 g008

