From a Sequential Chemo-Enzymatic Approach to a Continuous Process for HMF Production from Glucose


 ,
, 
 ,
, 

Abstract
:
1. Introduction
2. Results and Discussion
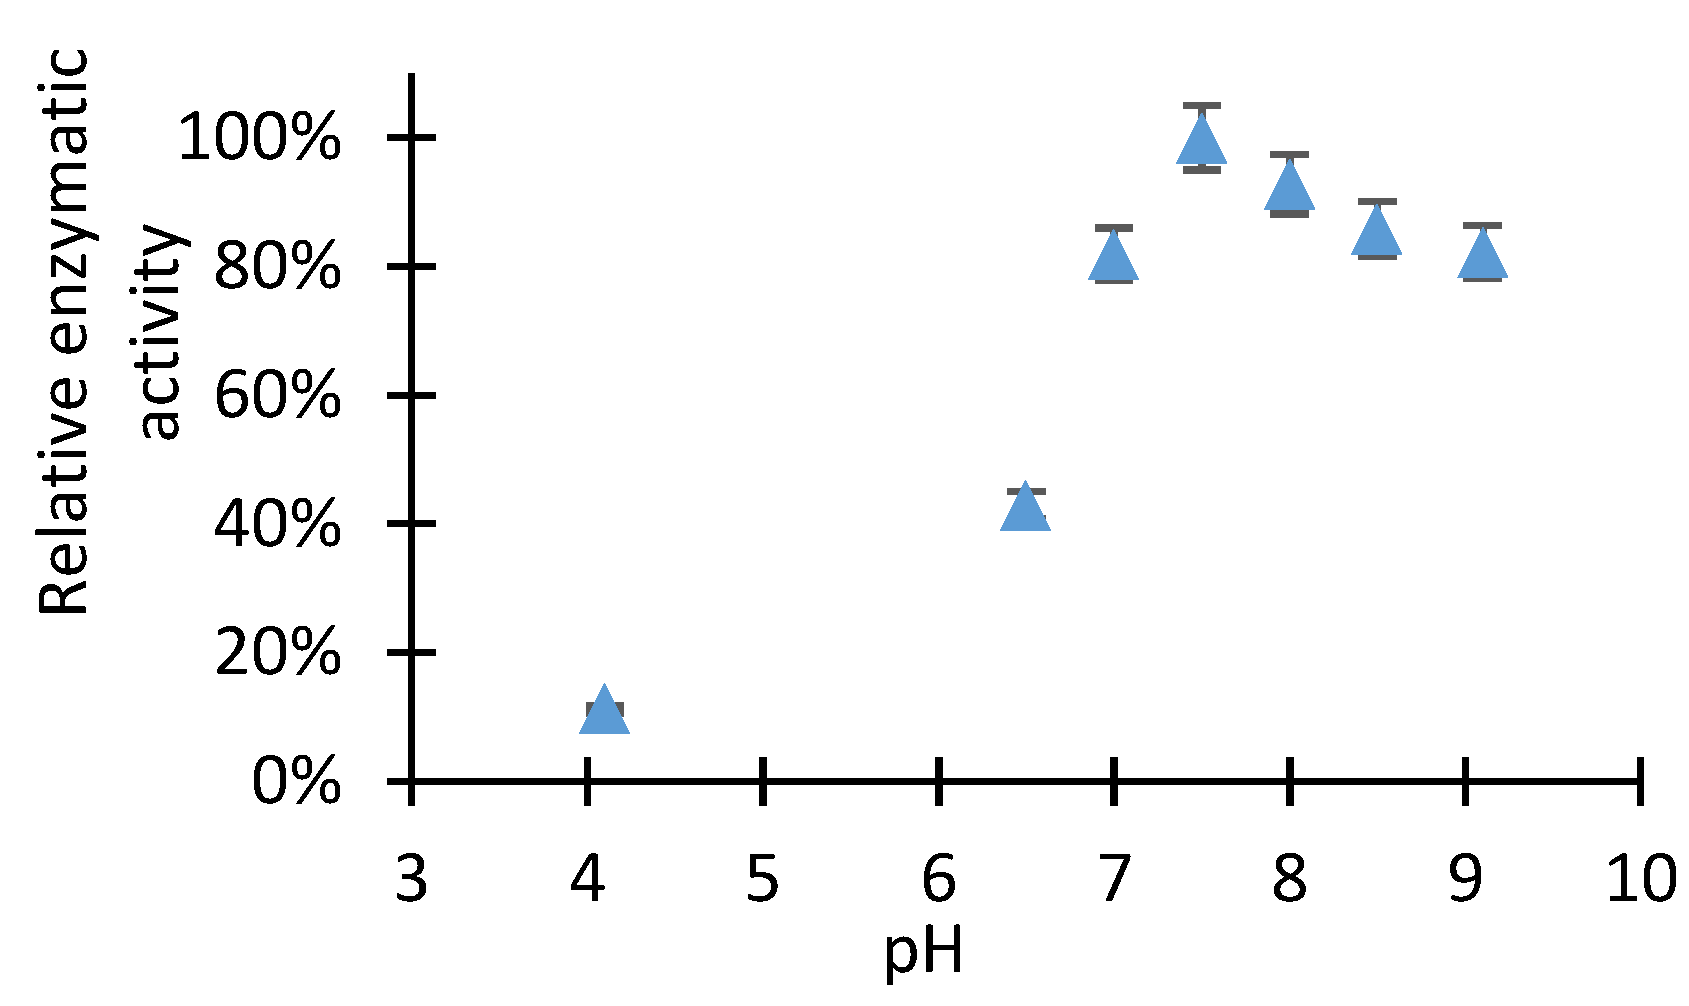
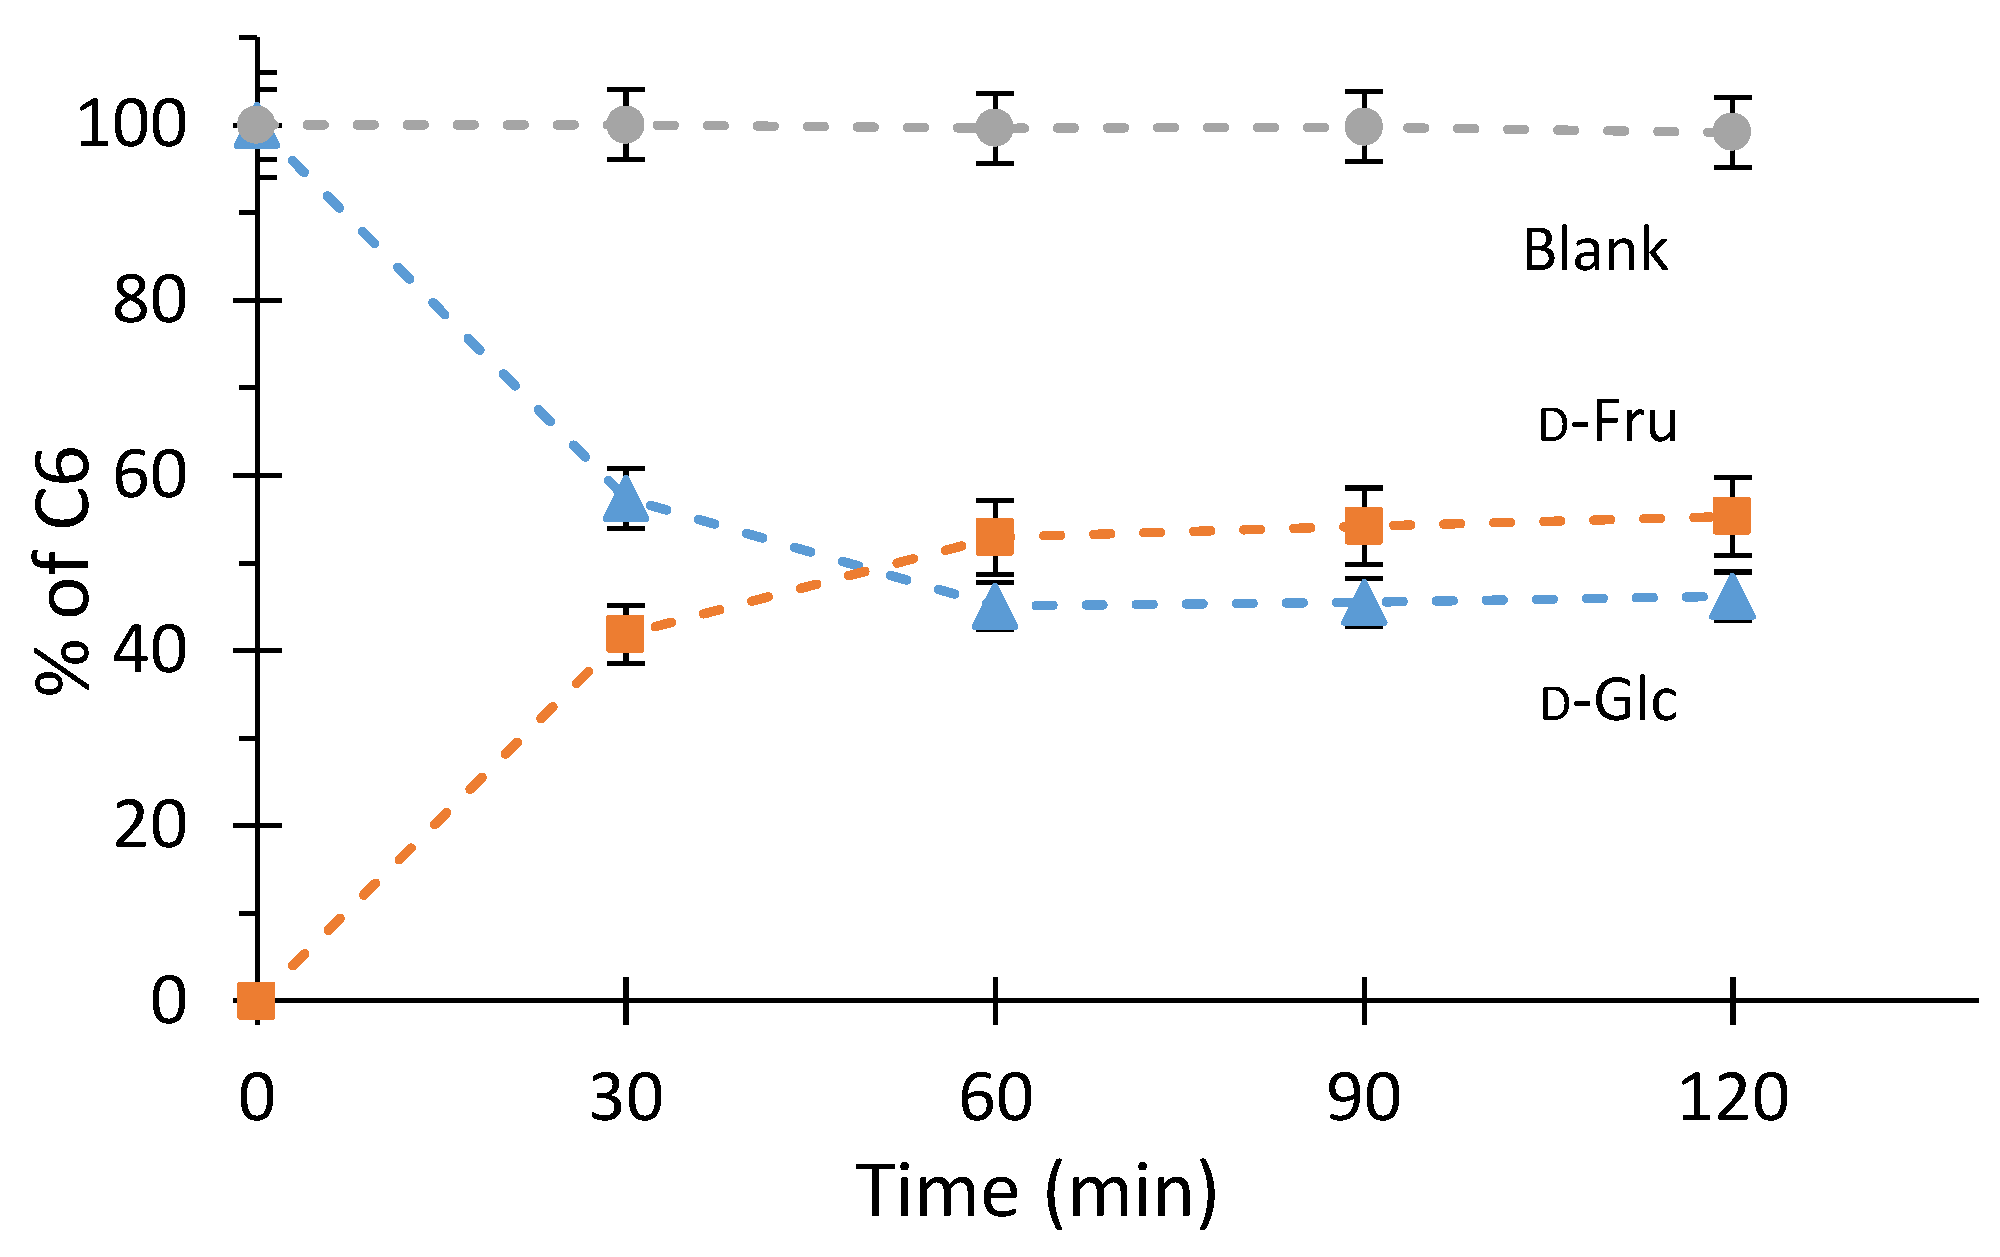
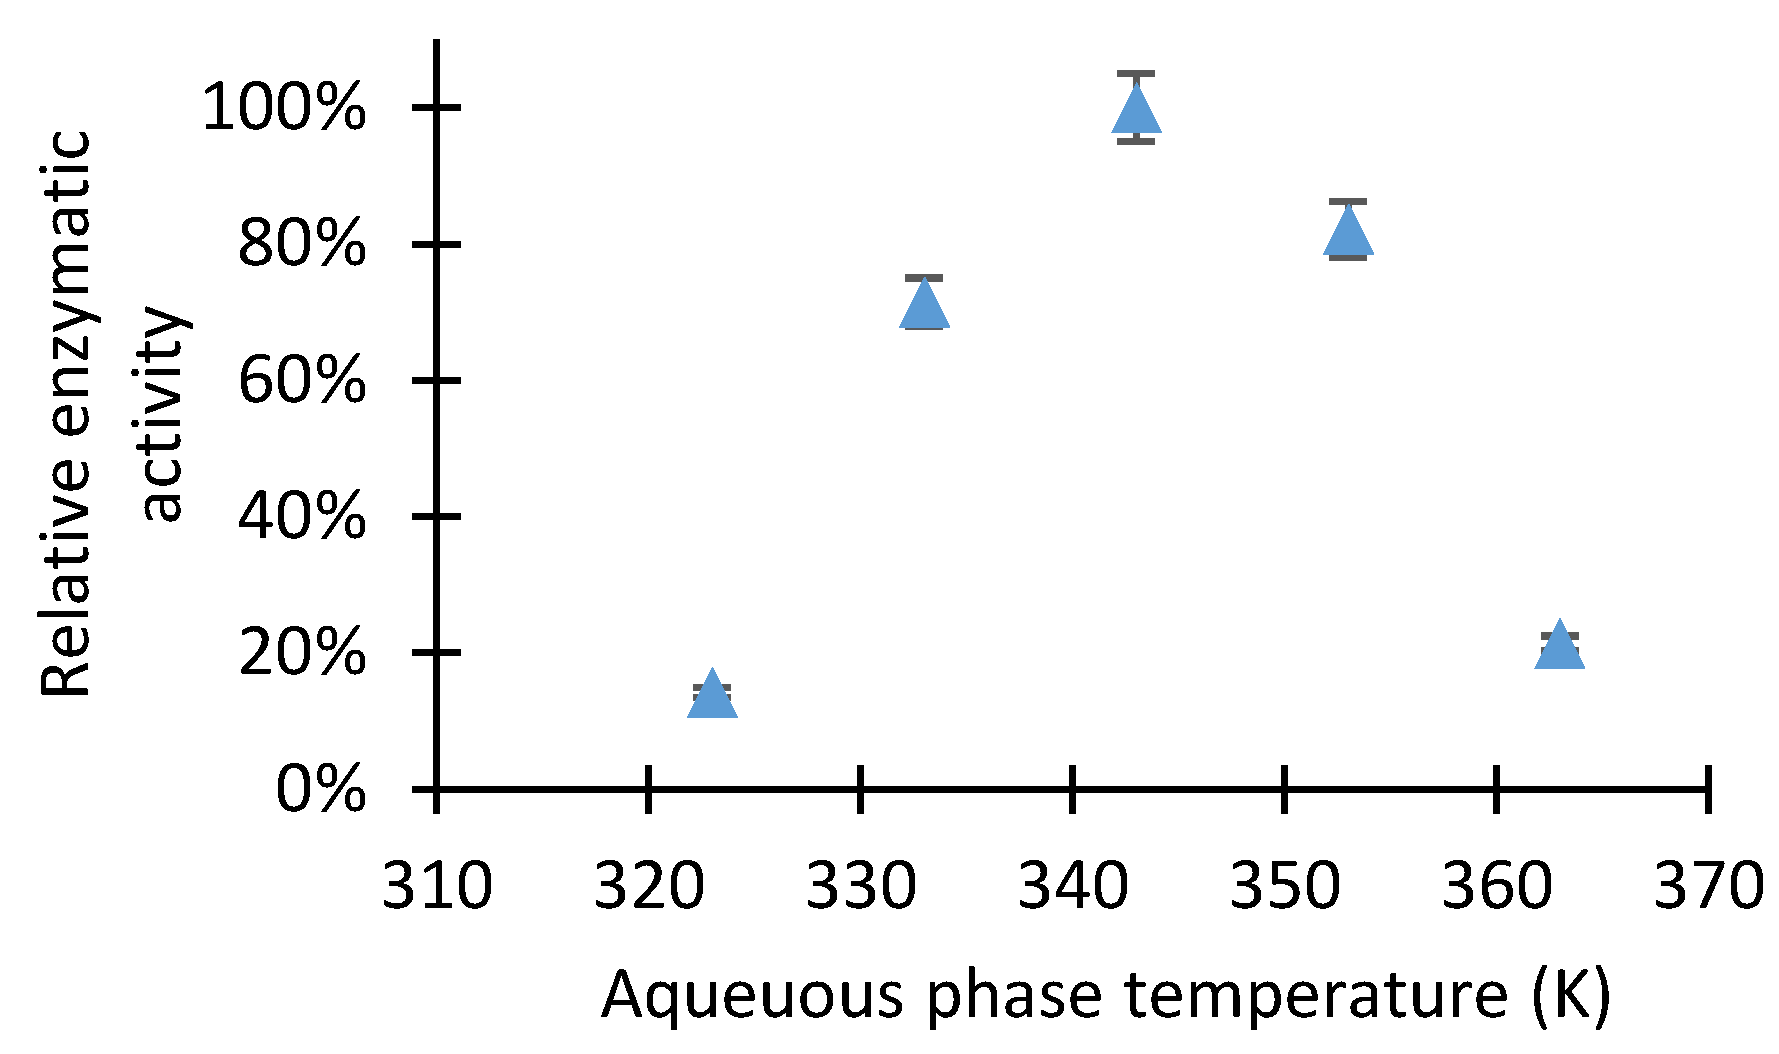
2.1. Study of D-Glucose Enzymatic Isomerization in the Aqueous Feed Phase
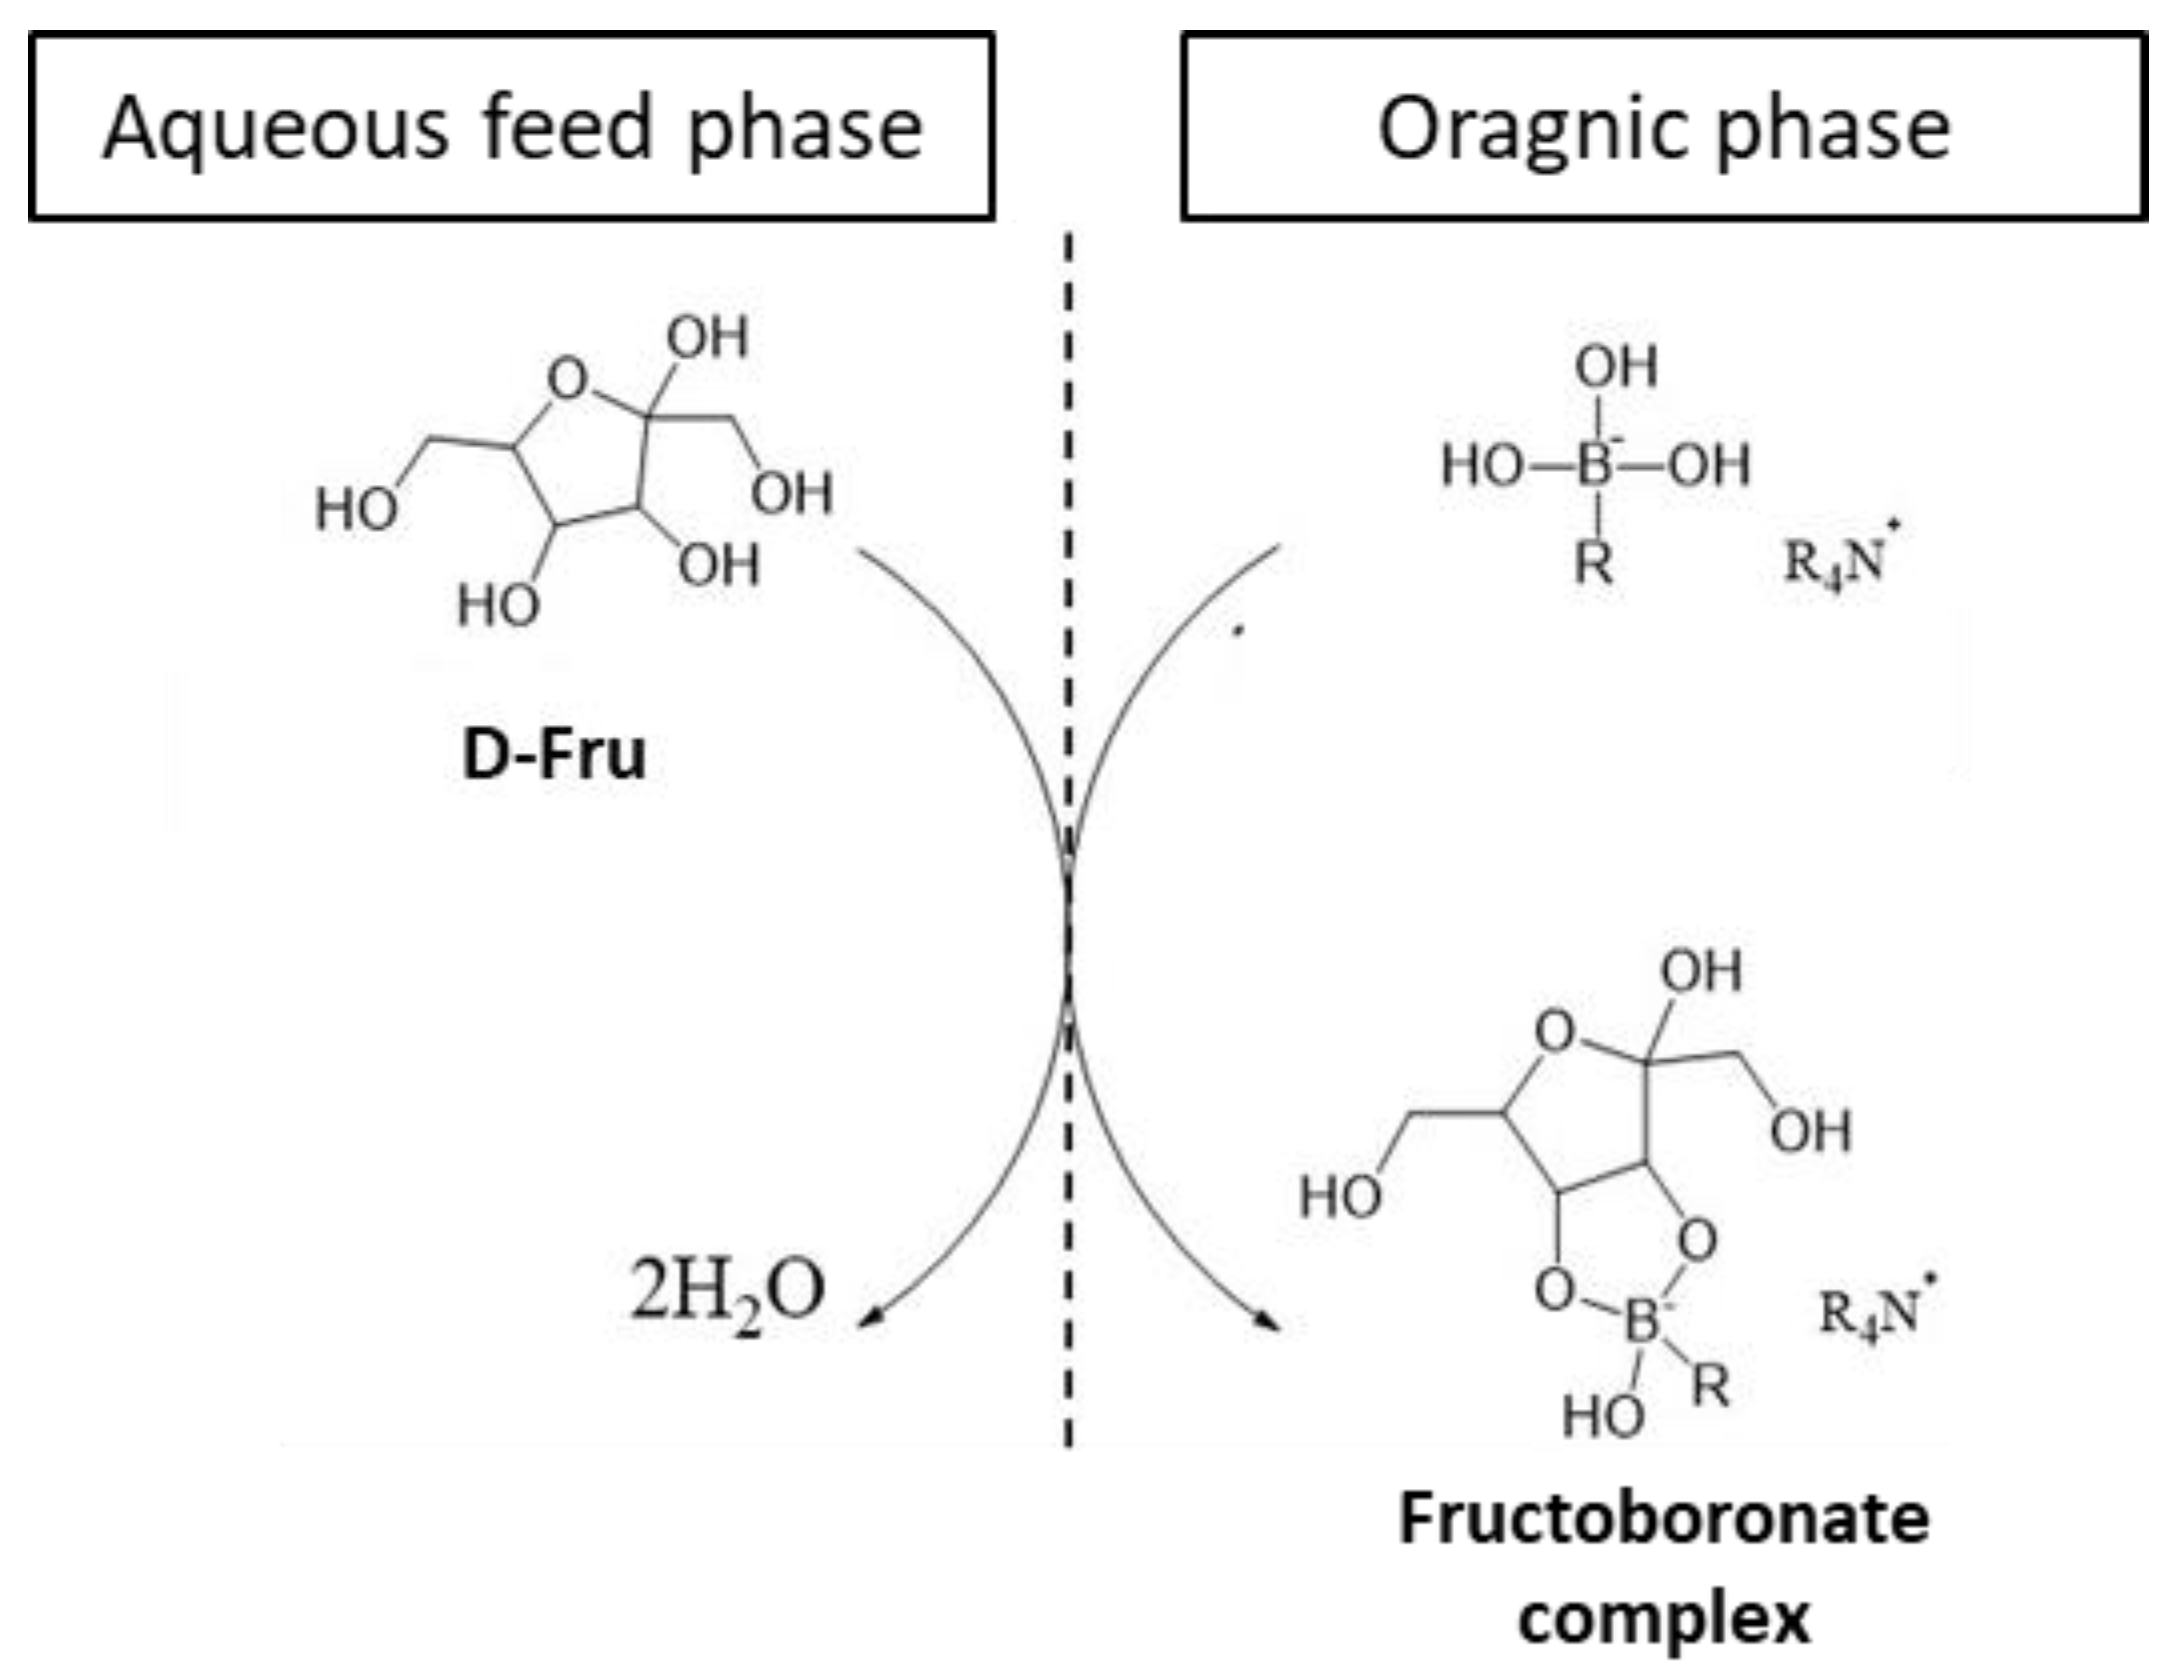
2.2. Organic Liquid Membrane for D-Fructose Complexation/Transportation
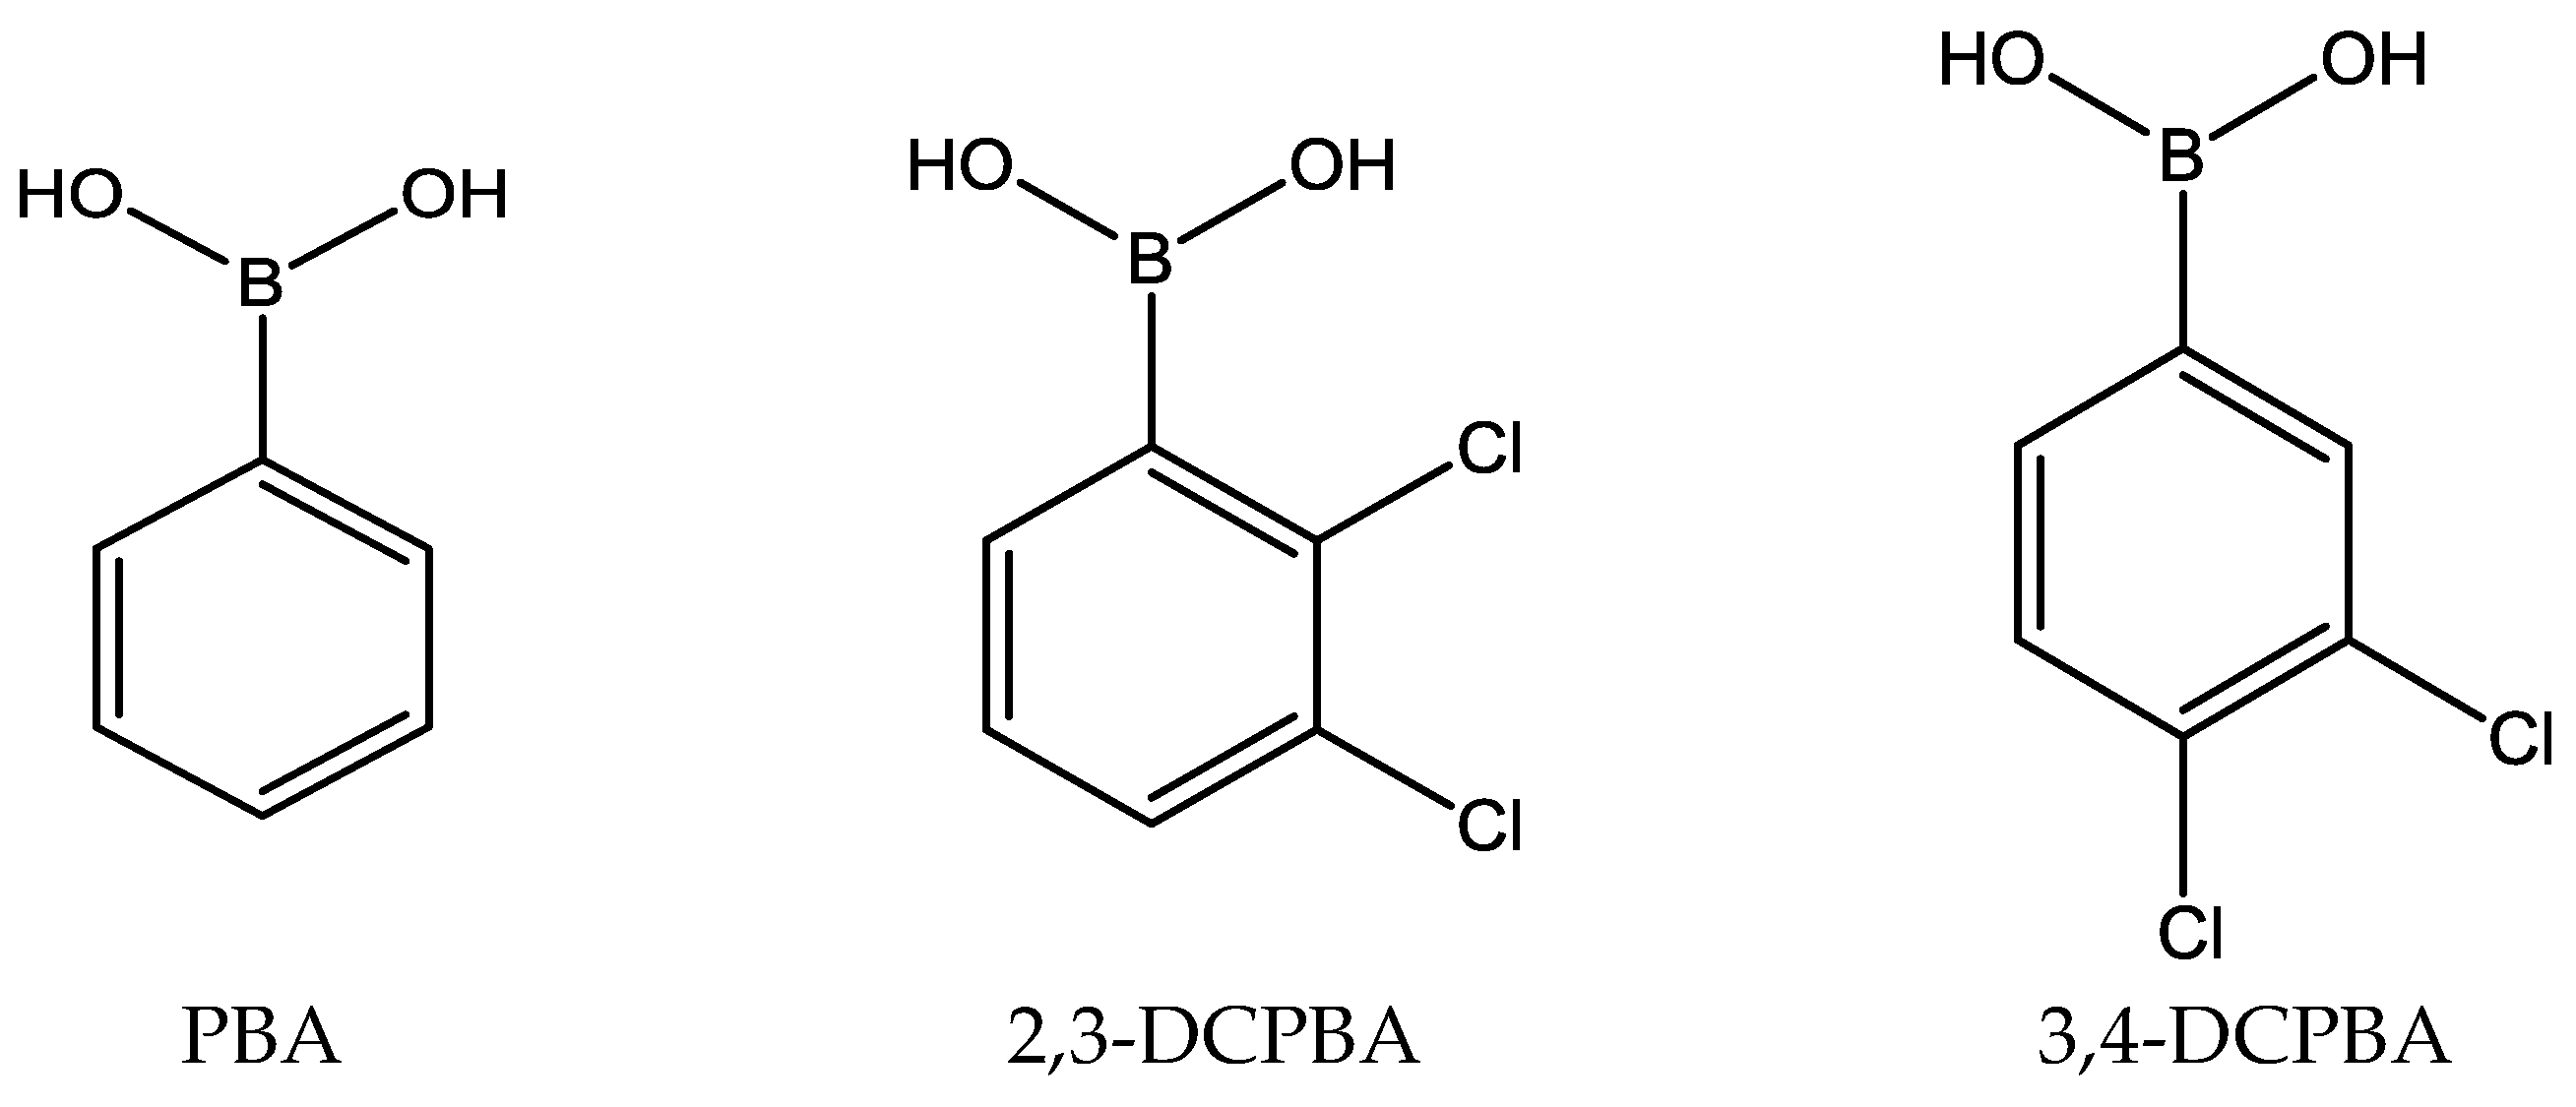
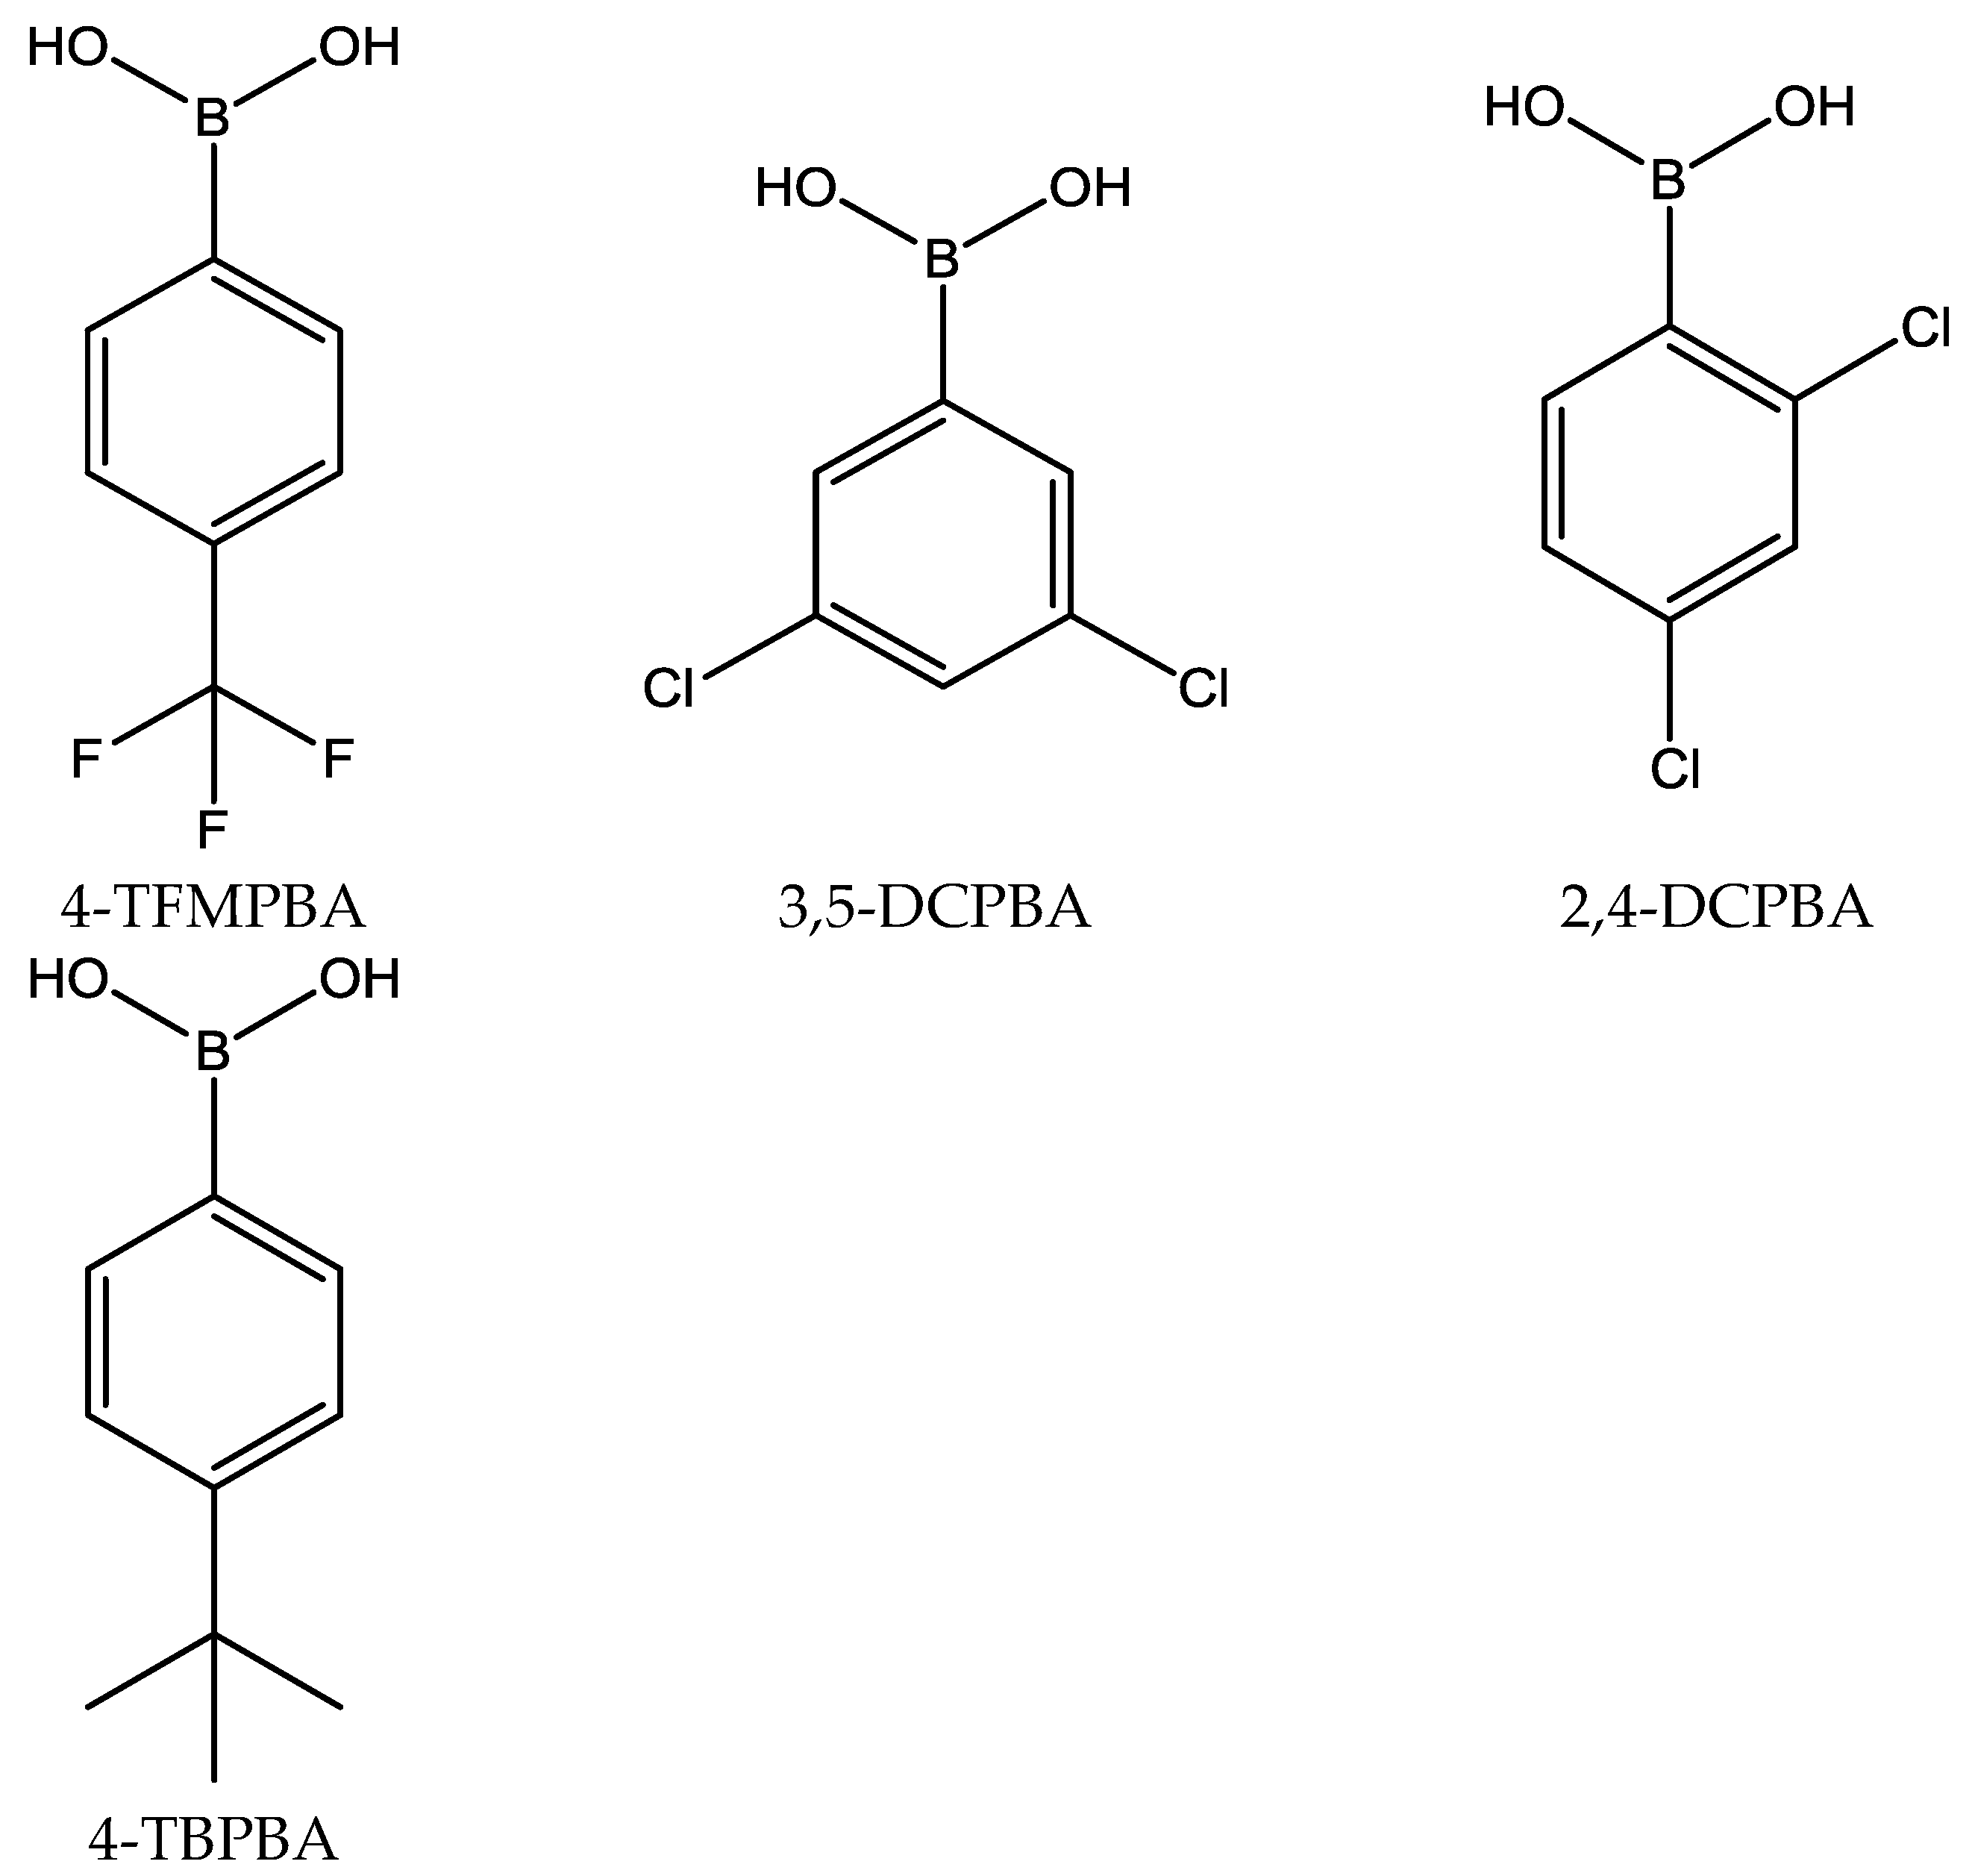
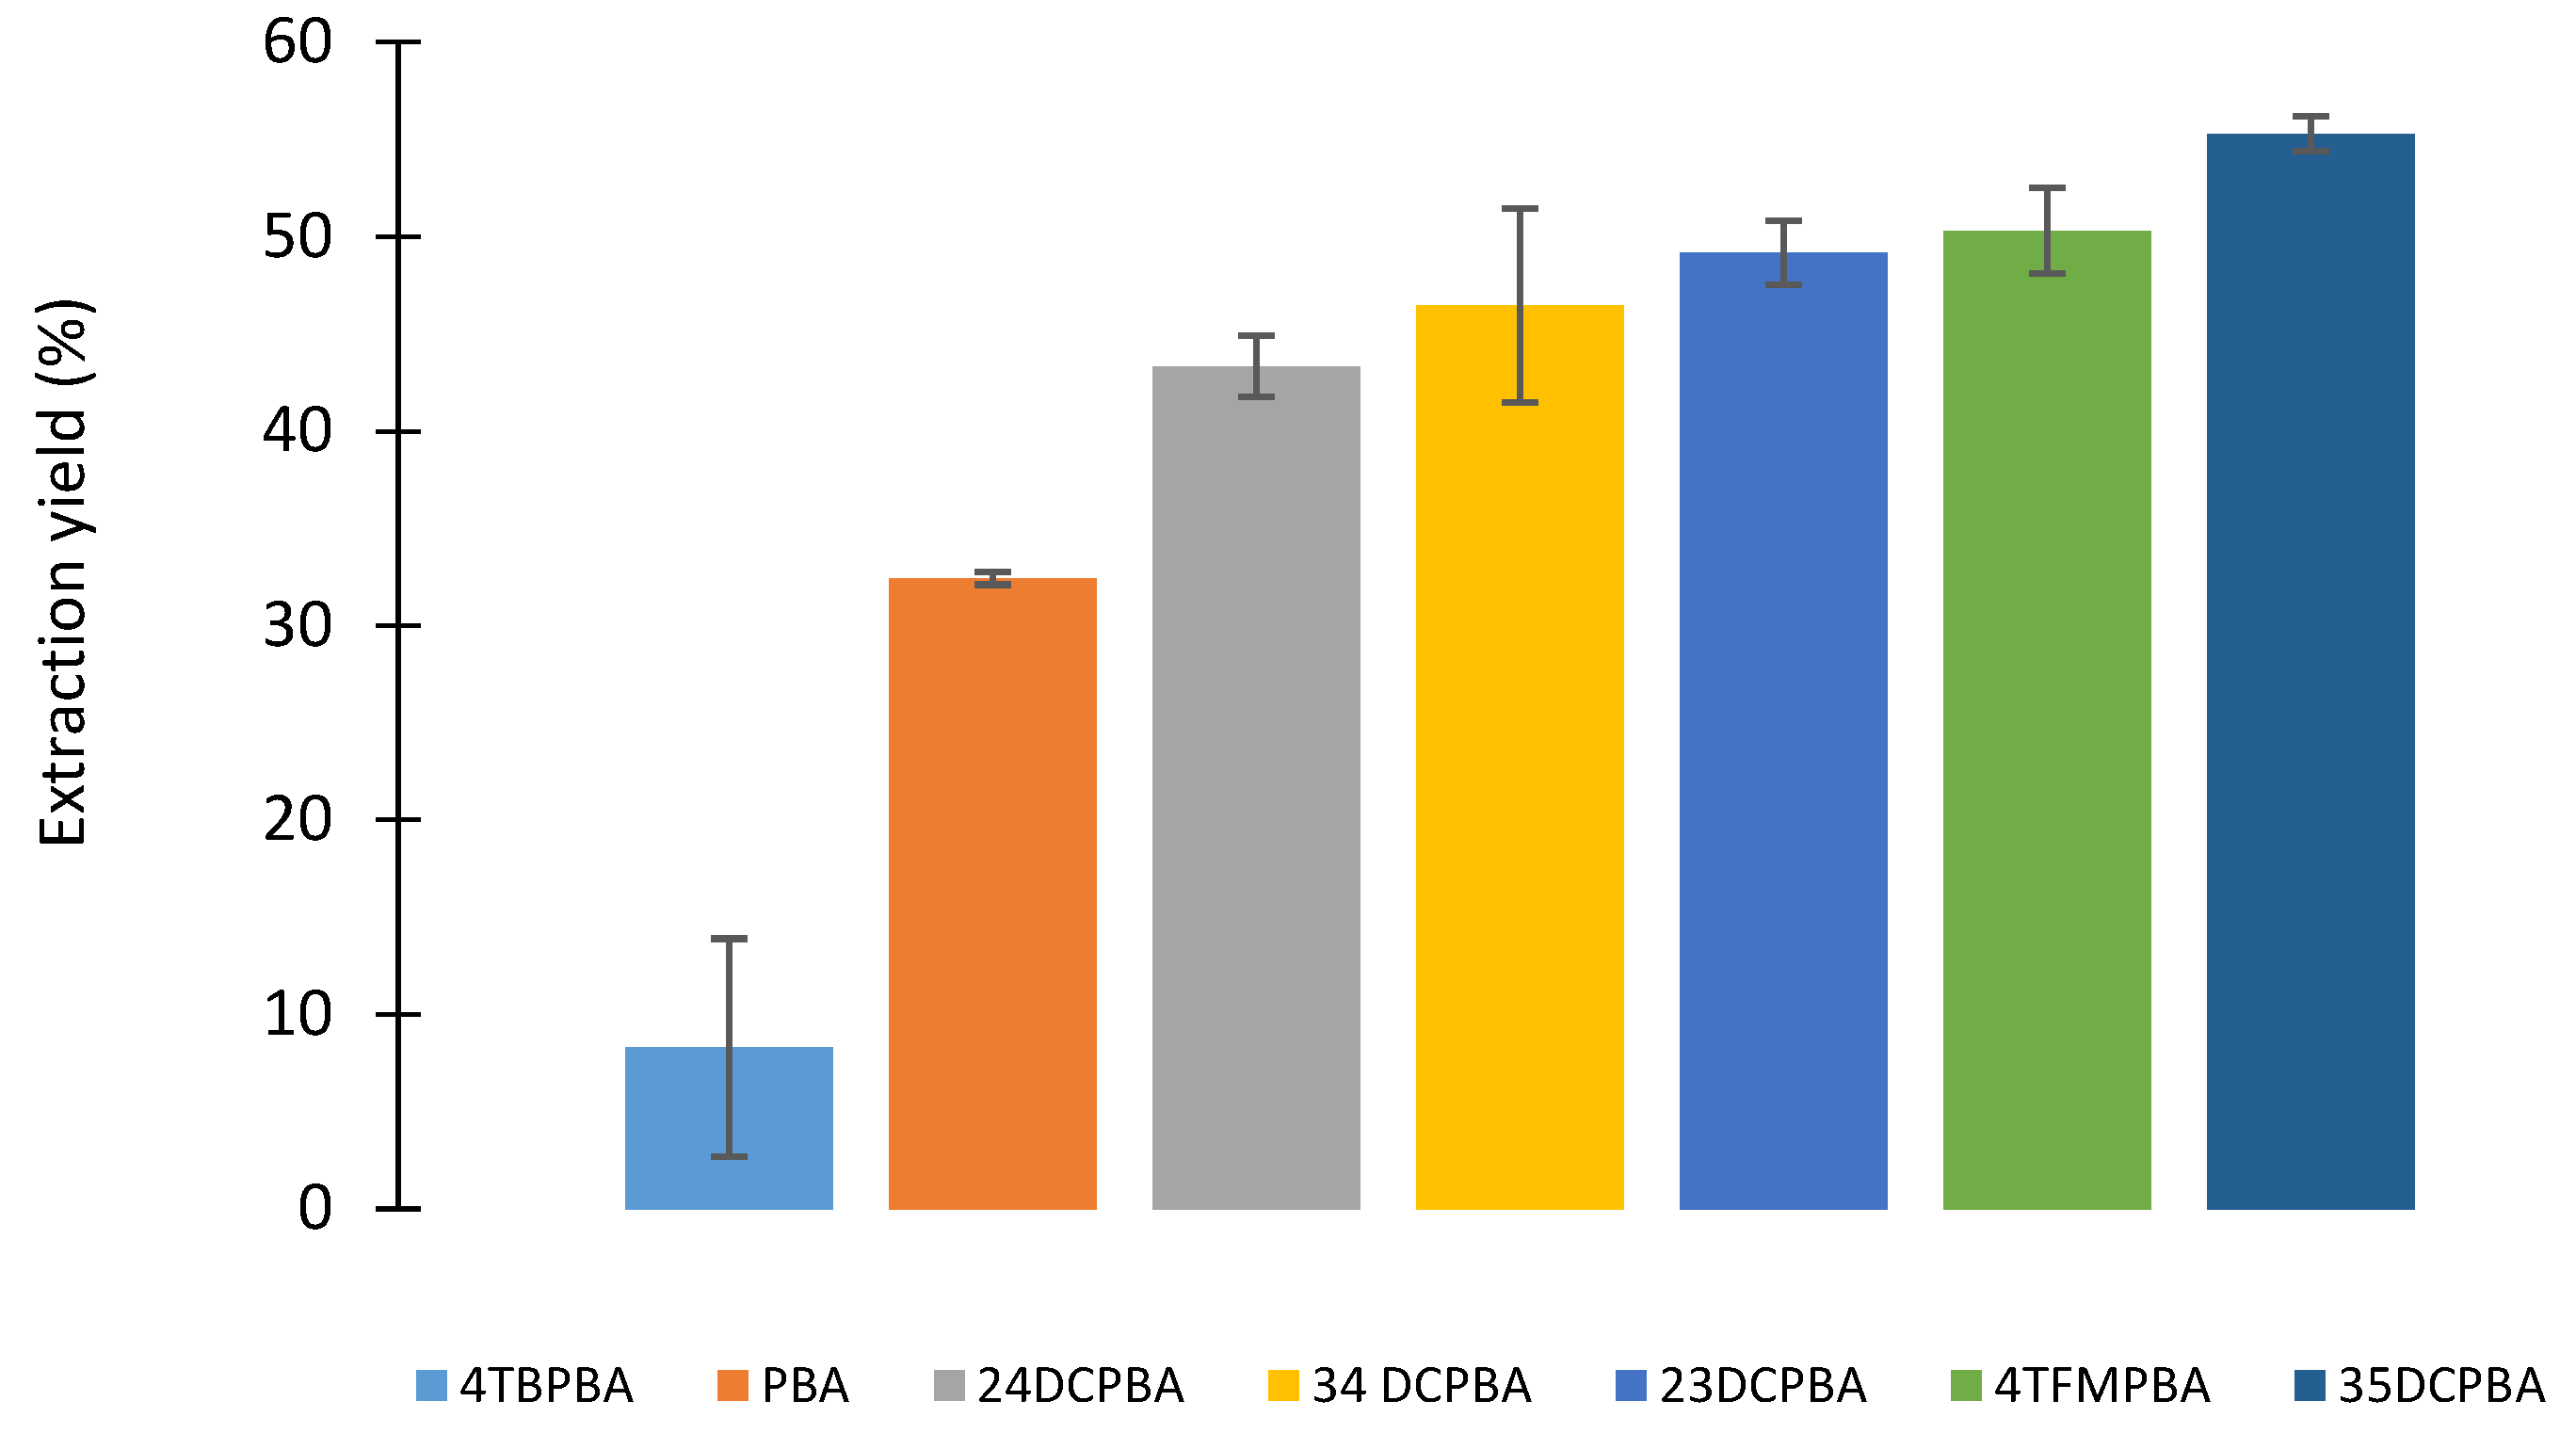
2.2.1. Influence of the Boronic Acid Structure
2.2.2. Influence of the Boronic Acid: Aliquat336® Molar Ratio
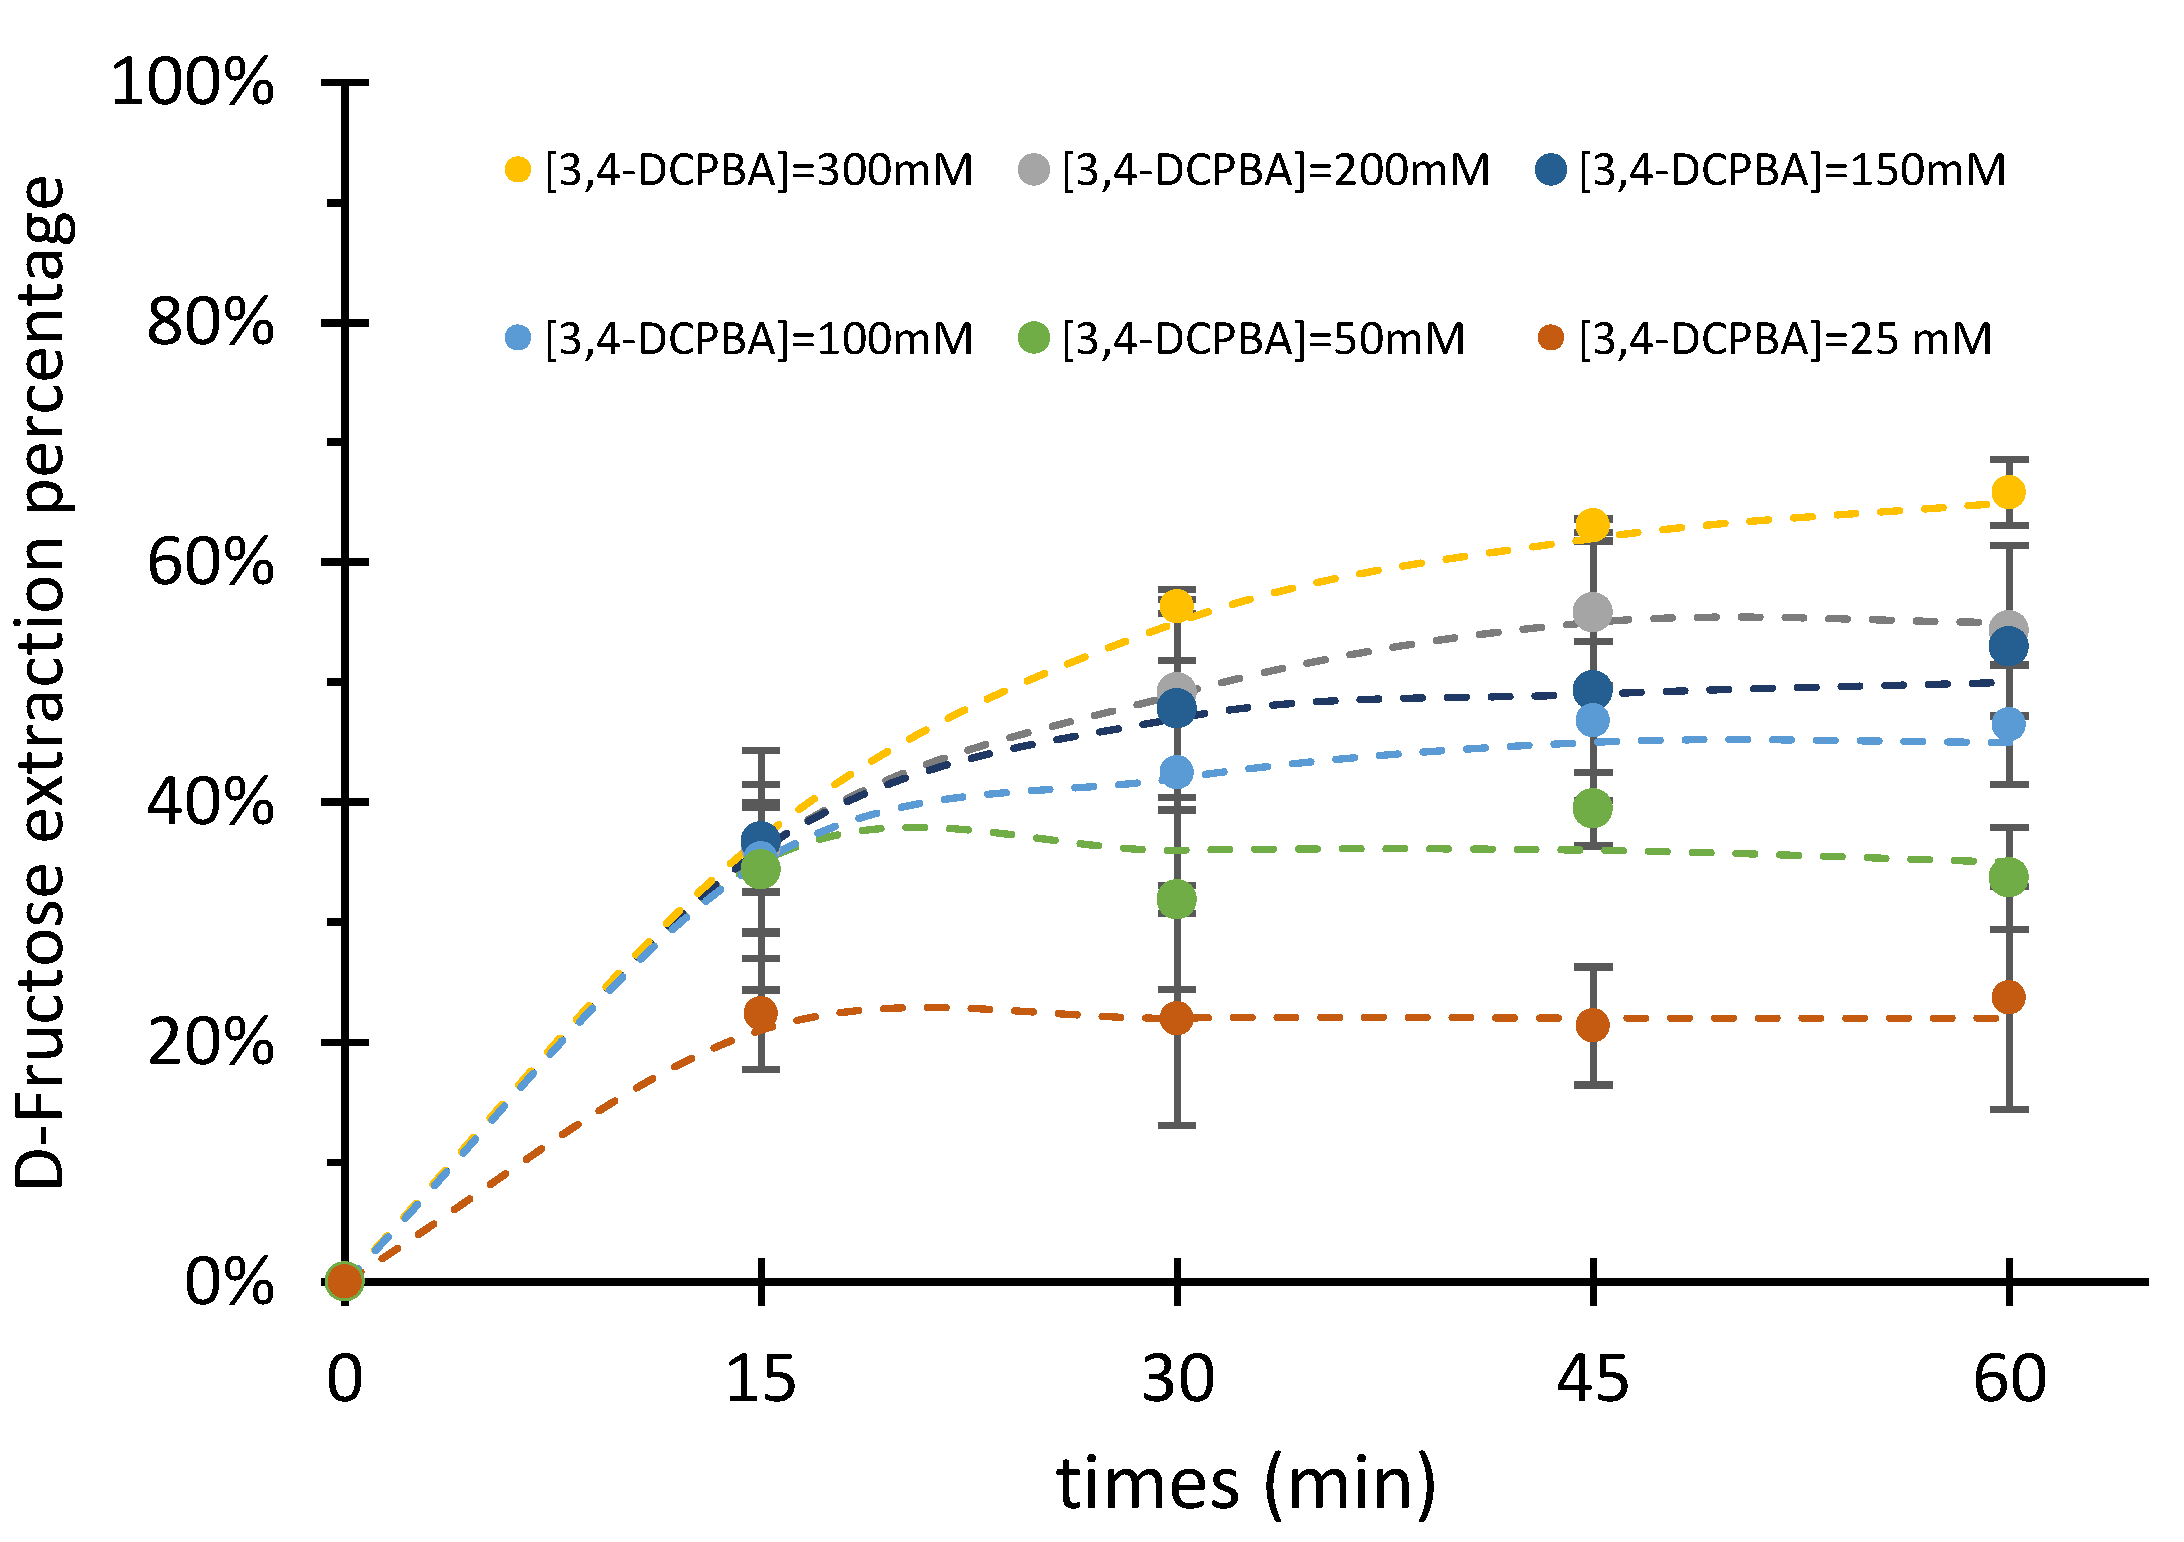
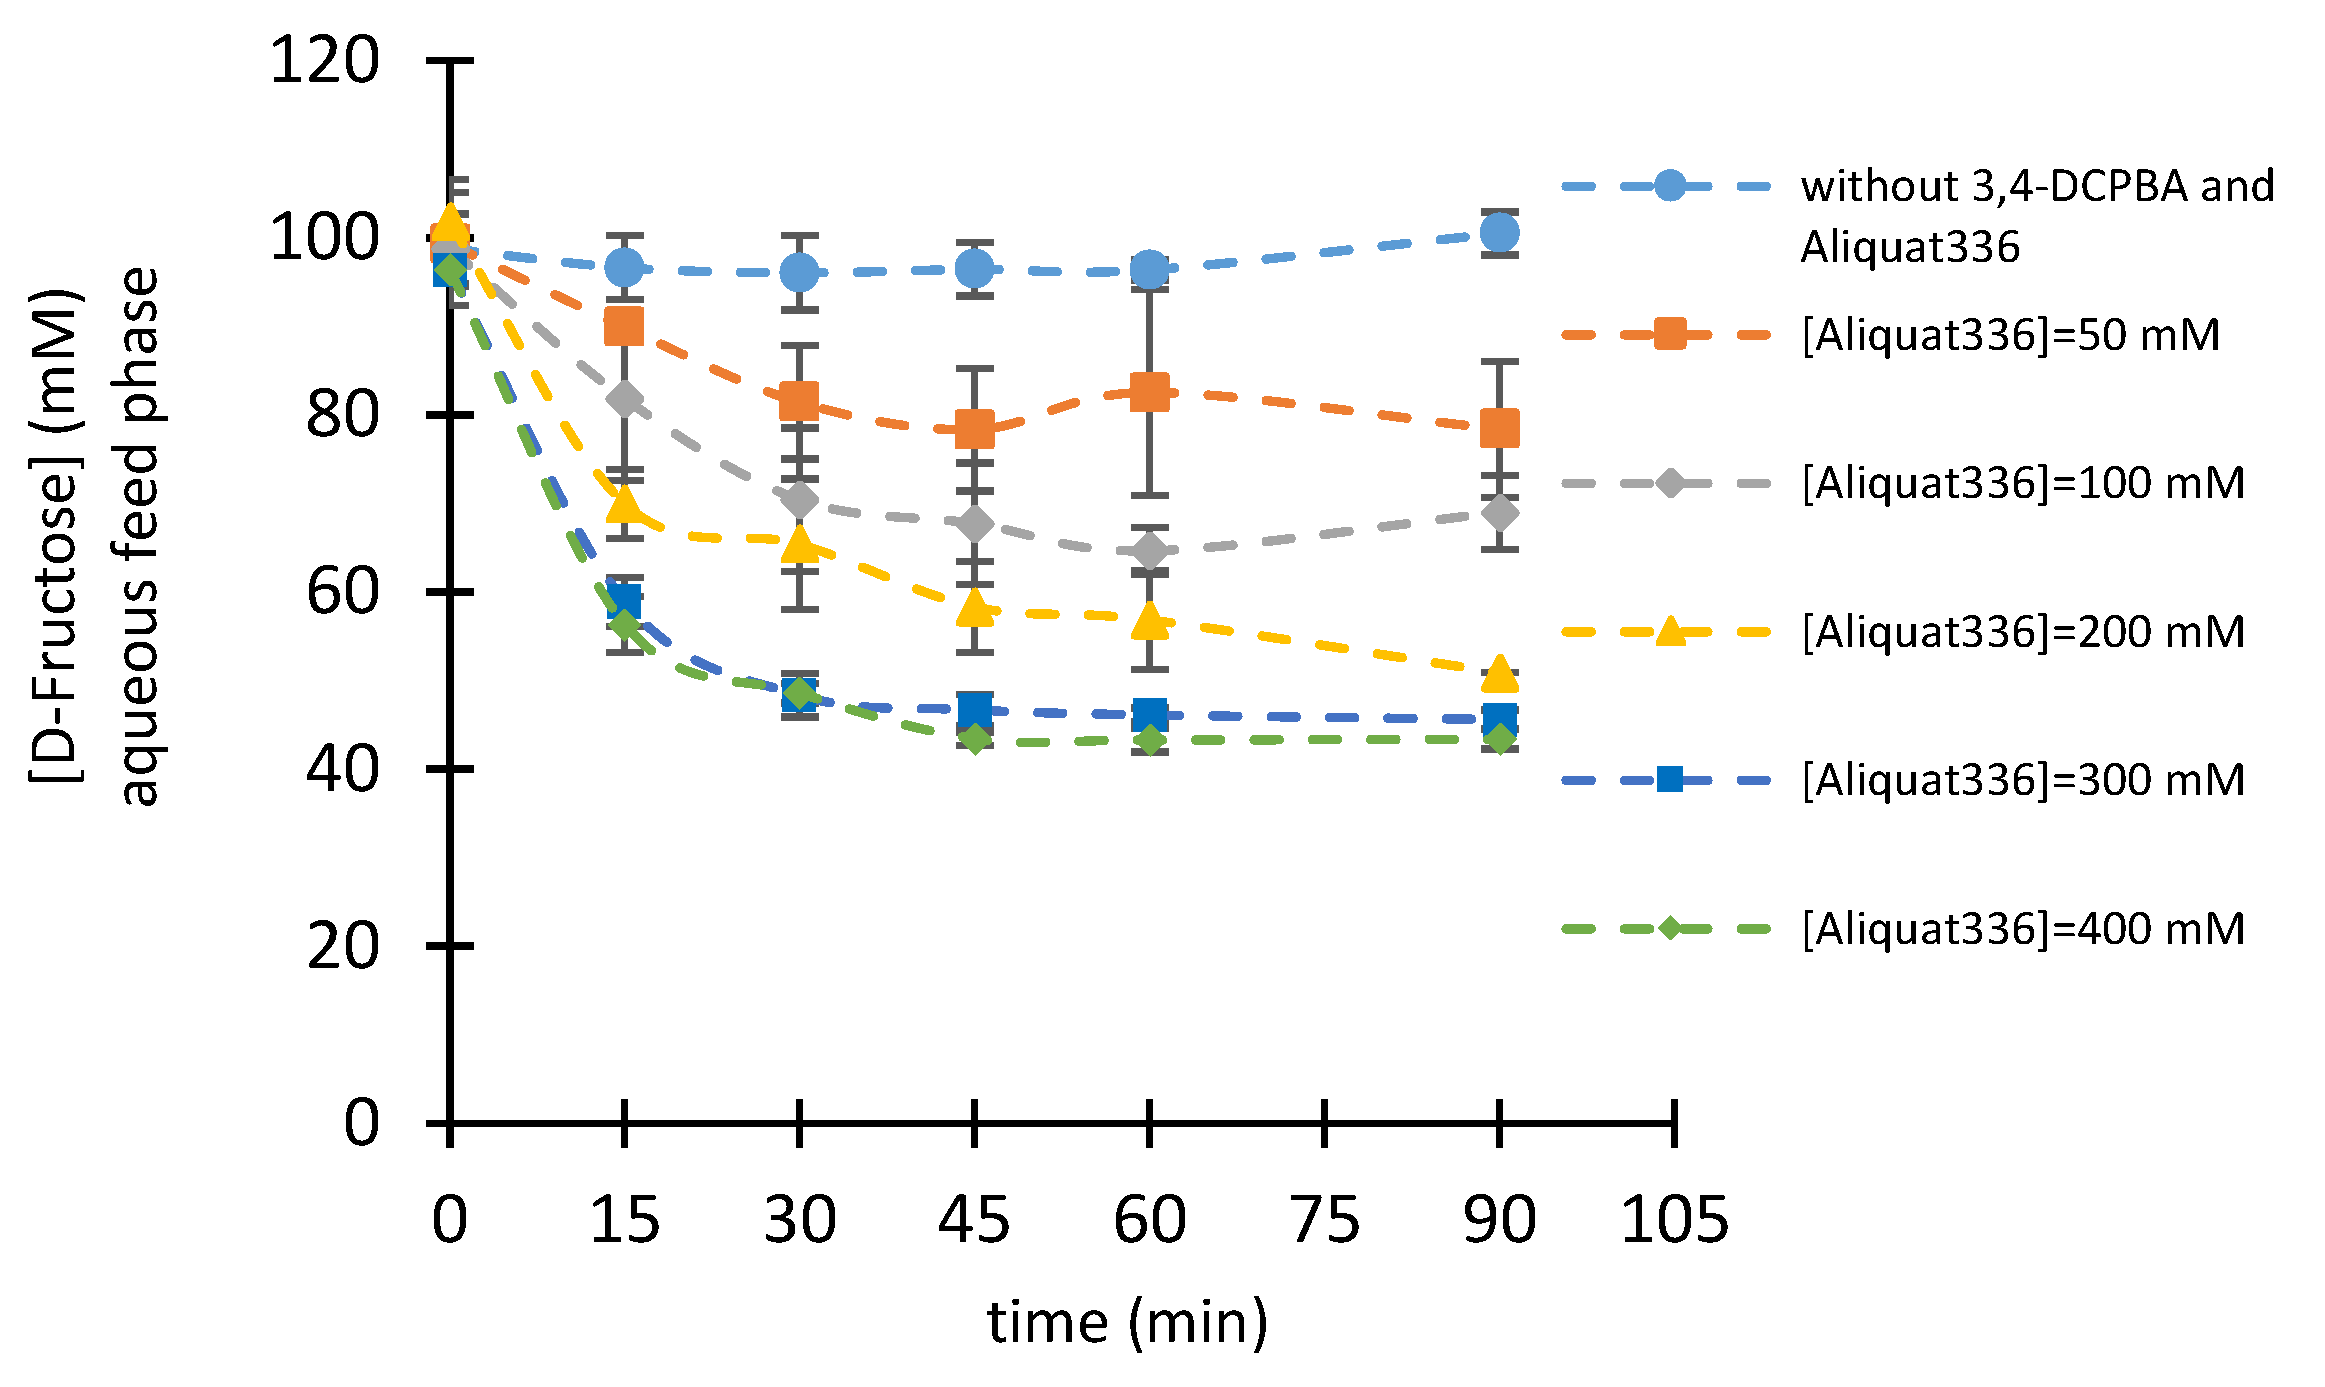
2.2.3. Influence of Boronic Acid and Aliquat336® Concentrations
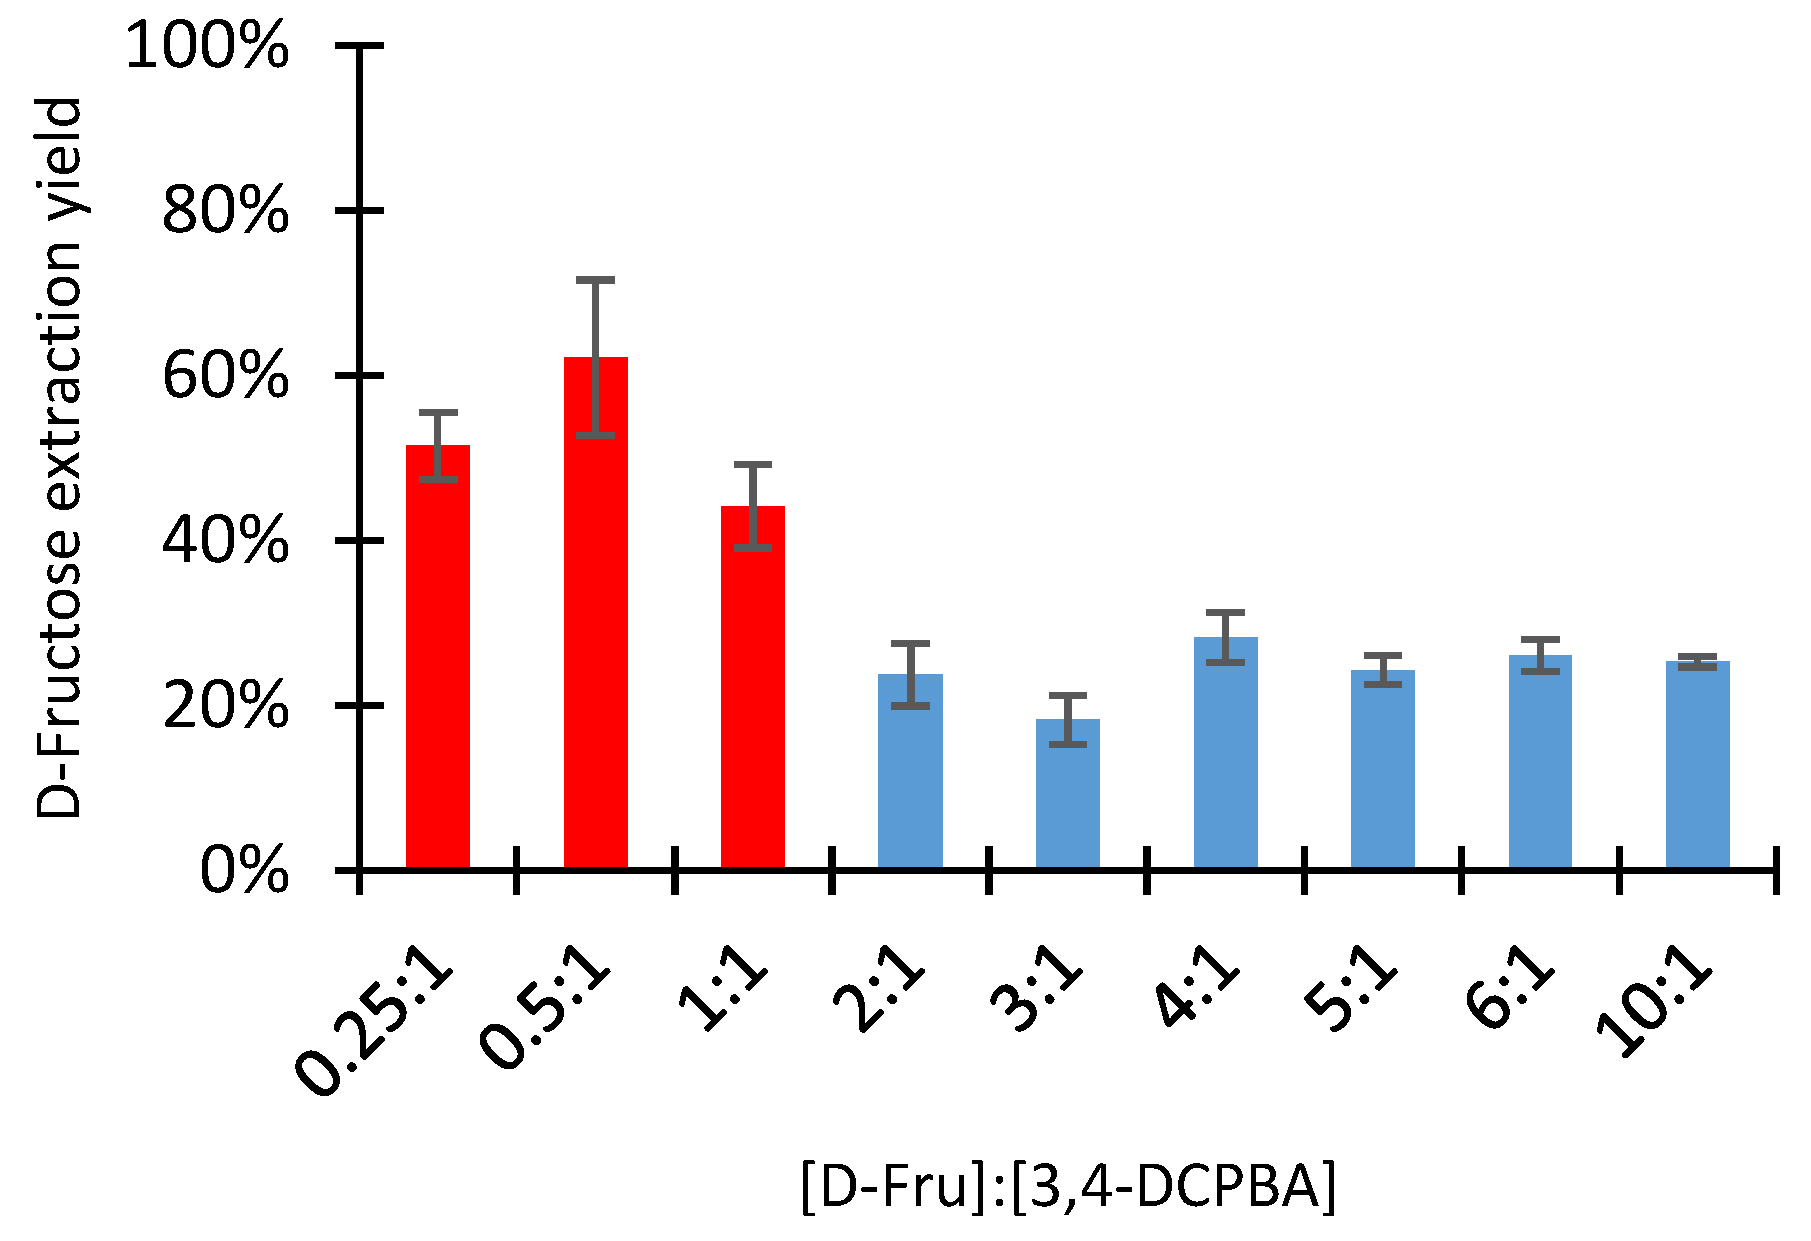
2.2.4. Influence of the D-Fructose: Boronic Acid Molar Ratio
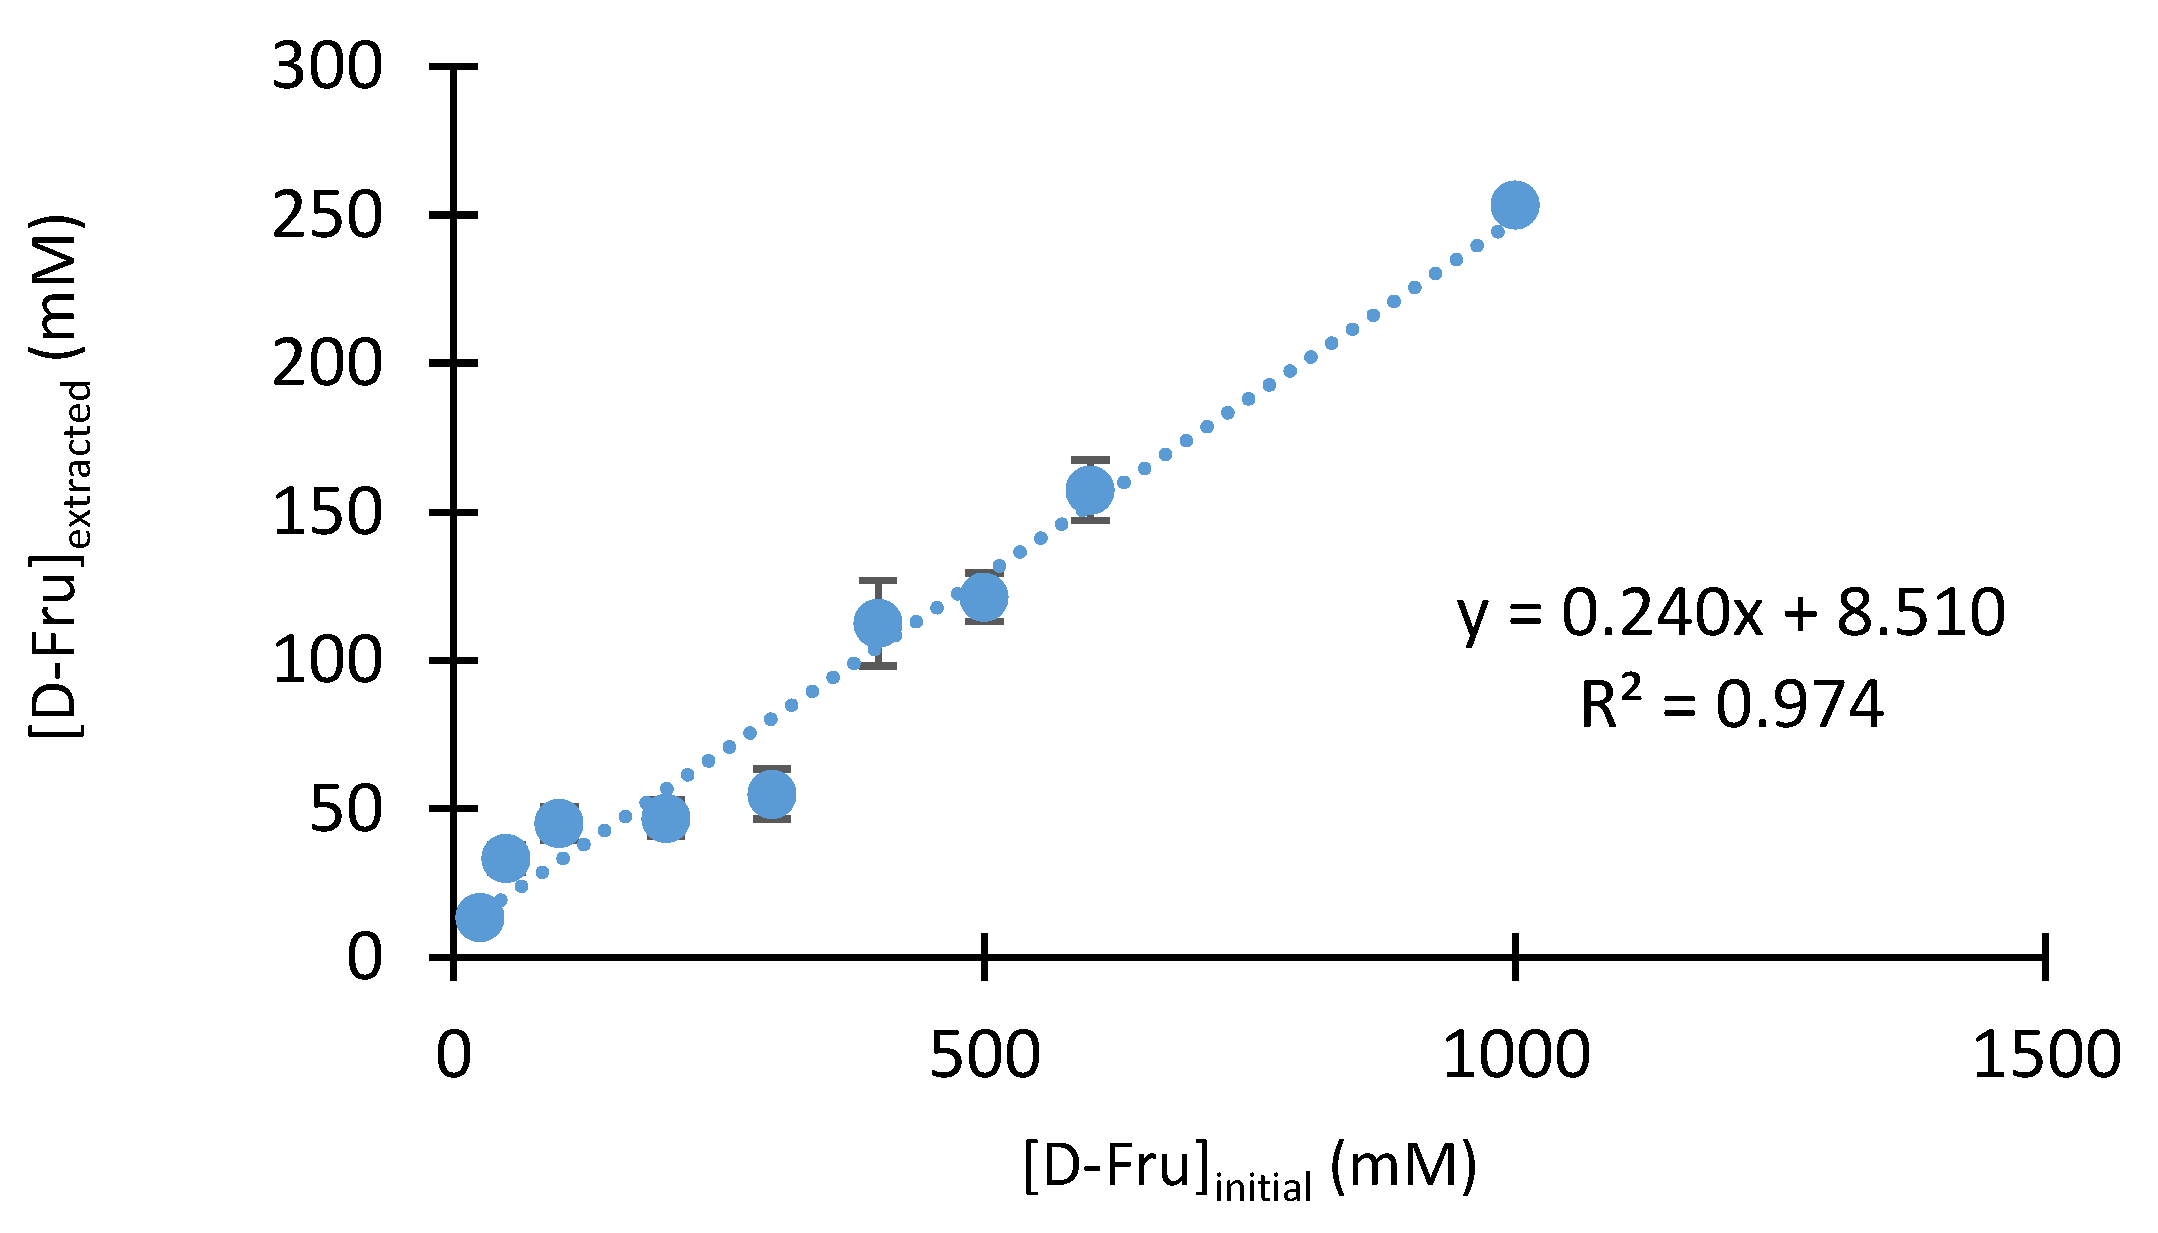
2.2.5. Influence of D-fructose and Boronic Acid Concentrations
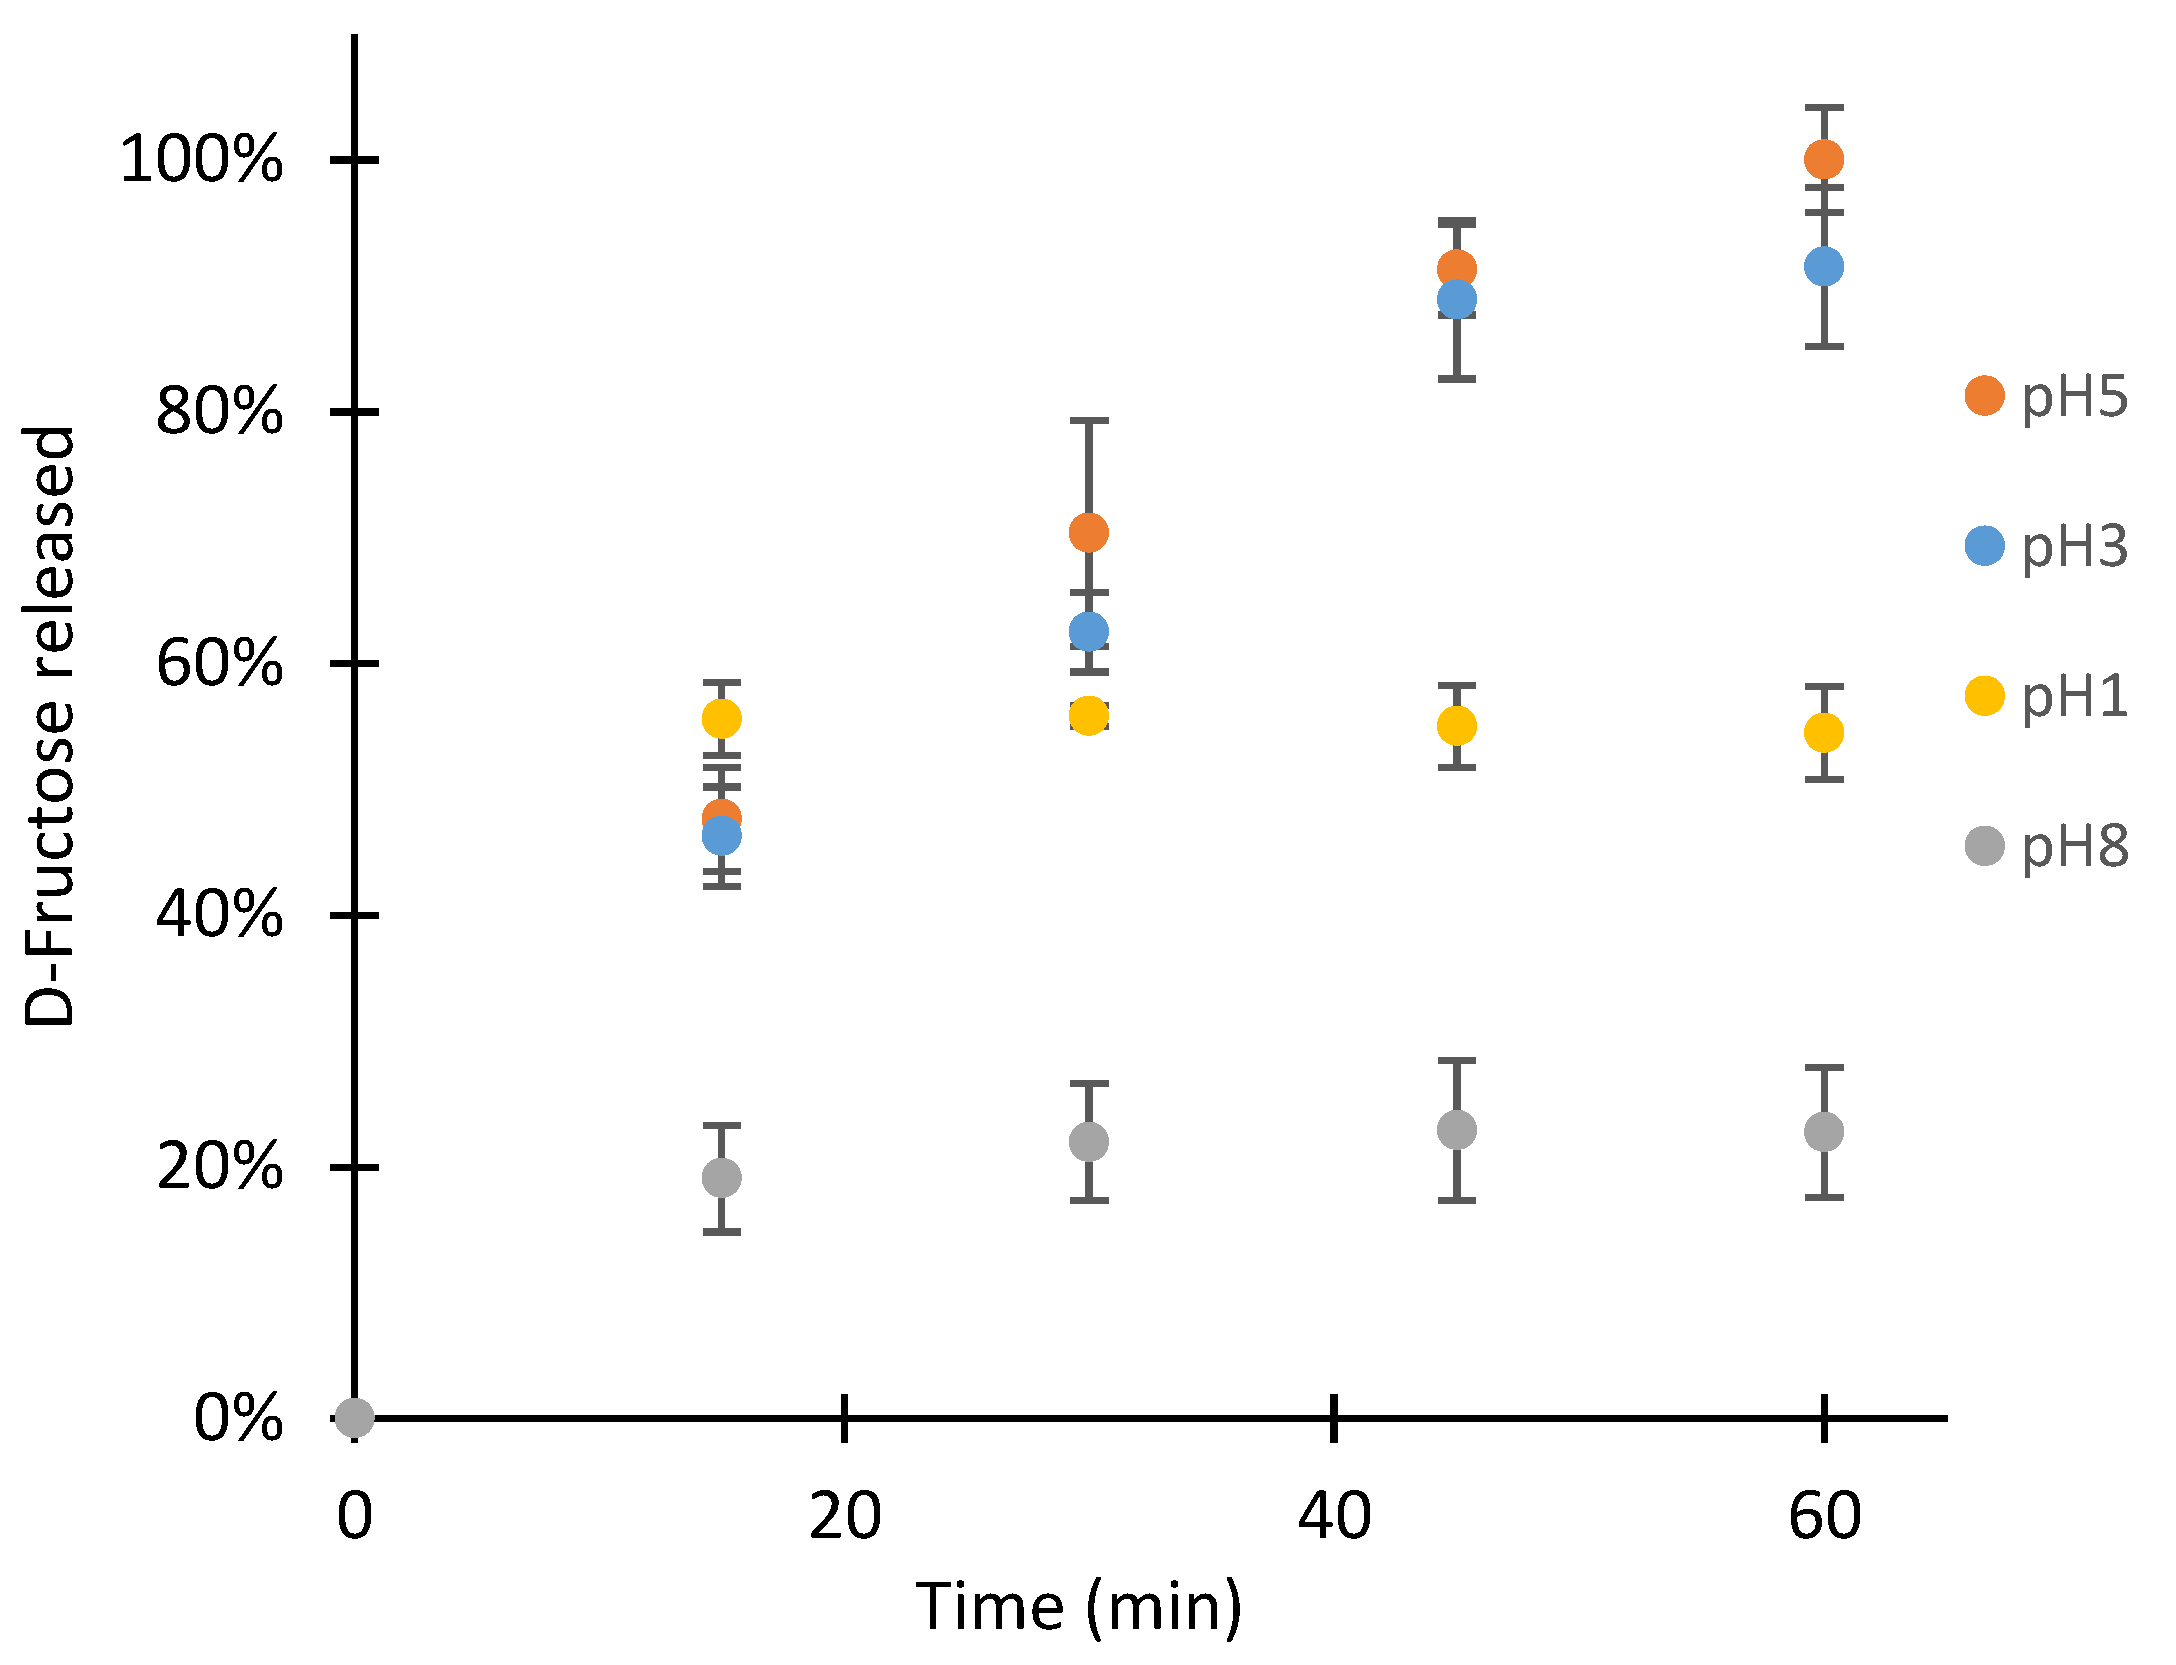
2.2.6. Hydrolysis of the Fructoboronate Complex for D-Fructose Release in the Second Aqueous Phase
2.3. Study of D-Fructose Dehydration in the Receiving Aqueous Phase
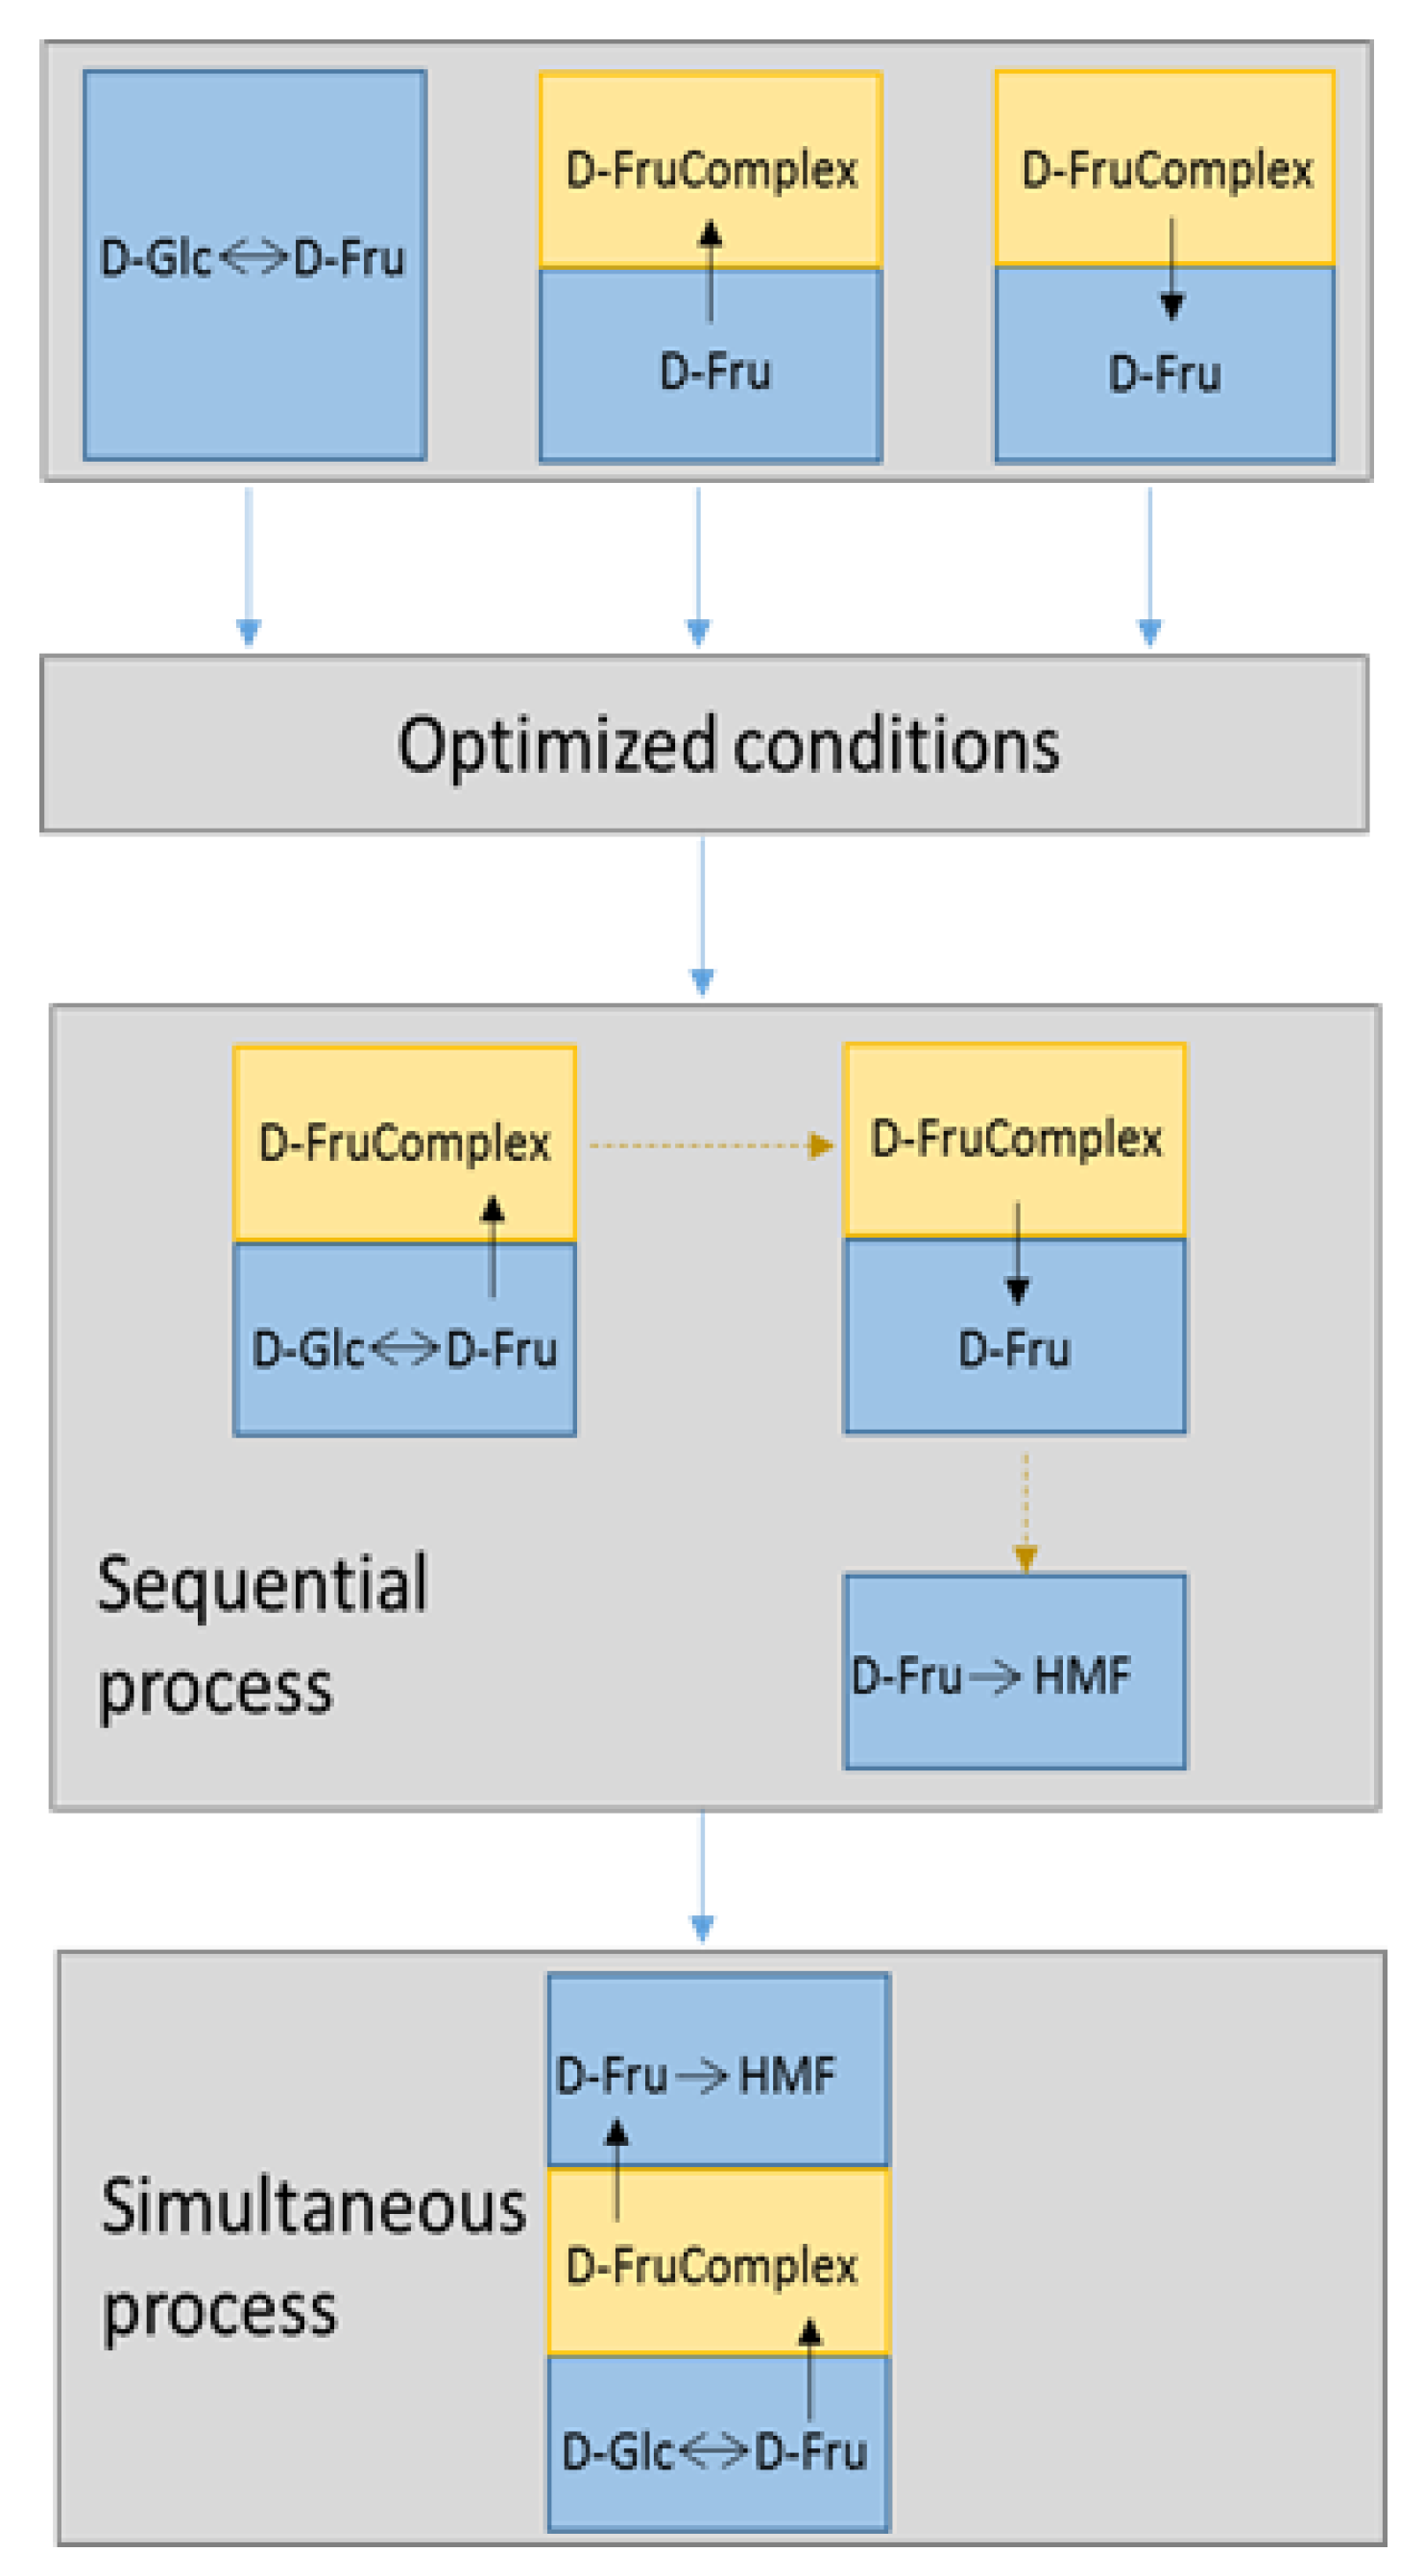
2.4. Study of Sequential Process
2.4.1. D-Glucose Isomerization and D-Fructose Complexation/Transportation
2.4.2. Fructoboronate Complex Hydrolysis, Release of D-Fructose and Dehydration to HMF
2.5. Study of Continuous Process
3. Materials and Methods
3.1. Chemicals and Reagents
3.2. Statistical Analysis
3.3. Characterization
3.4. Aqueous Phase D-Glucose Isomerization (Aqueous Feed Phase) and D-Fructose Complexation/Transportation
3.4.1. D-Glucose Isomerization in Aqueous Feed Phase
3.4.2. D-Fructose Transport in the Organic Phase
3.4.3. Aqueous Phase D-Fructose Complex Hydrolysis in Receiving Aqueous Phase
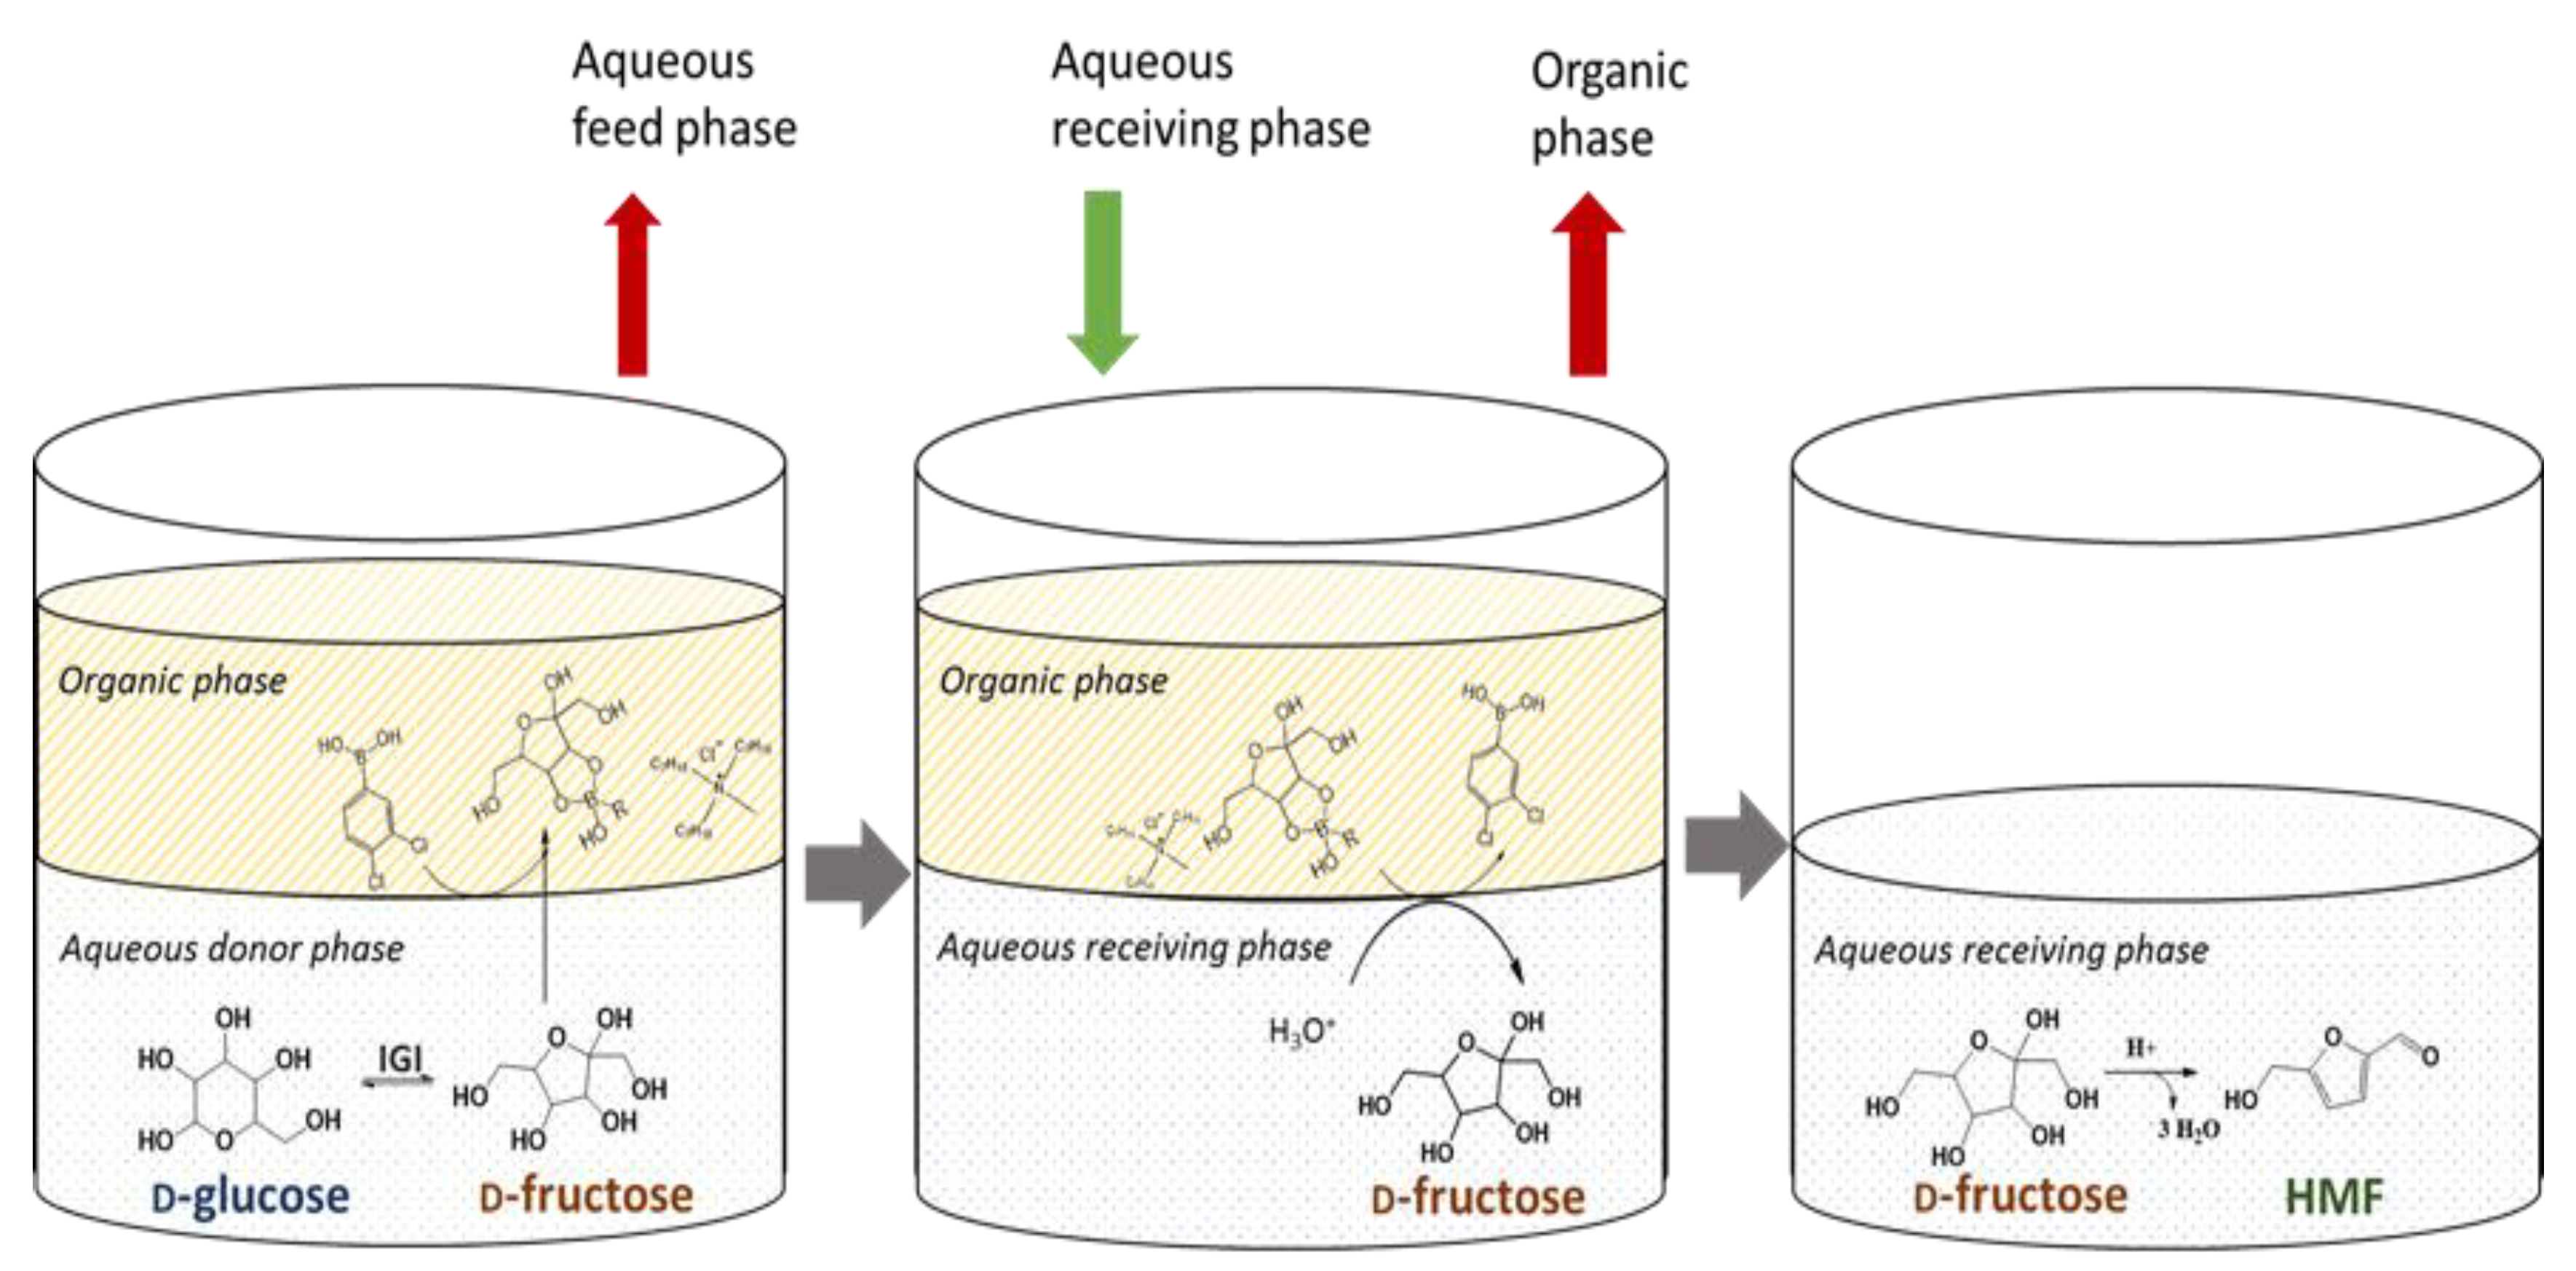
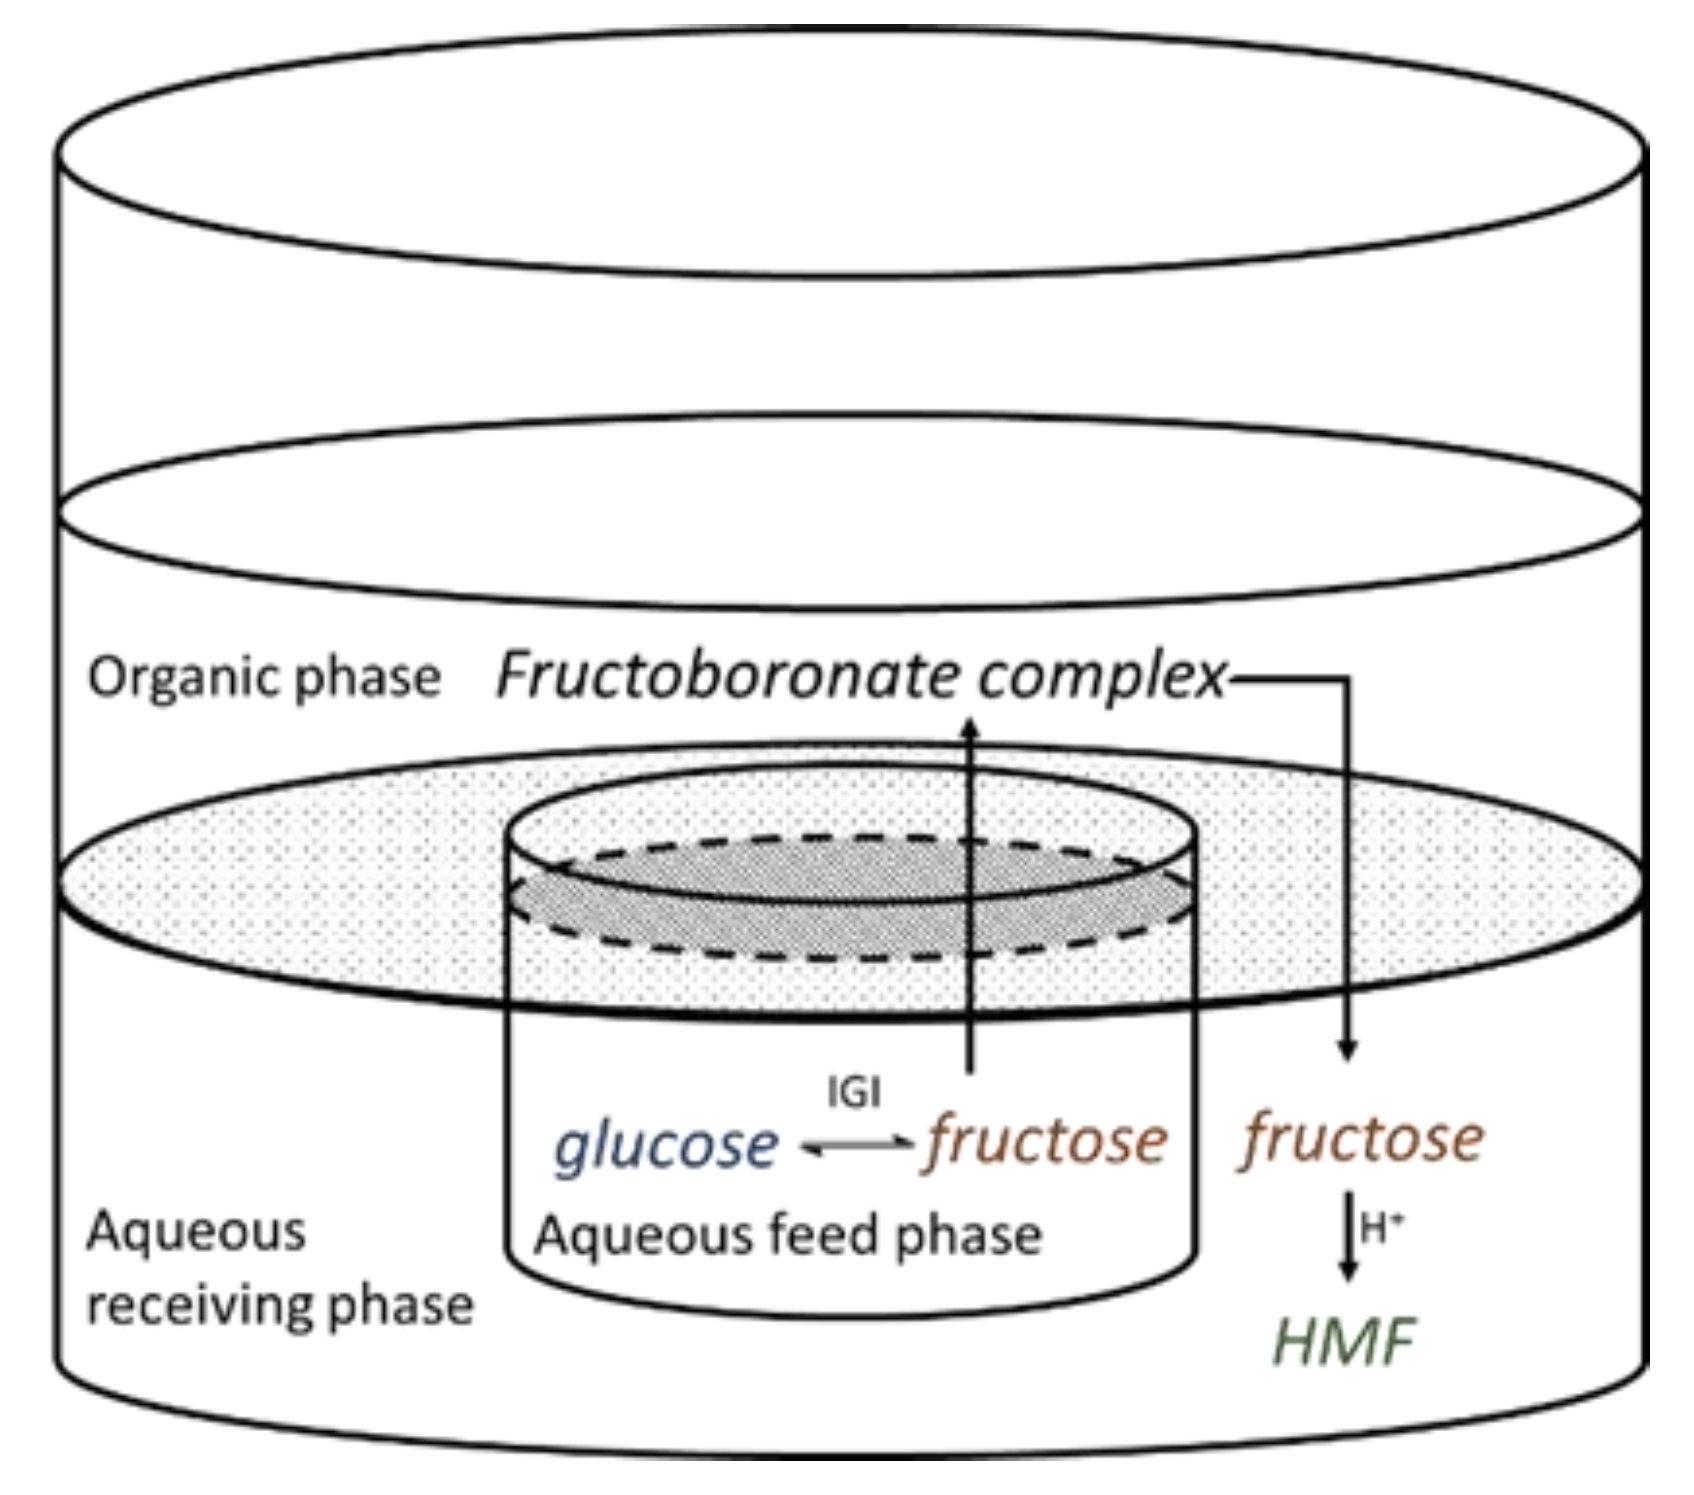
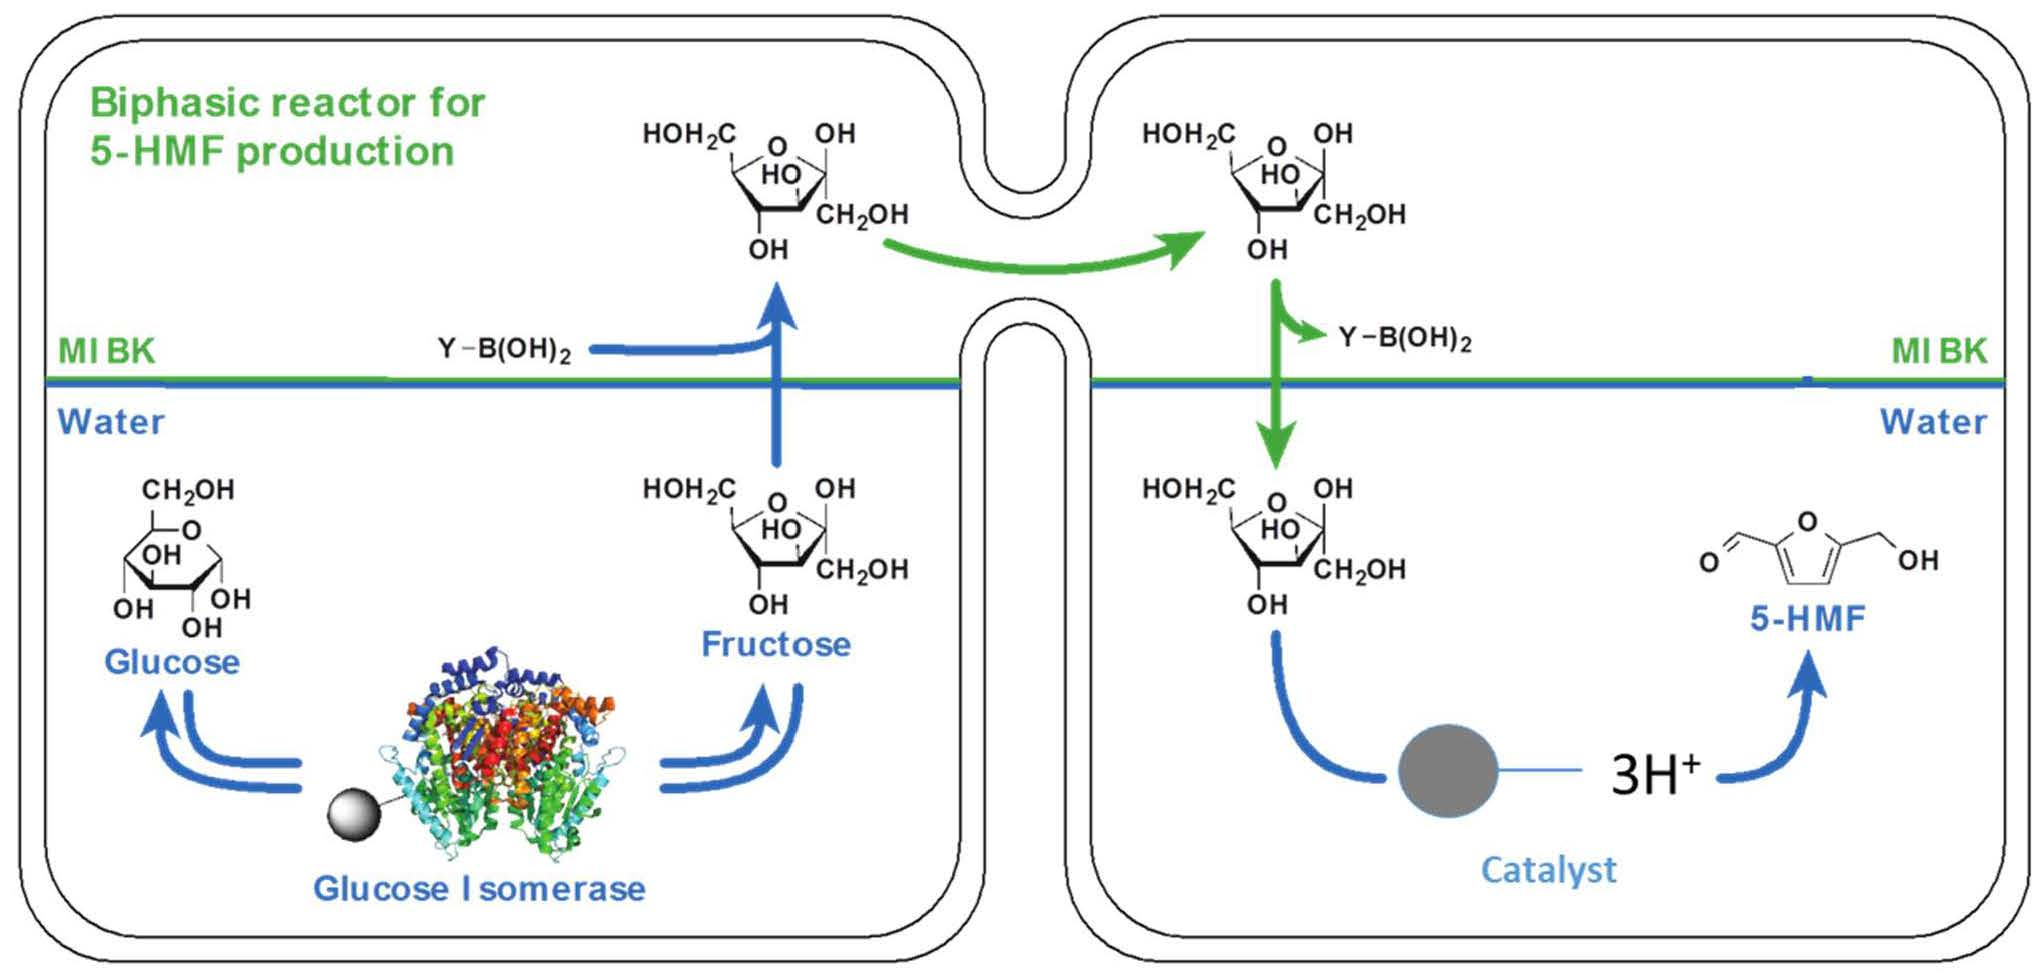
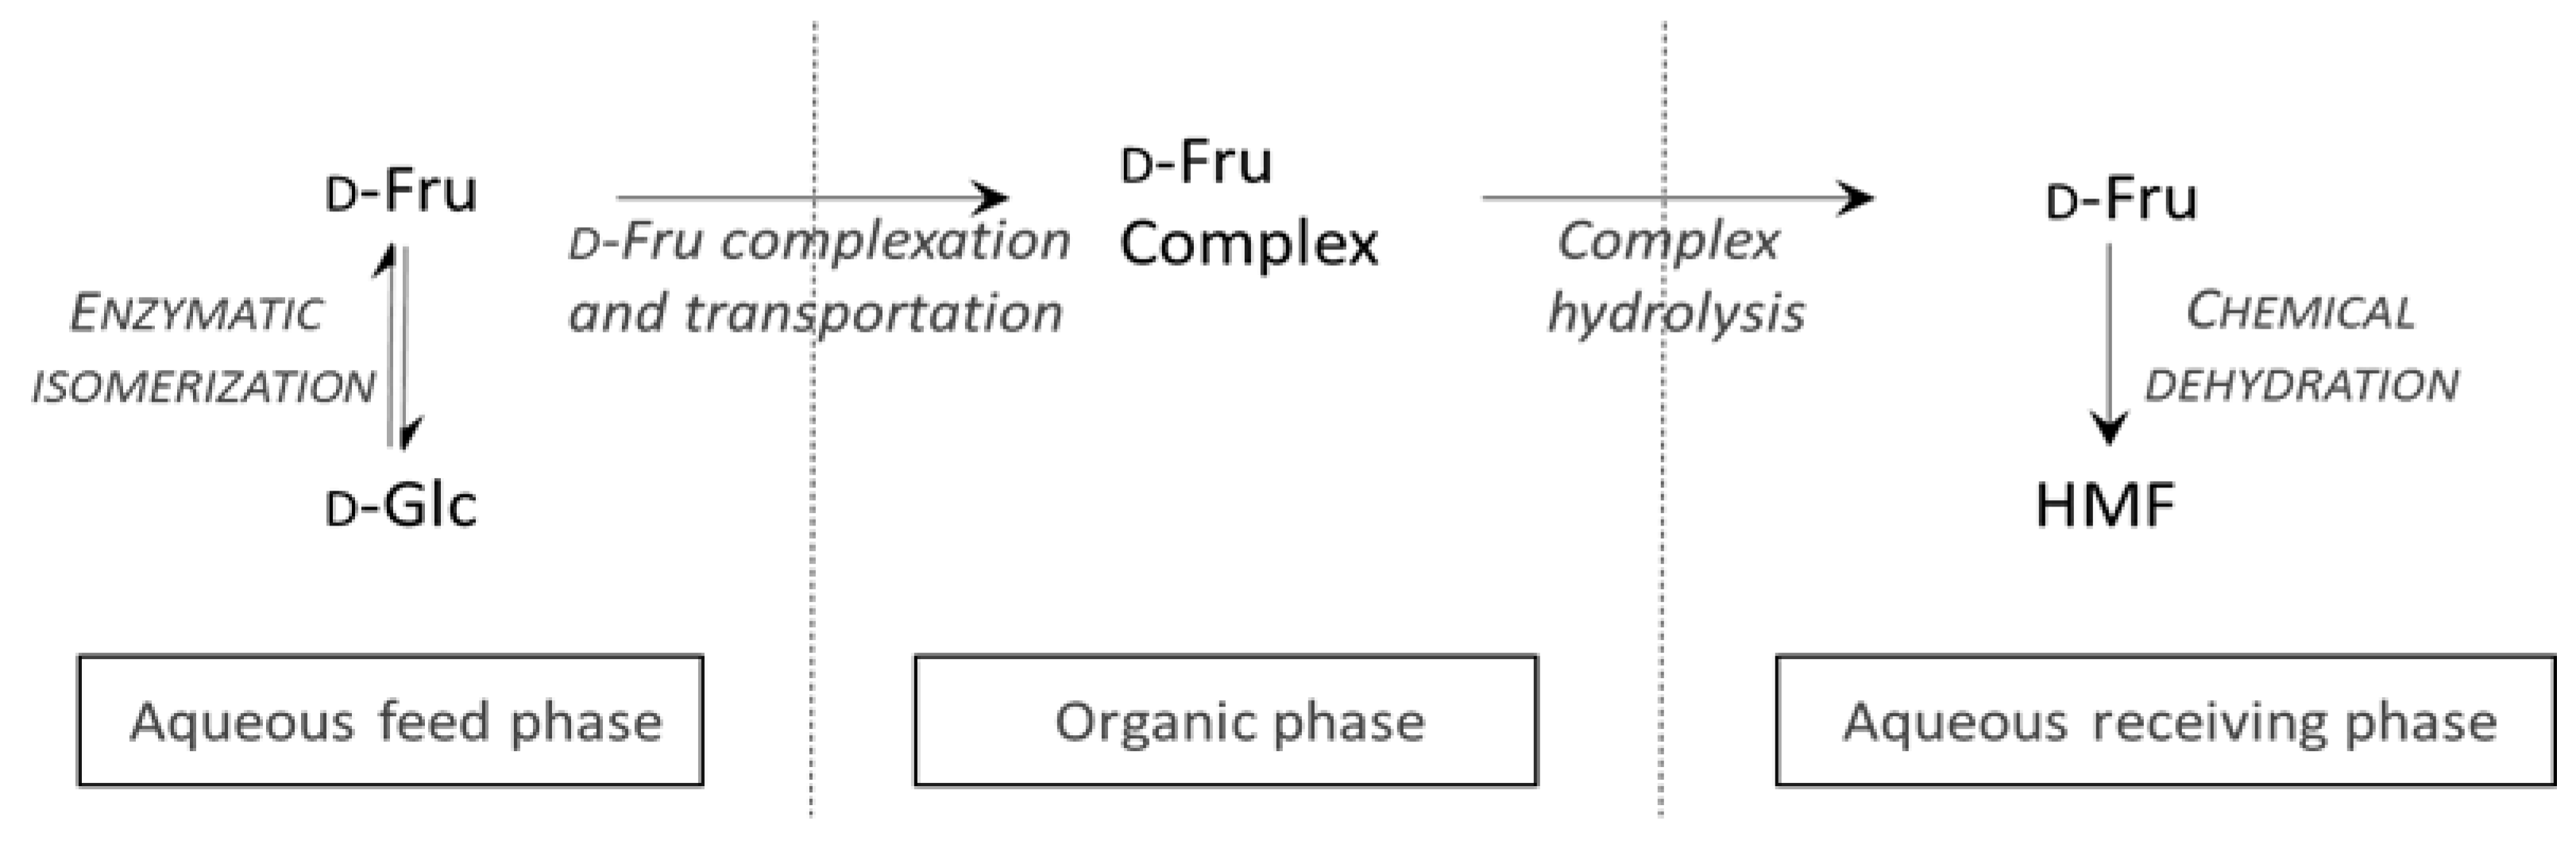
3.4.4. Study of Sequential Process from Glucose Isomerization to Fructose Dehydration
- Simultaneous D-glucose isomerization by enzymatic catalysis in the aqueous feed phase and D-fructose complexation/transportation in the organic phase.
- D-fructose complex hydrolysis in the aqueous receiving phase.
4. Conclusions
Author Contributions
Funding
Acknowledgments
Conflicts of Interest
References
- Nanda, S.; Mohammad, J.; Reddy, S.N.; Kozinski, J.A.; Dalai, A.K. Pathways of lignocellulosic biomass conversion to renewable fuels. Biomass Convers. Biorefin. 2014, 4, 157–191. [Google Scholar] [CrossRef]
- Besson, M.; Gallezot, P.; Pinel, C. Conversion of Biomass into Chemicals over Metal Catalysts. Chem. Rev. 2014, 114, 1827–1870. [Google Scholar] [CrossRef] [PubMed]
- Aresta, M.; Dibenedetto, A.; Dumeignil, F. Biorefinery: From Biomass to Chemicals and Fuels, 3rd ed.; De Gruyter: Berlin, Germany, 2012; ISBN 978-3-11-026023-6. [Google Scholar]
- Agbor, V.B.; Cicek, N.; Sparling, R.; Berlin, A.; Levin, D.B. Biomass pretreatment: Fundamentals toward application. Biotechnol. Adv. 2011, 29, 675–682. [Google Scholar] [CrossRef] [PubMed]
- Bozell, J.J.; Petersen, G.R. Technology development for the production of biobased products from biorefinery carbohydrates—The USA Department of Energy’s “Top 10” revisited. Green Chem. 2010, 12, 539–545. [Google Scholar] [CrossRef]
- Van Heerden, C.D.; Nicol, W. Continuous succinic acid fermentation by Actinobacillus succinogenes. Biochem. Eng. J. 2013, 73, 5–11. [Google Scholar] [CrossRef]
- Girard, E.; Delcroix, D.; Cabiac, A. Catalytic conversion of cellulose to C2–C3 glycols by dual association of a homogeneous metallic salt and a perovskite-supported platinum catalyst. Catal. Sci. 2016, 6, 5534–5542. [Google Scholar] [CrossRef]
- Shanks, B.H. Unleashing Biocatalysis/Chemical Catalysis Synergies for Efficient Biomass Conversion. ACS Chem. Biol. 2007, 2, 533–535. [Google Scholar] [CrossRef] [PubMed] [Green Version]
- Vennestrøm, P.N.R.; Taarning, E.; Christensen, C.H.; Pedersen, S.; Grunwaldt, J.D.; Woodley, J.M. Chemoenzymatic Combination of Glucose Oxidase with Titanium Silicalite-1. ChemCatChem 2010, 2, 943–945. [Google Scholar] [CrossRef]
- Denard, C.A.; Hartwig, J.F.; Zhao, H. Multistep One-Pot Reactions Combining Biocatalysts and Chemical Catalysts for Asymmetric Synthesis. ACS Catal. 2013, 3, 2856–2864. [Google Scholar] [CrossRef]
- Dumeignil, F. Public Serv. Rev. Eur. Union 2011, 22, 528. [Google Scholar]
- Dumeignil, F. Chemical Catalysis and Biotechnology: From a Sequential Engagement to a One-Pot Wedding. Chem. Ing. Tech. 2014, 86, 1496–1508. [Google Scholar] [CrossRef]
- Van Putten, R.; Van der Waal, J.C.; de Jong, E.; Rasrendra, C.B.; Heeres, H.G.; de Vries, J.G. Hydroxymethylfurfural, A Versatile Platform Chemical Made from Renewable Resources. Chem. Rev. 2013, 113, 1499–1597. [Google Scholar] [CrossRef] [PubMed]
- Moliner, M.; Román-leshkov, Y.; Davis, M.E. Tin-containing zeolites are highly active catalysts for the isomerization of glucose in water. Proc. Natl. Acad. Sci. USA 2010, 107, 6164–6168. [Google Scholar] [CrossRef] [PubMed] [Green Version]
- Pacheco, J.J.; Davis, M.E. Synthesis of terephthalic acid via Diels-Alder reactions with ethylene and oxidized variants of 5-hydroxymethylfurfural. Proc. Natl. Acad. Sci. USA 2014, 111, 8363–8367. [Google Scholar] [CrossRef] [PubMed] [Green Version]
- Lin, Z.; Nikolakis, V.; Ierapetritou, M. Alternative Approaches for p-Xylene Production from Starch: Techno-Economic Analysis. Ind. Eng. Chem. Res. 2014, 53, 10688–10699. [Google Scholar] [CrossRef]
- De Jong, E.; Dam, M.A.; Sipos, L.; Gruter, G. Furandicarboxylic Acid (FDCA), a Versatile Building Block for a Very Interesting Class of Polyesters. Am. Chem. Soc. 2012, 1, 1–13. [Google Scholar]
- Boisen, A.; Christensen, T.B.; Fu, W.; Gorbanev, Y.Y.; Hansen, T.S.; Jensen, J.S.; Klitgaard, S.K.; Pedersen, S.; Riisager, A.; Stahlberg, T.; et al. Process Integration for the Conversion of Glucose to 2,5-Furandicarboxylic Acid. Chem. Eng. Res. Des. 2009, 87, 1318–1327. [Google Scholar] [CrossRef]
- Akien, G.R.; Qi, L.; Horvath, I.T. Molecular mapping of the acid catalysed dehydration of fructose. Chem. Commun. 2012, 48, 5850–5852. [Google Scholar] [CrossRef] [PubMed]
- Parker, K.; Salas, M.; Nwosu, V.C. High fructose corn syrup: Production, uses and public health concerns Biotechnol. Mol. Biol. Rev. 2010, 5, 71–78. [Google Scholar]
- Li, H.; Yang, S.; Saravanamurugan, S.; Riisager, A. Glucose Isomerization by Enzymes and Chemo-catalysts: Status and Current Advances. ACS Catal. 2017, 7, 3010–3029. [Google Scholar] [CrossRef]
- Delidovich, I.; Palkovits, R. Catalytic Isomerization of Biomass-Derived Aldoses: A Review. ChemSusChem 2016, 9, 547–561. [Google Scholar] [CrossRef] [PubMed] [Green Version]
- Choudhary, V.; Pinar, A.B.; Lobo, R.F.; Vlachos, D.G.; Sandler, S.I. Comparison of Homogeneous and Heterogeneous Catalysts for Glucose-to-Fructose Isomerization in Aqueous Media. ChemSusChem 2013, 6, 2369–2376. [Google Scholar] [CrossRef] [PubMed]
- Marianou, A.A.; Michailof, C.M.; Pineda, A.; Iliopoulou, E.F.; Triantafyllidis, K.S.; Lappas, A.A. Glucose to Fructose Isomerization in Aqueous Media over Homogeneous and Heterogeneous Catalysts. ChemCatChem 2016, 8, 1100–1110. [Google Scholar] [CrossRef]
- Zhao, S.; Guo, X.; Bai, P.; Lv, L. Catalytic Isomerization of Biomass-Derived Aldoses: A Review. Asian J. Chem. 2014, 26, 4537–4542. [Google Scholar]
- Demerdash, M.; Attia, R.M. Equilibrium kinetics of d-glucose to d-fructose isomerization catalyzed by glucose isomerase enzyme from Streptomyces phaeochromogenus. Zentralbl. Mikrobiol. 1992, 147, 297–303. [Google Scholar] [CrossRef]
- Gaily, M.H.; Elhassan, B.M.; Abasaeed, A.E.; Al-shrhan, M. Isomerization and Kinetics of Glucose into Fructose. Int. J. Eng. Technol. 2010, 10, 1–6. [Google Scholar]
- Takasaki, Y. Kinetic and Equilibrium Studies on d-Glucose-d-Fructose Isomerization Catalyzed by Glucose Isomerase from Streptomyces sp. Agric. Biol. Chem. 1967, 31, 309–313. [Google Scholar] [CrossRef]
- Huang, H.; Denard, C.A.; Alamillo, R.; Crisci, A.J.; Miao, Y.; Dumesic, J.A.; Scott, S.L.; Zhao, H. Tandem Catalytic Conversion of Glucose to 5-hydroxymethylfurfural with an Immobilized Enzyme and a Solid Acid. ACS Catal. 2014, 4, 2165–2172. [Google Scholar] [CrossRef]
- Huang, R.; Qi, W.; Su, R.; He, Z. Integrating Enzymatic and Acid Catalysis to Convert Glucose into 5-Hydroxymethylfurfural. Chem. Commun. (Camb.) 2010, 46, 1115–1125. [Google Scholar] [CrossRef] [PubMed]
- Delidovich, I.; Palkovits, R. Fructose production via extraction-assisted isomerization of glucose catalyzed by phosphates. Green Chem. 2016, 18, 5822–5830. [Google Scholar] [CrossRef]
- Alipour, S.; Relue, P.A.; Viamajala, S.; Varanasi, S. High yield 5-(hydroxylmethyl)furfural Production from Biomass Sugars under Facile Reaction Conditions: A Hybrid Enzyme- and Chemo-Catalytic Technology. Green Chem. 2016, 18, 4990–5002. [Google Scholar] [CrossRef]
- Gimbernat, A.; Guehl, M.; Capron, M.; Lopes-Ferreira, N.; Froidevaux, R.; Girardon, J.S.; Dhulster, P.; Delcroix, D.; Dumegnil, F. Hybrid Catalysis: A Suitable Concept for the Valorization of Biosourced Saccharides to Value-Added Chemicals. ChemCatChem 2017, 9, 2080–2888. [Google Scholar] [CrossRef]
- Bhosale, S.H.; Rao, M.B.; Deshpande, V.V. Molecular and Industrial Aspects of Glucose Isomerase. Microbiol. Rev. 1996, 60, 280–290. [Google Scholar] [PubMed]
- McKay, G.; Tavlarides, T. Enzymatic isomerization kinetics of d-Glucose to d-Fructose. J. Mol. Catal. 1979, 6, 57–65. [Google Scholar] [CrossRef]
- Morin, G.T.; Paugam, M.F.; Hughes, M.P.; Smith, B.D. Boronic Acids Mediate Glycoside Transport through a Liquid Organic Membrane via Reversible Formation of Trigonal Boronate Esters. J. Org. Chem. 1994, 59, 2724–2730. [Google Scholar] [CrossRef]
- Karpa, M.J.; Duggan, P.J.; Griffin, G.J.; Freudigmann, S.J. Competitive Transport of Reducing Sugars Through a Lipophilic Membrane Facilitated by Aryl Boron Acids. Tetrahedron 1997, 53, 3669–3676. [Google Scholar] [CrossRef]
- Westmark, P.R.; Gardiner, S.J.; Smith, B.D. Selective Monosaccharide Transport through Lipid Bilayers using Boronic Acid Carriers. J. Am. Chem. Soc. 1996, 118, 11093–11100. [Google Scholar] [CrossRef]
- Shinbo, T.; Nishimura, K.; Yamaguchi, T.; Sugiura, M. Uphill Transport of Monosaccharides across an Organic Liquid Membrane. J. Chem. Soc. Chem. Commun. 1986, 349–358. [Google Scholar] [CrossRef]
- Paugam, M.; Riggs, J.A.; Smith, B.D. High fructose syrup production using fructose-selective liquid membranes. ChemComm 1996, 22, 2539–2540. [Google Scholar] [CrossRef]


| Boronic Acid | pKa | Extraction Yield % | Extraction Rate μmol/min | ||
|---|---|---|---|---|---|
| 4-TBPBA | 9.3 | 8.3 | ± 5.6 | 0.52 | ± 0.08 |
| PBA | 9.1 | 32.4 | ± 0.3 | 1.27 | ± 0.39 |
| 2,4-DCPBA | 8.9 | 43.3 | ± 1.6 | 1.56 | ± 0.34 |
| 3,4-DCPBA | 7.4 | 46.5 | ± 4.9 | 1.48 | ± 0.23 |
| 2,3-DCPBA | 7.4 | 49,2 | ± 1.6 | 1.99 | ± 0.17 |
| 4-TFMPBA | 9.1 | 50.3 | ± 2.2 | 1.26 | ± 0.12 |
| 3,5-DCPBA | 7.4 | 55.3 | ± 0.9 | 1.94 | ± 0.20 |
| [3,4-DCPBA] | Extraction Rate | |
| (mM) | (μmol/min) | |
| 25 | 0.89 | ±0.15 |
| 50 | 1.37 | ±0.41 |
| 150 | 1.45 | ±0.05 |
| 100 | 1.22 | ±0.15 |
| 200 | 1.40 | ±0.21 |
| 300 | 1.33 | ±0.14 |
| [D-Fru] | [3,4-DCPBA] | [Aliquat336®] | Extraction Yield | |
|---|---|---|---|---|
| mM | mM | mM | % | |
| 100 | 100 | 200 | 43.3 | ± 4.22 |
| 200 | 200 | 400 | 32.6 | ± 1.22 |
| 300 | 300 | 600 | 27.3 | ± 4.6 |
| pH | Transport Yield | Extraction Rate | ||
|---|---|---|---|---|
| (%) | (μmol/min) | |||
| 5 | 100 | ± 4.2 | 1.58 | ± 0.14 |
| 3 | 91.5 | ± 6.3 | 1.53 | ± 0.13 |
| 1 | 54.5 | ± 3.7 | 1.84 | ± 0.09 |
| 8 | 22.7 | ± 5.2 | 0.63 | ± 0.14 |
| 1st step | 2nd step | 3rd step | |||||
|---|---|---|---|---|---|---|---|
| Isomerization | D-Fructose Extracted | D-Glucose Extracted | D-Fructose Released | Fructose Conversion | HMF Yield | HMF Total | |
| % | 74.5 | 56.5 | 1.56 | 57.4 | 52 | 21.9 | 5.3 |
| time | 3 h | 3 h | 35 h | 41 h | |||
| Isomerization | Fructose Extraction | HMF | Selectivity | |
|---|---|---|---|---|
| Yield (%) | 70.1 | 50.2 | 4.1 | 70.4 |
© 2018 by the authors. Licensee MDPI, Basel, Switzerland. This article is an open access article distributed under the terms and conditions of the Creative Commons Attribution (CC BY) license (http://creativecommons.org/licenses/by/4.0/).
Share and Cite
Gimbernat, A.; Guehl, M.; Lopes Ferreira, N.; Heuson, E.; Dhulster, P.; Capron, M.; Dumeignil, F.; Delcroix, D.; Girardon, J.-S.; Froidevaux, R. From a Sequential Chemo-Enzymatic Approach to a Continuous Process for HMF Production from Glucose. Catalysts 2018, 8, 335. https://doi.org/10.3390/catal8080335
Gimbernat A, Guehl M, Lopes Ferreira N, Heuson E, Dhulster P, Capron M, Dumeignil F, Delcroix D, Girardon J-S, Froidevaux R. From a Sequential Chemo-Enzymatic Approach to a Continuous Process for HMF Production from Glucose. Catalysts. 2018; 8(8):335. https://doi.org/10.3390/catal8080335
Chicago/Turabian StyleGimbernat, Alexandra, Marie Guehl, Nicolas Lopes Ferreira, Egon Heuson, Pascal Dhulster, Mickael Capron, Franck Dumeignil, Damien Delcroix, Jean-Sébastien Girardon, and Rénato Froidevaux. 2018. "From a Sequential Chemo-Enzymatic Approach to a Continuous Process for HMF Production from Glucose" Catalysts 8, no. 8: 335. https://doi.org/10.3390/catal8080335
APA StyleGimbernat, A., Guehl, M., Lopes Ferreira, N., Heuson, E., Dhulster, P., Capron, M., Dumeignil, F., Delcroix, D., Girardon, J.-S., & Froidevaux, R. (2018). From a Sequential Chemo-Enzymatic Approach to a Continuous Process for HMF Production from Glucose. Catalysts, 8(8), 335. https://doi.org/10.3390/catal8080335