Abstract
In this work, the performance of a pilot-scale solar CPC reactor was evaluated for the degradation of commercial acetaminophen, using TiO2 P25 as a catalyst. The statistical Taguchi’s method was used to estimate the combination of initial pH and catalyst load while tackling the variability of the solar radiation intensity under tropical weather conditions through the estimation of the signal-to-noise ratios (S/N) of the controllable variables. Moreover, a kinetic law that included the explicit dependence on the local volumetric rate of photon absorption (LVRPA) was used. The radiant field was estimated by joining the Six Flux Model (SFM) with a solar emission model based on clarity index (KC), whereas the mass balance was coupled to the hydrodynamic equations, corresponding to the turbulent regime. For scaling-up purposes, the ratio of the total area-to-total-pollutant volume (AT/VT) was varied for observing the effect of this parameter on the overall plant performance. The Taguchi’s experimental design results showed that the best combination of initial pH and catalyst load was 9 and 0.6 g L−1, respectively. Also, full-scale plants would require far fewer ratios of AT/VT than for pilot or intermediate-scale ones. This information may be beneficial for reducing assembling costs of photocatalytic reactors scaling-up.
1. Introduction
Water pollution is a serious threat that has captured the attention of governments and scientific communities worldwide. Chemicals such as pesticides, fertilizers, pharmaceuticals, steroids, disinfectants, preservatives, additives, personal care products, and heavy metals are frequently found in water and wastewaters, and because of this, they are commonly known as emerging contaminants, and some of them are considered persistent organic pollutants (POPs) [1]. Unfortunately, the most common water and wastewater treatment plants are unable to destroy these chemicals due to their recalcitrant nature and toxicity [2].
Among the various adverse effects emerging contaminants and particularly POPs pose to human life and the environment, it is the occurrence of many types of cancer, birth defects, and other developmental disorders due to endocrine disruptors, as well as various diseases such as high blood pressure, renal disorders, joint pain, and malfunctioning of the nervous system, which is strongly related to the intake of water polluted with POPs [3,4,5]. Acetaminophen was chosen as the model pollutant because it is a massively consumed drug worldwide. The excretion of this drug (in wastewater from hospitals and private households) and disposal of unused medicine have caused acetaminophen to appear in surface waterbodies. A concentration range between 4.6 and 52 μg L−1 has been reported in previous studies carried out in several countries of Europe and America [6]. Nonetheless, it is expected that higher concentrations can be found in hospitals wastewaters although there are no reports of these concentrations in literature. Furthermore, water contaminated with pharmaceuticals such as acetaminophen can cause hepatic damage in humans [7,8] and alter the equilibrium of aquatic ecosystems due to its toxicity [9,10]. As a result, there is a need to develop efficient technologies to remove emerging contaminants from industrial wastewater and water bodies.
Heterogeneous photocatalysis has proven to be an effective method for eliminating many emerging pollutants [11,12,13,14]. As an advanced oxidation process, heterogeneous photocatalysis uses sunlight as the promotor of the redox reactions responsible for removing the contaminants. The general mechanism of photocatalysis for degrading organic pollutants has been reported in several papers [15,16] and involves the generation of electron-hole pairs, which in the presence of electron acceptors such as atmospheric oxygen, leads to the formation of potent oxidant agents that can destroy and mineralize organic matter.
Although photocatalysis was discovered around three decades ago, the worldwide applications at full-scale are scarce or almost null. The estimation of the total footprint required for operating photocatalytic reactors, as the land occupation is a matter of study from the engineering point of view. To the best of the authors’ knowledge, no studies have been reported on the scaling of solar photocatalytic reactors that consider pilot, middle and full-scale schemes, regarding the total area required for its operation. Besides, most of the existing photocatalytic reactors have been designed following empirical methods rather than strict mathematical modeling. This approach can be attributed to the complexity of the modeling and simulation of simultaneous phenomena that take place during its operation, i.e., photonics, hydrodynamics, and kinetics.
Regarding the photon absorption by the catalyst, the estimation of the radiant field can be a challenging task when the catalytic particles are suspended in the reactor due to the scattering that takes place once the photons enter the reactor. This difficulty may be even higher when the solar radiation acts as the photon’s source, because of its variability and form of propagation (direct or diffuse). The most common approaches for estimating the radiant field are the Discrete Ordinates Method (DOM) [17,18], the Monte Carlo (MC) simulations [19,20,21], and the Six-Flux Model (SFM) [21]. The first two methods require far more computational effort than the SFM, which is based mainly on the assumption that when photons collide with catalytic particles, scattering occurs in the six directions of the Cartesian system. Despite the simplicity of the SFM, which is composed only of algebraic equations, several reports show satisfactory fitting to experimental data [21].
Concerning photocatalytic kinetics, the Steady-State Approximation (SSA) is usually applied for the total concentration of holes and hydroxyl radicals (OH•) according to the general mechanism of photocatalysis with TiO2 [22]. This strategy, which was first reported by Turchi and Ollis [15] and Alfano et al. [16], has led to the writing of several critical photo-kinetic laws, such as the modified Langmuir-Hinshelwood equation.
For estimating the effect of the radiation field in the kinetic law, many authors have put explicitly the radiation intensity or the local volumetric rate of photon absorption (LVRPA) in the kinetic equation [23,24], which can allow finding kinetic parameters independent on the reactors’ geometry. However, to date, there has not been reported a strategy for finding kinetic parameters that can be suitable for describing the photocatalytic treatment of pollutants independently of the natural variability and propagation form of the solar radiation.
In the present work, a strategy that combines simplicity and accuracy for modeling and simulating solar CPC photocatalytic reactors was used, using acetaminophen as a target molecule. A Langmuir-Hinshelwood-like equation derived from the SSA in the kinetic model was used, which has shown to be adequate for describing many experimental data in the photocatalytic abatement of organic pollutants. Additionally, we applied the Six Flux Model and a solar emission model based on the clarity index (KC) [25,26] for estimating the LVRPA and coupled it to the kinetic law in order to find kinetic parameters independent of the reactor’s geometry.
For solving the time-dependent mass balance, the whole system (reaction zone, recycle tank, and piping) was considered as a combination of a series of plug flow reactors (PFRs) and continuous stirred tanks under turbulent flow and resolved for the total organic carbon (TOC) concentration. Moreover, a Taguchi’s robust design was used for estimating the signal-to-noise ratio for each operating parameter value (catalyst load and initial pH). These values were determined for obtaining the highest mineralization of acetaminophen regardless of the variability of solar radiation. After finding these photocatalytic kinetic constants, the performance of solar photoreactors at different scales in terms of the theoretical footprint and the total area to total treating volume ratio (AT/VT) was analyzed.
2. Results
2.1. Signal-to-Noise Ratios of Initial pH and Catalyst Load
Table 1 shows the TOC removal obtained after varying the initial pH, catalyst load, and the solar accumulated energy. The highest (53.49%) and lowest (5.39%) TOC removals were obtained with a pH of 5, and the performance was favored by a higher catalyst load (0.6 g L−1). It was expected that acidic pHs enhanced the photocatalytic degradation for the case of the acetaminophen. Regarding the solar accumulated UV energy, the degradation increased with higher values because of a higher quantity of available photons. In this case, the increase of TOC removal concerning the cloudy days was higher than 50%. Whereas with a pH of 9, the variability of the TOC removals was smaller than the observed one with a pH of 5.

Table 1.
Total organic carbon (TOC) removal for the solar photocatalytic process.
Regarding the catalyst load, the best results were obtained with 0.6 g L−1 for initial pH of 5 and with 0.3 g L−1 for initial pH of 8. This result can suggest an interaction between the catalyst load and the initial pH of the slurries.
The initial pH affects the physicochemical properties of the catalyst, including the surface charge, the size of aggregates, and the position of the conductance and valence bands [27,28,29]. The reported point of zero charge (pHzpc) for the TiO2 Degussa is between 6 and 6.5 [29,30]. When the pH of the slurry is below the pHzpc, the surface of TiO2 acquires a positive charge and vice versa. Therefore, when the initial pH is 5, the stronger electrostatic forces can enhance the attachment of anionic species derived from the primary target molecule or its intermediates. This phenomenon favors the adsorption of these species and their latter oxidation [11,31,32].
However, Horst et al. [30] have shown that when the pH is very close to 6, the TiO2 particles aggregate with hydrodynamic diameters larger than those found in much more alkaline suspensions (i.e., pH = 9). Similarly, Vanegas et al. [33] have proven that when the pH is near to 5, the agglomeration of titania is stronger than in the case of suspensions having pH values around 8. The agglomeration of TiO2 particles reduces its useful area, which is believed to diminish the photocatalytic mineralization rates. As a result, due to the electrostatic forces and the agglomeration effects, the highest and lowest mineralization percentages of acetaminophen could have been obtained with the same value of initial pH (Table 1).
Regarding the catalyst load, when the initial pH was 5 and the TiO2 concentration was 0.3 g L−1, the availability of active sites might not have been enough for obtaining elevated TOC removal rates due to the agglomeration effect mentioned before. On the contrary, when the catalyst load was 0.6 g L−1, the higher amount of TiO2 particles could have overcome the limitation imposed by their agglomeration. In any case, when the initial pH is 5, the instability of the TiO2 suspension may diminish the effectiveness of the photocatalytic process because that value is very close to its pHzpc.
On the other hand, according to Table 1, high TOC removals could also be attained when the initial pH was set to 9. With this pH, the availability of OH¯ ions in solution enhances. As a result, we can expect that TOC removal rates rise because, according to the general mechanism of the TiO2-based photocatalysis [22], the holes of the valence band react with OH¯ ions to generate OH•.
Nevertheless, as mentioned before, when the solution pH is above the pHzpc, the catalyst surface charges negatively, and consequently the adsorption of OH¯ ions becomes more difficult. Probably, that is why the highest TOC removal was not obtained when working with this initial pH. In this case, the effect of catalyst load was opposite to that obtained with an initial pH of 5. The highest and lowest TOC removals were attained with 0.3 and 0.6 g L−1 of TiO2, respectively. One possible reason may be the clouding effect taking place in the slurry when the TiO2 concentration was 0.6 g L−1. This effect could have occurred when the pH was 9 due to the higher dispersion of catalytic particles [29,34] in the reactive media, which could block the photons’ path inside the reactor. Therefore, with an initial pH of 9 and catalyst load of 0.3 g L−1, the clouding effect could have been minimal, and higher TOC removals were obtained.
Table 2 shows the S/N ratios of the initial pH and catalyst load employed in these experiments. According to it, the performance of the photocatalytic system is more robust (a steadier response with high variability of the noise factor) when the initial pH is 9 (S/N = 31.33), and the TiO2 load is 0.6 g L−1 (S/N = 31.01). Concerning to the catalyst load, this result is different to the estimated by the SFM approach in a previous work that used a solar CPC reactor and P25 as the catalyst [34]. However, the SFM calculation of the cited report did not include the effect of the initial pH nor the adsorption phenomenon. As mentioned above, there could be an interaction between the initial pH and the catalyst load, and the optimal values can differ depending on the substrate and other operating conditions. The same discussion can be applied to the effect of the initial pH. It is important to note that the pH affects the surface charge of the solid (as mentioned previously) and the attack orientation of the OH• as well, which can influence the oxidation rate significantly [26].
Table 2.
Signal-to-noise ratios of the initial pH and catalyst concentration.
The most relevant result is the discrepancy with other studies with similar operating conditions (initial pH and catalyst load) but using a controlled or fixed amount of UV accumulated energy. Whereas in previous works [34,35,36], the reported values for catalyst loads were around 0.35 g L−1 (closer to the lower catalyst load used in this study), the recommended one in this study is 0.6 g L−1. In fact, from Table 1, the TOC removal at pH of 9 was higher with 0.3 g L−1, which is more consistent with the reported in the literature for this kind of reactor [35,37]. However, since the target of the Taguchi experimental design is finding suitable operating conditions for a robust operation (regardless to the variation of the solar radiation), the selection of 0.6 g L−1 is justified by a large number of active sites when the available UV photons are scarce (cloudy days) or particle agglomeration reduces the surface area due to the pH effect. Furthermore, the initial pH of 9 is far from the pHzpc of the P25, and therefore, the apparent particle size becomes more stable, which improves the photocatalytic process.
Additionally, as the effects of the photolysis and the physical adsorption in all experiments were negligible (0.93%–1.17% of TOC removal). Therefore, it can be stated that the TOC removal can be attributed mainly to the photocatalytic oxidation process.
2.2. TOC Removal Modeling
The TOC removal was modeled by coupling the hydrodynamics, photonics, kinetics and mass balance in the photocatalytic reactor. The L-H parameters were obtained by fitting the experimental data to the mathematical model. The reaction time was standardized according to the commonly used t30W expression, which is a normalization of the time that considers continuous irradiation of 30 W m−2 over the reactive zone [24,38,39].
The L-H parameters were estimated through linear regression of the reciprocal values of the initial rates and initial concentrations (initial rates law) according to the Equation (1). This equation is the reciprocal of the material balance expression associated with the batch-recirculating photocatalytic system. Figure 1 shows the fitted linear analysis for the initial reaction rates obtained with the three different TOC initial concentrations. This strategy allowed to find kinetic parameters independent of the radiation field, as described in Equations (2) and (3). In Equation (2), VRPA represents the integration of the LVRPA along the reactor volume, whereas the 1.2 × 10⁴ factor was used as a conversion factor from ppm to mol L−1.
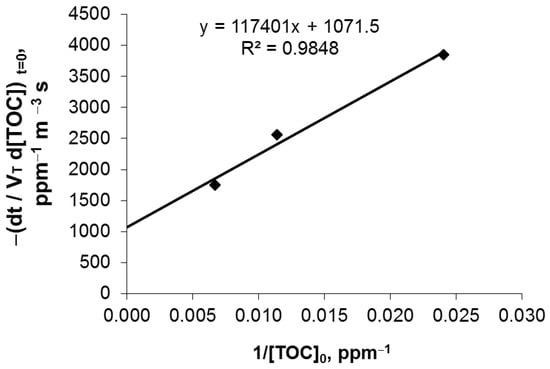
Figure 1.
Linear regression for estimation of the Langmuir-Hinshelwood kinetic parameters.
Although the kinetics parameters were obtained with data of the bulk of the liquid-phase, they are still valid to represent this model because the external mass-transfer limitations between the bulk and the catalyst surface are negligible due to the significant mass-transport in the turbulent regime. As a result, the TOC found in the surroundings of the catalyst surface can be assumed as the same found in the bulk of the solution. Besides, there are no internal mass-transfer limitations because the catalyst (TiO2 Degussa P25) is considered non-porous.
Furthermore, as it will be explained in Section 3.5, Equation (21) was integrated in order to obtain the TOC removal profile, as follows:
where L is the total length of the reactor and m was taken as 0.5, which is a value suitable for geographical zones closer to the Earth’s equator, where radiation intensities are high, and there is a good photon availability [22]. The boundary conditions to solve Equation (4) were
where TOCin represents the inlet TOC concentration of the reactor in a given time. This model was employed to predict the TOC abatement of the contaminant according to the three different initial concentrations. The results are presented in the Figure 2, which reveals a good fit of the model to the experimental data.
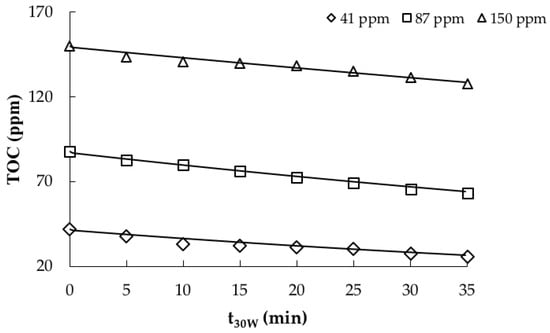
Figure 2.
TOC photocatalytic removal. Model (solid line) vs. experimental data (markers).
From the obtained results, the kinetic parameters can be considered valid for the range of TOC initial concentrations (40–150 ppm) and an initial pH of 9. Although they were estimated with a single value of catalyst load, the model can be evaluated with different catalyst doses because the SFM consider the optical thickness and the scattering albedo, which are functions of the catalyst load. Nonetheless, the simulations were carried out under constant radiation flux of 30 W m−2, which is considered as the average UV radiation flux received in a sunny day (10 a.m. to 2 p.m.) in northern latitudes. This value was selected considering previous works with solar radiation [24,34,39,40,41] and the difficulty of describing the solar radiation variability with the model used in this study.
2.3. Effect of Catalyst Load and Total Treated Volume on Plant Scaling-Up
The estimated kinetic parameters were used for simulating large-scale photocatalytic reactors in the TOC removal of acetaminophen. In order to compare the potential size of full-scale plants, the effect of the catalyst load and the total-pollutant volume on the mineralization concerning the AT/VT ratio was studied. Figure 3 shows the TOC removal profiles in a system with a total volume of 5000 L, with two different catalyst loads (0.3 and 0.6 g L−1).
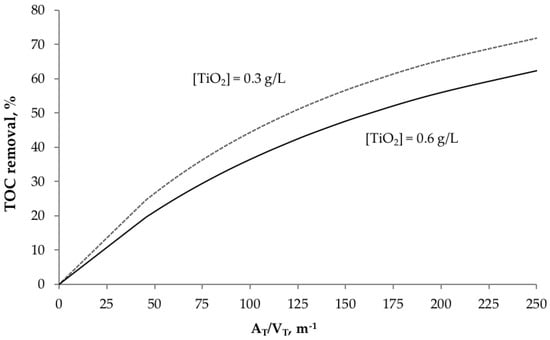
Figure 3.
Effect of catalyst load on TOC removal, regarding the AT/VT ratio. (VT = 5000 L, t30W = 110 min, TOC0 = 87.6 ppm).
The simulations were done under the same conditions described above (Equations (4), (5), and (8)–(11)) and the strategy is shown in Figure 4). The volume used of 5000 L represents the average-daily-wastewater volume generated in medium-sized Colombian hospitals or some industrial facilities.
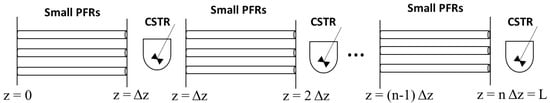
Figure 4.
Strategy for modeling the photocatalytic reactor as a series of plug flow reactors (PFRs) and continuous stirring tanks (CSTRs).
The time t30W was set at 110 min and the total area was estimated based on the footprint of a single CPC module (4.1 m2, as seen in Figure 5). This footprint includes the area that would be covered by the whole CPC structure and the space between each module in a large-scale plant (30 cm of spacing lengthwise and crosswise).
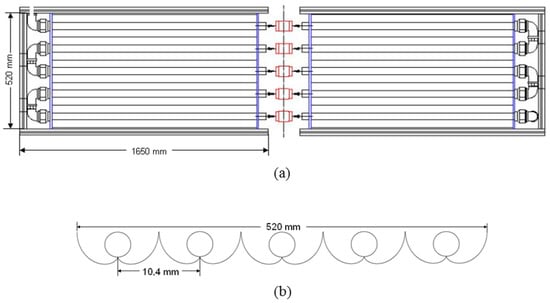
Figure 5.
CPC reactor. (a) General scheme; (b) Tubes and reflectors (cross-sectional view).
The plot shows that the photocatalytic performance is better when using 0.3 g L−1 of the catalyst. This result was expected because the same photon-absorption model reported in ref. [34] was applied. As stated before, the optimal catalyst load in CPC reactors (regarding the LVRPA) was 0.3 g L−1. As mentioned before, with an initial pH of 9 and 0.3 g L−1 of catalyst load, the best performance for TOC removal was obtained experimentally. Consequently, the simulations shown in Figure 3 are congruent with the experimental data. This optimal value for catalyst load is consistent with the results obtained in previous works, where solar CPCs of similar diameters were used under sunny weather conditions [35,37,39].
The observed behavior in both plots (0.3 and 0.6 g L−1 in Figure 3) is similar for small ratios of AT/VT. However, better performances are shown for 0.3 g L−1 when the AT/VT ratio increases. For example, if a TOC removal of 50% is needed, a full-scale operation with 0.6 g L−1 of TiO2 would require an AT/VT ratio of 175 m−1; but if it operates with 0.3 g L−1 of TiO2, the ratio would be 120 m−1. The difference becomes more significant at higher TOC removals. This tendency can be explained due to the relative low mineralization rates that are usually obtained in photocatalytic processes. At small AT/VT ratios, there is no a significant difference of TOC removal performance when they are low. When the AT/VT ratio increases, the residence time increases as well. Therefore, the conversion of the organic matter (via photocatalytic oxidation) is higher. Nevertheless, the mixing effect with the recycling-feeding tank (VT) acts as a damping stage of the TOC removal process. Therefore, the overall degradation rate can become slower depending on the AT/VT.
From the above observation, the effect of the total treated volume (VT) on the mineralization was evaluated as well. The photocatalytic abatement of acetaminophen with three different-contaminant volumes: 50, 500 and 5000 L (Figure 6) was simulated, which represent respectively the number of effluents that can be treated in the pilot, intermediate, and full-scale plants.
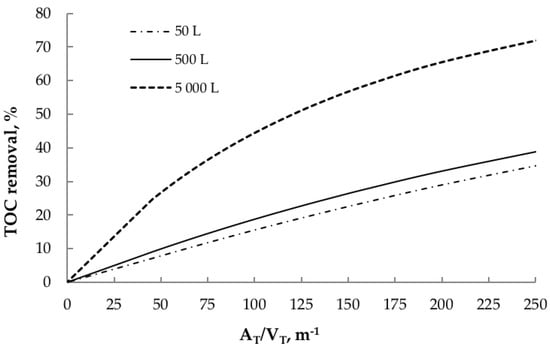
Figure 6.
Effect of total volume on TOC removal, regarding the AT/VT ratio ([TiO2] = 0.3 g L−1, t30W = 110 min, TOC0 = 87.6 ppm).
Figure 6 shows that the TOC removals for the 5000 L curve are much higher than the ones corresponding to the 50 and 500 L curves, whose behavior is very similar. These results show that the area (or CPC modules) needed for obtaining a specific TOC removal is not directly proportional to the total volume. For example, if a TOC removal of 30% is required when treating a 500 L effluent (containing acetaminophen), then the most appropriate AT/VT ratio would be 200 m−1. In contrast, if the volume of the effluent is 5000 L, then this ratio is reduced to a third part approximately (60 m−1). The difference becomes substantially higher as the required TOC removal increases. As a result, this information may be tremendously useful when scaling photocatalytic processes, as it could avoid unnecessarily monetary investment for the construction and operation of the reactors.
In all the simulations, the flow rate was held constant at 30 L min−1, which was the same used in the experimental runs carried out in the pilot-scale photoreactor. This supposition can be made because the CPC photoreactors are modular units that can be arranged in series. Therefore, a more extensive scale plant would only require a higher number of CPC reactors with the same size and operating conditions than the CPC used in the experimental pilot-scale plant. Nonetheless, larger volumes with the same flow rate yield higher residence times, which can improve the TOC removal as seen in Figure 6. Then, in order to scale-up and design full-scale plants with solar CPC photoreactors, it is not enough to estimate an ideal AT/VT ratio for attaining a given TOC removal. It requires a more in-depth analysis that can be done with the model presented here.
At large-scale, the effect of the initial concentration of acetaminophen was insignificant. Several simulations conducted with [TiO2] = 0.6 g L−1, VT = 5000 L at 41.6 ppm, 87.6 ppm, and 149.8 ppm showed almost null differences in TOC removal (results not presented here).
3. Materials and Methods
3.1. Reagents and Chemicals
A stock solution of the contaminant was prepared with commercial liquid acetaminophen (Genfar®-Sanofi, Bogota, Colombia). TiO2 Aeroxide P-25 (Evonik, Essen, Germany) was employed as the photocatalyst in all the experiments (primary particle size, ~21 nm by TEM; specific surface area 50 m2 g−1 by BET; composition 80% anatase and 20% rutile by X-ray diffraction). The initial pH was adjusted with solutions of NaOH 0.1 N and HCl 0.1 N (Merck, Darmstadt, Germany).
3.2. Equipment
The experimental runs were carried out in the Solar Photocatalysis Laboratory at Universidad del Valle (Cali, Colombia—3°29′N latitude). Figure 5 exhibits a schematic representation of the CPC photoreactor used in this study. It consisted of 10 Duran glass tubes (1200 mm in length, 32 mm o.d., 1.4 mm wall thickness) that were placed upon a series of involutes made of aluminum (reflectance: ), as seen in Figure 5b. The reactor was operated under a batch regime with recirculation, using a 40 L recycle feed tank and a centrifugal pump (0.5 HP of nominal power) that delivered 30.2 L min−1. This experimental setup made it possible to keep the slurry (fluid and catalyst) saturated with oxygen, because whenever the slurry left the pipe, it was exposed to the surrounding air before entering the tank. The whole piping and accessories were made of PVC, 1 in. diameter.
The TOC concentration was followed with a TOC analyzer (Shimadzu 5050A, Sao Paulo, Brazil); whereas, the pH was measured with an Orion 4-Star pH-meter (Thermo Scientific-ARC Analisis, Bogota, Colombia). Additionally, the solar UV intensity and the corresponding accumulated energy in the 295-380 nm range were measured with a UV A+B radiometer (Solardetox-Acadus S50, Barcelona, Spain).
3.3. Experimental Design
Due to the weather variability (sunny or cloudy days in tropical regions), the photocatalytic mineralization of acetaminophen was evaluated with the Taguchi´s experimental design [42,43]. This is a robust design that allows finding the most appropriate operational conditions that are insensitive to the noise (non-controllable factors), through the estimation of the signal-to-noise ratios (S/N) of the controllable variables. In this study, the initial pH and catalyst load were chosen as the controllable factors because they have been reported as two of the most influencing variables in the performance heterogeneous photocatalytic reactions [27,37,44]. Similarly, the accumulated solar UV energy is another important parameter, but it cannot be controlled since it depends on the geographical location, weather conditions and time of the day. As a result, the accumulated solar UV energy was considered as the noise factor. The corresponding signal-to-noise ratios (S/N) of each controllable variable were estimated with the "more is better" equation from the Taguchi’s robust experimental design (Equation (6)) because our purpose was to maximize the mineralization of acetaminophen.
Regarding Equation (6), S/N stands for the signal-to-noise ratio of each level of the experimental factors while Yi and n represent the percentage of mineralization and the number of experiments associated with each level. The TOC removal was calculated with the Equation (7).
where TOCi and TOCo represent the TOC at the beginning and the end of each experimental run, respectively.
3.4. Procedure
The initial TOC concentration of acetaminophen was set to 40 ppm to simulate the strength of the wastewater generated in the washing containers and glass equipment from the Drugs Laboratory at the Universidad de Cartagena, Colombia. The initial pH was set to 5 and 9 for avoiding extreme conditions of acidity or alkalinity, which would require further amounts of reagents for neutralization.
The catalyst loads were 0.3 and 0.6 g L−1, which are within the range reported in the literature [45,46]. In the first stage of the experimental runs, the samples from the reactor were taken at the beginning of the process and after the amount of UV energy reached 19.14 and 38.28 W h m−2. These values represent the average quantity of accumulated solar-UV energy received in Cali during a 3-h period in cloudy and sunny days, respectively. Subsequently, the samples were taken and filtered using 0.45 μm membranes (Merck Millipore®, Cartagena, Colombia) for measuring the removal of TOC. Afterward, three different initial concentrations (40, 90 and 150 ppm of TOC) were considered for finding the kinetic parameters of the photocatalytic process. In this case, the initial pH and catalyst dosage were set to the values that exhibited the highest S/N ratio described in Section 3.3, and the reactor was operated until it reached 35 W h m−2 of solar UV accumulated energy. Here, the samples were also taken at the beginning and the end of the experiments, and each 5 W h m−2 of accumulated UV energy.
These runs were conducted under sunny weather conditions, and the flow rate was held at 30.2 L min−1 to ensure turbulent flow (Reynolds number = 19,420). In all cases, in order to achieve adsorption equilibrium, the slurry was recirculated for 20 min under dark conditions.
3.5. Modeling of the Solar CPC Photoreactor
The modeling approach consisted of coupling hydrodynamics with a photocatalytic kinetic model (including the LVRPA) in a time-dependent mass balance, as previously described in ref. [23].
The hydrodynamics was described by the following equations [24,47]:
in which r is the radial coordinate, n is a hydrodynamic parameter, and is the friction factor. Further, the local volumetric rate of photon absorption (LVRPA) was estimated with the Equation (12) [21,24,34], which is derived from the SFM and adapted for a cylindrical configuration. The central assumption of this model is that the scattering phenomena takes place along the six Cartesians coordinates, which reduces the complexity of solving the photonic balance within the photocatalytic reactor. According to the SFM, the LVRPA is
where I0 corresponds to the solar UV radiation flux that hits the reactor wall (either direct or diffuse radiation); whereas rp is a parameter considered in the SFM which is associated to the photon’s traveling path [21,24], and γ, ωcorr, λωcorr are defined as follows:
The simulation of the radiant field and the calculation of the LVRPA were done in a Visual Basic routine that coupled the Ray Tracing technique with the SFM and a radiant emission model. This was previously reported in refs. [24,34,40]. As the LVRPA appears as the photonic contribution in the kinetic law, it is feasible to find kinetic parameters independent of the radiation field.
The mass balance was solved in terms of the TOC and was coupled to a hydrodynamic model for turbulent regime [24,47]. Moreover, the kinetics contribution was described with a Langmuir-Hinshelwood (L-H) equation that had an explicit dependence on the LVRPA, as shown on the right-hand side of Equation (21).
The entire reactor was divided into a large number (2500) of plug flow reactors (PFR) of length L, each one of them associated to the (r,θ) coordinates of the cross-sectional area. A higher number of PFRs would represent a significant increase in the computing time (as observed in previous simulations not shown in this study), without a visible improvement in the accuracy of the model. In that case, the mass balance can be described by the following equation:
where kt and K1 represent the kinetic and binding constants, respectively. In each PFR, the flow rate Q was equivalent to the product of the cross-section area and the average axial velocity (AR vz). Besides, dVR in Equation (16) could be replaced by AR dz, so that we obtained a differential equation in function just of the axial direction z. Thereby, it was only necessary to estimate the average axial velocities profile in terms of the radial coordinate (r). Although the first option for modeling this kind of photoreactor is to consider it as a PFR, this is not entirely accurate due to the turbulent regime of the system. The mixing of the streamlines does not allow to find a well-defined velocity profile; therefore, since the concentration depends on the velocity due to the convective effects, the turbulent regime must be considered for the mass balance of the reactor. The CSTR provides a simple way for modeling this part of the mass transfer phenomenon with more accuracy than the PFR alone.
Considering the above assumption, each PFR was divided into a series of small reactors with a length of Δz. In every simulation step, Equation (21) was solved for each small reactor, starting from the plane z = 0 down to z = Δz. Then, in order to consider the mixing effect of the turbulent regime, the TOC profile was averaged in the z = Δz plane. This averaging step, as shown in Equation (17), was intended for assuming that a continuous stirring tank (CSTR) was in that position.
Afterward, this average was taken as the inlet concentration for the next PFR reactor located from z = Δz to z = 2Δz, being Δz = L/100. Subsequently, Equation (21) was solved for each reactor found in the (z = Δz, z = 2Δz) interval, and a new CSTR was virtually placed in z = 2Δz. Finally, these steps were repeated successively until the total length of the reactor was covered (z = L). This modeling approach is described graphically in the Figure 4, in which n corresponds to the number of divisions of the total length (L).
The time dependence of the photocatalytic process was treated as a step dependence, which is associated with the number of passes () that the slurry has in the reactor. This strategy has been used several times for modeling photocatalytic recirculation systems [24,37,48].
The change in TOC concentration per each pass was estimated as follows:
4. Conclusions
The Taguchi experimental design was applied for analyzing the TOC removal of commercial acetaminophen in a solar CPC photocatalytic reactor. It showed that the most favorable conditions for a robust operation were an initial pH of 9 and a catalyst load of 0.6 g L−1. Although the results differ from the reported studies with similar conditions, the variation of the solar radiation and the interaction of the pH with the catalyst load are the reasons for this discrepancy. On the other hand, the kinetic parameters obtained through the mathematical model proposed in this work (kT = 7.5874 × 10⁻⁸ mol L−1 s−1 W−0.5 m1.5 and K1 = 109.52 L mol−1) can be used for scaling purposes since the model had a specific contribution of the photonic absorption. Furthermore, that large-scale plants require smaller ratios of AT/VT when compared with intermediate and pilot-scale schemes. This result is reasonable because the higher the scale, the higher residence times, and therefore, the conversion is enhanced. Therefore, in order to save monetary resources, a careful analysis based on these results should be made before deciding to scale photocatalytic reactors.
Author Contributions
Déyler Castilla-Caballero and José Colina-Márquez analyzed the data and run the simulations of the kinetic model; Fiderman Machuca-Martínez supplied the reactants and the equipment for the experimental runs; and Ciro Bustillo-Lecompte collaborated with the paper writing and editing.
Acknowledgments
The authors acknowledge Chemical engineers Juan Cohen, Leonardo Narváez, Rodinson Arrieta, and María Guerra for carrying out the experimental tests and simulations. Writing assistance provided by Helen Burnham from the British Council is much appreciated. The authors also thank Colciencias for funding this research (Grant No. 110752128546) and their Ph.D. studies.
Conflicts of Interest
The authors declare no conflict of interest.
References
- Margot, J.; Rossi, L.; Barry, D.A.; Holliger, C. A review of the fate of micropollutants in wastewater treatment plants. Wiley Interdiscip. Rev. Water 2015, 2, 457–487. [Google Scholar] [CrossRef]
- Boethling, R.; Fenner, K.; Howard, P.; Klečka, G.; Madsen, T.; Snape, J.R.; Whelan, M.J. Environmental persistence of organic pollutants: Guidance for development and review of POP risk profiles. Integr. Environ. Assess. Manag. 2009, 5, 539–556. [Google Scholar] [CrossRef] [PubMed]
- Liu, G.; Yang, Z.; Tang, Y.; Ulgiati, S. Spatial correlation model of economy-energy-pollution interactions: The role of river water as a link between production sites and urban areas. Renew. Sustain. Energy Rev. 2017, 69, 1018–1028. [Google Scholar] [CrossRef]
- Sayal, A.; Amjad, S.; Bilal, M.; Pervez, A.; Mahmood, Q.; Afridi, M. Industrial Water Contamination and Health Impacts: An Economic Perspective. Pol. J. Environ. Stud. 2016, 25, 765–775. [Google Scholar] [CrossRef]
- Ros, O.; Izaguirre, J.K.; Olivares, M.; Bizarro, C.; Ortiz-Zarragoitia, M.; Cajaraville, M.P.; Etxebarria, N.; Prieto, A.; Vallejo, A. Determination of endocrine disrupting compounds and their metabolites in fish bile. Sci. Total Environ. 2015, 536, 261–267. [Google Scholar] [CrossRef] [PubMed]
- Heberer, T. Occurrence, fate, and removal of pharmaceutical residues in the aquatic environment: A review of recent research data. Toxicol. Lett. 2002, 131, 5–17. [Google Scholar] [CrossRef]
- Rodrigues, R.M.; Sachinidis, A.; de Boe, V.; Rogiers, V.; Vanhaecke, T.; de Kock, J. Identification of potential biomarkers of hepatitis B-induced acute liver failure using hepatic cells derived from human skin precursors. Toxicol. In Vitro 2015, 29, 1231–1239. [Google Scholar] [CrossRef] [PubMed]
- Wang, Y.; Jiang, Y.; Fan, X.; Tan, H.; Zeng, H.; Wang, Y.; Chen, P.; Huang, M.; Bi, H. Hepato-protective effect of resveratrol against acetaminophen-induced liver injury is associated with inhibition of CYP-mediated bioactivation and regulation of SIRT1-p53 signaling pathways. Toxicol. Lett. 2015, 236, 82–89. [Google Scholar] [CrossRef] [PubMed]
- SanJuan-Reyes, N.; Gómez-Oliván, L.M.; Galar-Martínez, M.; García-Medina, S.; Islas-Flores, H.; González-González, E.D.; Cardoso-Vera, J.D.; Jiménez-Vargas, J.M. NSAID-manufacturing plant effluent induces geno- and cytotoxicity in common carp (Cyprinus carpio). Sci. Total Environ. 2015, 530–531, 1–10. [Google Scholar] [CrossRef] [PubMed]
- Ribas, J.L.C.; da Silva, C.A.; de Andrade, L.; Galvan, G.L.; Cestari, M.M.; Trindade, E.S.; Zampronio, A.R.; de Assis, H.C.S. Effects of anti-inflammatory drugs in primary kidney cell culture of a freshwater fish. Fish Shellfish Immunol. 2014, 40, 296–303. [Google Scholar] [CrossRef] [PubMed]
- Grčić, I.; Puma, G.L. Photocatalytic degradation of water contaminants in multiple photoreactors and evaluation of reaction kinetic constants independent of photon absorption, irradiance, reactor geometry, and hydrodynamics. Environ. Sci. Technol. 2013, 47, 13702–13711. [Google Scholar] [CrossRef] [PubMed]
- Belver, C.; Bedia, J.; Rodriguez, J.J. Zr-doped TiO2 supported on delaminated clay materials for solar photocatalytic treatment of emerging pollutants. J. Hazard. Mater. 2017, 322, 233–242. [Google Scholar] [CrossRef] [PubMed]
- Fagan, R.; McCormack, D.E.; Dionysiou, D.D.; Pillai, S.C. A review of solar and visible light active TiO2 photocatalysis for treating bacteria, cyanotoxins and contaminants of emerging concern. Mater. Sci. Semicond. Process. 2016, 42, 2–14. [Google Scholar] [CrossRef]
- Miranda-García, N.; Suárez, S.; Maldonado, M.I.; Malato, S.; Sánchez, B. Regeneration approaches for TiO2 immobilized photocatalyst used in the elimination of emerging contaminants in water. Catal. Today 2014, 230, 27–34. [Google Scholar] [CrossRef]
- Turchi, C.; Ollis, D. Photocatalytic degradation of organic water contaminants: Mechanisms involving hydroxyl radical attack. J. Catal. 1990, 122, 178–192. [Google Scholar] [CrossRef]
- Alfano, O.M.; Cabrera, I.; Cassano, A.E. Photocatalytic Reactions Involving Hydroxyl Radical Attack I Reaction Kinetics Formulation with Explicit Photon Absorption Effects. J. Catal. 1997, 172, 370–379. [Google Scholar] [CrossRef]
- Romero, R.L.; Alfano, A.O.M.; Cassano, A.E. Cylindrical Photocatalytic Reactors. Radiation Absorption and Scattering Effects Produced by Suspended Fine Particles in an Annular Space. Ind. Chem. Eng. Res. 1997, 36, 3094–3109. [Google Scholar] [CrossRef]
- Satuf, M.L.; Brandi, R.J.; Cassano, A.E.; Alfano, O.M. Modeling of a flat plate, slurry reactor for the photocatalytic degradation of 4-chlorophenol. Int. J. Chem. React. Eng. 2007, 5. [Google Scholar] [CrossRef]
- Pasquali, M.; Santarelli, F.; Porter, J.F.; Yue, P.-L. Radiative transfer in photocatalytic systems. AIChE J. 1996, 42, 532–537. [Google Scholar] [CrossRef]
- Spadoni, G.; Bandini, E.; Santarelli, F. Scattering effects in photosensitized reactions. Chem. Eng. Sci. 1978, 33, 517–524. [Google Scholar] [CrossRef]
- Brucato, A.; Grisafi, C.; Montante, G.; Rizzuti, G.; Vella, G. Estimating radiant fields in flat heterogeneous photoreactors by the six-flux model. AIChE J. 2006, 52, 3882–3890. [Google Scholar] [CrossRef]
- Mills, A.; O’Rourke, C.; Moore, K. Powder semiconductor photocatalysis in aqueous solution: An overview of kinetics-based reaction mechanisms. J. Photochem. Photobiol. A Chem. 2015, 310, 66–105. [Google Scholar] [CrossRef]
- Boyjoo, Y.; Ang, M.; Pareek, V. Some aspects of photocatalytic reactor modeling using computational fluid dynamics. Chem. Eng. Sci. 2013, 101, 764–784. [Google Scholar] [CrossRef]
- Colina-Márquez, J.; Machuca-Martínez, F.; Puma, G.L. Photocatalytic mineralization of commercial herbicides in a pilot-scale solar CPC reactor: Photoreactor modeling and reaction kinetics constants independent of radiation field. Environ. Sci. Technol. 2009, 43, 8953–8960. [Google Scholar] [CrossRef] [PubMed]
- Khorasanizadeh, H.; Mohammadi, K. Diffuse solar radiation on a horizontal surface: Reviewing and categorizing the empirical models. Renew. Sustain. Energy Rev. 2016, 53, 338–362. [Google Scholar] [CrossRef]
- Colina-Márquez, J.; Machuca-Martínez, F.; Puma, G. Modeling the Photocatalytic Mineralization in Water of Commercial Formulation of Estrogens 17-β Estradiol (E2) and Nomegestrol Acetate in Contraceptive Pills in a Solar Powered Compound Parabolic Collector. Molecules 2015, 20, 13354–13373. [Google Scholar] [CrossRef] [PubMed]
- Basha, S.; Keane, D.; Nolan, K.; Oelgemöller, M.; Lawler, J.; Tobin, J.M.; Morrissey, A. UV-induced photocatalytic degradation of aqueous acetaminophen: The role of adsorption and reaction kinetics. Environ. Sci. Pollut. Res. 2014, 22, 2219–2230. [Google Scholar] [CrossRef] [PubMed]
- Ramirez-Garcia, S.; Chen, L.; Morris, M.A.; Dawson, K.A. A new methodology for studying nanoparticle interactions in biological systems: Dispersing Titania in biocompatible media using chemical stabilisers. Nanoscale 2011, 3, 4617–4624. [Google Scholar] [CrossRef] [PubMed]
- Palma-Goyes, R.E.; Silva-Agredo, J.; González, I.; Torres-Palma, R.A. Comparative degradation of indigo carmine by electrochemical oxidation and advanced oxidation processes. Electrochim. Acta 2014, 140, 427–433. [Google Scholar] [CrossRef]
- Horst, A.M.; Ji, Z.; Holden, P.A. Nanoparticle dispersion in environmentally relevant culture media: A TiO2 case study and considerations for a general approach. J. Nanopart. Res. 2012, 14, 1014. [Google Scholar] [CrossRef]
- Segalin, J.; Sirtori, C.; Jank, L.; Lima, M.F.S.; Livotto, P.R.; Machado, T.C.; Lansarin, M.A.; Pizzolato, T.M. Identification of transformation products of rosuvastatin in water during ZnO photocatalytic degradation through the use of associated LC-QTOF-MS to computational chemistry. J. Hazard. Mater. 2015, 299, 78–85. [Google Scholar] [CrossRef] [PubMed]
- Długosz, M.; Żmudzki, P.; Kwiecień, A.; Szczubiałka, K.; Krzek, J.; Nowakowska, M. Photocatalytic degradation of sulfamethoxazole in aqueous solution using a floating TiO2-expanded perlite photocatalyst. J. Hazard. Mater. 2015, 298, 146–153. [Google Scholar] [CrossRef] [PubMed]
- Vanegas, M.E.; Vázquez, V.; Moscoso, D.; Cruzat, C. Síntesis y caracterización de nanopartículas magnéticas del tipo Fe3O4/TiO2, efecto del pH en la dispersión y estabilización en soluciones acuosas. Maskana 2014, 5, 43–55. [Google Scholar]
- Colina-Márquez, J.; Díaz, D.; Rendón, A.; López-Vásquez, A.; Machuca-Martínez, F. Photocatalytic treatment of a dye polluted industrial effluent with a solar pilot-scale CPC reactor. J. Adv. Oxid. Technol. 2009, 12, 93–99. [Google Scholar] [CrossRef]
- Colina-Márquez, J.; Machuca-Martínez, F.; Li Puma, G. Radiation absorption and optimization of solar photocatalytic reactors for environmental applications. Environ. Sci. Technol. 2010, 44, 5112–5120. [Google Scholar] [CrossRef] [PubMed]
- López-Vásquez, A.; Ortiz, E.; Arias, F.; Colina-Márquez, J.A.; Machuca, F. Photocatalytic decolorization of methylene blue with two photoreactors. J. Adv. Oxid. Technol. 2008, 11, 33–48. [Google Scholar] [CrossRef]
- Mueses, M.A.; Machuca-Martinez, F.; Li Puma, G. Effective quantum yield and reaction rate model for evaluation of photocatalytic degradation of water contaminants in heterogeneous pilot-scale solar photoreactors. Chem. Eng. J. 2013, 215–216, 937–947. [Google Scholar] [CrossRef]
- Fenoll, J.; Flores, P.; Martínez, C.; Navarro, S. Photodegradation of eight miscellaneous pesticides in drinking water after treatment with semiconductor materials under sunlight at pilot plant scale. Chem. Eng. J. 2012, 1, 2204–2206. [Google Scholar] [CrossRef]
- Prieto-Rodriguez, L.; Miralles-Cuevas, S.; Oller, I.; Agüera, A.; Puma, G.L.; Malato, S. Treatment of emerging contaminants in wastewater treatment plants (WWTP) effluents by solar photocatalysis using low TiO2 concentrations. J. Hazard. Mater. 2012, 211–212, 131–137. [Google Scholar] [CrossRef] [PubMed]
- Colina-Márquez, J.; Lopez-Vasquez, A.; Machuca-Martínez, F. Modeling of direct solar radiation in a compound parabolic collector (CPC) with the ray tracing technique. Dyna-Colombia 2010, 77, 132–140. [Google Scholar]
- Nasirian, M.; Lin, Y.P.; Bustillo-Lecompte, C.F.; Mehrvar, M. Enhancement of photocatalytic activity of titanium dioxide using non-metal doping methods under visible light: A review. Int. J. Environ. Sci. Technol. 2017, 1–24. [Google Scholar] [CrossRef]
- Twu, M.J.; Chiou, A.H.; Hu, C.C.; Hsu, C.Y.; Kuo, C.G. Properties of TiO2 films deposited on flexible substrates using direct current magnetron sputtering and using high power impulse magnetron sputtering. Polym. Degrad. Stab. 2015, 117, 1–7. [Google Scholar] [CrossRef]
- Nikazar, M.; Gorji, L.M.; Shojae, S.; Keynejad, K.; Haghighaty, A.H.; Jalili, F.; Mirzahosseini, A.R.H. Removal of Methyl Tertiary-Butyl Ether (MTBE) from Aqueous Solution Using Sunlight and Nano TiO2. Energy Sources Part A Recover. Util. Environ. Eff. 2014, 36, 2305–2311. [Google Scholar] [CrossRef]
- Ghodbane, H.; Hamdaoui, O.; Vandamme, J.; van Durme, J.; Vanraes, P.; Leys, C.; Nikiforov, A.Y. Degradation of AB25 dye in liquid medium by atmospheric pressure non-thermal plasma and plasma combination with photocatalyst TiO2. Open Chem. 2015, 13, 325–331. [Google Scholar] [CrossRef]
- Borges, M.; García, D.; Hernández, T.; Ruiz-Morales, J.; Esparza, P. Supported Photocatalyst for Removal of Emerging Contaminants from Wastewater in a Continuous Packed-Bed Photoreactor Configuration. Catalysts 2015, 5, 77–87. [Google Scholar] [CrossRef]
- Escapa, C.; Coimbra, R.N.; Paniagua, S.; García, A.I.; Otero, M. Nutrients and pharmaceuticals removal from wastewater by culture and harvesting of Chlorella sorokiniana. Bioresour. Technol. 2015, 185, 276–284. [Google Scholar] [CrossRef] [PubMed]
- Bird, R.B.; Stewart, W.E.; Lightfoot, E.N. Transport Phenomena; Wiley: Hoboken, NJ, USA, 2007. [Google Scholar]
- Puma, G.L.; Khor, J.; Brucato, A. Modeling of an annular photocatalytic reactor for water purification: Oxidation of pesticides. Environ. Sci. Technol. 2004, 38, 3737–3745. [Google Scholar] [CrossRef] [PubMed]
© 2018 by the authors. Licensee MDPI, Basel, Switzerland. This article is an open access article distributed under the terms and conditions of the Creative Commons Attribution (CC BY) license (http://creativecommons.org/licenses/by/4.0/).