Abstract
Carbon-modified titania (C–TiO2) films were easily prepared by using an impregnation process with a glucose-containing TiO2 sol. Through controlling calcination conditions, the as-obtained C–TiO2 products exhibited highly photocatalytic activity for the degradation of gaseous NOx under visible light and ultraviolet illumination. The effects of carbon content and calcination temperature on the photocatalytic performances and their photochemical and physical properties were investigated. Carbonaceous species on the TiO2 surface enhanced the visible-light absorption of TiO2 films; however, an excessive amount of carbon on the TiO2 surface reduced its photocatalytic ability due to the serious coverage effect on active sites. The results show that a suitable glucose addition is about 50–100% of the weight of TiO2 content and the optimized calcination temperature is 300 °C, which leads to better photocatalytic activity under ultraviolet and visible- light irradiations. Accordingly, the simple-prepared C–TiO2 films functioned as visible-light-responsive catalysts, allowing for a feasible producing route for real applications.
1. Introduction
Photocatalytic ultraviolet-light-responsive titanium dioxide (TiO2) substrates can effectively degrade organic/inorganic compounds or work as disinfectants. Upon excitation by UV light, the photon energy creates pairs of electrons and holes that diffuse and become trapped on or near the TiO2 surface. The electrons and holes generated by these reactions have a strong reducing and oxidizing effect and subsequently react with atmospheric water and oxygen to yield active oxygen species, such as hydroxyl radicals (·OH) and superoxide anions (O2−). Both holes and active oxygen species are extremely reactive when contacting compounds. One of functional applications developed by such reducing and oxidizing agents is photodegradation, an effective method to decompose pollutants. Among all photocatalysts, titania has many competitive advantages, including high stability, low toxicity, favorable efficiency, and low price. Thus, titania is one of the most popular photocatalyst materials for water-purifying, deodorization, antifogging, sterilization, and solar energy generation [1,2,3]. For convenient manufacturing, powder-type titania is commonly provided in industry. However, the additional filming processes and dust issue obstruct the development of photocatalytic devices composed of TiO2 powders. In order to expand its practicality in catalytic functions, TiO2 immobilization technology attracts much attention, promoting the development of titania thin film for self-cleaning and antifogging due to its superhydrophilic properties [4].
Although TiO2 has widely been used, its high energy gap still limits its applications under visible light. Another limitation is the immobilization of the catalyst. Much of the literature focuses on the modification/preparation of powder photocatalysts, but the photocatalyst should be loaded on a substrate for practical application. Improper coating procedures, such as adding a great amount of binder, will decrease photocatalytic activity sharply [5,6]. Hence, the number of studies on how to immobilize catalysts on glass substrates and extend the photocatalytic activity of TiO2 beyond ultraviolet light has extensively risen in recent years. Carbon-modified TiO2 photocatalysts not only show improvement in photocatalytic activity, but also influence TiO2’s natural properties, including crystallinity, specific surface area, characteristic temperatures, and the recombination rate of e−/h+ pairs [7,8,9,10,11,12,13,14,15,16,17,18,19,20]. Sampaio et al. tried to mix sol–gel TiO2 powders with carbon nanotubes (CNTs) by using hydration–dehydration technology [7]. After coated onto a glass slide and baked at 450 °C for 1 h, the photocatalytic results of CNTs/TiO2 presented an enhancement of 10% on degrading methylene blue. CNT is not only a photosensitizer in this system but also serves as a dispersant and adsorbent for reducing the energy gap of the TiO2 mixture. Moreover, J. Yang synthesized TiO2 a precursor from tetrabutoxytitanium gel and then utilized the SIP-coating process to deposit photocatalytic gel on glass [9]. In that study, acetyl acetone was added to provide a carbon source and inhibited the hydrolysis of titanium alkoxide, resulting in high-crystallinity TiO2 products. According to the photocatalytic measurements, a higher degradation efficiency for methyl orange meant that Ti–O–N–C bonding significantly reduced the recombination rate of e−/h+ pairs in TiO2-x-yNxCy thin film. C. Xu et al. further took titanium tetrachloride and glucose to fabricate carbon-modified TiO2 thin film through a spray pyrolysis process [8]. The results showed that the band gap of TiO2 reduced to 2.82 from 3.2 eV due to the mixing of valence bands of carbon and TiO2, suggesting an increasing photocurrent with the glucose amount. When the concentration of glucose was higher than 0.006 M, the film surface started to crack and then decreased the crystallinity of the TiO2 film and the photocurrents.
TiO2 films were prepared via various technologies, such as sol–gel, chemical vapor deposition, physical vapor deposition, spray pyrolysis, spin-coating, and impregnation processes [8,9,10,11,12]. For practicality and cost-effective considerations, the most acceptable product is synthesized through a simple process and common materials. In this study, an impregnation process was chosen and another cheap substance, glucose, was used to serve as a carbon source. Combining the abovementioned points, carbon-modified TiO2 films were fabricated by impregnating them in a glucose-containing TiO2 sol. Furthermore, the effects of the carbon contents and calcining temperatures were investigated by evaluating the photocatalytic degradation efficiency for gaseous NOx under visible light and UV illumination.
2. Results and Discussion
2.1. Photocatalytic Degradation of Nitrogen Oxides
Figure 1a reports the photocatalytic reactivity of C–TiO2 film obtained in a 25% glucose solution by recording the change in concentrations of nitrogen oxides. In the beginning, the inlet 1ppm NO gas was made up of NO and air cylinders by using three mass flow controllers and a mixing chamber. The prepared NO gas was conducted to detector via route (A) without through a reactor, as the schematic drawing of flow shown in Section 3.2. The concentration for this step is shown in period (I) in Figure 1. Then, 1 ppm NO gas stream was switched to route (B) to the photoreactor without irradiation. The drop peak during 100–150 s was due to the NO gas stream being diluted with the origin air in the reactor. After 50 s of purge, the concentration of NO returned to 1 ppm. The drop peak for the blank reactor was same as that for the reactor-equipped photocatalyst sample, so the absorption of C–TiO2 and TiO2 films was very little and could be ignored. The decrease of NO concentration in the period (III) was due to the photocatalytic reaction. The absorption and desorption processes did not play important roles in this reaction. NO2 resulted from NO oxidization and the value of [NOx] equals the sum of [NO] and [NO2].
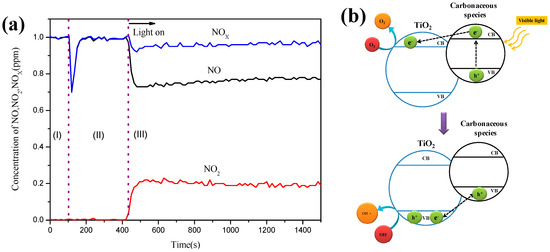
Figure 1.
(a) Time-course of the changes in concentration of NO, NO2, and NOx in the presence of 100% C–TiO2 film under visible light (blue LED); sample size: 8 × 10 cm2, inlet concentration of NO: 1 ppm, inlet flow rate: 1 L/min, irradiation intensity of visible light: 2.50 mW/cm2, respectively, reaction temperature: 20 °C, relative humidity: 37%. (b) Schematic drawing of the mechanism of photocatalytic degradation under visible light for carbon-modified TiO2.
It is noticeable that the presence of glucose enhanced the photoresponse on TiO2 photocatalyst due to the heterojunctions generated between TiO2 and carbonaceous species, as the schematic drawing in Figure 1b shows. The resulting structure contained a lower energy gap than pure TiO2, so the recombination of e−/h+ pairs was inhibited and a better visible-light photoactivity was delivered. While exposed to visible light, the electrons on the conductive band in carbon were induced and transmitted to the valence band in TiO2, resulting in the generation of negative oxygen ions (O2−). On the other hand, the holes on the valence band in carbon attracted the electrons in TiO2 to promote the formation of OH radicals. Furthermore, both OH radicals and O2− ions caused the oxidization reactions.
The detailed results of NOx degradation ability of various C–TiO2 photocatalysts are further compared in Figure 2. Under visible light, C–TiO2 film of 100% glucose additive has a higher NO removal efficiency, suggesting that a suitable carbonaceous content is helpful for the photocatalytic degradation of nitrogen monoxide. If active oxygen species were sufficient, nitric monoxide would be oxidized to NO2 and NO3− sequentially [20]. As shown in Figure 2a, NO removal rates and NO2− selectivity (Sel.NO2 = [NO2]generated/[NO]converted) increased with the amount of glucose additive. Up to 100%, its photocatalytic activity gradually achieved a higher value and the NO3− formation became significant, so its NO2 selectivity was lower than 25%. When the glucose concentration reached 200% or higher, the excessive carbon content would shield e−/h+ transmitting to react with oxygen or OH radicals. Thus, the NO removal efficiency was reduced. Under UV illumination, the photocatalytic activities of all C–TiO2 films were evidently much higher than visible light. In particular, the photocatalysts obtained in the 50% glucose solution had the highest NO removal efficiency. Over 200%, the shielding effect is similarly observed, meaning that an over-thick carbon layer could reduce the oxidization reaction on the C–TiO2 surface, leading to NO and NOx removal efficiencies dropping. Sintering C–TiO2 films at higher temperatures would result in a lower carbon content, suggesting relatively poor absorption in visible light. However, a high temperature is beneficial to improving TiO2 crystallization. A better crystalline means fewer lattice defects, a lower level of e−/h+ recombination rate, and higher activity under UV irradiation.
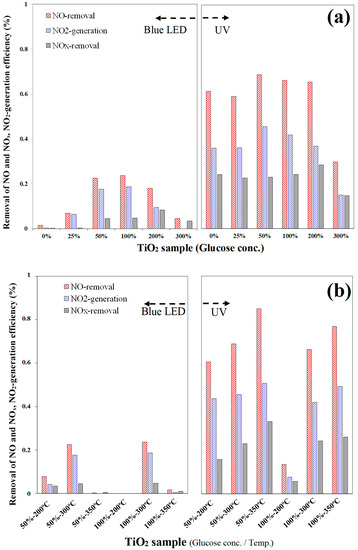
Figure 2.
Average NOx removal efficiency of various C–TiO2 photocatalysts under UV and visible-light irradiations, showing the changes with (a) glucose concentrations and (b) calcination temperatures; sample size: 8 × 10 cm2, inlet concentration of NO: 1.00 ppm, inlet flow rate: 1 L/min, irradiation intensity of visible and UV light: 1.33 and 2.50 mW/cm2, respectively, reaction temperature: 20 °C, relative humidity: 37%.
Figure 2b further shows the influences of calcination temperatures on NOx removal rates. Under visible irradiation, the C–TiO2 photocatalysts carburized at 300 °C presented a relatively high NO and NOx removal efficiency compared with other temperatures. The UV illumination results suggest that 350 °C is a better condition because of its high NO and NOx removal efficiency. However, at 350 °C, the C–TiO2 photocatalysts presented an activity-losing phenomenon, as shown in Figure 3. As soon as the UV light was turned on, the photodegradation effect was detected immediately, but [NO] and [NOx] then increased with time gradually. Because a higher calcining temperature would burn out partial carbonaceous species and accelerate grain growth, fewer adsorption sites could be provided for NO3−. Generally, NO2 selectivity in a UV environment is lower than in visible light due to its stronger energy, promoting more NO2 oxidized to NO3−. The details of the temperature effects were investigated through more characterization analyses in the followed sections.
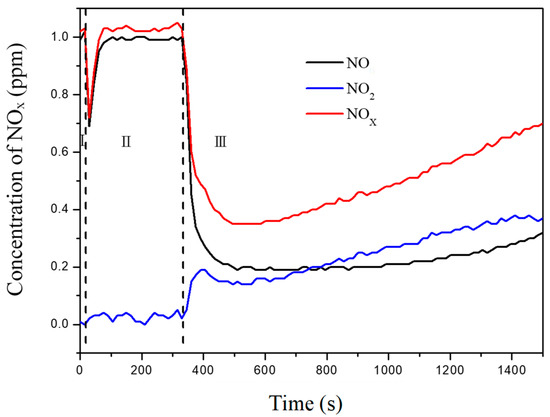
Figure 3.
Time course of the changes in concentration of NO, NO2, and NOx under UV irradiation in the presence of 100% C–TiO2 film calcined at 350 °C.
2.2. Characterization of C–TiO2 Thin Films
2.2.1. Crystallinity and Microstructure
Figure 4a shows the XRD patterns of the C–TiO2 films synthesized in different glucose concentrations after calcined at 300 °C. The spectra indicate that all peaks were consistent with an anatase TiO2 structure (JCPDS No. 21-1272), and no other phase was detected. However, according to the TEM image of the C–TiO2 film, a carbon layer was clearly observed, as shown in Figure 5. The carbon layers precipitated on TiO2 were very thin and even less than 10 nm for 300% glucose solution. Diffraction signals from such thin shells might be relatively lower than TiO2 particles and be neglected. Additionally, the characteristic peak of the glass substrate also overlapped with the signal of TiOxCy at 36.10° [8,21]. Because XRD signals would be affected by the glass substrates, the coated photocatalyst films were scratched down and moved onto a silicon wafer for measuring their exact FWHM of (101) crystalline plane at 2θ from 20° to 30°. Then, grain sizes were calculated by Scherrer’s formula: , where λ is the wavelength of X-ray radiation (Cu, λ = 1.54060Å), β is full width at half maximum (FWHM), and 0.891 is a shape factor [22,23]. The calculated average grain sizes of TiO2 films are listed in Table 1. Furthermore, the effects of calcining temperatures were also evaluated. Since the XRD results show a similar trend for different temperature from 200 to 350 °C, only partial XRD spectra between 20° to 30° were present in Figure 4b for calculating grain sizes. All the average grain sizes were not apparently influenced by the glucose concentrations.
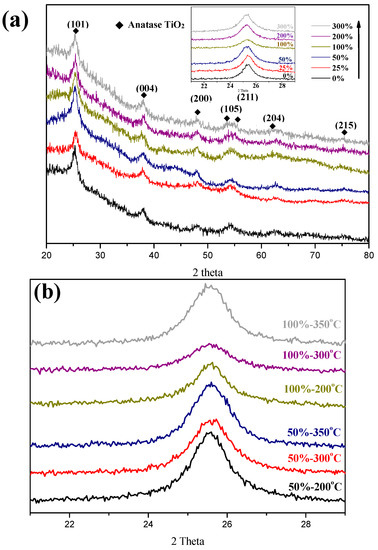
Figure 4.
(a) X-ray diffraction patterns of C–TiO2 synthesized from different glucose concentrations after sintered at 300 °C (Inserted: XRD signals of C–TiO2 films moved to Si substrates between 20° to 30°). (b) Partial XRD spectra of 50% and 100% C–TiO2 after baked at temperatures ranging from 200 to 350 °C.
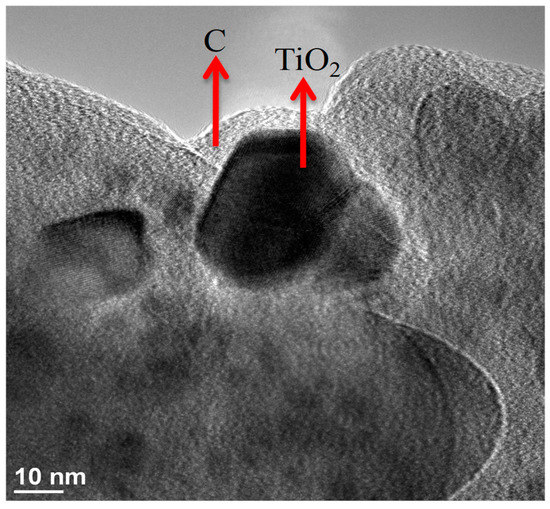
Figure 5.
TEM image of C–TiO2 film synthesized in 300% glucose solution.

Table 1.
Calculated grain sizes of various photocatalytic C–TiO2 thin films. (Calcining temperatures for all unmarked samples are 300 °C.)
Figure 6 shows the SEM images of the C–TiO2 films synthesized with different glucose concentrations. The average titania particle size is about 20–30 nm and no obvious difference was observed. Compared with the results of the C–TiO2 grain sizes, TiO2 particles were formed through aggregation behavior and were not influenced by the variations of the carbon source. In addition, it is noticeable that C–TiO2 presents a relatively loose film structure while the glucose concentration was up to 300% and retained a similar morphology below 200%. This is the reason why only 50% and 100% samples were further investigated for the influences of calcining temperatures. Figure 6d is the cross-section image of 100% C–TiO2 film, suggesting a smooth surface and a thickness about 150 nm. In sol–gel coating process, a high-temperature baking procedure, over 400 °C, is always necessary to burn out any undesired organics and to assist TiO2 sintering [17]. A lower calcining temperature is a feasible and practical advantage for current impregnation methods. Since there were no more additional organics, the as-coated C–TiO2 films reached their stable status after being baked at a temperature lower than 300 °C. Thus, the effects of calcining temperatures were also evaluated, ranging from 200 to 350 °C. Morphological images of different calcining temperatures are reported in Figure 7. No apparent change was observed as the temperatures increased. Combined with XRD results, these show that the structure and crystallinity of C-TiO2 were already stable at such temperatures.
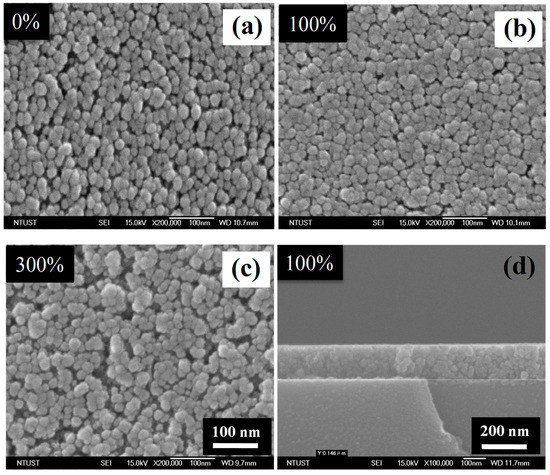
Figure 6.
SEM images of top-view of C–TiO2 films synthesized in (a) 0%, (b) 100% and (c) 300% glucose aqueous solutions after sintered at 300 °C, respectively. (d) The cross-section image of (b).
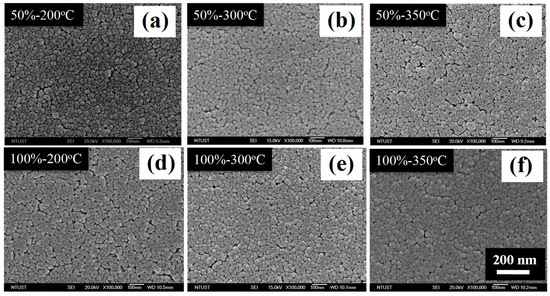
Figure 7.
SEM images of top-view of C–TiO2 films synthesized in the glucose solutions with concentrations of (a–c) 50%, and (d–f) 100% after sintered at 200, 300 and 350 °C, respectively.
2.2.2. UV–VIS Diffuse Reflectance Spectra
The photochemical properties of C–TiO2 films were first investigated with UV–visible spectra analysis. Figure 8 shows the UV–visible transform spectra and transmittance spectra of various C–TiO2 films. According to transmittance results, the transmissivities in visible light were apparently becoming lower as glucose amounts increased. On the other hand, their visible-light absorption was significantly improved by the interference reactions between titanium oxide and carbon [17]. Figure 8b presents that the enhancement in absorption range extended from visible light to UV radiation (below 300 nm). At a lower glucose concentration of 100%, the coated glass substrate had a visible-light transmissivity similar to the plain one and also provided an increased photocatalytic activity. In addition, the bandgaps of various C–TiO2 films were obtained via the Tauc equation:
where α is the absorption coefficient, t is the thickness of the films, A is a constant, hν is photo energy, and Eg is optical gap.
αthν = A(hν − Eg)2
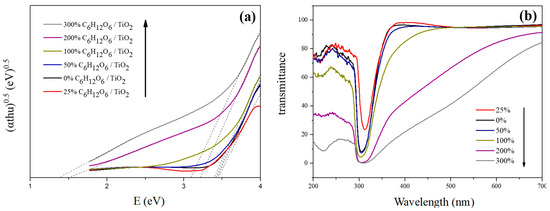
Figure 8.
(a) UV-visible transform spectra (Tauc plots) and (b) transmittance spectra of various C–TiO2 films.
Figure 8a is the UV–visible transform spectra of various C–TiO2 films. The bandgaps of TiO2 declined from 3.45 to 3.09 eV while the glucose concentrations were changed from zero up to 300%. It is also noticeable that an intragap showed up as the concentration was over 200%, enhancing e−/h+ pairs separation and transmission. However, this phenomenon does not guarantee good photocatalytic activity. The e−/h+ recombination rates need to be further considered, as an excessive amount of carbon resources might shield the activation point of titanium oxide and weaken its activity [8].
For different calcining temperatures, the visible-light absorption increased as the temperature decreased, as shown in Figure 9. This is because at a lower temperature, more carbon structures would accumulate on TiO2 films to interfere with the light path, resulting in a higher absorption rate [15]. Although the absorption rate at 200 °C was higher, an excessive amount of carbon would block activation points of titanium oxide and reduce the diffusion rate of contaminations. After calcined at 350 °C, both the absorption and activity apparently decreased. According to the results, a carburization temperature of 300 °C provides the most effective photocatalytic activity, including good e−/h+ transmission and stable carbon structure.
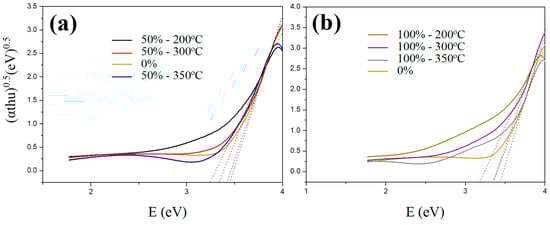
Figure 9.
UV-visible transform spectra (Tauc plots) of various C–TiO2 films synthesized in the glucose solutions with concentrations of (a) 50% and (b) 100% after calcined at 200, 300, and 350 °C, respectively.
2.2.3. X-ray Photoelectron Spectroscopy
X-ray photoelectron spectroscopy (XPS) was used to investigate the difference in electric charge in a certain element on the surface. Figure 10 presents XPS results of various C–TiO2 films for their carbon element. The chemical shift of carbon for C–C/C=C, TiC, O–C–O, and C=O are reported at 284.5, 282.77, 286.10, and 288.4 eV, respectively [10]. The XPS peaks show the valency of carbon on TiO2 film. Among these possible structures, the surface structure with a small chemical shift, i.e., reduced carbon element, can promote electron transmission to enhance photocatalytic activity. Ti–C is the possible structure of this reduced carbon element. After being excited by visible light, electrons would easily transfer to generate negative oxygen ions through the reduced carbon element. At the same time, holes in carbon would attract the electrons on the TiO2 valence band. Thus, residual holes in TiO2 could combine with hydroxide ions to generate negative oxygen ions, reducing the e−/h+ recombination rate. In Figure 10a, the signal of the reduced carbon element became stronger at concentrations higher than 100%. However, a higher glucose concentration had a stronger signal of the reduced carbon element, but its photocatalytic activities did not follow this trend, agreeing with the results of UV–visible spectra. This phenomenon resulted from the surface active site, which was thoroughly covered by carbonaceous species. As to the temperature effect presented in Figure 10b, at 200 °C, a metastable reduced carbon element was formed [24], and its peak was obviously stronger and broader than the others, which is consistent with its strong visible-light absorption due to plenty of carbonaceous species on its surface, suggesting a lower activity under both UV and visible illumination.
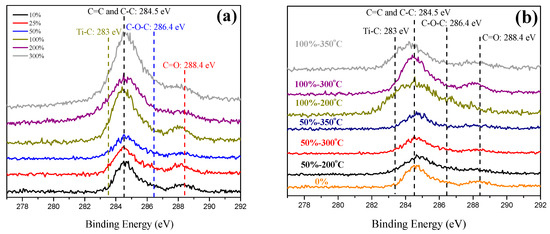
Figure 10.
(a) C 1S XPS spectra of various C–TiO2 films synthesized in different glucose aqueous solutions after being sintered at 300 °C, and (b) the influences on changing calcining temperatures from 200 to 350 °C.
2.2.4. Photochemistry Analysis
For the linear sweep voltammetry test, the electrolyte is 0.1 M NaCl solution, the light source is a xenon lamp with a power of 150 W, and the reference and auxiliary electrodes are a Ag/AgCl electrode and platinum, respectively. Through photochemistry analysis, the e−/h+ generation ability of C–TiO2 photocatalysts can be acquired when excited by photons. Figure 11 presents the linear sweep voltammetry curve for the C–TiO2 photocatalytic film obtained in 200% glucose aqueous solution under xenon lamp illumination. TiO2 is an n-type semiconductor, so an e− flow will be induced under applied bias while exposed to an excitation light source. In contrast, C–TiO2 photocatalysts generate an e− flow under a positive bias and an h+ flow for a negative bias, which is the behavior of p-n heterojunction [25]. Table 2 lists the visible-light photocurrent densities of C–TiO2 films synthesized in different glucose solutions. The current density of C–TiO2 films obviously increased while carbonaceous structures were decorated and reached a saturated value at 200% glucose concentration. However, the 200% C–TiO2 sample presents lower visible-light photoactivity in photocatalytic reactions, which is because an over-thick carbonaceous layer reduces its active species. While the glucose concentration increased to 300%, the photocurrent reduced again because of cracks on a thicker carbon film, as the image shows in Figure 6c. As to the influences of calcined temperatures, 300 °C is still an optimized condition due to its high photocurrent density (Table 2).
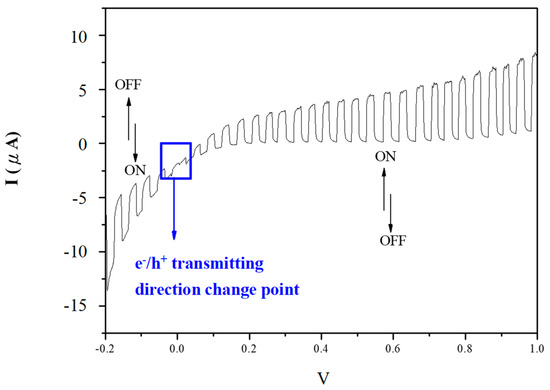
Figure 11.
Linear sweep voltammetry curve for the C–TiO2 photocatalytic film obtained in 200% glucose aqueous solution.
Table 2.
Photocurrent density of various photocatalytic C–TiO2 thin films under visible light. (The calcination temperatures for all unmarked samples 300 °C.)
2.2.5. Contact Angles Photochemistry Analysis
In order to evaluate the surface conditions of C–TiO2 films for self-cleaning and antifogging applications, the contact angles were measured and recorded in Figure 12. Each contact angle was decided by the average values of five measurements. At low glucose concentrations, the obtained C–TiO2 films were hydrophilic. Because the amount of hydrocarbons on the TiO2 surface decreased after high-temperature treatments, water molecules could adsorb onto TiO2 more easily to improve its hydrophilicity [26]. While the carbon content was raised, the contact angles evidently increased. The contact between hydroxyl and TiO2 became poor, which is the reason why the photocatalytic activity of C–TiO2 lowered for high glucose concentration.
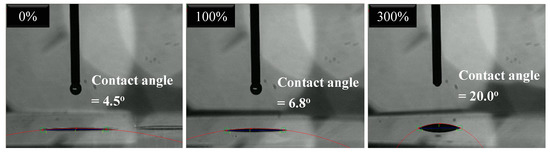
Figure 12.
Measurements of contact angle on various C–TiO2 surfaces obtained in glucose solutions of different concentrations.
3. Experimental Procedures
A simple route, an impregnation process, was adopted in this study to prepare carbon-modified titania (C–TiO2) films, and their photocatalytic activities in gaseous environment were further investigated. Carbon contents and calcination conditions are two major controlling variables, and thus the optimized parameter was proposed for the most effective photocatalytic activity. Besides basic physical and chemical properties, superhydrophilicity is another application characteristic, providing self-cleaning and antifogging effects. The contact angles of C–TiO2 films were examined as well. Finally, the differences and mechanism involved are discussed and concluded according to the analytic results and photocatalytic performances.
3.1. Preparation of Carbon-Modified TiO2 Thin Films
All chemicals are of analytical grade and used as received without any further purification, including STS-01 sol (Anatase: 99%, Ishihara Sangyo Kaisha Ltd., Osaka, Japan), d-glucose (99%, J.T. Baker, Center Valley, PA, USA), high-purity nitrogen gas (San Ying gas Inc., Taipei, Taiwan), and air and nitric oxide (Jing De Gases Co., Taipei, Taiwan). First, we dissolved a suitable amount of glucose in DI water and then slowly titrated a quantitative photocatalytic STS-01 gel of 10 wt % into the glucose water. Based on the weight of STS-01 additive, the added glucose amounts were 0, 25, 50, 100, 200, and 300 wt % of it. The obtained solutions were stirred for 12 h at room temperature for further ripening. The glass substrates were cleaned with acetone, NaOH, and DI water in an ultrasonic cleaning machine, sequentially, and the dried in an air oven at 60 °C for over 4 h. An impregnation-coating process was used to deposit various carbon-modified TiO2 films onto the glass substrates. The schematic drawing of the impregnation-coating procedures is shown in Figure 13. The as-coated substrates were further dried at 100 °C under a nitrogen atmosphere and were then carburized at specific temperatures from 200 to 350 °C for 1 h, resulting in the final carbon-modified TiO2 products. Sample nomenclature was defined as follows: X% C–TiO2—photocatalyst prepared by the dipping process with using TiO2 sol containing X wt % glucose.
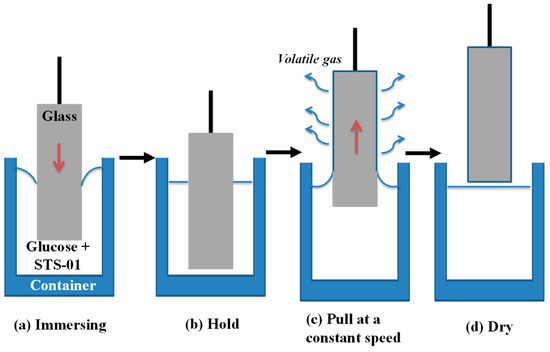
Figure 13.
Schematic drawing of impregnation process, including (a) immersing in the reaction solution (glucose + STS-01); (b) hold for 10 min; (c) pull at a constant speed; (d) dry in ambient air.
3.2. Evaluation of the Photocatalytic Performances of C–TiO2 Films
Photocatalytic activity is the most important and intuitive index to evaluate practical performances for related applications. Photocatalytic tests were carried out in a gaseous simulated environment. The degradation of nitric oxide (NO) gas was used to evaluate the performances of photocatalytic C–TiO2 films for gaseous compounds. The experimental procedures for this indicative pollutant are described below.
Photocatalytic Degradation of Nitrogen Oxides
Figure 14 shows the schematic diagram of a continuous reaction system for photocatalytic NOx degradation of various C–TiO2 films. In this experiment, the standard gas is 10 ppm nitric oxide (NO) and the feeding gas is dry air blended together in a mixer. The mixed gas was maintained at a concentration of 1.03 ppm and then induced into a reactor decorated with TiO2 photocatalysts. By irradiated to excitation light, the mixed NO gas was oxidized and then analyzed while imported through the outlet. Blue LED (visible) or a black lamp (UV) provided a light source. The light source spectra, shown in Figure 15, were measured using a spectrophotometer (Ocean Optics, USB2000, Largo, FL, USA). The working area of photocatalytic samples is about 8 × 10 cm2. Before measuring, an absorption–desorption equilibrium was first conducted and the concentration variations of NO, NOx, and NO2 were continuously recorded for 20 min under UV or visible light. The gas concentrations were measured by using a NOx analyzer (ECO, CLD700AL, London, UK).
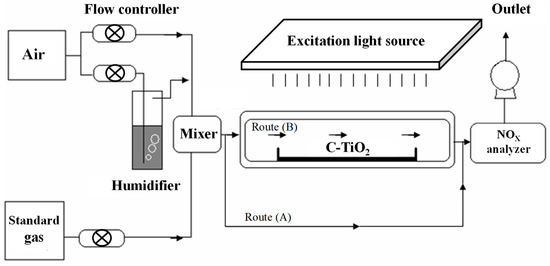
Figure 14.
Schematic drawing of continuous reaction system for photocatalytic degradation of nitrogen oxides.
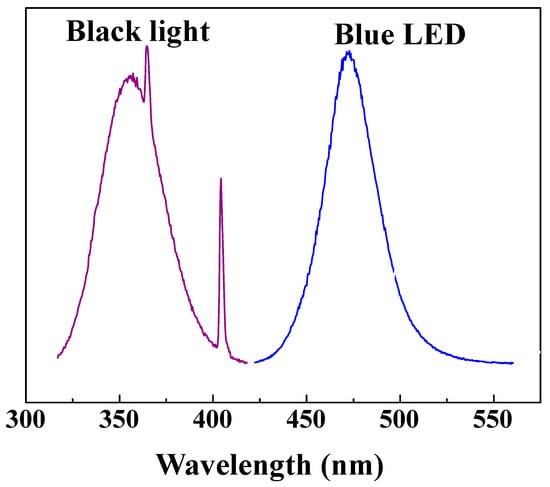
Figure 15.
UVA lamp and LED photon energy distribution profiles (the visible-light region of UVA lamp is small and not shown in this figure).
3.3. Characterizations of C–TiO2 Thin Films
The as-calcined C–TiO2 thin films were directly characterized for their crystallinity and average grain size by a high-power X-ray powder diffraction (Bruker, D8 discover SSS, Billerica, MA, USA) using a graphite monochromator with Cu kα X-ray radiation (λ = 0.154060 nm) under θ–2θ configuration. A field emission scanning electron microscope (JEOL, JSM6500F, Tokyo, Japan) was used to observe surface morphologies and to measure the average particle sizes. The detailed microstructure between carbon and TiO2 particles was examined by a field emission transmission electron microscopy (Philips, Tecnai F20 G2 FEI-TEM, Amsterdam, Netherlands). In order to determine the variances in energy gaps and absorption behaviors of different C–TiO2 films, their ultraviolet–visible spectra were recorded (JASCO V-670, Easton, MD, USA). Surface bonding of the TiO2 bases and the carbon structure were respectively investigated by using X-ray photoelectron spectroscopy (VG ESCA Scientific Theta Probe, Waltham, MA, USA). Titania’s photocurrent is a direct indicator of its photocatalytic performance and was evaluated with an electrochemical analyzer (CH instrument, Electrochemical Analyzer CHI1127A, Austin, TX, USA). Moreover, the surface physical properties of carbon-modified TiO2 films are important for real applications. Thus, the contact angles of various C–TiO2 surfaces were tested by a contact angle meter (Creating-nanotech, Contact Angle Meter CAM110, Tainan, Taiwan).
4. Summary
In this study, carbon-modified TiO2 films were easily synthesized by using an impregnation process in various glucose aqueous solutions. According to the results of the evaluated photocatalytic activity, TiO2 films demonstrate improved performance under visible light and UV illumination with a suitable amount of carbonaceous species on their surface. The C–TiO2 photocatalysts obtained in the 50 wt %-glucose dipping solution exhibits a better photoactivity in liquid reactions. In addition, the C–TiO2 film prepared from the 100 wt %-glucose dipping solution presents a higher efficiency for gaseous photocatalytic reactions. According to the examinations in microstructures and photochemical properties, the difference between these two conditions is not as high as expected. An excessive carbon content caused the photocatalytic ability of C–TiO2 films to lower due to the serious coverage effect on active sites on the TiO2 surface. As to the effects of calcination temperatures, after calcined at 300 °C, C–TiO2 photocatalysts show better activity under visible-light illumination. In addition, a lower calcination temperature is beneficial for improving visible-light absorption according to the results of UV–VIS spectra analysis. However, the XPS data of C–TiO2 photocatalysts calcined at 200 °C show weak visible-light activity and poor hydrophilic properties. Thus, carbon-modified TiO2 photocatalysts produced by this simple process can be applied for purifying water and air.
Author Contributions
S.-H.C. and Y.-H.T. conceived and designed the experiments; Y.-C.H. performed the experiments; Y.-C.H. and Y.-H.T. analyzed the data; Y.-J.C. contributed verifications of results; S.-H.C. wrote the paper.
Conflicts of Interest
The authors declare no conflict of interest.
References
- Giovannetti, R.; D’Amato, C.A.; Zannotti, M.; Rommozzi, E.; Gunnella, R.; Minicucci, M.; Di Cicco, A. Visible light photoactivity of Polypropylene coated Nano-TiO2 for dyes degradation in water. Sci. Rep. 2015, 5, 17801. [Google Scholar] [CrossRef] [PubMed]
- Giovannetti, R.; Rommozzi, E.; Zannotti, M.; D’Amato, C.A.; Ferraro, S.; Cespi, M.; Bonacucina, G.; Minicuccic, M.; Di Ciccoc, A. Exfoliation of graphite into graphene in aqueous solution: An application as graphene/TiO2 nanocomposite to improve visible light photocatalytic activity. RSC Adv. 2016, 6, 93048–93055. [Google Scholar] [CrossRef]
- Giovannetti, R.; Rommozzi, E.; Zannotti, M.; D’Amato, C.A. Recent Advances in Graphene Based TiO2 Nanocomposites (GTiO2Ns) for Photocatalytic Degradation of Synthetic Dyes. Catalysts 2017, 7, 305. [Google Scholar] [CrossRef]
- Linsebigler, A.L.; Lu, G.; Yates, J.T. Photocatalysis on TiO2 Surfaces: Principles, Mechanisms, and Selected Results. Chem. Rev. 1995, 95, 735–758. [Google Scholar] [CrossRef]
- Šuligoj, A.; Štangara, U.L.; Ristić, A.; Mazaj, M.; Verhovšek, D.; Tušar, N.N. TiO2–SiO2 films from organic-free colloidal TiO2 anatase nanoparticles as photocatalyst for removal of volatile organic compounds from indoor air. Appl. Catal. B: Environ. 2016, 184, 119–131. [Google Scholar] [CrossRef]
- Bhethanabotla, V.C.; Russell, D.R.; Kuhn, J.N. Assessment of mechanisms for enhanced performance of Yb/Er/titania photocatalysts for organic degradation: Role of rare earth elements in the Titania phase. Appl. Catal. B Environ. 2017, 202, 156–164. [Google Scholar] [CrossRef]
- Sampaio, M.J.; Silva, C.G.; Marques, R.R.N.; Silva, A.M.T.; Faria, J.L. Carbon nanotube–TiO2 thin films for photocatalytic applications. Catal. Today 2011, 161, 91–96. [Google Scholar] [CrossRef]
- Xu, C.; Killmeyer, R.; Gray, M.L.; Khan, S.U.M. Enhanced carbon doping of n-TiO2 thin films for photoelectrochemical water splitting. Electrochem. Commun. 2006, 8, 1650–1654. [Google Scholar] [CrossRef]
- Yang, J.; Bai, H.; Jiang, Q.; Lian, J. Visible-light photocatalysis in nitrogen-carbon-doped TiO2 films obtained by heating TiO2 gel–film in an ionized N2 gas. Thin Solid Films 2008, 516, 1736–1742. [Google Scholar] [CrossRef]
- Martin, M.; Leonid, S.; Tomáš, R.; Jan, Š.; Jaroslav, K.; Mariana, K.; Michaela, J.; František, P.; Gustav, P. Anatase TiO2 nanotube arrays and titania films on titanium mesh for photocatalytic NOX removal and water cleaning. Catal. Today 2017, 287, 59–64. [Google Scholar] [CrossRef]
- Hsu, S.W.; Yang, T.S.; Chen, T.K.; Wong, M.S. Ion-assisted electron-beam evaporation of carbon-doped titanium oxide films as visible-light photocatalyst. Thin Solid Films 2007, 515, 3521–3526. [Google Scholar] [CrossRef]
- Mai, L.; Huang, C.; Wang, D.; Zhang, Z.; Wang, Y. Effect of C doping on the structural and optical properties of sol–gel TiO2 thin films. Appl. Surf. Sci. 2009, 255, 9285–9289. [Google Scholar] [CrossRef]
- Shi, J.; Zheng, J.; Wu, P.; Ji, X. Immobilization of TiO2 films on activated carbon fiber and their photocatalytic degradation properties for dye compounds with different molecular size. Catal. Commun. 2008, 9, 1846–1850. [Google Scholar] [CrossRef]
- Lin, X.; Rong, F.; Ji, X.; Fu, D. Carbon-doped mesoporous TiO2 film and its photocatalytic activity. Microporous Mesoporous Mater. 2011, 142, 276–281. [Google Scholar] [CrossRef]
- Wong, M.S.; Hsu, S.W.; Rao, K.K.; Kumar, C.P. Influence of crystallinity and carbon content on visible light photocatalysis of carbon doped titania thin films. J. Mol. Catal. A Chem. 2008, 279, 20–26. [Google Scholar] [CrossRef]
- Wang, H.; Quan, X.; Yu, H.; Chen, S. Fabrication of a TiO2/carbon nanowall heterojunction and its photocatalytic ability. Carbon 2008, 46, 1126–1132. [Google Scholar] [CrossRef]
- Sellappan, R.; Zhu, J.; Fredriksson, H.; Martins, R.S.; Zäch, M.; Chakarov, D. Preparation and characterization of TiO2/carbon composite thin films with enhanced photocatalytic activity. J. Mol. Catal. A Chem. 2011, 335, 136–144. [Google Scholar] [CrossRef]
- Zhong, J.; Chen, F.; Zhang, J. Carbon-Deposited TiO2: Synthesis, Characterization, and Visible Photocatalytic Performance. J. Phys. Chem. C 2010, 114, 933–939. [Google Scholar] [CrossRef]
- Payne, H.F. The dip coater: An instrument for making uniform films by the dip method. Ind. Eng. Chem. 1943, 15, 48–56. [Google Scholar] [CrossRef]
- Zare-Hossein-abadi, D.; Ershad-Langroudi, A.; Rahimi, A.; Afsar, S. Photo-Generated Activities of Nanocrystalline TiO2 Thin Films. J. Inorg. Organomet. Polym. Mater. 2010, 20, 250–257. [Google Scholar] [CrossRef]
- Tryba, B.; Tsumura, T.; Janus, M.; Morawski, A.W.; Inagaki, M. Carbon-coated anatase: Adsorption and decomposition of phenol in water. Appl. Catal. B Environ. 2004, 50, 177–183. [Google Scholar] [CrossRef]
- Ohtani, B. Photocatalysis A to Z—What we know and what we do not know in a scientific sense. J. Photochem. Photobiol. C 2010, 11, 157–178. [Google Scholar] [CrossRef]
- Ohtani, B. Preparing Articles on Photocatalysis—Beyond the Illusions, Misconceptions, and Speculation. Chem. Lett. 2008, 37, 216–229. [Google Scholar] [CrossRef]
- Tseng, Y.H.; Kuo, C.H. Photocatalytic degradation of dye and NOx using visible-light-responsive carbon-containing TiO2. Catal. Today 2011, 174, 114–120. [Google Scholar] [CrossRef]
- Chen, C.; Cai, W.; Long, M.; Zhou, B.; Wu, Y.; Wu, D.; Feng, Y. Synthesis of visible-light responsive graphene oxide/TiO2 composites with p/n heterojunction. ACS Nano 2010, 4, 6425–6432. [Google Scholar] [CrossRef] [PubMed]
- Takeuchi, M.; Sakamoto, K.; Martra, G.; Coluccia, S.; Anpo, M. Mechanism of photoinduced superhydrophilicity on the TiO2 photocatalyst surface. J. Phys. Chem. B 2005, 109, 15422–15428. [Google Scholar] [CrossRef] [PubMed]
© 2018 by the authors. Licensee MDPI, Basel, Switzerland. This article is an open access article distributed under the terms and conditions of the Creative Commons Attribution (CC BY) license (http://creativecommons.org/licenses/by/4.0/).