Article

Influence of Sulfur-Containing Sodium Salt Poisoned V2O5–WO3/TiO2 Catalysts on SO2–SO3 Conversion and NO Removal

1
School of Energy, Power and Mechanical Engineering, North China Electric Power University, Beijing 102206, China
2
Sichuan Electric Power Consulting Design Co., Ltd., Chengdu 610041, Sichuan, China
*
Author to whom correspondence should be addressed.
Catalysts 2018, 8(11), 541; https://doi.org/10.3390/catal8110541
Submission received: 5 November 2018 / Revised: 12 November 2018 / Accepted: 12 November 2018 / Published: 13 November 2018
(This article belongs to the Special Issue Catalysts Deactivation, Poisoning and Regeneration)

Abstract

:
A series of poisoned catalysts with various forms and contents of sodium salts (Na2SO4 and Na2S2O7) were prepared using the wet impregnation method. The influence of sodium salts poisoned catalysts on SO2 oxidation and NO reduction was investigated. The chemical and physical features of the catalysts were characterized via NH3-temperature programmed desorption (NH3-TPD), H2-temperature programmed reduction (H2-TPR), X-ray photoelectron spectroscopy (XPS), Brunauer–Emmett–Teller (BET), X-ray diffraction (XRD), and Fourier Transform Infrared Spectroscopy (FT-IR). The results showed that sodium salts poisoned catalysts led to a decrease in the denitration efficiency. The 3.6% Na2SO4 poisoned catalyst was the most severely deactivated with denitration efficiency of only 50.97% at 350 °C. The introduction of SO42− and S2O72− created new Brønsted acid sites, which facilitated the adsorption of NH3 and NO reduction. The sodium salts poisoned catalysts significantly increased the conversion of SO2–SO3. 3.6%Na2S2O7 poisoned catalyst had the strongest effect on SO2 oxidation and the catalyst achieved a maximum SO2–SO3-conversion of 1.44% at 410 °C. Characterization results showed sodium salts poisoned catalysts consumed the active ingredient and lowered the V4+/V5+ ratio, which suppressed catalytic performance. However, they increased the content of chemically adsorbed oxygen and the strength of V5+=O bonds, which promoted SO2 oxidation.

1. Introduction

Nitrogen oxides (NOx) are recognized as a major air pollutant. They destroy the ozone layer, form acid rain, affect the ecological environment, and endanger human health. The main source of NOx in China is thermal power plants [1,2]. NOx are listed as a binding assessment indicator for total air pollution control. Consequently, selective catalytic reduction (SCR) flue gas denitration equipment is being used on a large scale in China’s thermal power plants. Catalysts are the heart of SCR flue gas denitration technology. The most extensively used commercial catalyst is V2O5–WO3/TiO2 [3]. Zhundong coal enriches a large amount of sodium (the total content is higher than 2%) because of the special coal-forming environment and the effect of groundwater [4]. The sodium in the coal is not completely stable in the furnace after burning [5]. The presence of large amounts of fly ash and alkali metals in the flue gas can cause catalyst clogging and poisoning. The former is generally reversible and belongs to physical function. The latter belongs to chemical action. In recent years, the toxic effect of alkali metals on the catalyst has been extensively investigated [6,7]. The mechanism of toxicity can be summarized as follows: (1) The presence of alkali metal causes V–O–H to be replaced by V–O–M and decreases the strength and number of Brønsted acid sites. This leads to the reduction of denitration efficiency [8]. (2) Alkali metal can weaken the intensity of V5+=O bonds, decreasing the oxidation ability of the catalysts. Moreover, alkali metals interact with the active ingredient on the catalyst surface. This causes the chemical valence of the elements and the concentration of the active ingredient to change [9,10].
Peng et al. [11,12] studied the mechanism of alkali metals poisoning catalysts. They concluded that after the alkali metals were added they would interact with the V species, causing a reduction in the surface acidity and inhibition of the adsorption of NH3. This is thought to have resulted in the decreased activity of the catalysts. According to a series of alkali metal bromide poisoning results obtained by Chang et al. [13], the addition of alkali metal compounds decreased the intensity of the V=O bonds and the content of chemically adsorbed oxygen on the catalyst surface. Consequently, the redox ability of the vanadium-based catalysts was weakened. When considering catalysts poisoning, most researchers have focused on the toxic effects of different forms of alkali metals on the catalysts. However, the flue gas contains a large amount of SO2. Therefore, it will react with gas phase NaCl to form substances such as Na2SO4 and Na2S2O7 [14,15,16]. The reaction formulas are as follows:
2 NaCl + 2 SO 2 + O 2 + H 2 O Na 2 S 2 O 7 + 2 HCl
4 NaCl + 2 SO 2 + O 2 + 2 H 2 O 2 Na 2 SO 4 + 4 HCl
V2O5–WO3/TiO2 catalysts also have a catalytic effect on the conversion of SO2 to SO3. SO2 conversion is also the main index in evaluating the denitration performance of an SCR catalyst. SO3 will cause the corrosion of gas pipes. NH3 will react with SO3 to produce (NH4)2SO4 and NH4HSO4. These aforementioned compounds can plug the air preheater and cause great harm. Li et al. [17] found that the presence of SO2 decreased the catalytic activity of K poisoned catalysts because of the generation of K2S2O7. They suggested that K2S2O7 inhibited the adsorption of NH3 and weakened the oxidation ability of the catalysts. However, some researchers concluded that the presence of pyrosulfates would maintain the high oxidizability of V species to a certain degree [18]. Tian et al. [19] studied the influence of different Na salts on the deactivation of SCR catalysts. They concluded that the V–OH bonds were replaced by V–O–Na, reducing the amount of Brønsted acid sites. However, the presence of SO42− produced new Brønsted acid sites and promoted the adsorption of NH3. Hu et al. [20] and Chen et al. [21] specifically studied the role of SO42− in catalyst deactivation. Their research found the addition of SO42− can create more acid sites on the catalyst surface. These acted as Brønsted acid sites and adsorbed more NH3. Consequently, the performance of the catalysts was enhanced. Dahlin et al. [22] studied the toxic effects of K, Na, P, S, and other poisons on the catalyst. They concluded that Na and K had the greatest toxic effect on the catalyst. However, sulfates were formed to prevent the alkali metal from interacting with the active sites of the catalyst when Na and S existed simultaneously. Thus, the poisoning effect of the alkali metal decreased.
Most researchers focus on the denitration performance and deactivation of the catalysts [23,24]. The catalytic effect of sulfur-containing sodium salts poisoned catalysts on SO2 oxidation and the effect of SO2 on denitration efficiency have rarely been studied. To address this, a series of different concentrations of Na2SO4 and Na2S2O7 poisoned catalysts were prepared via the wet impregnation method. The influence of sulfur-containing sodium salts poisoned catalysts on SO2 oxidation and NO removal was investigated experimentally.

2. Results and Discussion

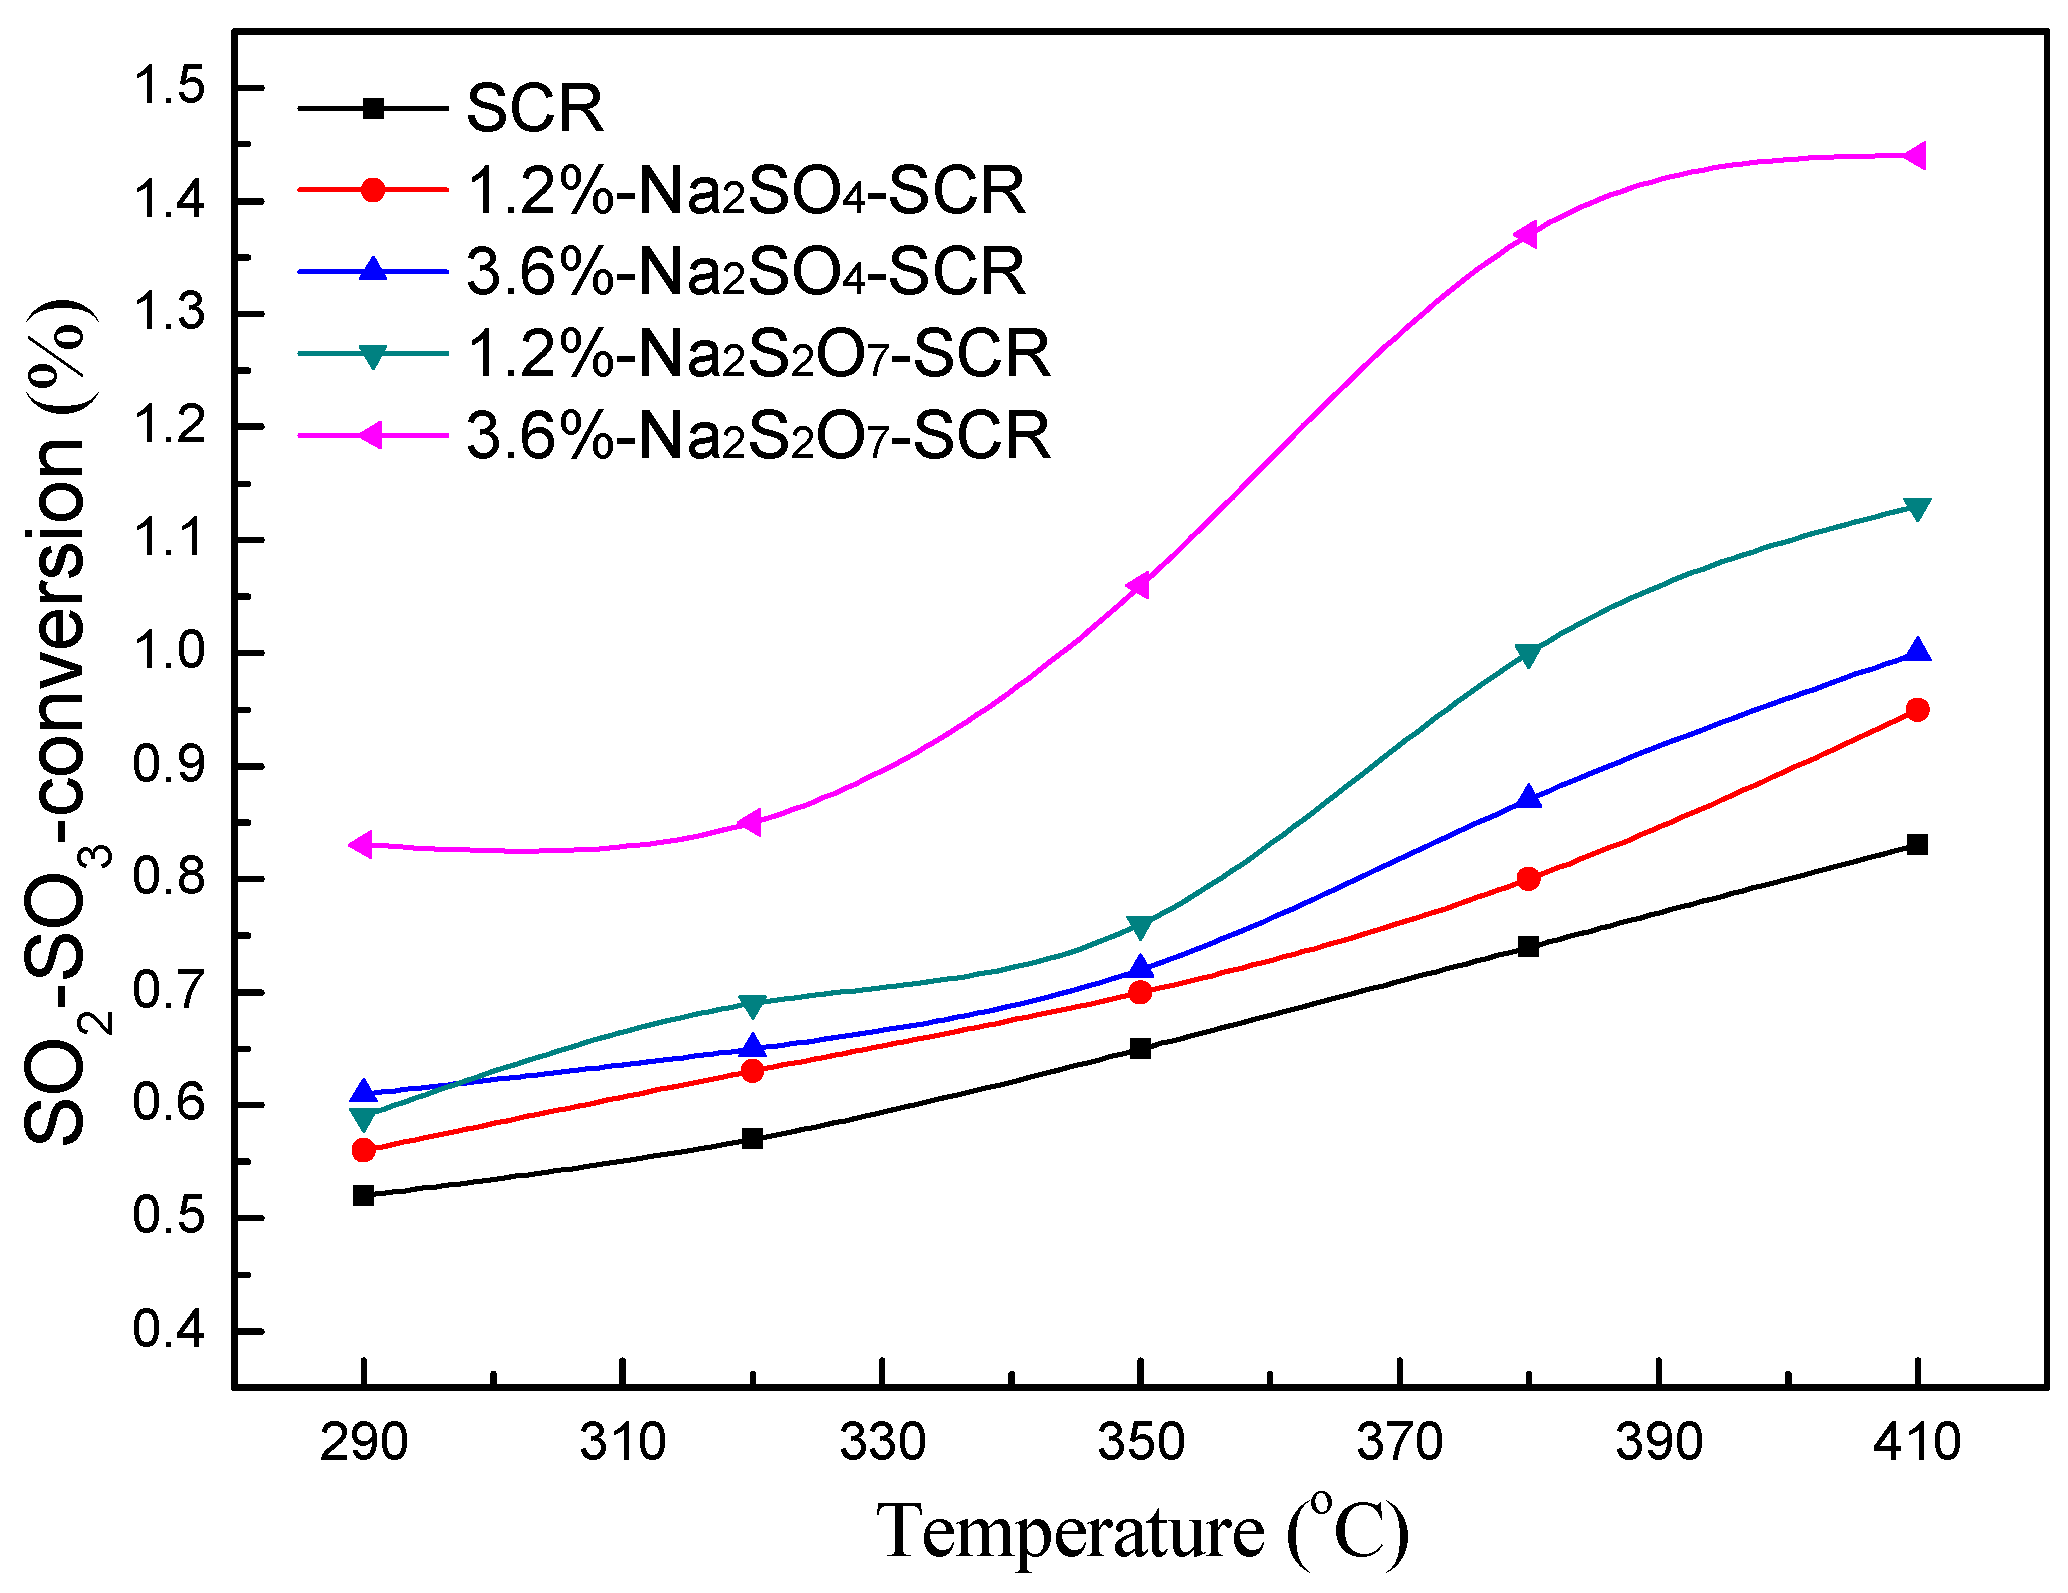
2.1. Effect of Different Catalysts on SO3 Generation

2.1.1. Effect of Temperature on SO3 Generation

SO2–SO3-conversion for different catalysts at different reaction temperatures are shown in Figure 1. The results indicate that the SO2–SO3-conversion of different catalysts increases gradually with increasing temperature. The SO2–SO3-conversion of the pure catalyst increases from 0.52% at 290 °C to 0.83% at 410 °C. The concentration of SO3 increases from 9.33 ppm to 14.97 ppm. The most significant increase is for the 3.6% Na2S2O7 poisoned catalyst. The SO2–SO3-conversion increases from 0.83% to 1.44% and the concentration of SO3 increases from 15 ppm to 26 ppm. The overall variation of 3.6% Na2SO4 poisoned catalyst is lower than that of 1.2% Na2S2O7.
The sulfur-containing sodium salts poisoned catalysts leads to an increase in the amount of V–O–S bonds. The presence of V–O–S bonds promotes SO3 generation [25]. Zhang et al. [26] and Ma et al. [27] suggested that the addition of sodium salts (in the presence of SO2 and O2) caused the generation of VOSO4. With an increase in temperature, VOSO4 was reoxidized to SO3 and V2O5. Hence, SO2–SO3-conversion increased. For Na2S2O7 poisoned catalysts, Alvarez et al. [18] and Wang et al. [28] considered that the addition of Na2S2O7 inhibited the formation of VOSO4. This would keep the V species in 5+ oxidation state below 400 °C, and ensure the catalytic effect. Meanwhile, the acid strength of the catalyst surface can be enhanced by the induction of the S=O group. The pyrosulfate substance provided stronger acidic sites than the sulfate substance. This resulted in an obvious increase in the SO2–SO3-conversion of the pyrosulfates poisoned catalysts.

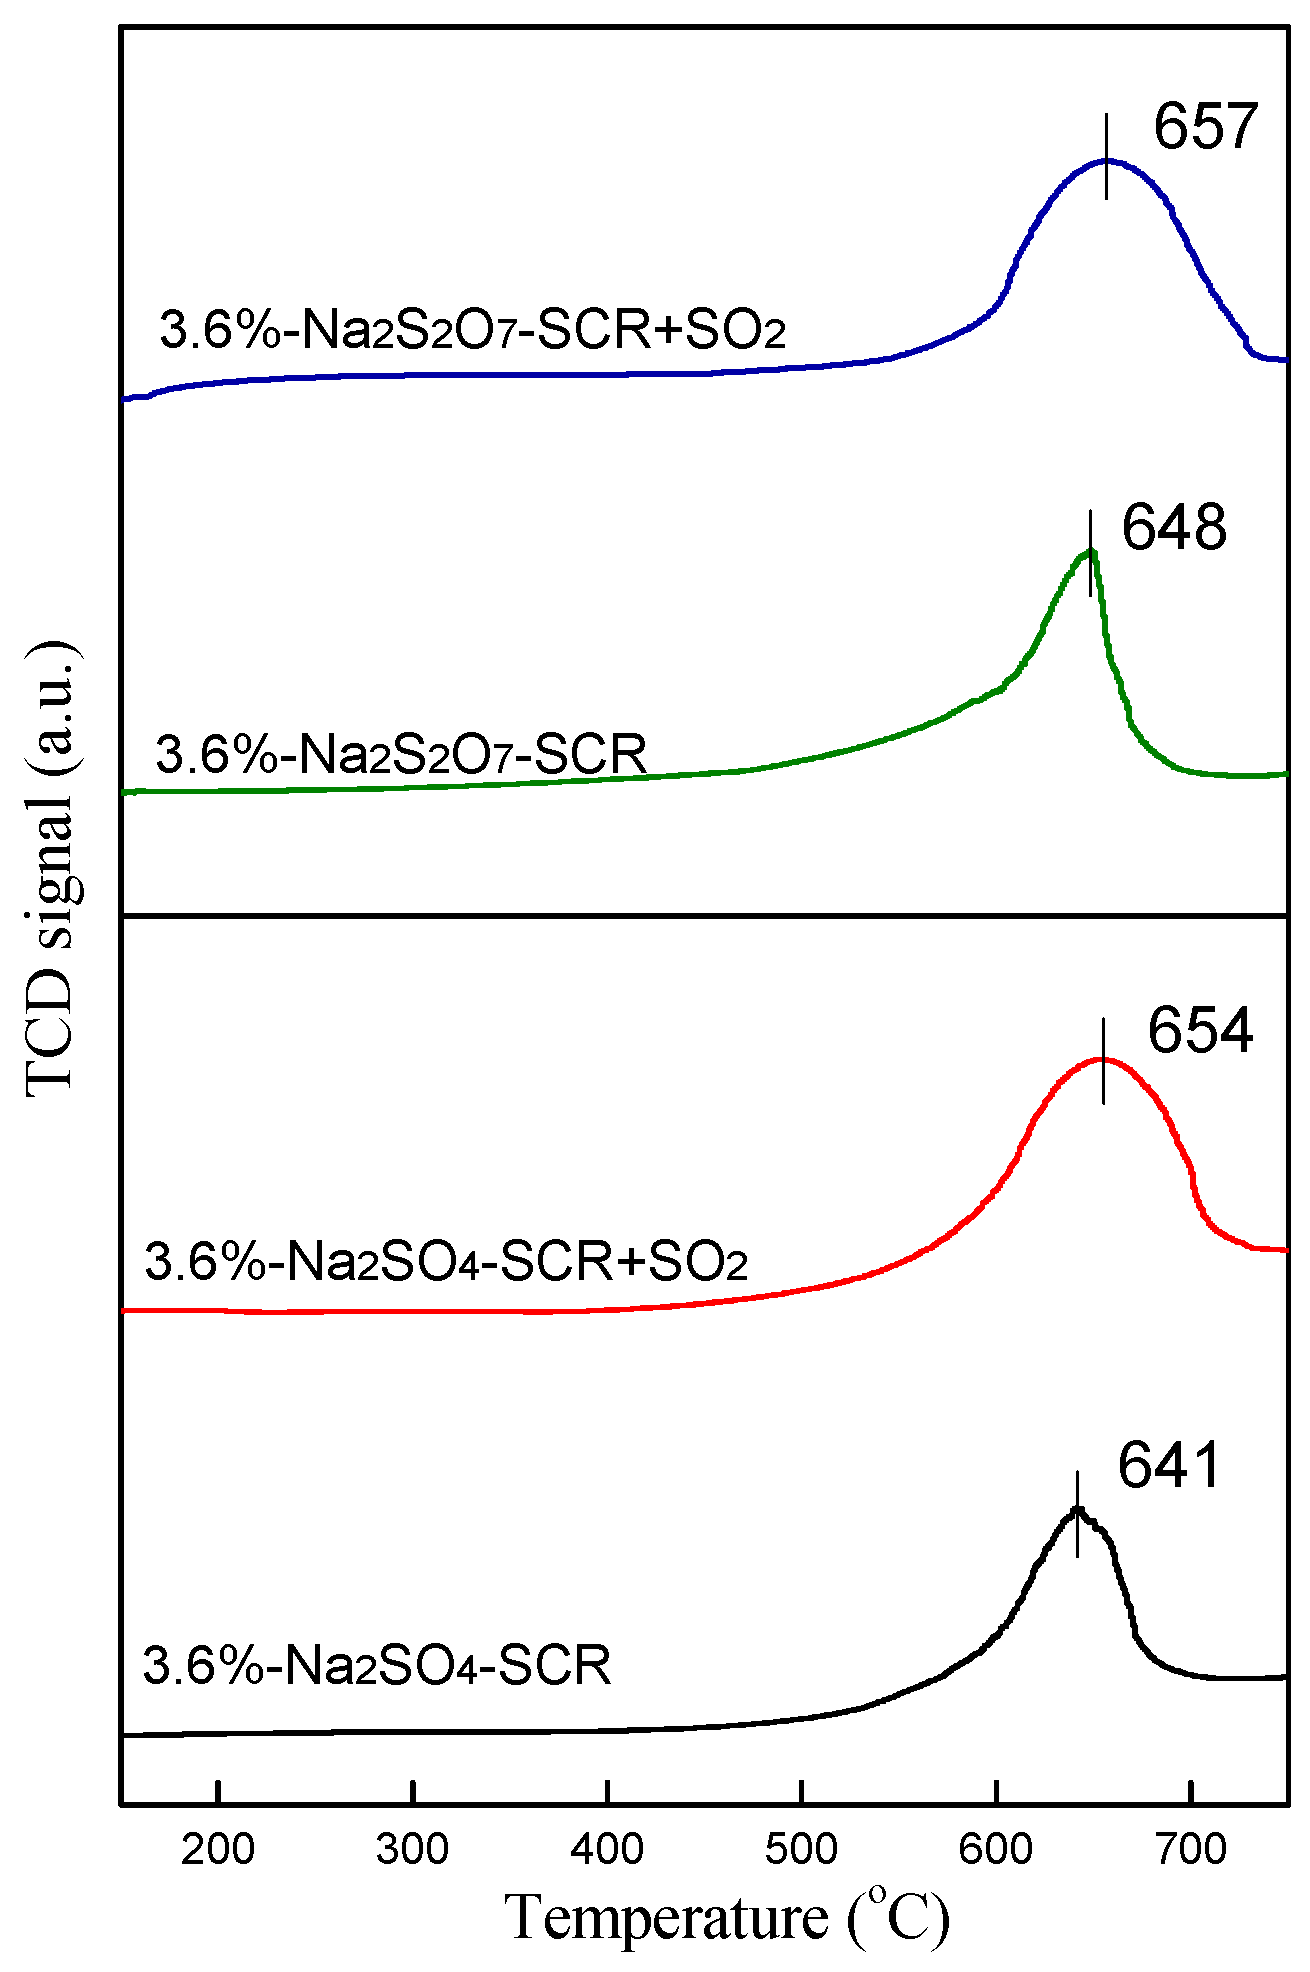
2.1.2. Effect of SO2 on SO3 Generation

Figure 2 shows the effect of SO2 concentration on both SO2–SO3-conversion and SO3 concentration for different catalysts. It shows that the SO3 concentration generated with all catalysts used increases gradually. However, it does not increase linearly and a turning point can be identified. SO2–SO3-conversion decreases with increasing SO2 concentration. When the SO2 concentration is 3000 ppm, the SO3 generation concentration for 3.6%-Na2S2O7-SCR increases to 23 ppm. However, the SO2–SO3-conversion is only 0.77%. Therefore, the concentration of SO3 should also be considered. In high concentration SO2 flue gas, the diffusion rate of SO2 is much larger than the reaction rate. Consequently, the main factors in determining the SO2–SO3-conversion are the SO2 oxidation process and the active sites of the catalysts. According to the Le Chatelier’s principle, the concentration of the reactant increases. This results in a shift of the equilibrium to the positive reaction direction in the reversible reaction. Hence, the increased reactant further reduces. But the reactant cannot be completely converted. Consequently, the increase of SO2 is greater than the reacted amount of SO2. This results in the decrease of SO2–SO3-conversion. However, increasing SO2 can also inhibit the decomposition of SO3 which can result in the growth of SO3 concentration [29]. The addition of Na2S2O7 causes less reduction in the catalyst activity than addition of Na2SO4. Hence, the SO3 concentration of the Na2S2O7 poisoned catalyst is higher than Na2SO4 poisoned catalyst at the same temperature. As far as the catalyst is concerned, the limited active sites on the catalyst surface restrict the adsorption of SO2. This results in low SO2–SO3-conversion at high SO2 concentrations [30].

2.2. Performance of Different Catalysts

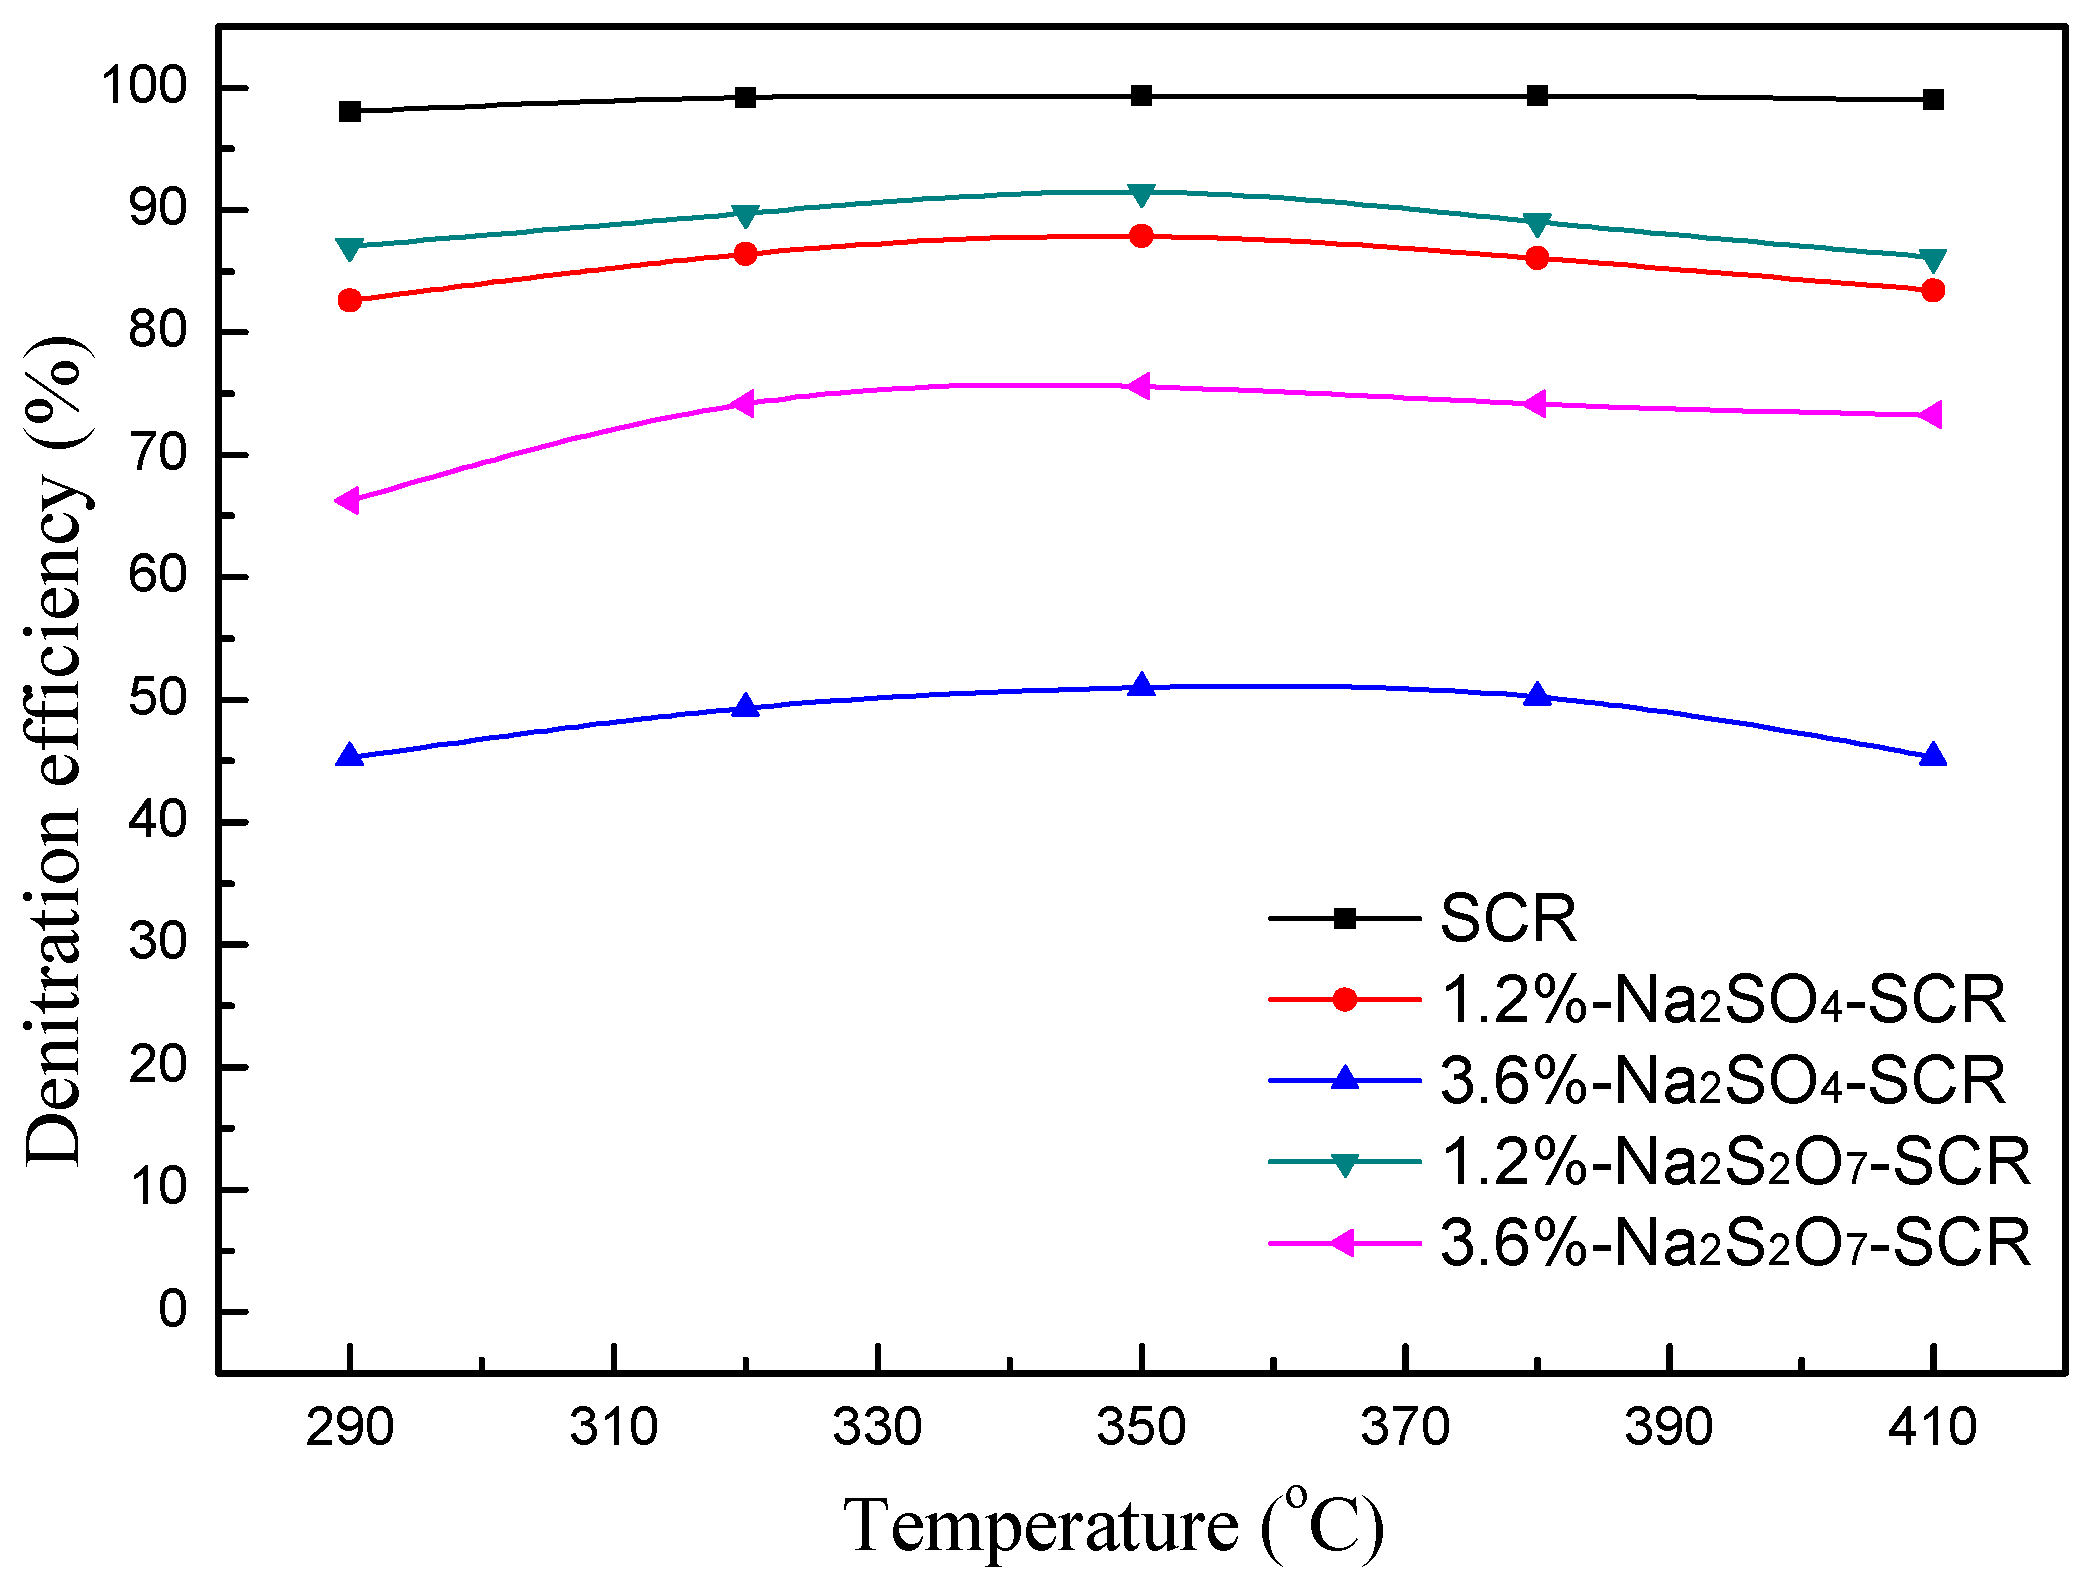
2.2.1. Effect of Temperature on NO Conversion

The denitration efficiency curves for different catalysts at different temperatures are shown in Figure 3. The pure catalyst has a wide range of activity temperature and exhibits favorable denitration performance. The efficiency remains above 95% over the entire temperature range considered and reaches 99.33% at 350 °C. The addition of sodium salts results in the deactivation of catalysts. The activity sequence is as follows: SCR > 1.2%-Na2S2O7-SCR > 1.2%-Na2SO4-SCR > 3.6%-Na2S2O7-SCR > 3.6%-Na2SO4-SCR. The denitration efficiency decreases with the increase of sodium salt loading. It initially increases but then decreases with increasing temperature. For 1.2%-Na2SO4-SCR and 1.2%-Na2S2O7-SCR, the denitration efficiency decreases slightly but remains above 80% (reaching 87.86% and 91.49% at 350 °C, respectively). When the loading increases to 3.6%, the denitration efficiencies of Na2S2O7 and Na2SO4 poisoned catalysts drop to 75.57% and 50.97% at 350 °C, respectively. Overall, the degree of poisoning of Na2SO4 is higher than Na2S2O7 under equal loading. Therefore, the degree of poisoning of catalysts is also related to the form of sodium salts used. For instance, S2O72− can provide more Brønsted acid sites and has stronger oxidizability than SO42−. This results in more NH3 being adsorbed which promotes NO reduction [31].

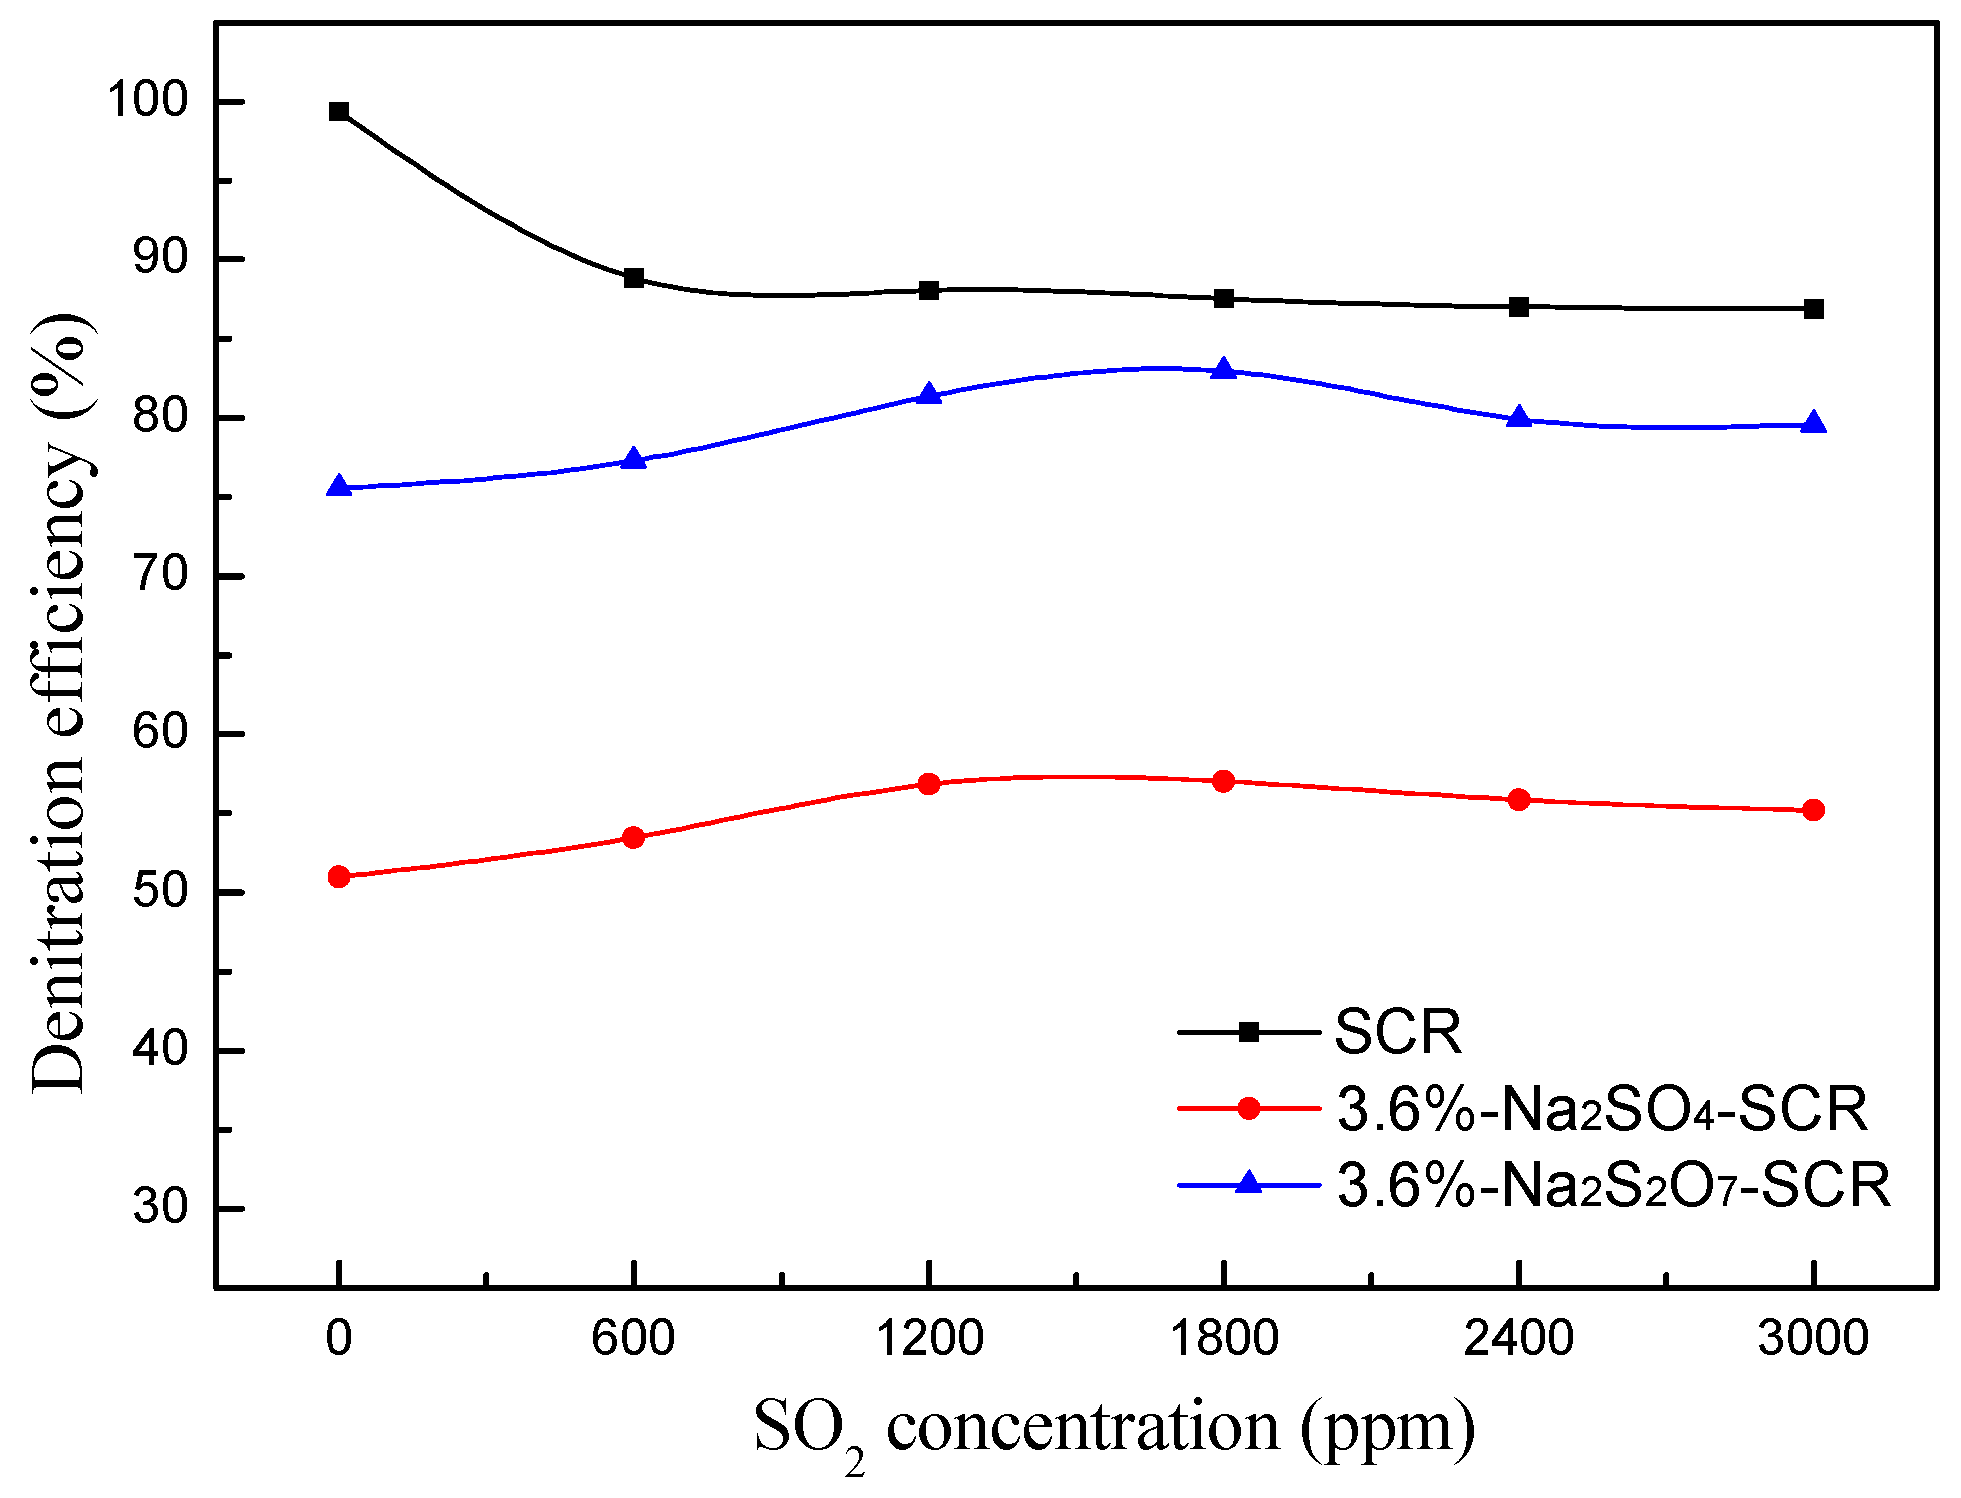
2.2.2. Effect of SO2 on NO Conversion

The influence of SO2 concentration on the denitration efficiency of different catalysts is shown in Figure 4. The denitration efficiency of pure catalysts remains approximately constant after initially decreasing from 99.33% to 88%. The 3.6% Na2SO4 and Na2S2O7 poisoned catalysts initially increase before decreasing and then plateauing. The denitration efficiencies (when SO2 concentration is 1800 ppm) of catalysts poisoned with 3.6% Na2SO4 and 3.6% Na2S2O7 reach maximum values of 57.03% and 82.95%, respectively. Wu et al. [32] examined pure catalysts after the introduction of SO2 and found that a large amount of Lewis acid sites on the catalyst surface were covered by ammonium sulfate. This weakened the adsorption of NH3 and NO by the catalyst. Anstrom et al. [33] and Zhu et al. [34] suggested that due to the addition of SO2, NO, and SO2 competed for adsorption on the catalyst surface. This would explain why the adsorption amount of NO was reduced and the denitration efficiency was lowered. For catalysts poisoned with Na salts, Hu et al. [20] concluded that the anions from the sodium salt provided more acidic sites and V–O–S bonds. This was found to promote the catalytic oxidation of SO2 and enhance the adsorption capacity of NH3. Consequently, the denitration efficiency improved. The amount of acid sites on the catalyst surface began to decrease when the concentration of SO2 in the flue gas was increased to a certain extent. The adsorption of SO2 on V2O5 resulted in the formation of an intermediate structure, namely VOSO4. This then reduced the V5+ concentration for the SCR reaction, which caused the denitration efficiency to decrease.

2.3. Catalyst Characterization

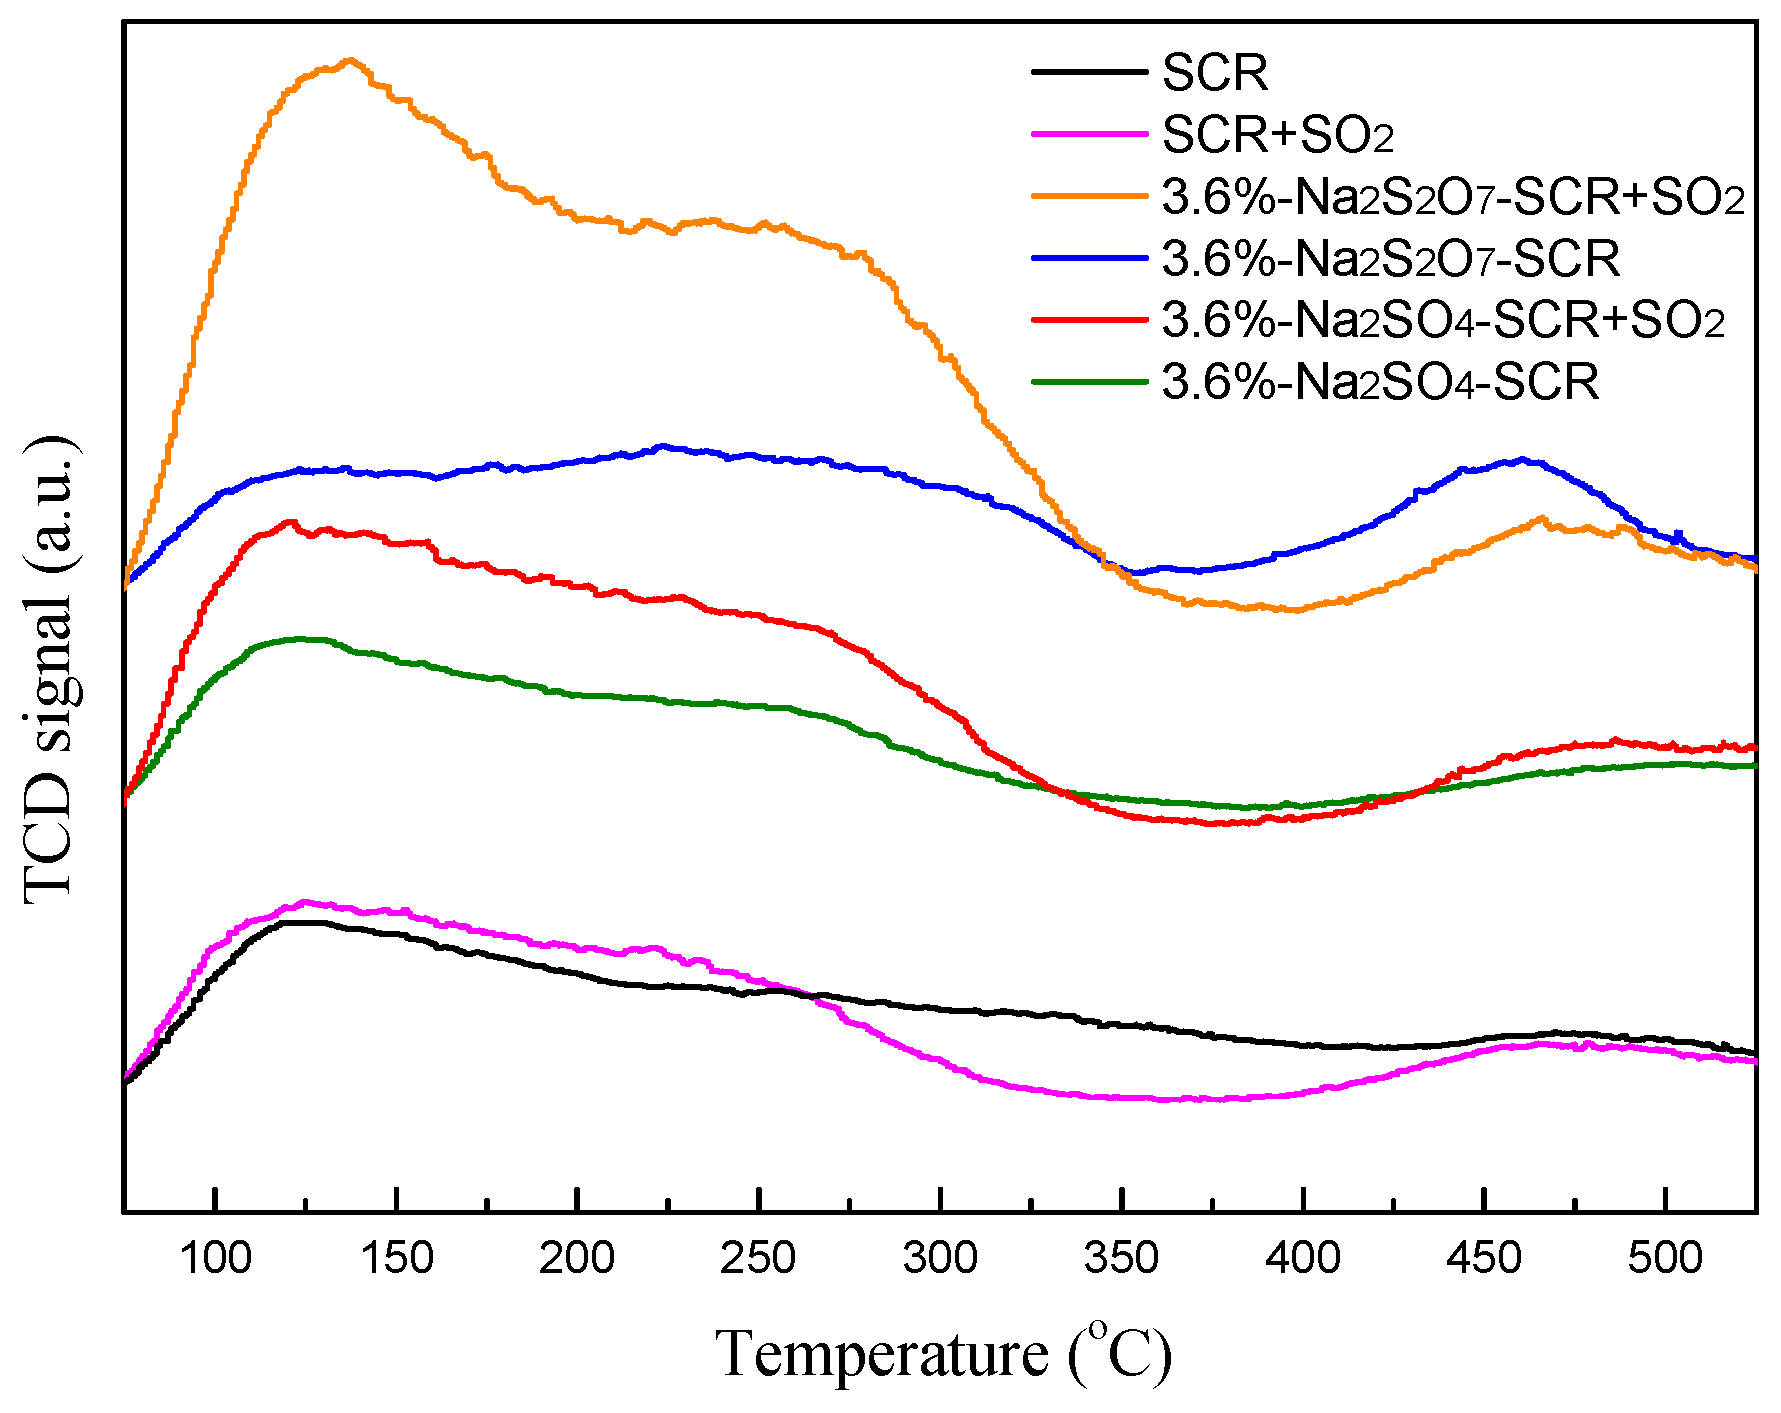
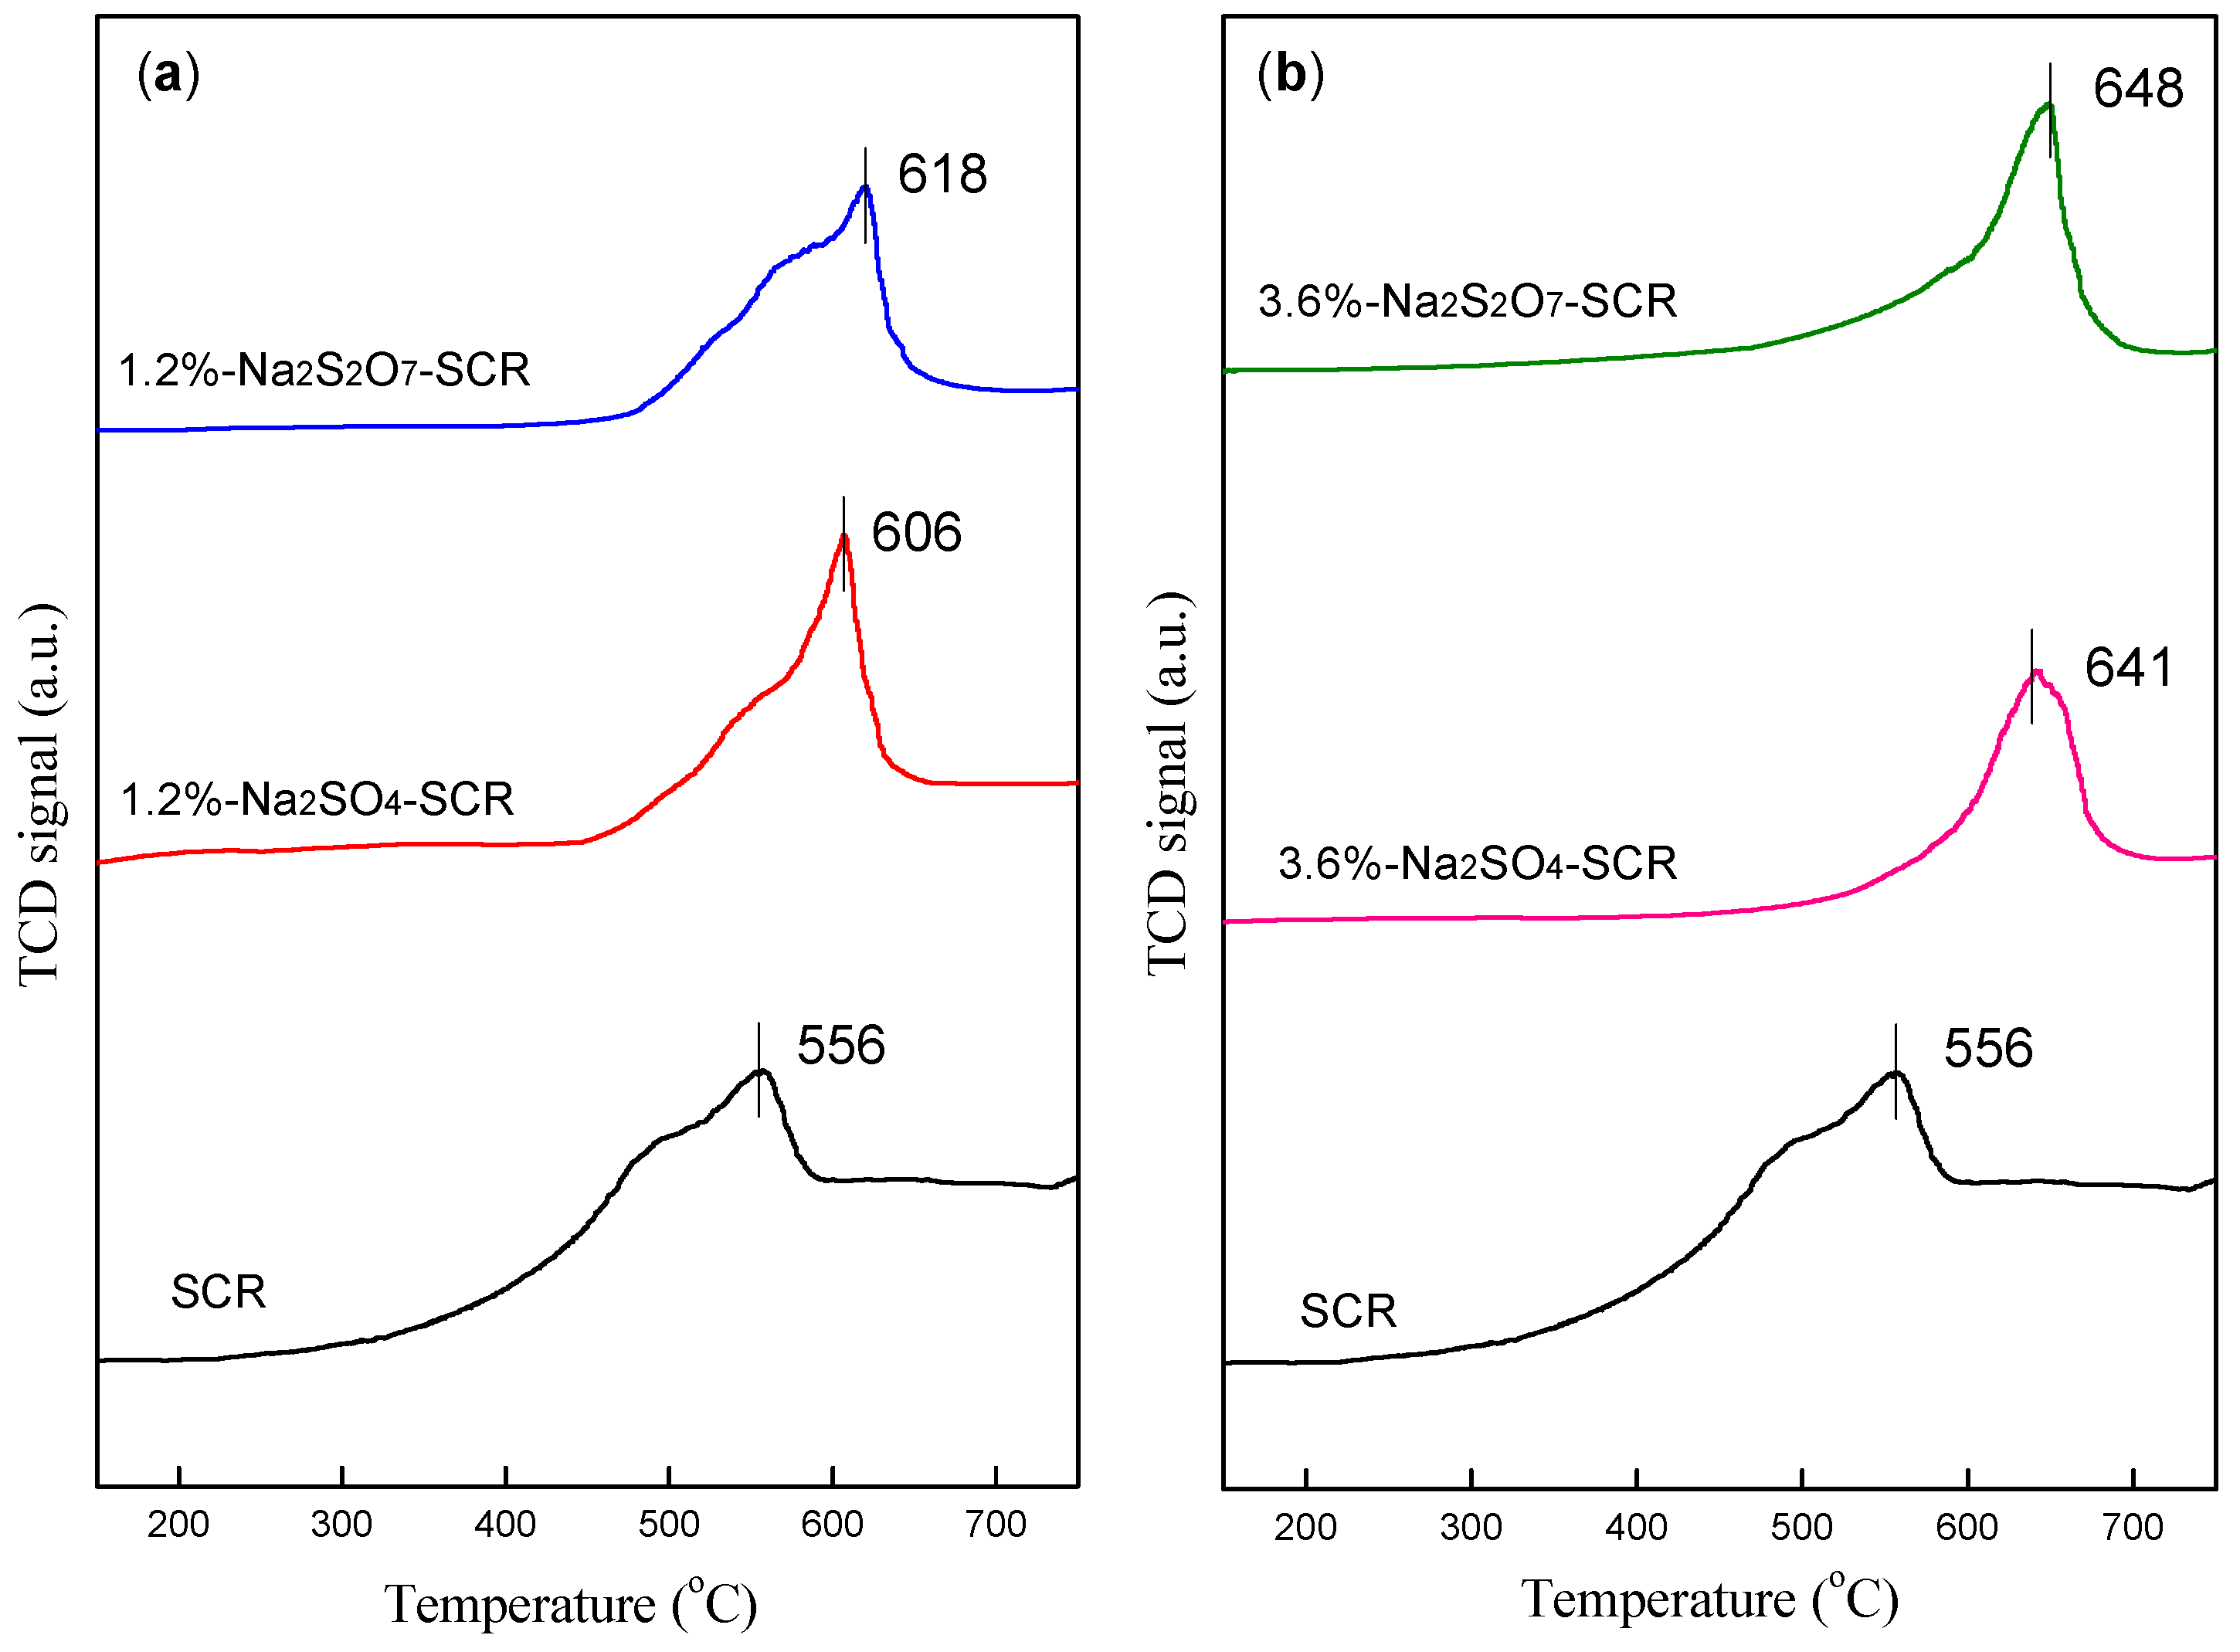
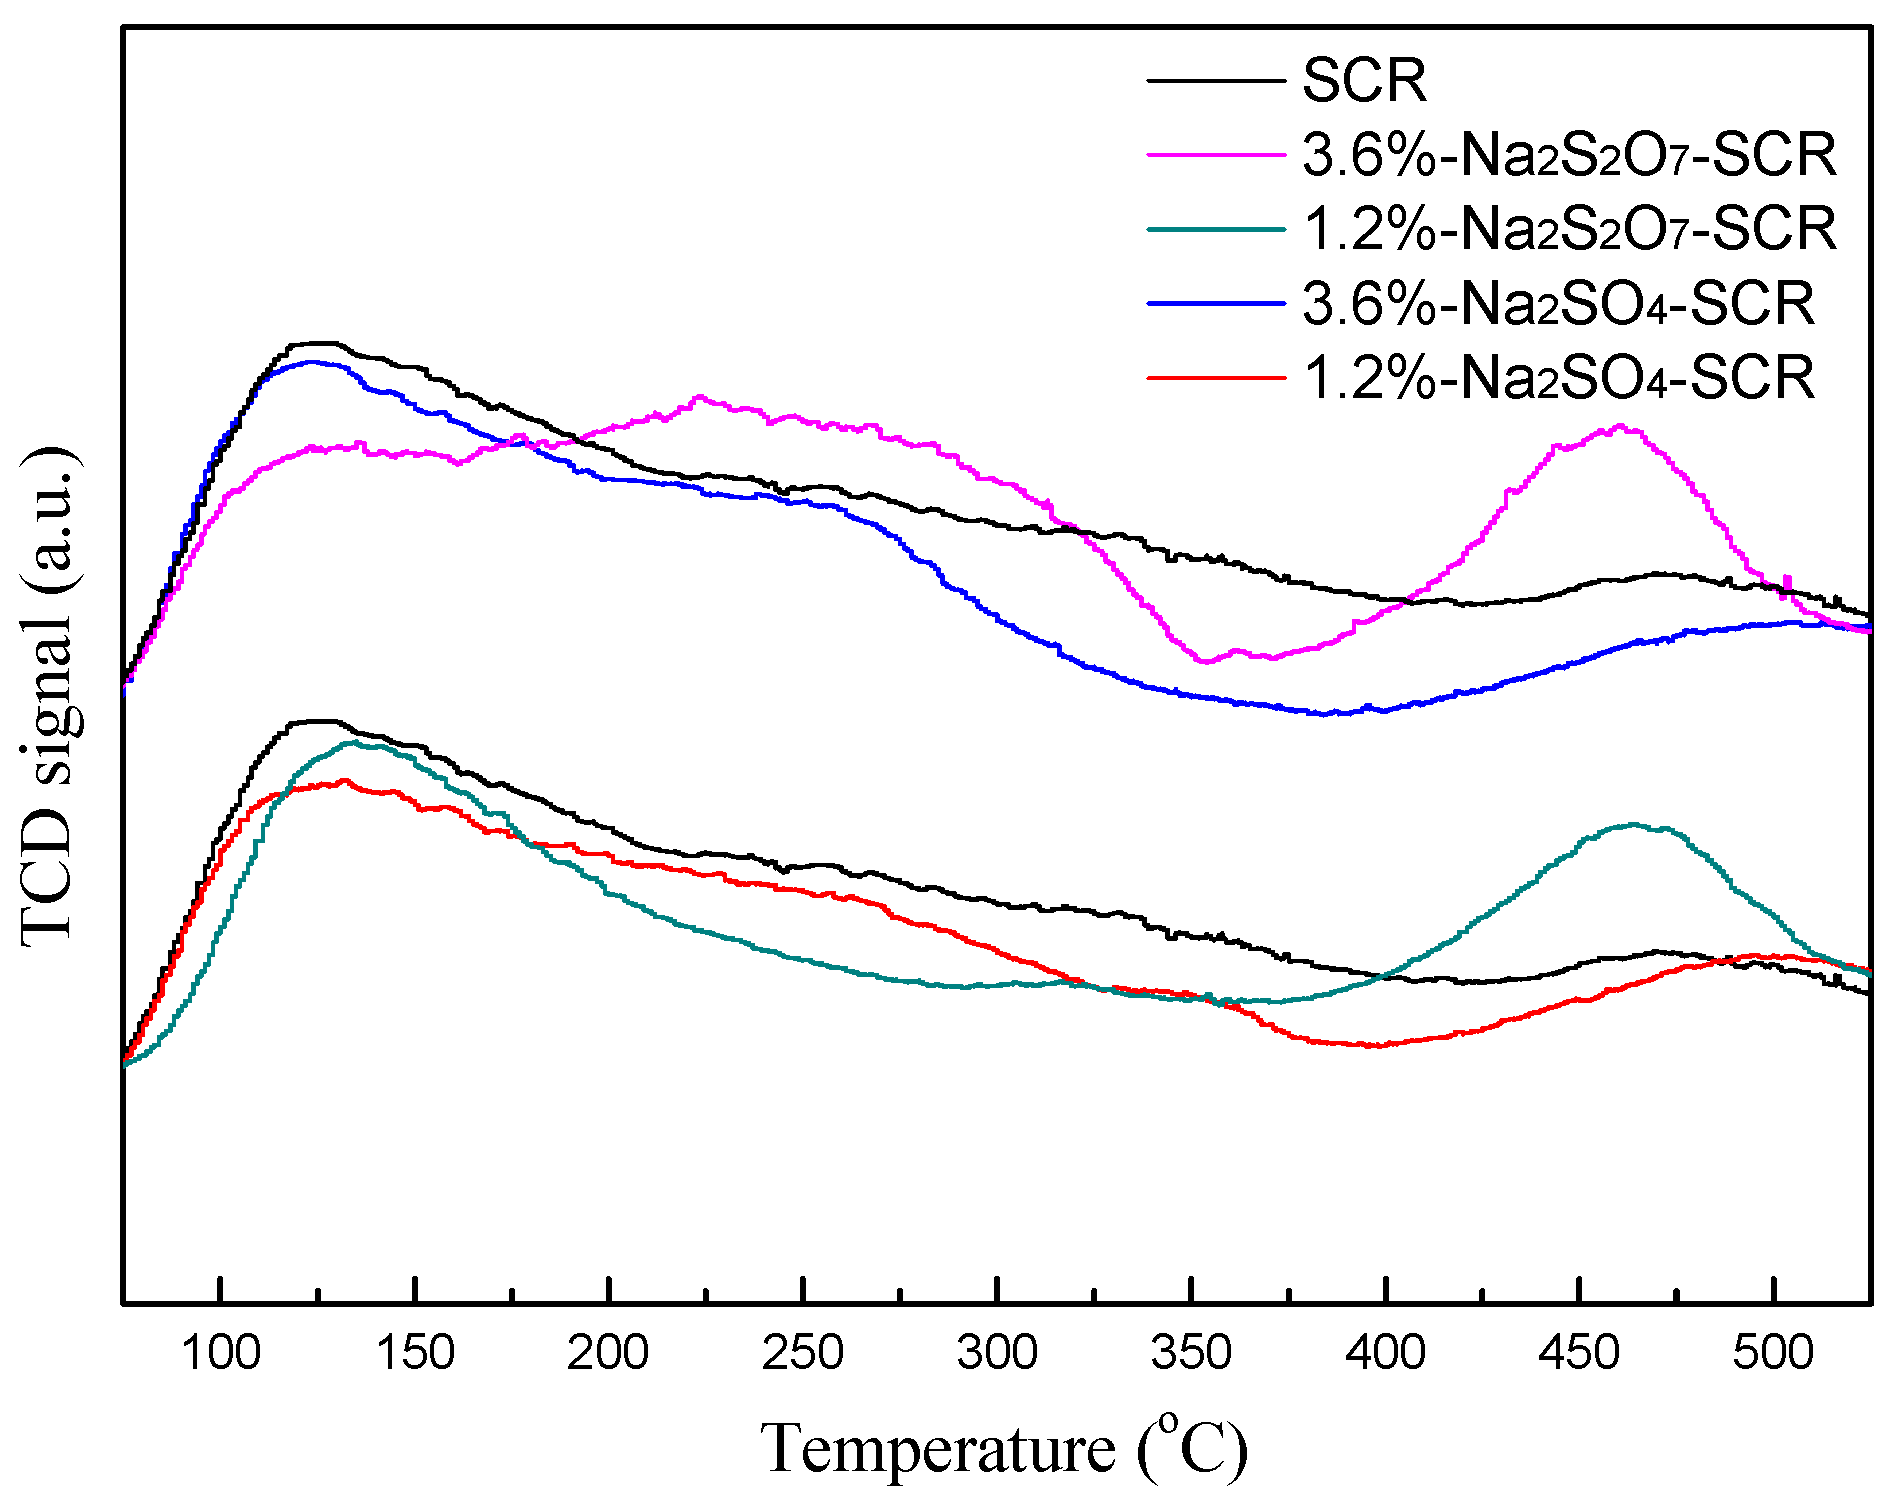
2.3.1. NH3-TPD and H2-TPR Analysis
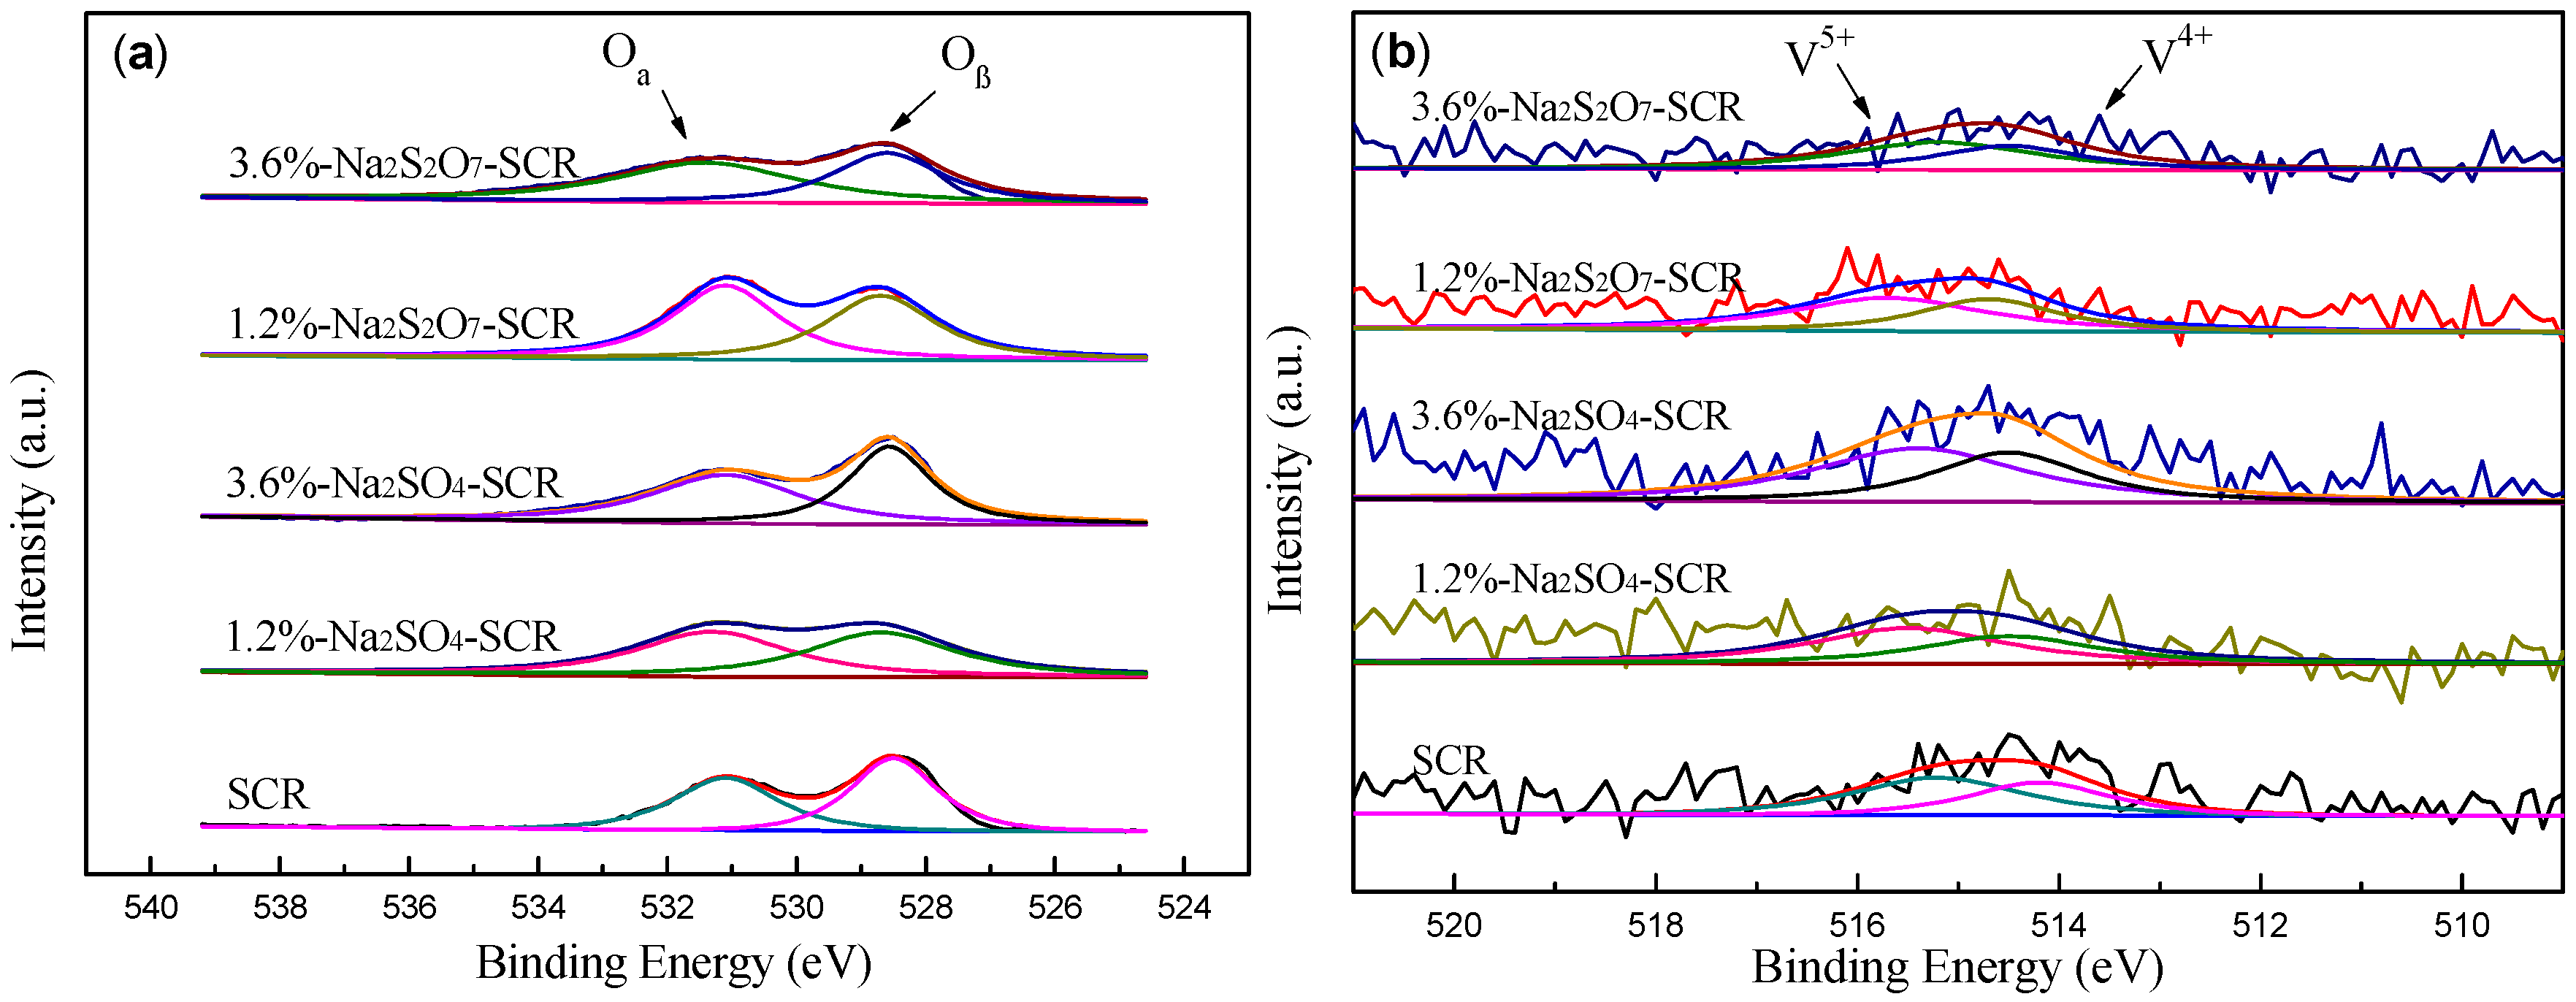
The adsorption capacity of NH3 on the acid sites indicates the activity of the catalyst. Therefore, the NH3-TPD experiment was conducted. The spectrum obtained can indicate the strength and acidity of the acid center. The larger the area of the desorption peak, the higher the corresponding acid concentration. The higher the peak temperature is, the greater the corresponding acid strength will be. Figure 5 shows the NH3-TPD patterns of different catalysts. It is generally believed that the desorption peak below 200 °C corresponds to the desorption of physisorbed NH3, the desorption peak in the range of 200 to 350 °C corresponds to the weakly chemisorbed NH3, and the desorption peak between 350 and 500 °C corresponds to the strongly chemisorbed NH3 [35,36]. For 1.2% and 3.6% Na2SO4 poisoned catalysts, NH3 adsorption decreased most noticeably. For 1.2% and 3.6% Na2S2O7 poisoned catalysts, the amount of physisorbed NH3 reduces between 100 and 200 °C. In contrast, the amount of strongly chemisorbed NH3 significantly increased between 350 to 500 °C. According to Zheng et al. [37], this increase can be attributed to the catalyst surface being sulfated through the addition of Na2S2O7. The traces of these compounds remaining on the surface of catalysts can provide strong acid sites, which is beneficial to the adsorption of NH3. Chang et al. [13] have shown that Na preferentially coordinated on V–OH bonds and V–O–H was replaced by V–O–Na after addition of alkali metals. This resulted in a reduced number of acid sites and lower catalytic activity. The reaction formulas are as follows:
V OH + Na 2 SO 4 V O Na + NaHS O 4
V OH + NaHS O 4 V O Na + H 2 S O 4
V OH + Na 2 S 2 O 7 V O Na + NaH S 2 O 7
V OH + NaH S 2 O 7 V O Na + H 2 S 2 O 7
Figure 6 shows the NH3-TPD curves of different catalysts when the SO2 concentration is 0 and 1800 ppm. The desorption of the physisorbed and weakly chemisorbed NH3 on the poisoned catalyst surfaces increased significantly after the introduction of SO2. This improved the denitration performance of the catalyst to some extent. Giakoumelou et al. [38] noted that the introduction of SO2 led to the formation of more SO42− on the poisoned catalyst surface. SO42− can adsorb more NH3 in the form of NH4+ on the catalyst surface to react with NO in the flue gas. For the pure catalyst, the desorption of physisorbed NH3 increased slightly and the peak area (ranging from 250 °C to 450 °C) clearly decreased. This was unfavorable to denitration performance. After the introduction of SO2, the denitration efficiency of the pure catalyst is mainly attributed to the competitive adsorption between SO2 and NO [39]. This agrees with the experimental results.
The redox performance of the catalyst accounts for another important factor in catalytic reduction. The lower the temperature corresponding to the reduction peak is, the easier the catalytic redox reaction of the catalyst will be. Peak area represents H2 consumption. To test the impact of sulfur-containing sodium salts poisoned catalysts on the redox performance, the H2-TPR was carried out and the experimental results are shown in Figure 7. The reduction peak temperature of the pure catalysts appeared at 556 °C, which can be attributed to the reduction of V5+ to V3+. After the addition of sodium salts, the reduction peak temperature of the catalysts increased. This indicates that sodium salts poisoned catalysts decreased the oxidizability. Chen et al. [40] suggested that the interaction of sodium salts with V species hindered the release of lattice oxygen in the catalyst, making V species more difficult to be reduced. The temperature shifted towards higher values with the increased loading. However, the reduction peak temperatures of the Na2SO4 and Na2S2O7 poisoned catalysts with the same loading were very similar. The H2 consumptions were 0.251, 0.897, 1.614, 2.690, and 4.698 mmol/g for pure catalyst, 1.2% Na2SO4, 1.2% Na2S2O7, 3.6% Na2SO4, and 3.6% Na2S2O7 poisoned catalyst, respectively. The H2 consumption significantly increases for sodium salts poisoned catalysts. In particular, the Na2S2O7 poisoned catalyst is 1.8 times higher than Na2SO4 poisoned catalyst with the same loading. This is because S2O72− has stronger oxidizability than SO42−.
Figure 8 shows the H2-TPR curves of 3.6% Na2SO4 and Na2S2O7 poisoned catalysts when the SO2 concentration is 0 and 1800 ppm. The reduction peak temperature shifted towards the higher end after addition of SO2, which decreased the denitration performance of the catalyst. However, the H2 consumption also increased to 3.120 and 5.129 mmol/g, respectively. Yu et al. [41] considered that the introduction of SO2 made the surface of the poisoned catalyst sulfated, increasing the catalytic performance of the poisoned catalyst. However, this is not the only influence factor for catalytic performance based on catalytic performance results.

2.3.2. XPS Analysis

The chemical species and surface atomic concentration of several major elements were analyzed using X-ray photoelectron spectroscopy (XPS). Table 1 shows the atomic concentrations on the catalyst surface. Figure 9 shows the spectra of O1S and V2P, respectively. Table 2 shows the states of O and V on these catalyst surfaces. Table 1 shows that with increasing loading of sodium salts, the atomic concentration of the active component on the catalyst surface significantly decreased. This result is consistent with the XRD measurement, indicating that sodium salts interacted with the active component of the catalyst.
As shown in Figure 9a, the spectra of O1S were divided into two peaks. The peak corresponding to 531.0–531.6 eV was attributed to surface chemical adsorption oxygen (defined as Oα). The peak corresponding to 528.4–528.7 eV was attributed to lattice oxygen (defined as Oβ) [42,43]. The concentration ratio of chemical adsorption oxygen (Oα/(Oα+Oβ)) was computed using peaking software, which is shown in Table 2. The sodium salts poisoned catalysts increased chemical adsorption oxygen content on the catalyst surface. However, for 1.2% and 3.6% Na2SO4 poisoned catalyst the surface oxygen concentration was lower than for other catalysts (see Table 1). Therefore, the chemical adsorption oxygen content of the Na2SO4 poisoned catalyst was low. The chemical adsorption oxygen is very active and is indispensable for oxidation reactions. There is a positive correlation between the oxidative properties of the catalyst and the surface chemically adsorbed oxygen content [44]. Therefore, the relatively high chemically adsorbed oxygen content in the sodium salt poisoned catalysts are beneficial for SO2 oxidation.
Figure 9b shows the spectra of V2P. The spectra were also divided into two peaks. The peak corresponding to 515.3–516 eV belonged to V5+. The peak corresponding to 514.0–514.6 eV belonged to V4+ [45]. Table 2 shows that the V4+ ratio was 43.6% for pure catalyst. It also shows the V4+ content of other sodium salt poisoned catalysts were reduced and the corresponding V4+/V5+ ratios decreased. Economidis et al. [46] confirmed experimentally that in the process of synthesizing the vanadium-based catalyst, V5+ partially transformed into V4+. Equivalently, the reduction of VO2+ to VO2+ occurred. The ratio of V4+/V5+ plays a pivotal role in the redox reaction of the catalyst. The denitration efficiency could be improved by appropriately increasing the ratio. However, the addition of sodium salts decreased the ratio (causing the decrease in denitration performance). This is consistent with the denitration performance test.

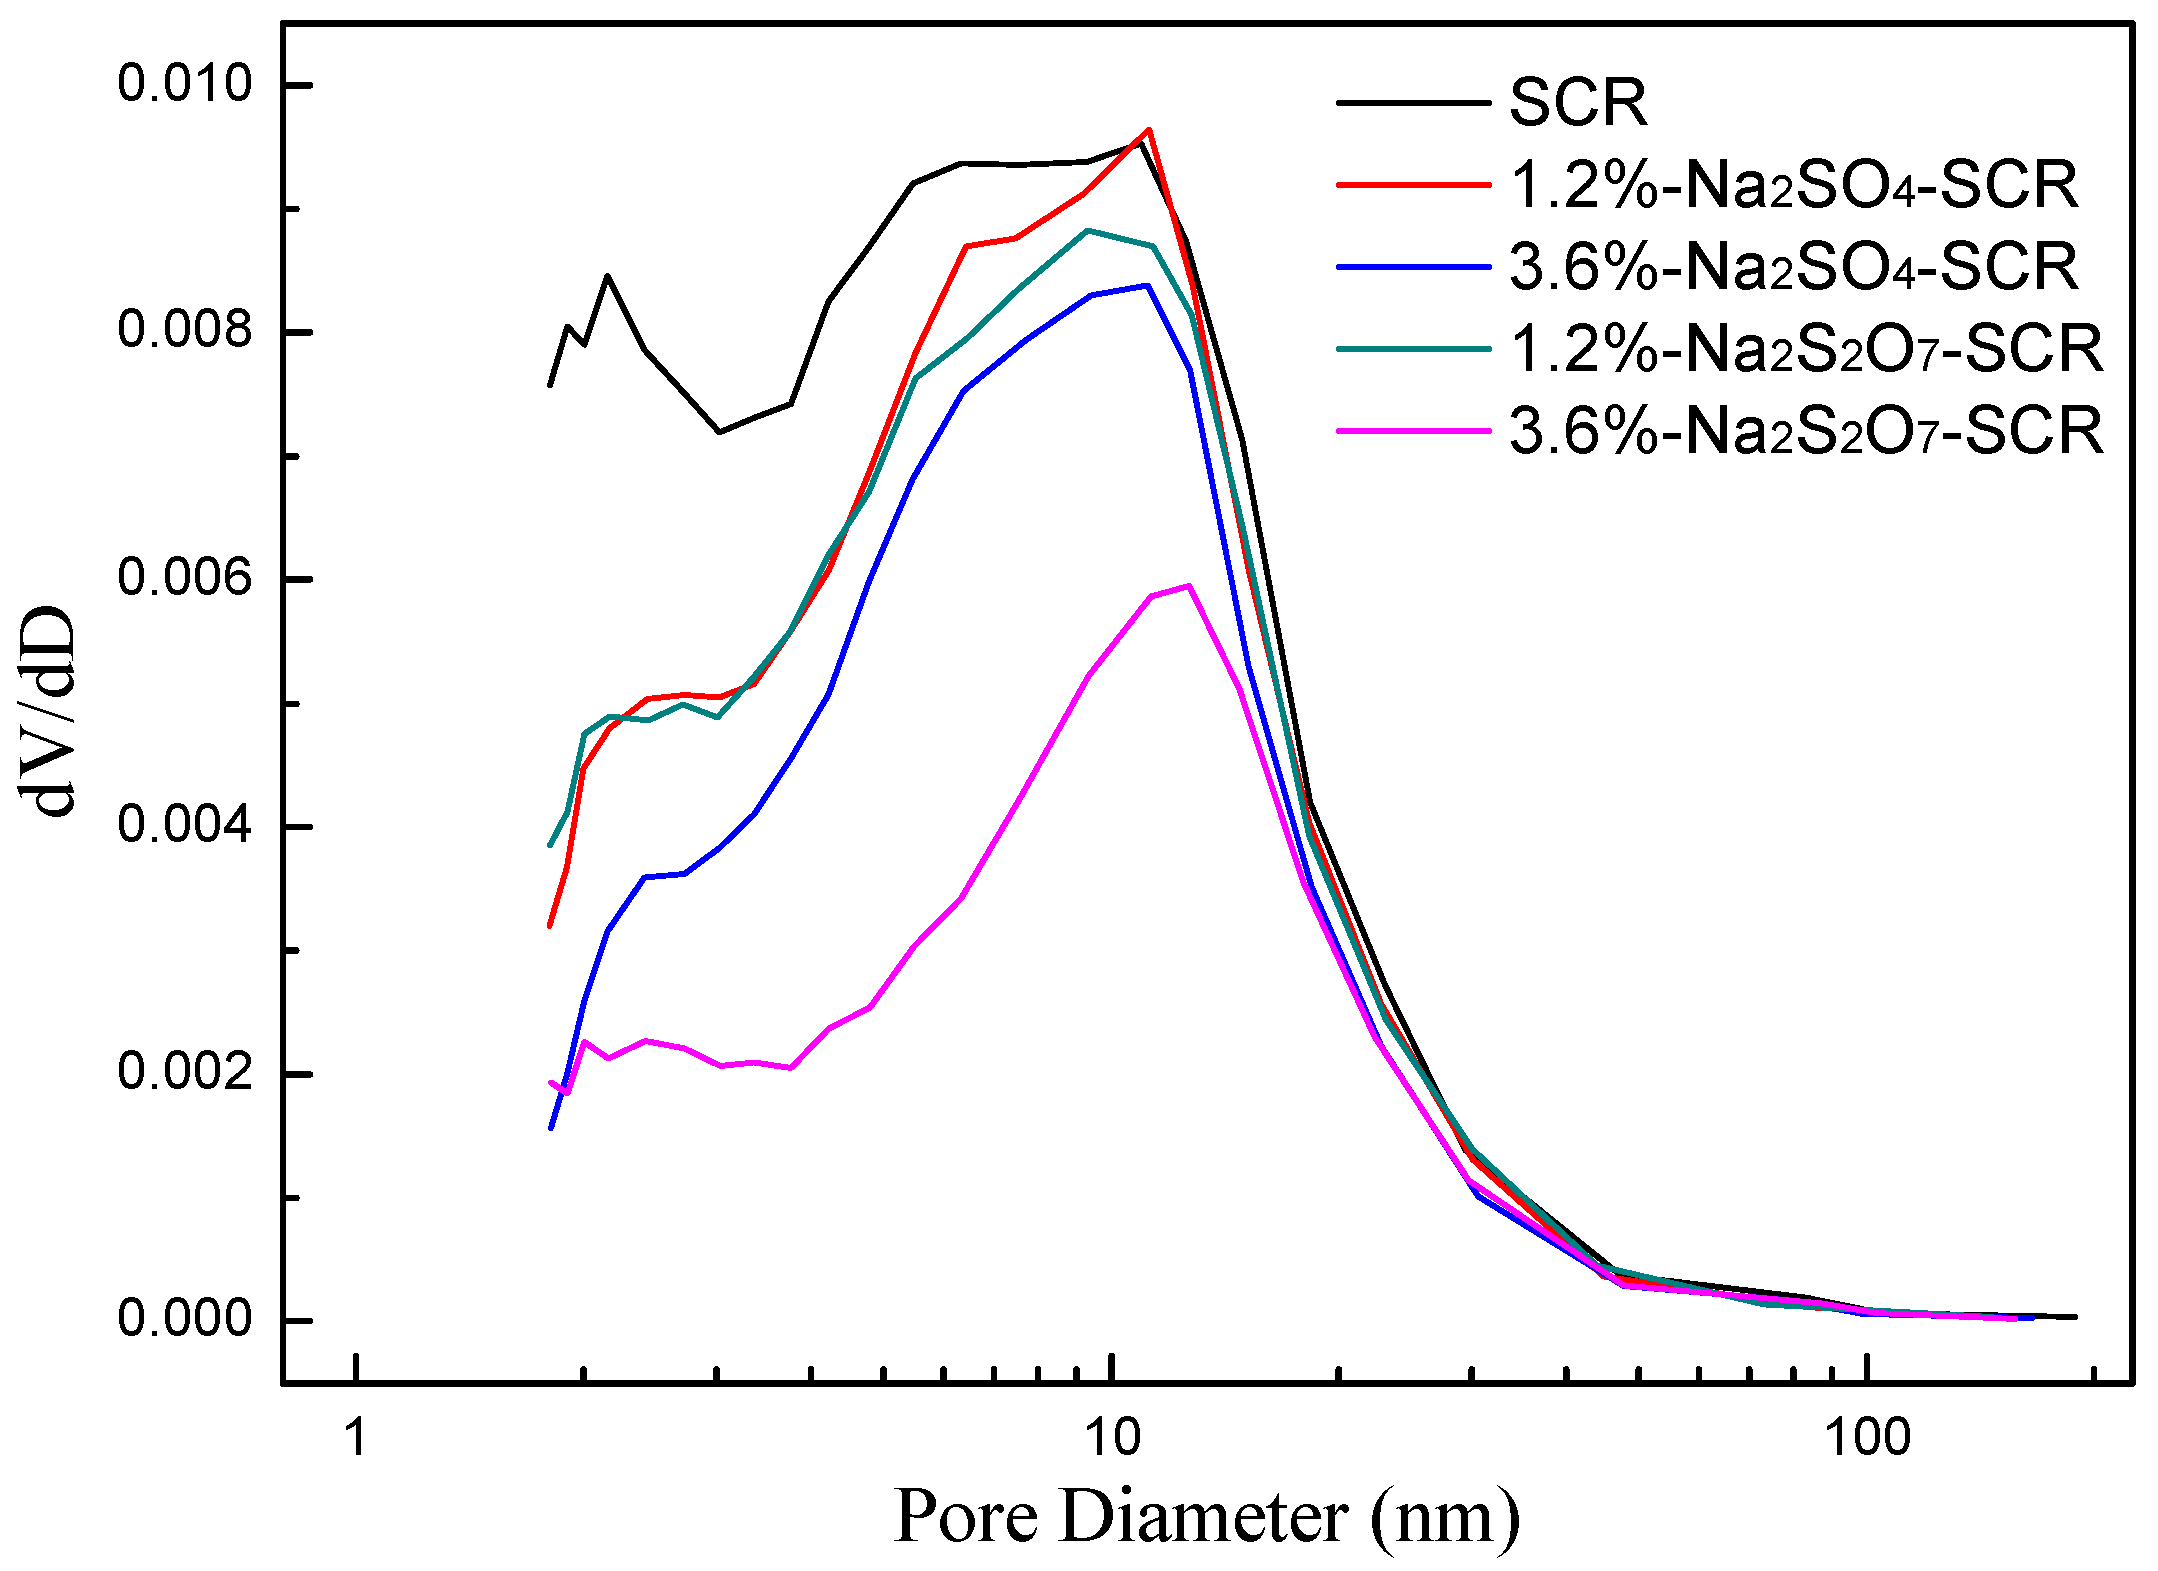
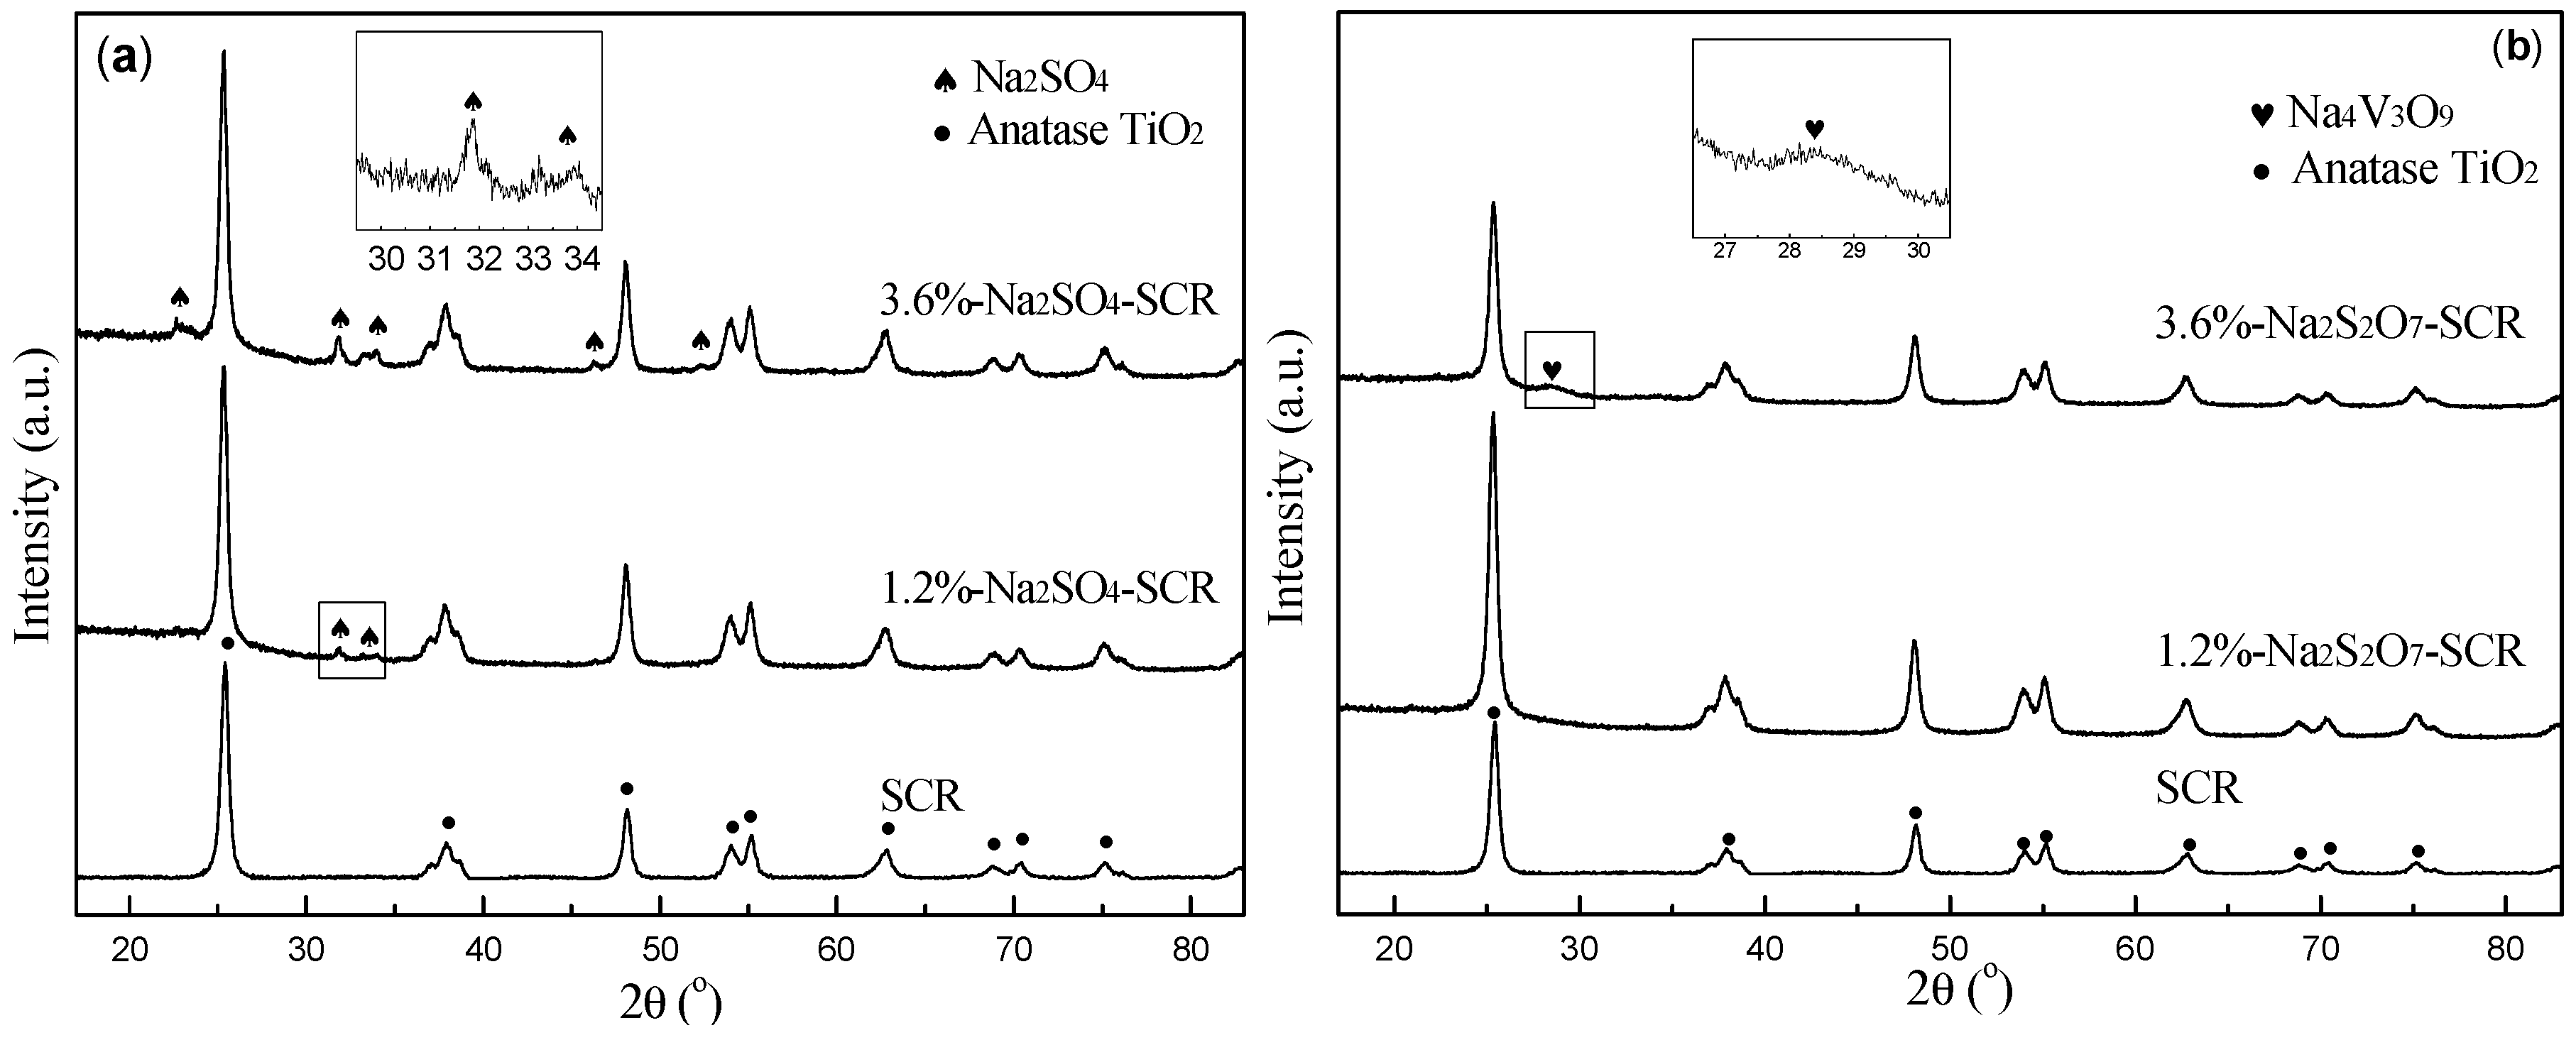
2.3.3. BET and XRD Analysis

The structural characteristics of different catalysts were determined by N2 adsorption-desorption experiments. The specific surface area and pore structure also affected the denitration performance of the catalyst to an extent. Table 3 describes the specific surface area and pore structure characteristics of different catalysts. For example, the specific surface area, pore volume and pore diameter of the pure catalyst were found to 95 m2·g−1, 0.21 cm3·g−1, and 9.3 nm, respectively. After loading with sodium salts, the specific surface area and pore volume of the catalyst significantly reduced. With increased loading, the degree of reduction increased. Na2S2O7 poisoned catalyst has a greater influence on the specific surface area and pore volume. Xiao et al. [47] suggested that sodium pyrosulfate had larger molecular size, which led to the catalyst blockage. Conversely, the pore size increased. This is because the addition of sodium salts caused the microporous blockage and the proportion of macropores consequently increased.
Figure 10 shows the Barret–Joyner–Halenda (BJH) pore size curves of different catalysts. The catalyst surface mainly contains mesopores (2–50 nm), as shown in Figure 10. The sodium salts poisoned catalyst increased the pore size compared with the pure catalyst.
Figure 11 exhibits the XRD diffractograms of different catalysts. The XRD patterns of all catalyst samples are mostly similar, which demonstrates that the addition of sodium salts did not change the basic structure of the support. However, for the 1.2% and 3.6% Na2SO4 poisoned catalyst, the diffraction peak of Na2SO4 could be detected. For the pure catalyst and 1.2% Na2S2O7 poisoned catalyst, there was no peak of V2O5 and no appearance of Na2S2O7. But for the 3.6% Na2S2O7 poisoned catalyst, the diffraction peak of Na4V3O9 could be detected. This was because some molten sodium pyrosulfate interacted with V2O5 during the preparation process. The appearance of the new peaks indicates that the accumulation of sodium salts on the catalyst surface blocked the catalyst pores and reduced the specific surface area. This was not conducive to the catalytic reaction. However, Shpanchenko et al. [48] considered that the new vanadium oxide complex Na4V3O9 had special structural and magnetic properties. It was made from isolated chains of square V4+O5 pyramids linked by two bridging V5+O4 tetrahedra. This structure had strong magnetic exchange between the V4+ along the chain, which was beneficial to catalytic performance.

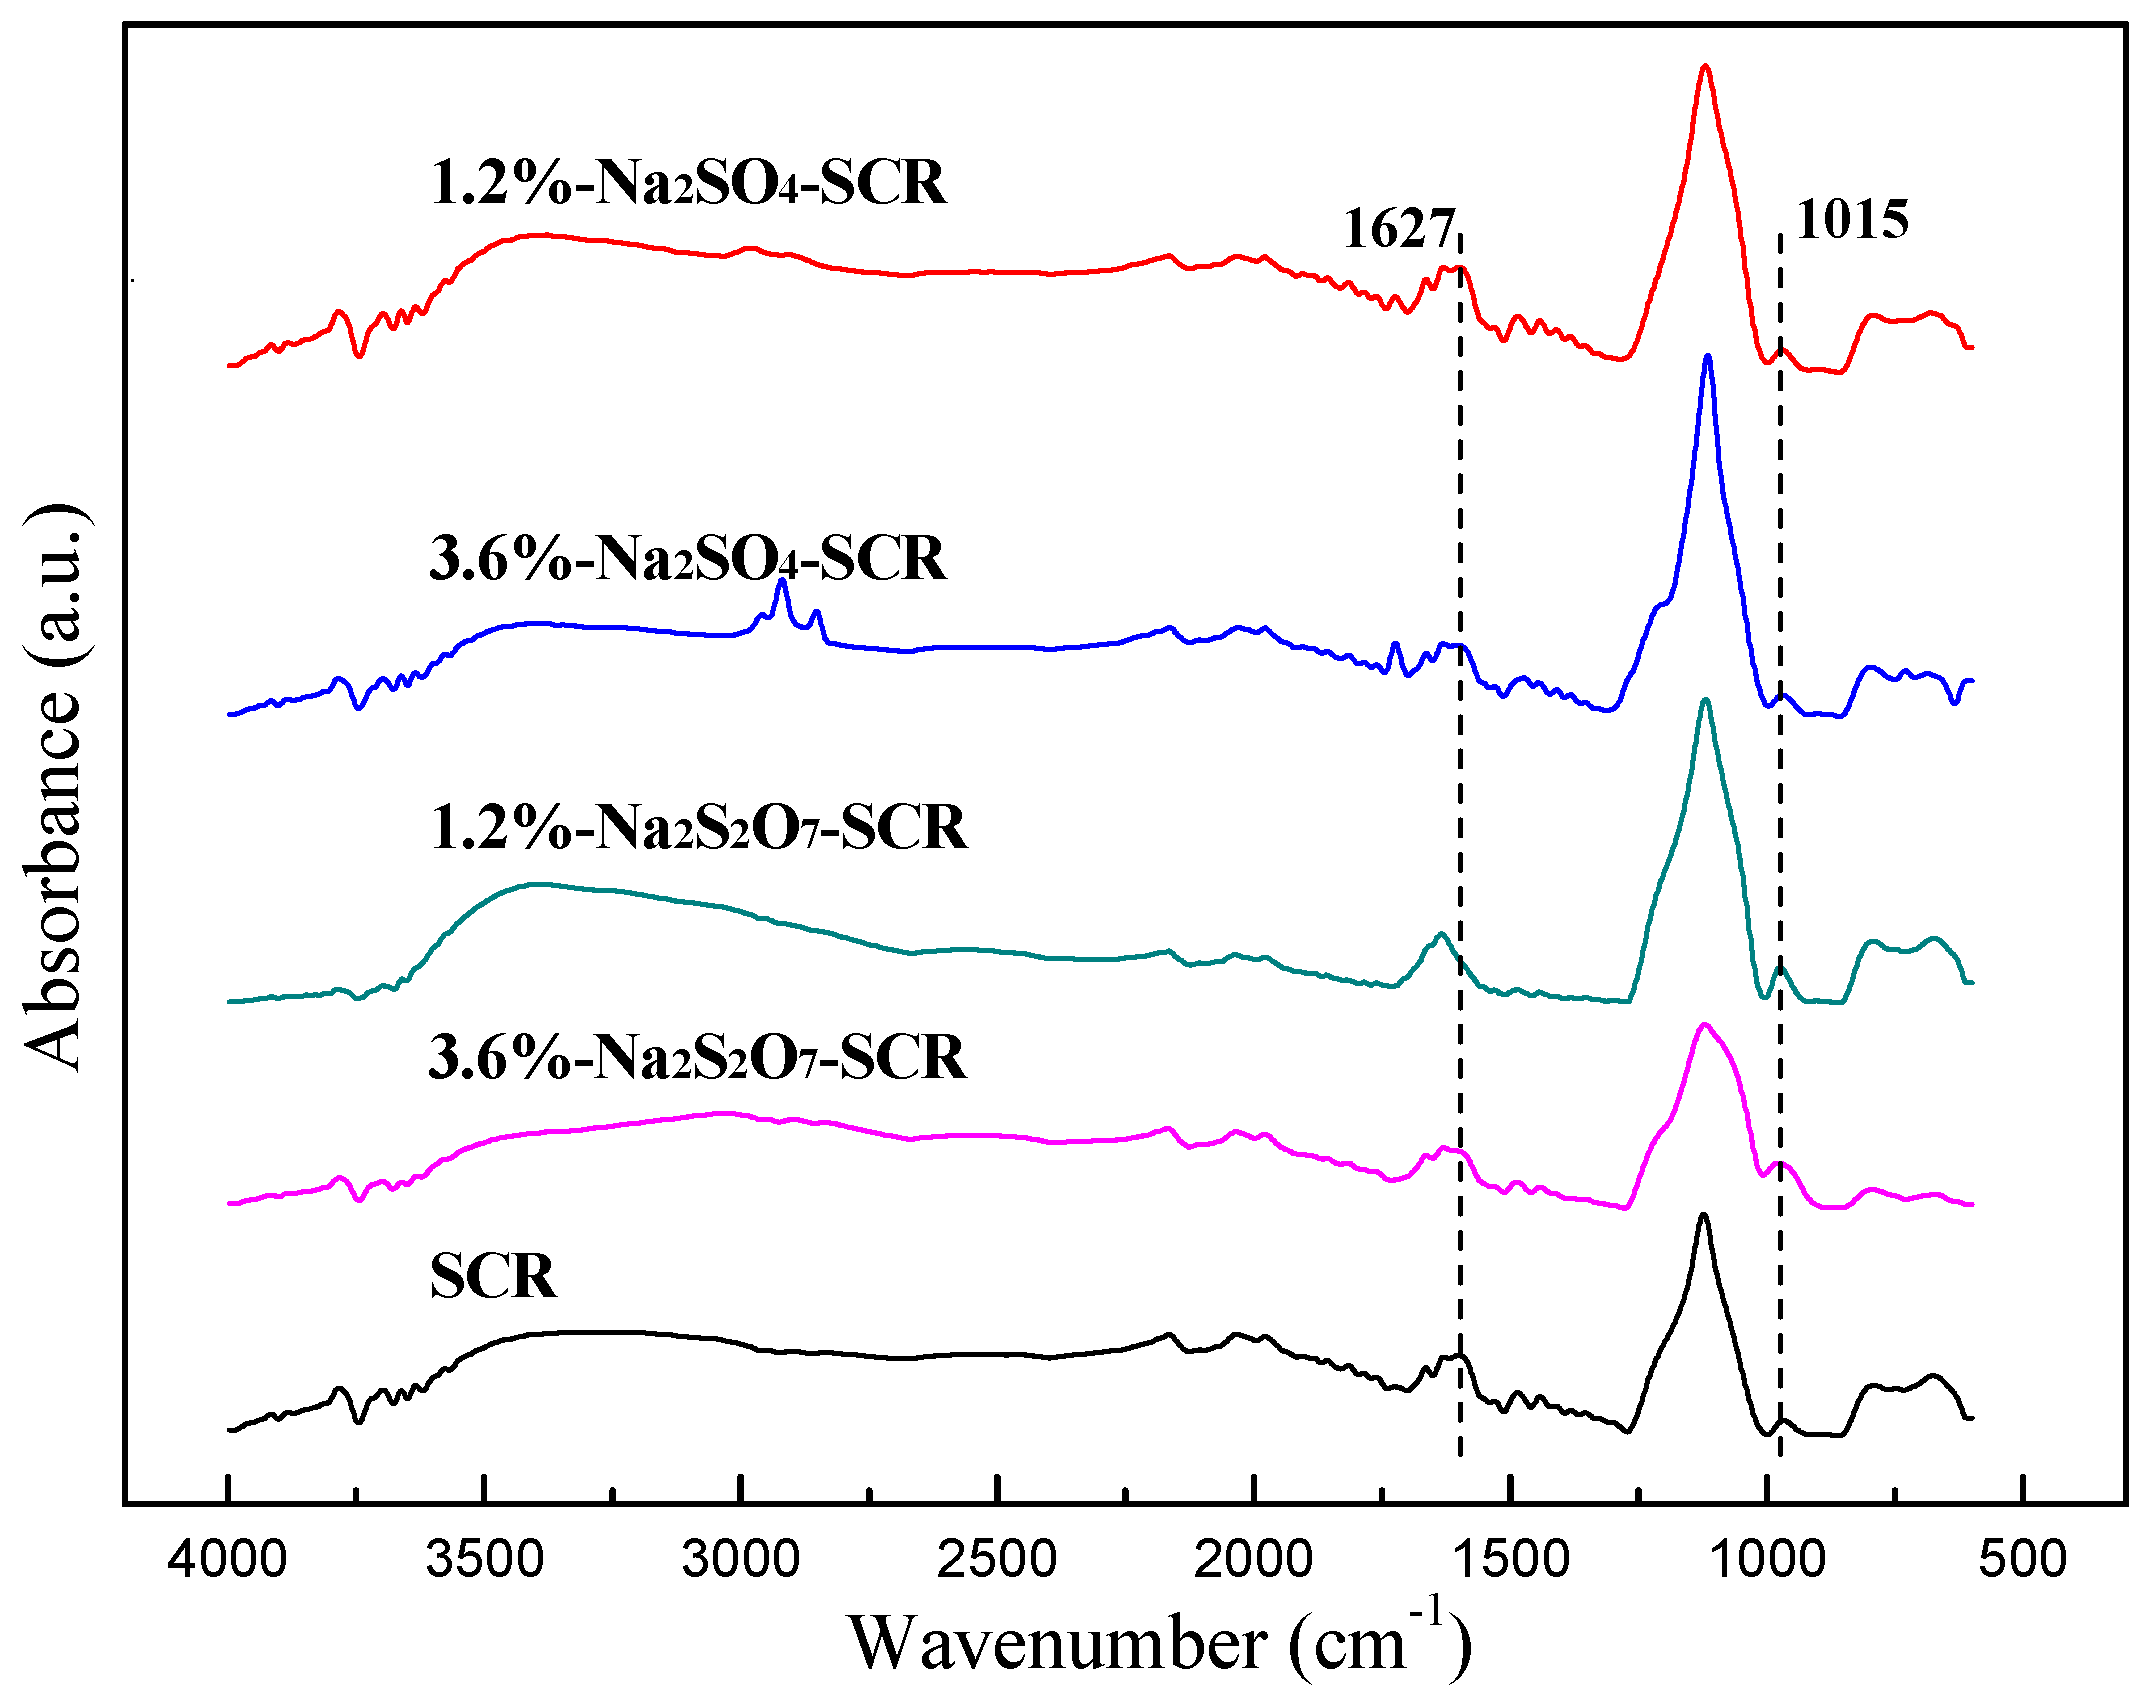
2.3.4. FT-IR Analysis

The characteristic peaks of different functional groups on different catalyst surfaces were obtained via FT-IR measurements. The results are shown in Figure 12. These catalysts exhibit two key peaks located at 1015 cm−1 and 1627 cm−1. The peak at 1015 cm−1 is attributed to the terminal vanadium oxy group (V5+=O) [49]. The peak at 1627 cm−1 is attributed to the Lewis acid sites [50]. According to the experimental results, the sodium salts poisoned catalyst was found to have reduced the Lewis acid sites. With increased loading, the degree of reduction increased. This indicates that the weak acidic strength of the catalyst surface was lowered. This is consistent with the results of NH3-TPD. The peak intensity at 1015 cm−1 increased and Na2S2O7 poisoned catalyst had the most significant effect. The increase of V5+=O bond strength is beneficial for promoting the conversion of SO2 to SO3 [51]. Alvarez et al. [18] suggested that the presence of pyrosulfates would maintain the high oxidizability of V species to a certain degree. This result is consistent with the results of SO2 oxidation experiments.

3. Experimental

3.1. Sample Preparation

The commercial SCR catalysts were obtained from Beijing Nation Power Group Co., Ltd., Beijing, China. The poisoned catalysts were prepared using the wet impregnation method. A certain amount of sodium sulfate or sodium pyrosulfate was weighed according to the mass percentage of Na in the active ingredient of catalysts. After being formulated into solution, they were mixed with catalysts and ultrasonically shaken for 4 h. They were then dried in the blast drying oven at 110 °C for 12 h. Finally, the catalysts were calcined in the muffle furnace at 350 °C for 5 h and ground to 40–60 mesh to obtain x-Na2SO4/Na2S2O7-SCR poisoned catalysts. Here, x means the mass percentage of sodium element (1.2% or 3.6%).

3.2. Catalyst Characterization
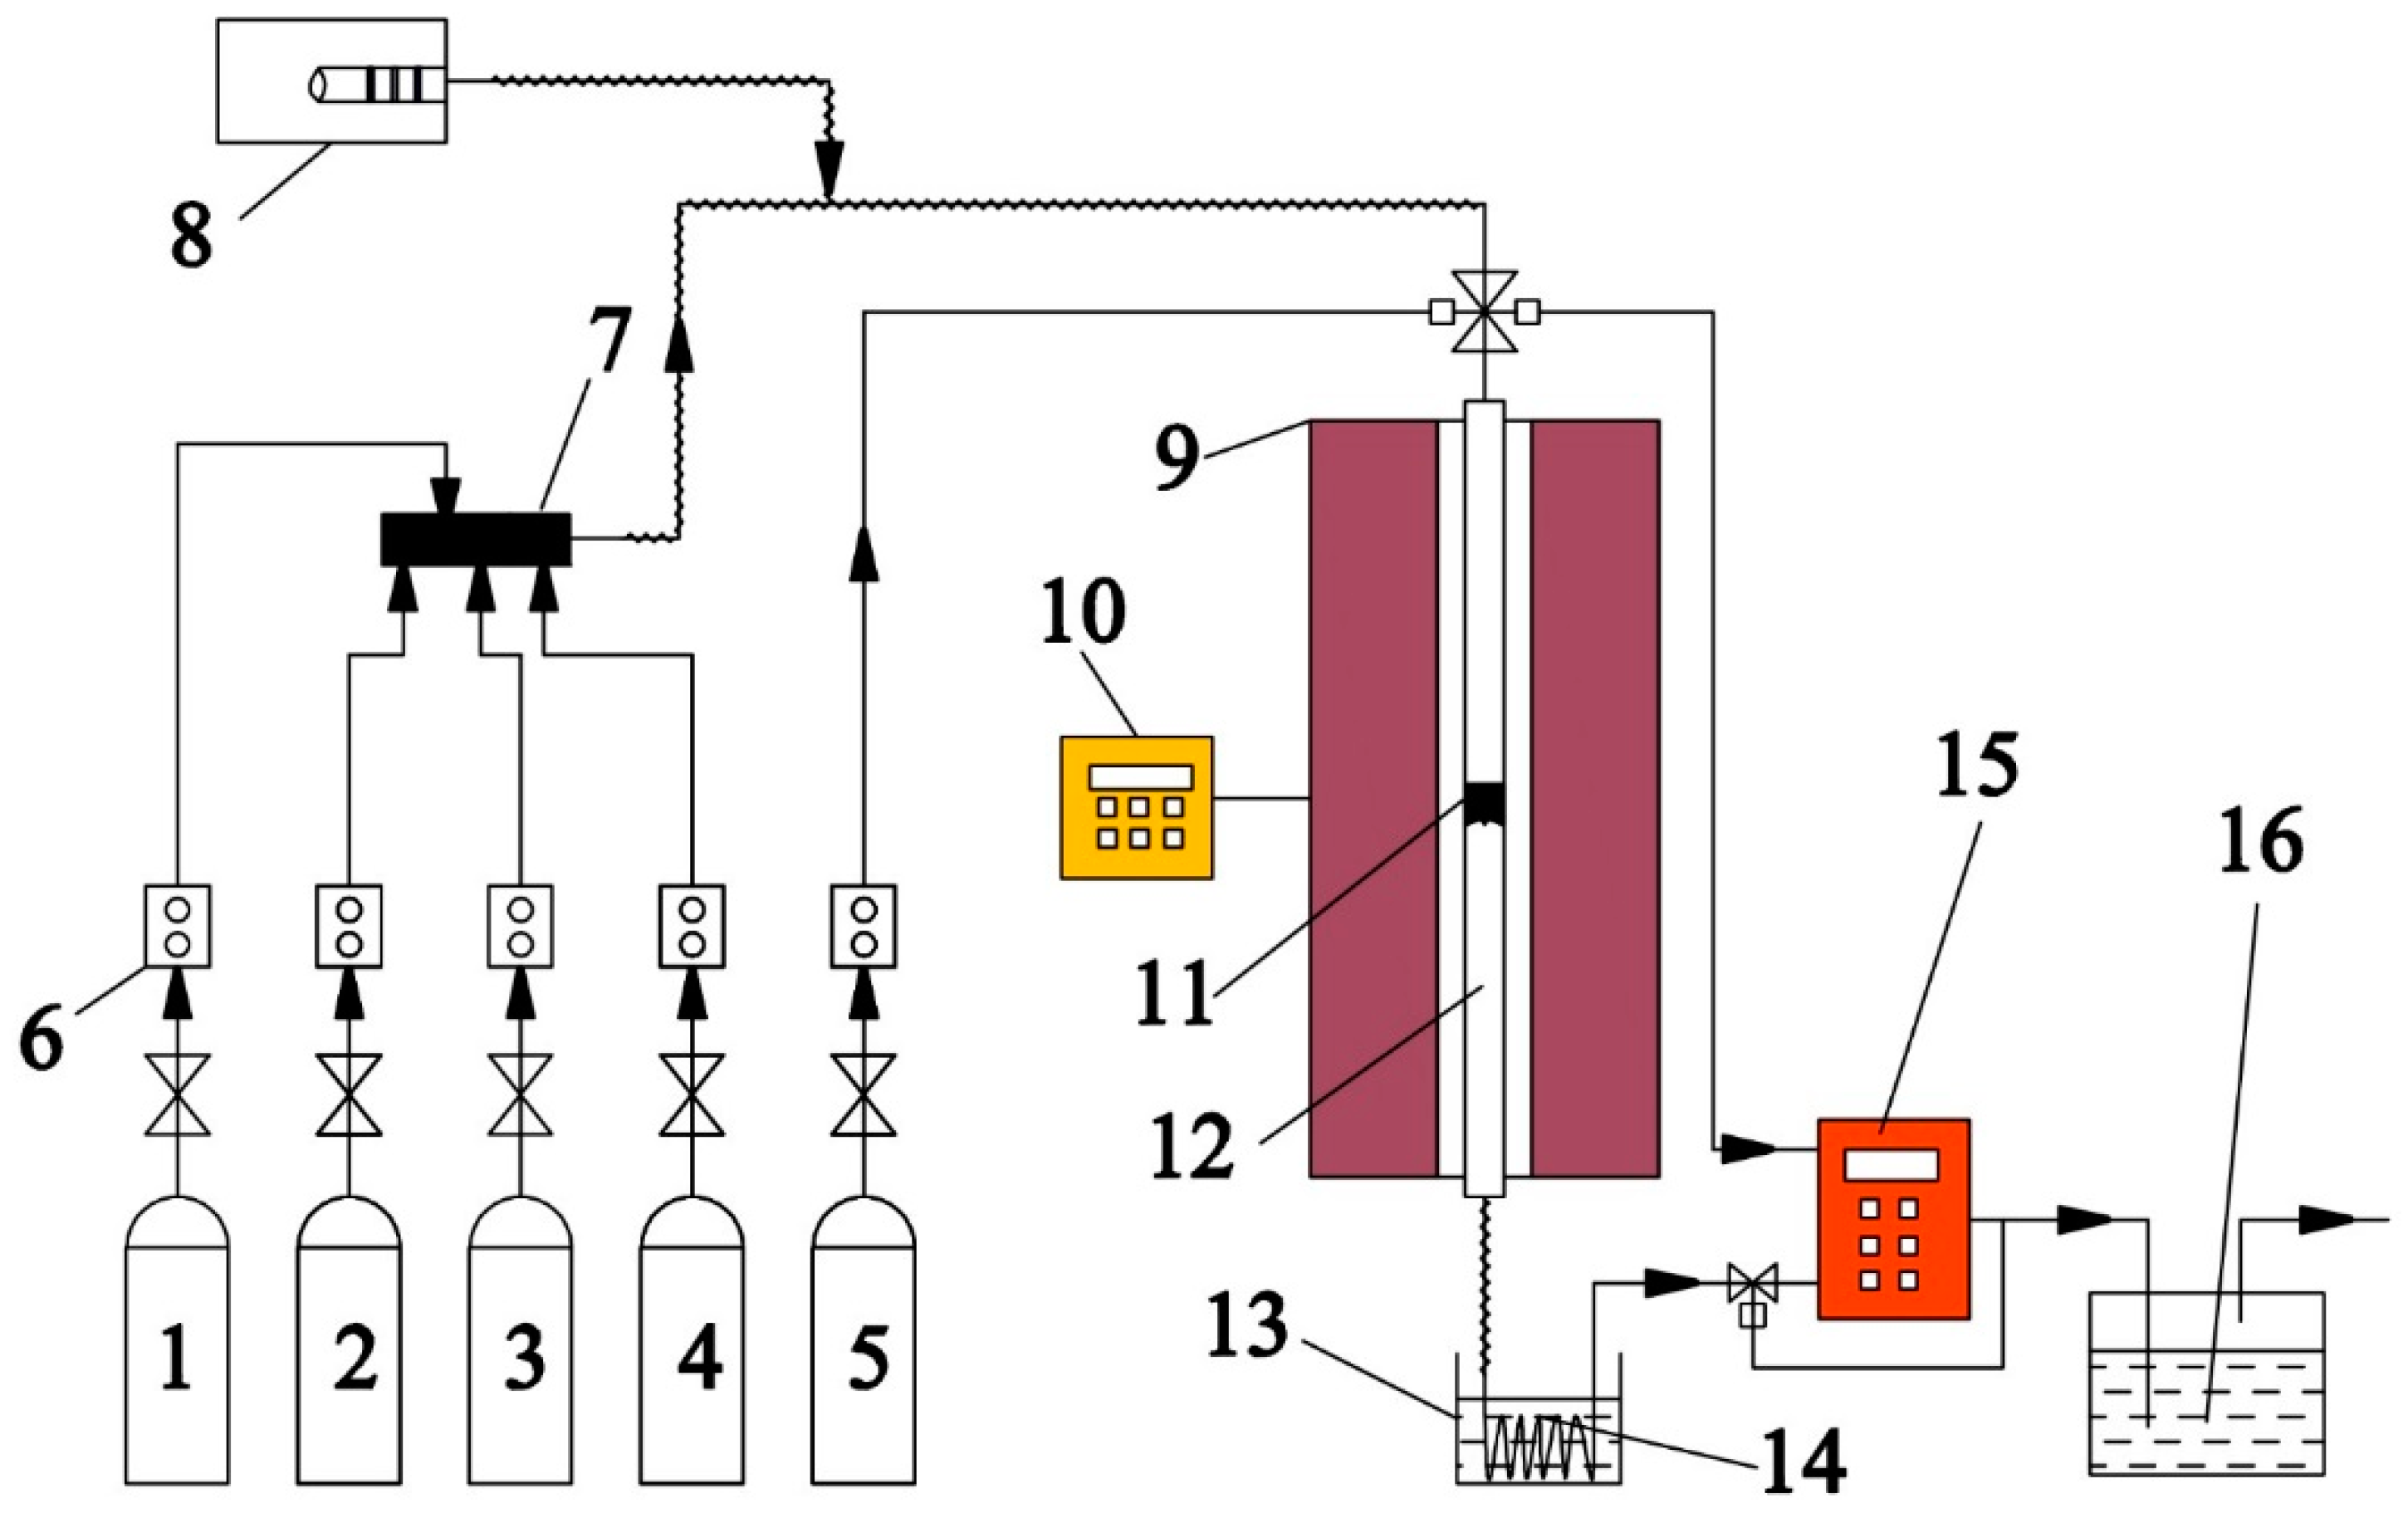
The experiment was performed using the model tp-5080 temperature programmed adsorption instrument (manufactured by Tianjin Xianquan Company, Tianjin, China) for NH3-TPD and H2-TPR of different catalysts. For a NH3-TPD test, 0.1 g samples were prepared and then pretreated for 1 h at 250 °C. Next, they were cooled to ambient temperature in a pure N2 atmosphere (30 mL/min). Then 10%NH3 (N2 as balance gas) was passed over the samples for 1 h. After NH3 was cut off, the catalysts were warmed to 60 °C and purged in pure N2 for 20 min. Finally, they were heated to 800 °C (at a rate of 10 °C/min) and maintained at 800 °C for 5 min. The consumption of NH3 was recorded. For a H2-TPR test, 0.05 g samples were prepared and then pretreated for 1 h at 250 °C. Next, they were cooled to ambient temperature in pure N2 atmosphere (30 mL/min). Then 5%H2 (N2 as balance gas) was passed over the samples as a reducing agent. Finally, the catalysts were heated to 800 °C (at a rate of 10 °C/min) and maintained at 800 °C for 5 min. The consumption of H2 was recorded.
The pore structural parameters of the samples were determined via the specific surface area and pore size analyzer (ASAP 2010, Micromeritics Instrument Corporation, Norcross, GA, USA). The specific surface area of the catalyst was obtained by linear regression via the Brunauer–Emmett–Teller (BET) equation. The pore size was calculated using the BJH model.
The XRD patterns of samples were obtained using the Bruker D8 (Bruker AXS Company, Karlsruhe, Germany) Advance to determine the crystallinity and dispersion of the surface material of the samples. The measurement was performed using a Cu Kα irradiation source with a scan range of 10–80°. XPS was performed using the AXIS ULTRADLD (Kratos Company, Shimadzu, Kyoto, Japan). An X-ray source was used as a monochromatic Al target and C1s (284.8 eV) was used for correction when fitting the peak. FT-IR spectra were recorded in a Nicolet Nexus 670 FT-IR (Nicolet Company, Madison, WI, USA). The catalysts were ground and then blended with KBr powder at the mass ratio of 1:100 with a resolution of 4 cm−1. The recorded spectral range was 600–4000 cm−1, and the number of scans was 32.

3.3. Test. Setup

Catalytic performance and SO2–SO3 conversion test apparatus is presented in Figure 13. Each catalyst (2 mL, 40–60 mesh) was laid in a quartz tube reactor. The simulated flue gas used in the experiment included 500 ppm NH3, 500 ppm NO, 5% O2, 2% H2O, and the SO2 concentration ranged from 0 to 3000 ppm (N2 acted as a balance gas). The total gas flow rate was 1.5 L/min, resulting in a GHSV of 45,000 h−1. The experimental test temperature was 250–410 °C. The inlet and outlet flue gas (O2, SO2, NO) concentrations were monitored using the Testo 350 flue gas analyzer (Testo AG, Lenzkirch, Germany). SO3 was gathered by the Graham Condenser, which was placed in a constant temperature 80 °C water bath. The gathered SO3 was converted to SO42− using an 80% isopropanol solution. Then the SO42− content in the solution was measured using an ion chromatograph to determine the SO3 content, which was averaged over multiple measurements.
The catalytic performance of the catalyst is represented by the conversion of NO, which is defined as:
η NO ( % ) = ( [ NO ] inlet [ NO ] outlet [ NO ] inlet ) × 100 %
The SO2–SO3 conversion is indirectly expressed by the SO2 oxidation, which is defined as:
SO 2 SO 3 - conversation ( % ) = ( [ SO 3 ] outlet [ SO 2 ] inlet ) × 100 %

4. Conclusions

The influence of different sulfur-containing sodium salts (Na2SO4 and Na2S2O7) poisoned catalysts on SO2 oxidation and NO reduction was investigated. Sodium salts poisoned catalysts led to a decrease in the denitration efficiency, while significantly improving the SO2–SO3-conversion. The degree of change is related to the loading and form of the sodium salts poisoned catalysts. The degree of poisoning of Na2S2O7 poisoned catalyst was weaker because S2O72− can create more Brønsted acid sites and has stronger oxidizability than SO42−. The introduction of SO2 clearly increased the number of surface acid sites. However, it had little effect on the redox capacity of the catalyst. Hence, SO2 slightly enhanced the denitration efficiency of the sodium salts poisoned catalysts. According to analysis of NH3-TPD, FT-IR, and H2-TPR results, sodium salts poisoned catalysts reduced the Lewis acid sites and redox capacity. They also increased Brønsted acid sites and V5+=O bonds strength. The presence of the V5+=O bonds facilitates SO2–SO3 conversion. XPS results showed that sodium salts poisoned catalysts increased the chemically adsorbed oxygen content and promoted SO2 oxidation. However, sodium salts poisoned catalysts reduced the V4+/V5+ ratio and inhibited denitration performance.

Author Contributions

H.X. conceived and designed the experiments; C.D. performed the experiments and wrote the paper; H.S., J.G. and L.C. contributed reagents/materials/analysis tools.

Acknowledgments

This work was supported by National Natural Science Foundation of China (no. 51206047).

Conflicts of Interest

The authors declare no conflicts of interest.

References

  1. Wang, J.; Qiu, Y.; He, S.; Liu, N.; Xiao, C.; Liu, L. Investigating the driving forces of NOx generation from energy consumption in China. J. Clean. Prod. 2018, 184, 836–846. [Google Scholar] [CrossRef]
  2. Yang, J.; Sun, R.; Sun, S.; Zhao, N.; Hao, N.; Chen, H.; Wang, Y.; Guo, H.; Meng, J. Experimental study on NOx reduction from staging combustion of high volatile pulverized coals. Part 1. Air staging. Fuel Process. Technol. 2014, 126, 266–275. [Google Scholar] [CrossRef]
  3. Kim, M.H.; Yang, K.H. The role of Fe2O3 species in depressing the formation of N2O in the selective reduction of NO by NH3 over V2O5/TiO2-based catalysts. Catalysts 2018, 8, 134. [Google Scholar] [CrossRef]
  4. Qi, X.; Song, G.; Song, W.; Lu, Q. Influence of sodium-based materials on the slagging characteristics of Zhundong coal. J. Energy Inst. 2017, 90, 914–922. [Google Scholar] [CrossRef]
  5. Xu, L.; Liu, H.; Zhao, D.; Cao, Q.; Gao, J.; Wu, S. Transformation mechanism of sodium during pyrolysis of Zhundong coal. Fuel 2018, 233, 29–36. [Google Scholar] [CrossRef]
  6. Zhang, S.; Liu, S.; Hu, W.; Zhu, X.; Qu, W.; Wu, W.; Zheng, C.; Gao, X. New insight into alkali resistance and low temperature activation on vanadia-titania catalysts for selective catalytic reduction of NO. Appl. Surf. Sci. 2019, 466, 99–109. [Google Scholar] [CrossRef]
  7. Lisi, L.; Lasorella, G.; Malloggi, S.; Russo, G. Single and combined deactivating effect of alkali metals and HCl on commercial SCR catalysts. Appl. Catal. B Environ. 2004, 50, 251–258. [Google Scholar] [CrossRef]
  8. Lei, T.; Li, Q.; Chen, S.; Liu, Z.; Liu, Q. KCl-induced deactivation of V2O5–WO3/TiO2 catalyst during selective catalytic reduction of NO by NH3: Comparison of poisoning methods. Chem. Eng. J. 2016, 296, 1–10. [Google Scholar] [CrossRef]
  9. Klimczak, M.; Kern, P.; Heinzelmann, T.; Lucas, M.; Claus, P. High-throughput study of the effects of inorganic additives and poisons on NH3-SCR catalysts—Part I: V2O5–WO3/TiO2 catalysts. Appl. Catal. B Environ. 2010, 95, 39–47. [Google Scholar] [CrossRef]
  10. Liu, Y.; Liu, Z.; Mnichowicz, B.; Harinath, A.V.; Li, H.; Bahrami, B. Chemical deactivation of commercial vanadium SCR catalysts in diesel emission control application. Chem. Eng. J. 2016, 287, 680–690. [Google Scholar] [CrossRef]
  11. Peng, Y.; Li, J.; Huang, X.; Li, X.; Su, W.; Sun, X.; Wang, D.; Hao, J. Deactivation Mechanism of Potassium on the V2O5/CeO2 Catalysts for SCR Reaction: Acidity, Reducibility and Adsorbed-NOx. Environ. Sci. Technol. 2014, 48, 4515–4520. [Google Scholar] [CrossRef] [PubMed]
  12. Peng, Y.; Li, J.; Shi, W.; Xu, J.; Hao, J. Design strategies for development of SCR catalyst: Improvement of alkali poisoning resistance and novel regeneration method. Environ. Sci. Technol. 2012, 46, 12623–12629. [Google Scholar] [CrossRef] [PubMed]
  13. Chang, H.; Shi, C.; Li, M.; Zhang, T.; Wang, C.; Jiang, L.; Wang, X. The effect of cations (NH4+, Na+, K+, and Ca2+) on chemical deactivation of commercial SCR catalyst by bromides. Chin. J. Catal. 2018, 39, 710–717. [Google Scholar] [CrossRef]
  14. Li, G.; Wang, C.A.; Wang, P.; Du, Y.; Liu, X.; Chen, W.; Che, D. Ash deposition and alkali metal migration during Zhundong high-alkali coal gasification. Energy Procedia 2017, 105, 1350–1355. [Google Scholar] [CrossRef]
  15. Yang, S.; Song, G.; Na, Y.; Yang, Z. Alkali metal transformation and ash deposition performance of high alkali content Zhundong coal and its gasification fly ash under circulating fluidized bed combustion. Appl. Therm. Eng. 2018, 141, 29–41. [Google Scholar] [CrossRef]
  16. Niu, Y.; Gong, Y.; Zhang, X.; Liang, Y.; Wang, D.; Hui, S.E. Effects of leaching and additives on the ash fusion characteristics of high-Na/Ca Zhundong coal. J. Energy Inst. 2018. [Google Scholar] [CrossRef]
  17. Li, Q.; Chen, S.; Liu, Z.; Liu, Q. Combined effect of KCl and SO2 on the selective catalytic reduction of NO by NH3 over V2O5/TiO2 catalyst. Appl. Catal. B Environ. 2015, 164, 475–482. [Google Scholar] [CrossRef]
  18. Alvarez, E.; Blanco, J.; Avila, P.; Knapp, C. Activation of monolithic catalysts based on diatomaceous earth for sulfur dioxide oxidation. Catal. Today 1999, 53, 557–563. [Google Scholar] [CrossRef]
  19. Tian, Y.; Yang, J.; Yang, C.; Lin, F.; Guang, H.; Kong, M.; Liu, Q. Comparative study of the poisoning effect of NaCl and Na2O on selective catalytic reduction of NO with NH3 over V2O5–WO3/TiO2 catalyst. J. Energy Inst. 2018, 1–8. [Google Scholar] [CrossRef]
  20. Hu, W.; Gao, X.; Deng, Y.; Qu, R.; Zheng, C.; Zhu, X.; Cen, K. Deactivation mechanism of arsenic and resistance effect of SO42− on commercial catalysts for selective catalytic reduction of NOx with NH3. Chem. Eng. J. 2016, 293, 118–128. [Google Scholar] [CrossRef]
  21. Chen, J.P.; Buzanowski, M.A.; Yang, R.T.; Cichanowicz, J.E. Deactivation of the vanadia catalyst in the selective catalytic reduction process. J. Air Waste Manag. Assoc. 2012, 40, 1403–1409. [Google Scholar] [CrossRef]
  22. Dahlin, S.; Nilsson, M.; Bäckström, D.; Bergman, S.L.; Bengtsson, E.; Bernasek, S.L.; Pettersson, L.J. Multivariate analysis of the effect of biodiesel-derived contaminants on V2O5–WO3/TiO2 SCR catalysts. Appl. Catal. B Environ. 2016, 183, 377–385. [Google Scholar] [CrossRef]
  23. Li, X.; Li, X.; Yang, R.; Mo, J.; Li, J.; Hao, J. The poisoning effects of calcium on V2O5–WO3/TiO2 catalyst for the SCR reaction: Comparison of different forms of calcium. Mol. Catal. 2017, 434, 16–24. [Google Scholar] [CrossRef]
  24. Nicosia, D.; Czekaj, I.; Kröcher, O. Chemical deactivation of V2O5/WO3–TiO2 SCR catalysts by additives and impurities from fuels, lubrication oils and urea solution. Part II. Characterization study of the effect of alkali and alkaline earth metals. Appl. Catal. B Environ 2008, 77, 228–236. [Google Scholar] [CrossRef]
  25. Dunn, J.P.; Koppula, P.R.; Stenger, H.G.; Wachs, I.E. Oxidation of sulfur dioxide to sulfur trioxide over supported vanadia catalysts. Appl. Catal. B Environ. 1998, 19, 103–117. [Google Scholar] [CrossRef]
  26. Zhang, L.; Li, L.; Cao, Y.; Yao, X.; Ge, C.; Gao, F.; Deng, Y.; Tang, C.; Dong, L. Getting insight into the influence of SO2 on TiO2/CeO2 for the selective catalytic reduction of NO by NH3. Appl. Catal. B Environ. 2015, 165, 589–598. [Google Scholar] [CrossRef]
  27. Ma, J.; Liu, Z.; Liu, Q.; Guo, S.; Huang, Z.; Xiao, Y. SO2 and NO removal from flue gas over V2O5/AC at lower temperatures—Role of V2O5 on SO2 removal. Fuel Process. Technol. 2008, 89, 242–248. [Google Scholar] [CrossRef]
  28. Wang, Y.; Ma, J.; Liang, D.; Zhou, M.; Li, F.; Li, R. Lewis and Brønsted acids in super-acid catalyst SO42−/ZrO2–SiO2. J. Mater. Sci. 2009, 44, 6736–6740. [Google Scholar] [CrossRef]
  29. Xiao, H.; Ru, Y.; Cheng, Q.; Zhai, G.; Dou, C.; Qi, C.; Chen, Y. Effect of sodium sulfate in ash on sulfur trioxide formation in the postflame region. Energy Fuels 2018, 32, 8668–8675. [Google Scholar] [CrossRef]
  30. Schwaemmle, T.; Heidel, B.; Brechtel, K.; Scheffknecht, G. Study of the effect of newly developed mercury oxidation catalysts on the DeNOx-activity and SO2–SO3-conversion. Fuel 2012, 101, 179–186. [Google Scholar] [CrossRef]
  31. Guo, X.; Bartholomew, C.; Hecker, W.; Baxter, L. Effects of sulfate species on V2O5/TiO2 SCR catalysts in coal and biomass-fired systems. Appl. Catal. B Environ. 2009, 92, 30–40. [Google Scholar] [CrossRef]
  32. Wu, Z.; Jin, R.; Wang, H.; Liu, Y. Effect of ceria doping on SO2 resistance of Mn/TiO2 for selective catalytic reduction of NO with NH3 at low temperature. Catal. Commun. 2009, 10, 935–939. [Google Scholar] [CrossRef]
  33. Anstrom, M.; Topsøe, N.; Dumesic, J.A. Density functional theory studies of mechanistic aspects of the SCR reaction on vanadium oxide catalysts. J. Catal. 2003, 213, 115–125. [Google Scholar] [CrossRef]
  34. Huang, Z.; Zhu, Z.; Liu, Z.; Liu, Q. Formation and reaction of ammonium sulfate salts on V2O5/AC catalyst during selective catalytic reduction of nitric oxide by ammonia at low temperatures. J. Catal. 2003, 214, 213–219. [Google Scholar] [CrossRef]
  35. Peng, Y.; Li, J.; Si, W.; Luo, J.; Dai, Q.; Luo, X.; Liu, X.; Hao, J. Insight into deactivation of commercial SCR catalyst by arsenic: An experiment and DFT study. Environ. Sci. Technol. 2014, 48, 13895–13900. [Google Scholar] [CrossRef] [PubMed]
  36. Du, X.; Gao, X.; Qiu, K.; Luo, Z.; Cen, K. The Reaction of poisonous alkali oxides with vanadia SCR catalyst and the afterward influence: A DFT and experimental study. J. Phys. Chem. C 2015, 119, 1905–1912. [Google Scholar] [CrossRef]
  37. Zheng, Y.; Jensen, A.D.; Johnsson, J.E.; Thøgersen, J.R. Deactivation of V2O5–WO3/TiO2 SCR catalyst at biomass fired power plants: Elucidation of mechanisms by lab- and pilot-scale experiments. Appl. Catal. B Environ. 2008, 83, 186–194. [Google Scholar] [CrossRef]
  38. Giakoumelou, I.; Fountzoula, C.; Kordulis, C.; Boghosian, S. Molecular structure and catalytic activity of V2O5/TiO2 catalysts for the SCR of NO by NH3: In situ Raman spectra in the presence of O2, NH3, NO, H2, H2O, and SO2. J. Catal. 2006, 239, 1–12. [Google Scholar] [CrossRef]
  39. Huang, Z.; Zhu, Z.; Liu, Z. Combined effect of H2O and SO2 on V2O5/AC catalysts for NO reduction with ammonia at lower temperatures. Appl. Catal. B Environ. 2002, 39, 361–368. [Google Scholar] [CrossRef]
  40. Chen, L.; Li, J.; Ge, M. The poisoning effect of alkali metals doping over nano V2O5–WO3/TiO2 catalysts on selective catalytic reduction of NOx by NH3. Chem. Eng. J. 2011, 170, 531–537. [Google Scholar] [CrossRef]
  41. Yu, Y.; Miao, J.; He, C.; Chen, J.; Li, C.; Douthwaite, M. The remarkable promotional effect of SO2 on Pb-poisoned V2O5–WO3/TiO2 catalysts: An in-depth experimental and theoretical study. Chem. Eng. J. 2018, 338, 191–201. [Google Scholar] [CrossRef]
  42. Gan, L.; Guo, F.; Yu, J.; Xu, G. Improved low-temperature activity of V2O5–WO3/TiO2 for denitration using different vanadium precursors. Catalysts 2016, 6, 25. [Google Scholar] [CrossRef]
  43. Wang, T.; Zhang, X.; Liu, J.; Liu, H.; Guo, Y.; Sun, B. Plasma-assisted catalytic conversion of NO over Cu-Fe catalysts supported on ZSM-5 and carbon nanotubes at low temperature. Fuel Process. Technol. 2018, 178, 53–61. [Google Scholar] [CrossRef]
  44. Wan, Q.; Duan, L.; Li, J.; Chen, L.; He, K.; Hao, J. Deactivation performance and mechanism of alkali (earth) metals on V2O5–WO3/TiO2 catalyst for oxidation of gaseous elemental mercury in simulated coal-fired flue gas. Catal. Today 2011, 175, 189–195. [Google Scholar] [CrossRef]
  45. Qi, C.; Bao, W.; Wang, L.; Li, H.; Wu, W. Study of the V2O5-WO3/TiO2 catalyst synthesized from waste catalyst on selective catalytic reduction of NOx by NH3. Catalysts 2017, 7, 110. [Google Scholar] [CrossRef]
  46. Economidis, N.V.; Peña, D.A.; Smirniotis, P.G. Comparison of TiO2-based oxide catalysts for the selective catalytic reduction of NO: Effect of aging the vanadium precursor solution. Appl. Catal. B Environ. 1999, 23, 123–134. [Google Scholar] [CrossRef]
  47. Xiao, H.; Chen, Y.; Qi, C.; Ru, Y. Effect of Na poisoning catalyst (V2O5–WO3/TiO2) on denitration process and SO3 formation. Appl. Surf. Sci. 2018, 433, 341–348. [Google Scholar] [CrossRef]
  48. Shpanchenko, R.V.; Chernaya, V.V.; Antipov, E.V.; Hadermann, J.; Kaul, E.E.; Geibel, C. Synthesis, structure and magnetic properties of the new mixed-valence vanadate Na2SrV3O9. J. Solid State Chem. 2003, 173, 244–250. [Google Scholar] [CrossRef]
  49. Lewandowska, A.E.; Calatayud, M.; Lozano-Diz, E.; Minot, C.; Bañares, M.A. Combining theoretical description with experimental in situ studies on the effect of alkali additives on the structure and reactivity of vanadium oxide supported catalysts. Catal. Today 2008, 139, 209–213. [Google Scholar] [CrossRef]
  50. Busca, G.; Saussey, H.; Saur, O.; Lavalley, J.C.; Lorenzelli, V. FT-IR characterization of the surface acidity of different titanium dioxide anatase preparations. Appl. Catal. 1985, 14, 245–260. [Google Scholar] [CrossRef]
  51. Liu, Y.; Shu, H.; Xu, Q.; Zhang, Y.; Yang, L. FT-IR study of the SO2 oxidation behavior in the selective catalytic reduction of NO with NH3 over commercial catalysts. J. Fuel Chem. Technol. 2015, 43, 1018–1024. [Google Scholar] [CrossRef]
Figure 1. Effect of temperature on SO3 generation. Reaction conditions: 1800 ppm SO2, 5% O2, 500 ppm NO, 500 ppm NH3, 2% H2O, total flow gas 1.5 L/min, and gas hourly space velocity (GHSV) = 45,000 h−1.
Catalysts 08 00541 g001
Figure 2. Effect of SO2 concentration on (a) SO2–SO3-conversion and (b) SO3 concentration. Reaction conditions: T = 350 °C, 5% O2, 500 ppm NO, 500 ppm NH3, 2% H2O, total flow gas 1.5 L/min, and gas hourly space velocity (GHSV) = 45,000 h−1.
Catalysts 08 00541 g002
Figure 3. Effect of temperature on NO conversion. Reaction conditions: 500 ppm NO, 500 ppm NH3, 5% O2, 2% H2O, total flow gas 1.5 L/min, and gas hourly space velocity (GHSV) = 45,000 h−1.
Catalysts 08 00541 g003
Figure 4. Effect of SO2 concentration on NO conversion. Reaction conditions: 500 ppm NO, 500 ppm NH3, 5% O2, 2% H2O, T = 350 °C, total flow gas 1.5 L/min, and gas hourly space velocity (GHSV) = 45,000 h−1.
Catalysts 08 00541 g004
Figure 5. NH3-TPD profiles of the catalyst samples.
Catalysts 08 00541 g005
Figure 6. NH3-TPD profiles of the catalysts in different SO2 concentration (0 and 1800 ppm).
Catalysts 08 00541 g006
Figure 7. H2-TPR profiles of the catalyst samples for Na content (a) 1.2% and (b) 3.6%.
Catalysts 08 00541 g007
Figure 8. H2-TPR profiles of the catalysts in different SO2 concentration (0 and 1800 ppm).
Catalysts 08 00541 g008
Figure 9. X-ray photoelectron spectroscopy (XPS) spectra for (a) O1S and (b) V2P over these samples.
Catalysts 08 00541 g009
Figure 10. Barret–Joyner–Halenda (BJH) pore size distribution curves of the catalysts.
Catalysts 08 00541 g010
Figure 11. XRD results of the (a) Na2SO4 and (b) Na2S2O7 poisoned catalysts.
Catalysts 08 00541 g011
Figure 12. FT-IR spectra of the catalysts.
Catalysts 08 00541 g012
Figure 13. Catalytic performance and SO2 oxidation tests device. 1. NO/N2; 2. O2; 3. N2; 4. SO2/CO2; 5. NH3/N2; 6. Mass flowmeter; 7. Gas mixer; 8. Peristaltic pump; 9. Tubular resistance furnace; 10. Temperature controller; 11. Catalyst; 12. Quartz tube; 13. Water heater; 14. Graham condenser; 15. Gas analyzer; 16. Absorption liquid.
Catalysts 08 00541 g013
Table 1. The surface atomic concentrations for these samples.
SamplesSurface Atomic Concentration (%)
ONaTiVWS
Pure catalyst65.040.0716.270.603.500.05
1.2%-Na2SO4-SCR60.244.4214.320.402.611.13
3.6%-Na2SO4-SCR59.885.5813.010.352.143.54
1.2%-Na2S2O7-SCR61.934.1715.190.442.772.32
3.6%-Na2S2O7-SCR61.085.2514.770.382.695.12
Table 2. The states of O and V on the catalyst surfaces.
SamplesSurface Atomic Concentration (%)Surface Atomic Ratio
Oα/(Oα+Oβ)Oβ/(Oα+Oβ)V4+V5+V4+/V5+
Pure catalyst44.355.743.656.40.77
1.2%-Na2SO4-SCR51.049.041.458.60.71
3.6%-Na2SO4-SCR53.146.940.259.80.67
1.2%-Na2S2O7-SCR51.848.240.659.40.69
3.6%-Na2S2O7-SCR55.344.739.860.20.66
Table 3. Structural characteristics of different Na salts loadings.
SamplesSBET (m2·g−1)Vtotal (cm3·g−1)Dp (nm)
Pure catalyst950.219.3
1.2%-Na2SO4-SCR750.1810.5
1.2%-Na2S2O7-SCR690.1710.5
3.6%-Na2SO4-SCR630.1611.3
3.6%-Na2S2O7-SCR440.1211.1

