Article

Highly Reducible Nanostructured CeO2 for CO Oxidation

Hebei Provincial Key Laboratory of Green Chemical Technology and High Efficient Energy Saving, School of Chemical Engineering and Technology, Hebei University of Technology, Tianjin 300130, China
*
Author to whom correspondence should be addressed.
Catalysts 2018, 8(11), 535; https://doi.org/10.3390/catal8110535
Submission received: 30 September 2018 / Revised: 2 November 2018 / Accepted: 5 November 2018 / Published: 11 November 2018
(This article belongs to the Special Issue Catalytic Applications of CeO2-Based Materials)

Abstract

:
Ceria in nanoscale with different morphologies, rod, tube and cube, were prepared through a hydrothermal process. The structure, morphology and textural properties were characterized by X-ray diffraction (XRD), scanning electron microscope (SEM), transmission electron microscope (TEM) and isothermal N2 adsorption-desorption. Ceria with different morphologies were evaluated as catalysts for CO oxidation. CeO2 nanorods showed superior activity to the others. When space velocity was 12,000 mL·gcat−1·h−1, the reaction temperature for 90% CO conversion (T90) was 228 °C. The main reason for the high activity was the existence of large amounts of easily reducible oxygen species, with a reduction temperature of 217 °C on the surface of CeO2 nanorods. Another cause was their relatively large surface area.

1. Introduction

Ceria (CeO2) is a significant rare earth oxide and has widespread applications. It can be used in the fields of luminescent materials [1], gas sensors [2], electronic ceramics [3], biology, medical science [4,5] and so on. In the field of catalysis, CeO2 can be used as catalysts or non-inert support for heterogeneous catalysts [6,7,8], acting as an oxygen buffer through a fast Ce3+/Ce4+ cycle involving the participation of lattice oxygen. Therefore, it has been extensively studied and applied in many fields, such as three-way catalysts [9,10], fuel cells [11], water–gas shifts [12], ethanol dehydrogenation [13], CO oxidation [14], alcohol steam reforming [15] and photocatalysis [16]. Usually, the catalytic reactivity of CeO2 not only depends on the particle size but is also closely related to its morphology [17]. Yuan et al. [18] prepared a Pd-based catalyst using CeO2 nanotubes as support for oxidative carbonylation of phenol to diphenyl carbonate (DPC) and obtained higher activity and DPC selectivity than those of Pd catalyst supported on the zero-dimensional CeO2 particles. Gawade et al. [19] studied the water gas shift reactions catalyzed by Cu/CeO2 and found that the CeO2 nanoparticle supported catalyst achieved much higher CO conversion than a catalyst supported on CeO2 nanorods. The results can be explained by the highly dispersed copper species over CeO2 nanoparticles that constitute the active sites for the water gas shift reaction.
CO catalytic oxidation is an effective pollutant removal technology and is also a typical probe reaction that is widely used for studying the catalyst structure, adsorption/desorption and the reaction mechanism [20]. There are two groups of catalysts for CO oxidation: non-noble metal catalysts and supported noble metal catalysts [21]. CeO2 is one of the CO oxidation catalysts that have attracted much attention in recent years [20]. Both size and morphology of CeO2 particles has a significant impact on their catalytic performance in CO oxidation. Tana et al. [22] studied the morphology-dependent phenomenon of CeO2 for CO oxidation. It was found that CeO2 nanowires and nanorods, which mainly showed the reactive {110} and {100} planes, resulted in much higher activity for CO oxidation than CeO2 particles. The CeO2 nanowires that exposed more active planes exhibited the highest activity. González-Rovira et al. [23] prepared CeO2 nanomaterials with a tubular structure by an electrochemical method. The outer diameter of the nanotubes was about 200 nm with lengths between 30 and 40 μm. The activity of the CeO2 nanotubes was 400 times higher than CeO2 particles for CO oxidation under certain conditions. Zhang et al. [24] synthesized cauliflower like CeO2 through the decomposition of Ce-BTC (BTC: 1,3,5-benzenetricarboxylic acid) straw and found that it exhibited excellent catalytic activity and stability in CO oxidation. The superior catalytic performance could be ascribed to the cauliflower like structure, which was composed of porous CeO2 nanorods that provided more active sites and oxygen vacancy for CO oxidation. Nowadays many papers have been published with the title ‘CO oxidation on CeO2 with different morphologies’ [20]. However, different researchers usually got different activity results, even though the CeO2 samples they prepared had similar morphologies. This may be attributed to the fact that the catalytic activity of CeO2 for CO oxidation is influenced by many factors. Among them, the amount of surface oxygen species (representation for OSC, Oxygen Storage Capacity) and its reducibility are vital characteristics to determine the properties of CeO2.
In this paper, CeO2 in nanoscale with different morphologies of rod, tube and cube were prepared through a hydrothermal process. The catalytic performance of these CeO2 samples for CO oxidation was investigated. The results exhibited that the rod-like CeO2 showed a far superior activity to the other two catalysts. The cause is discussed, and the highly reducible oxygen species on the surface of CeO2 nanorods is considered to be the main reason.

2. Results and Discussion

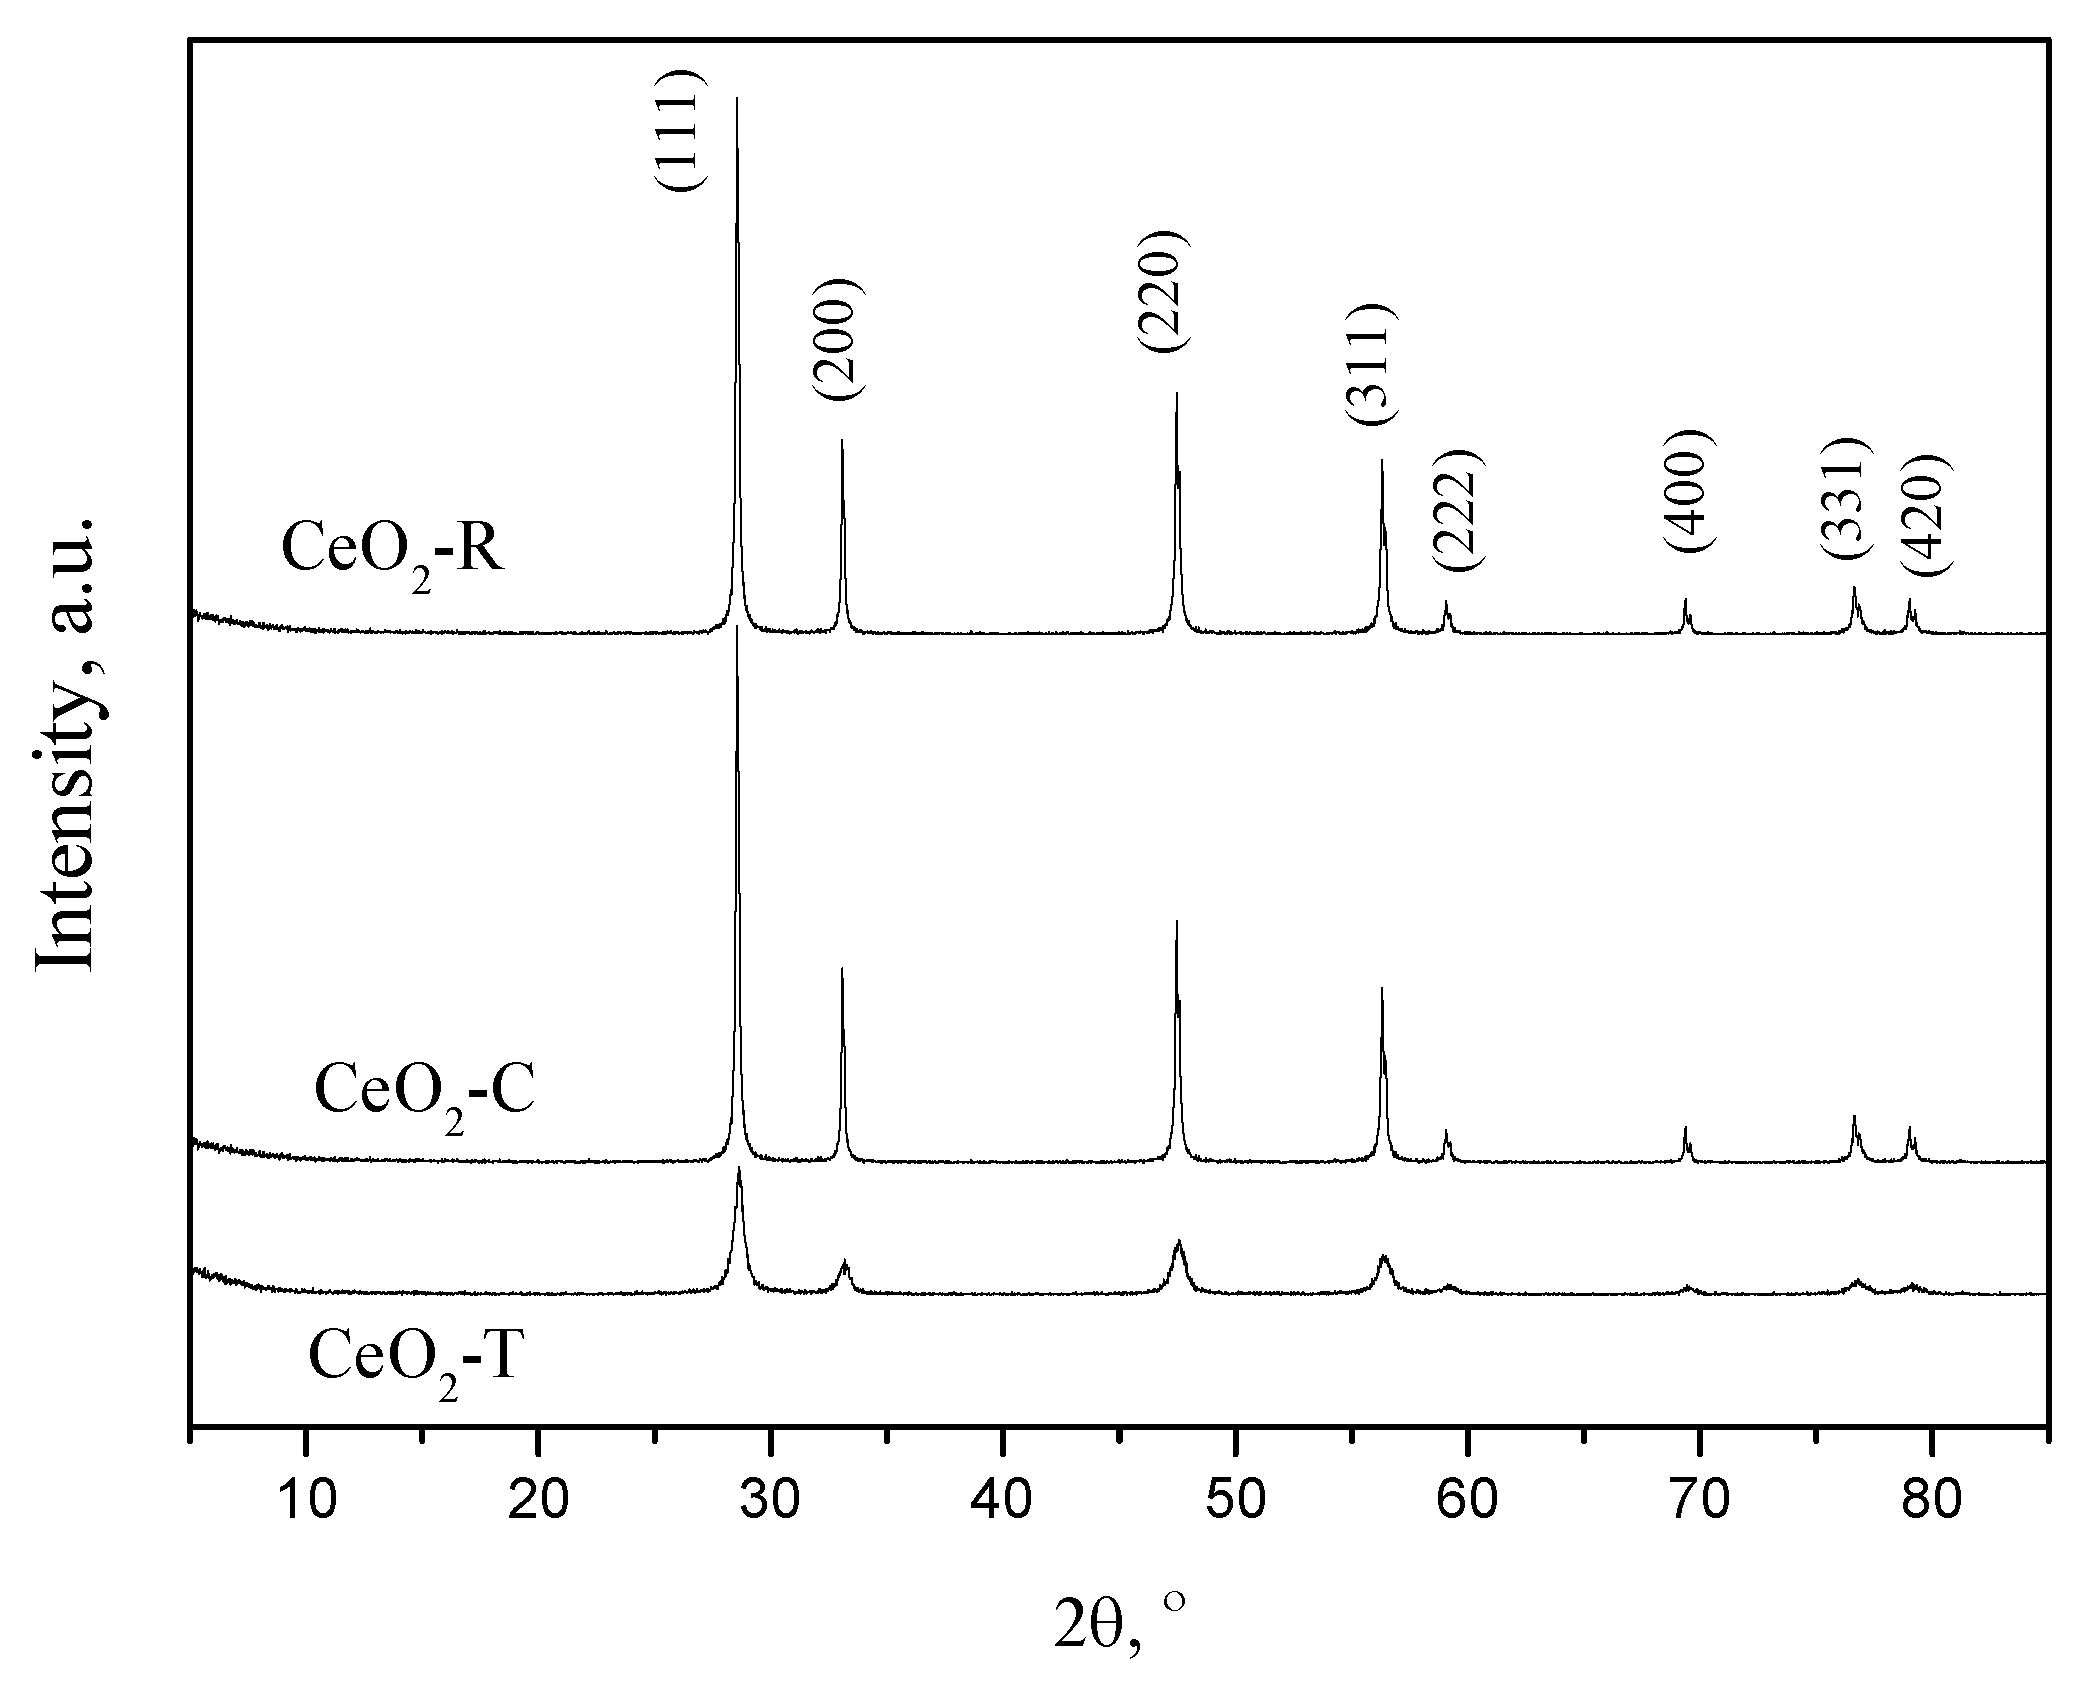
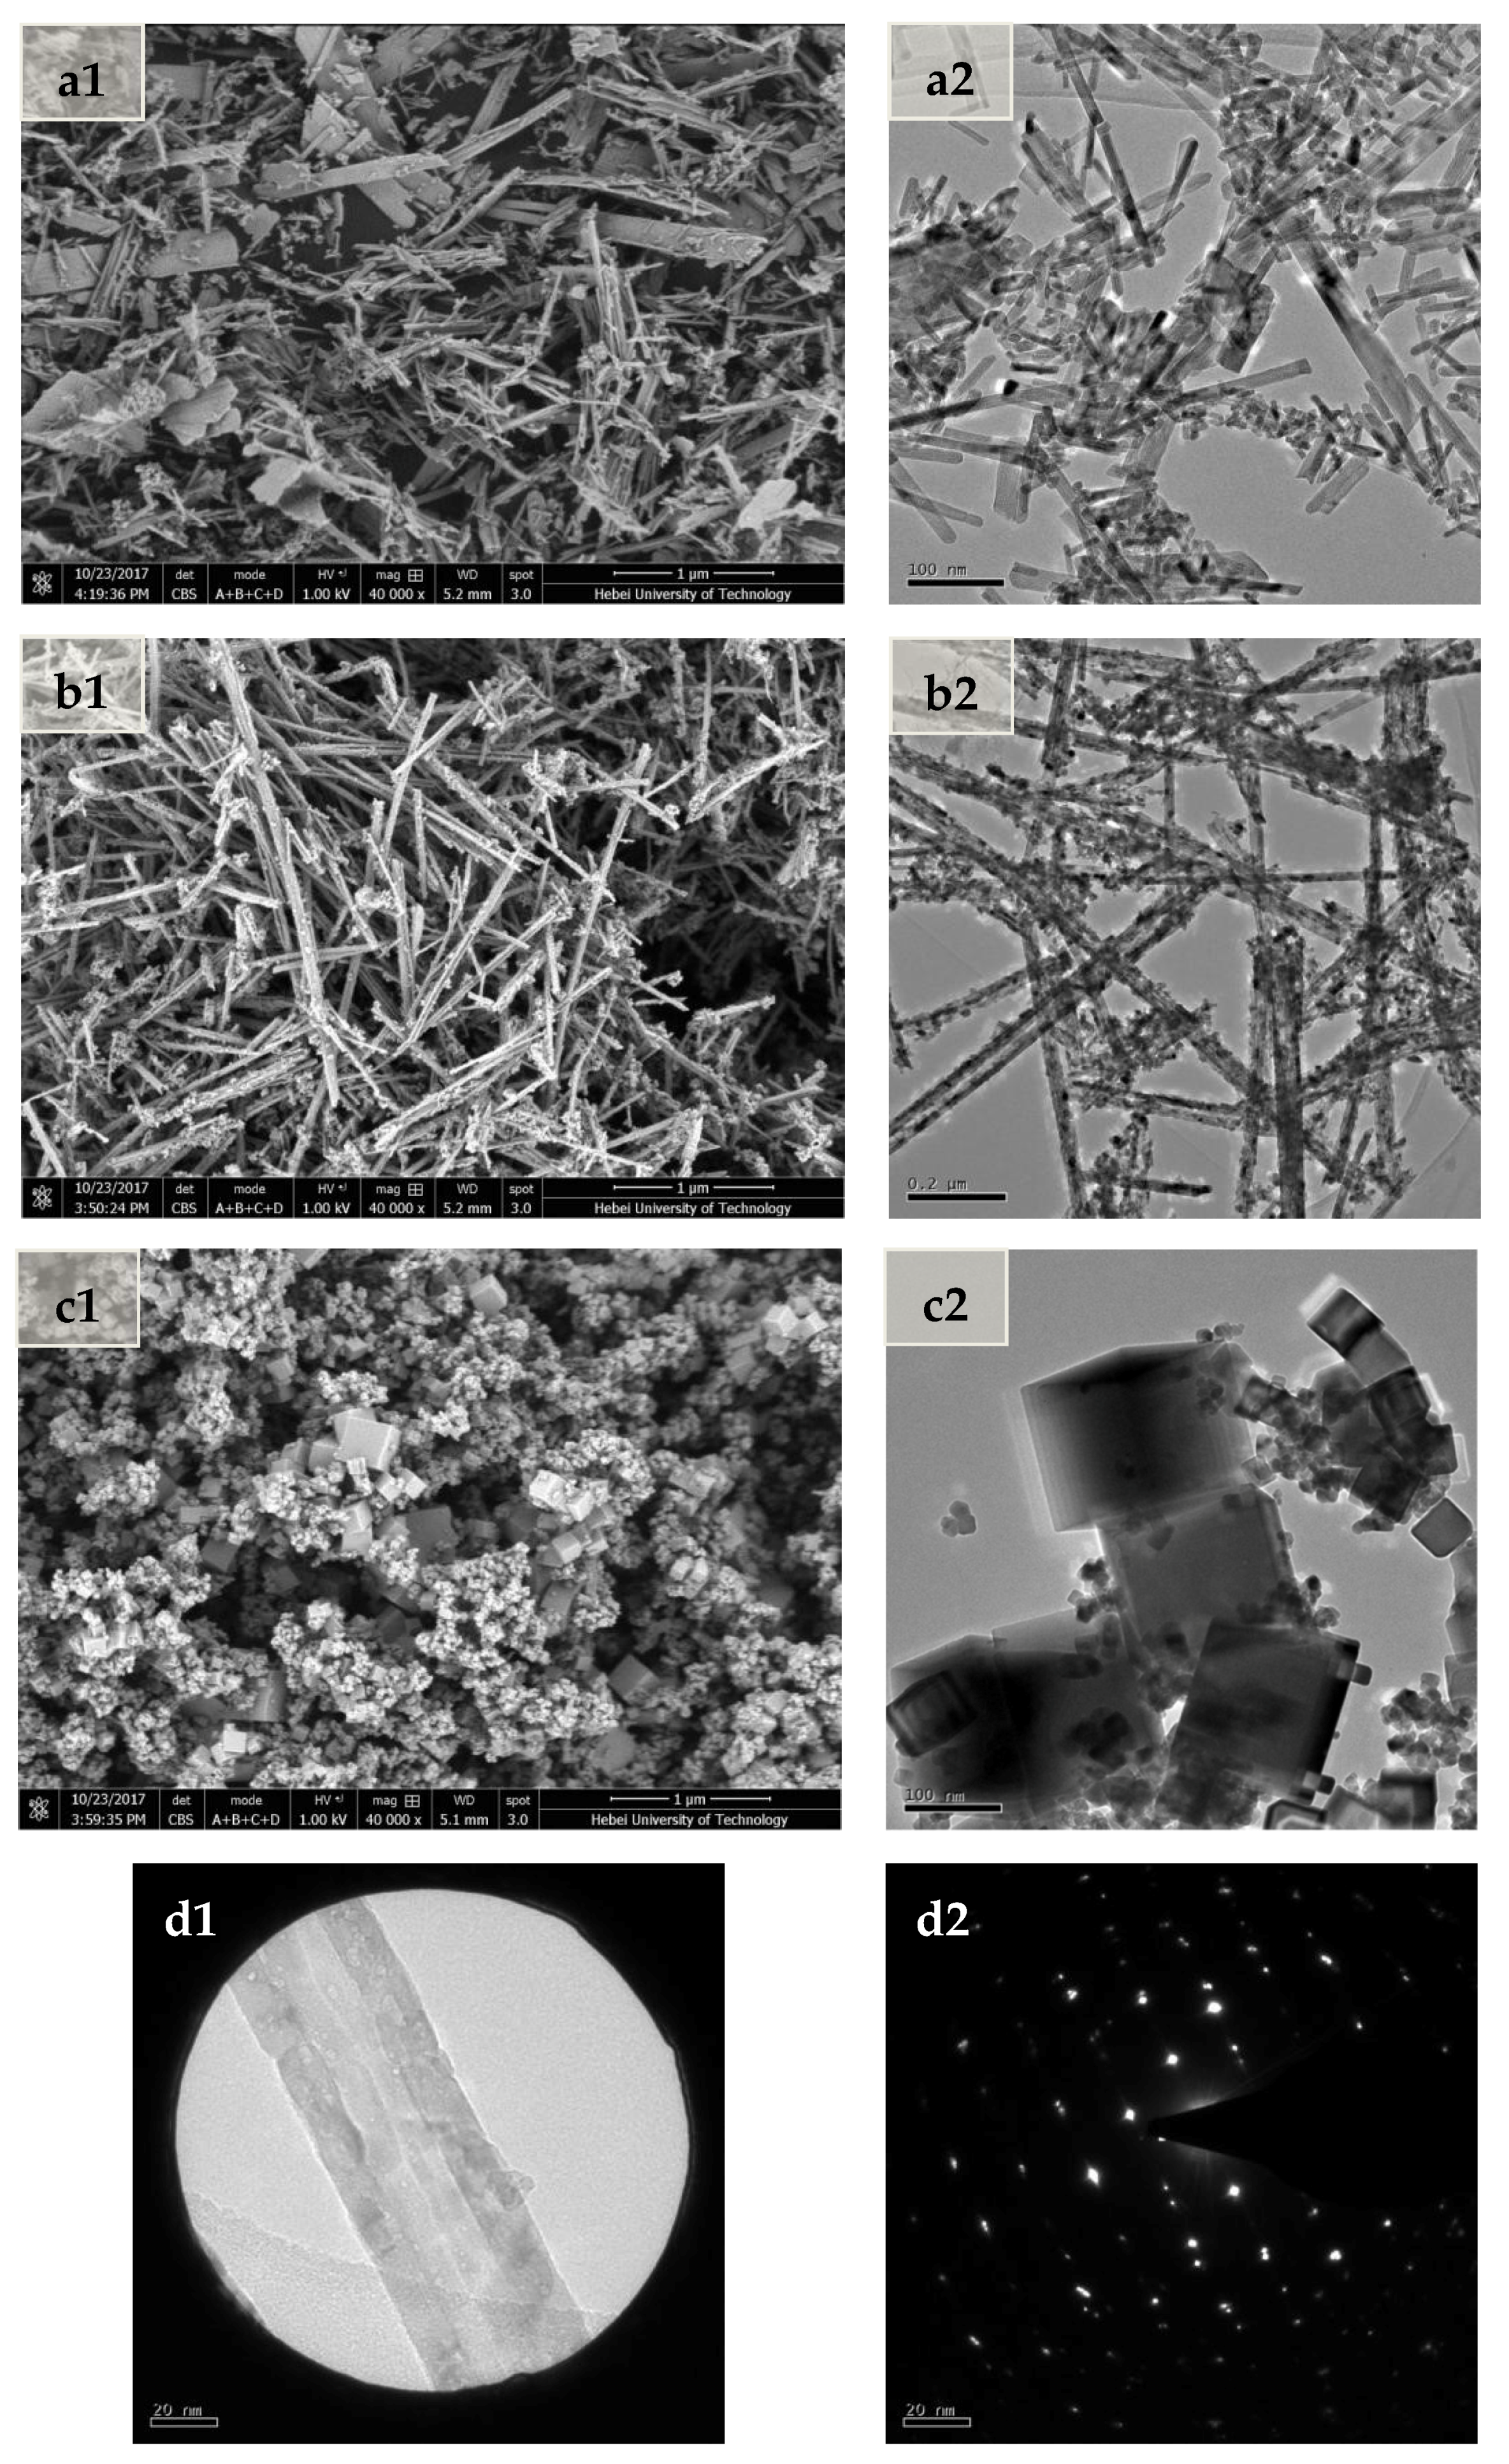
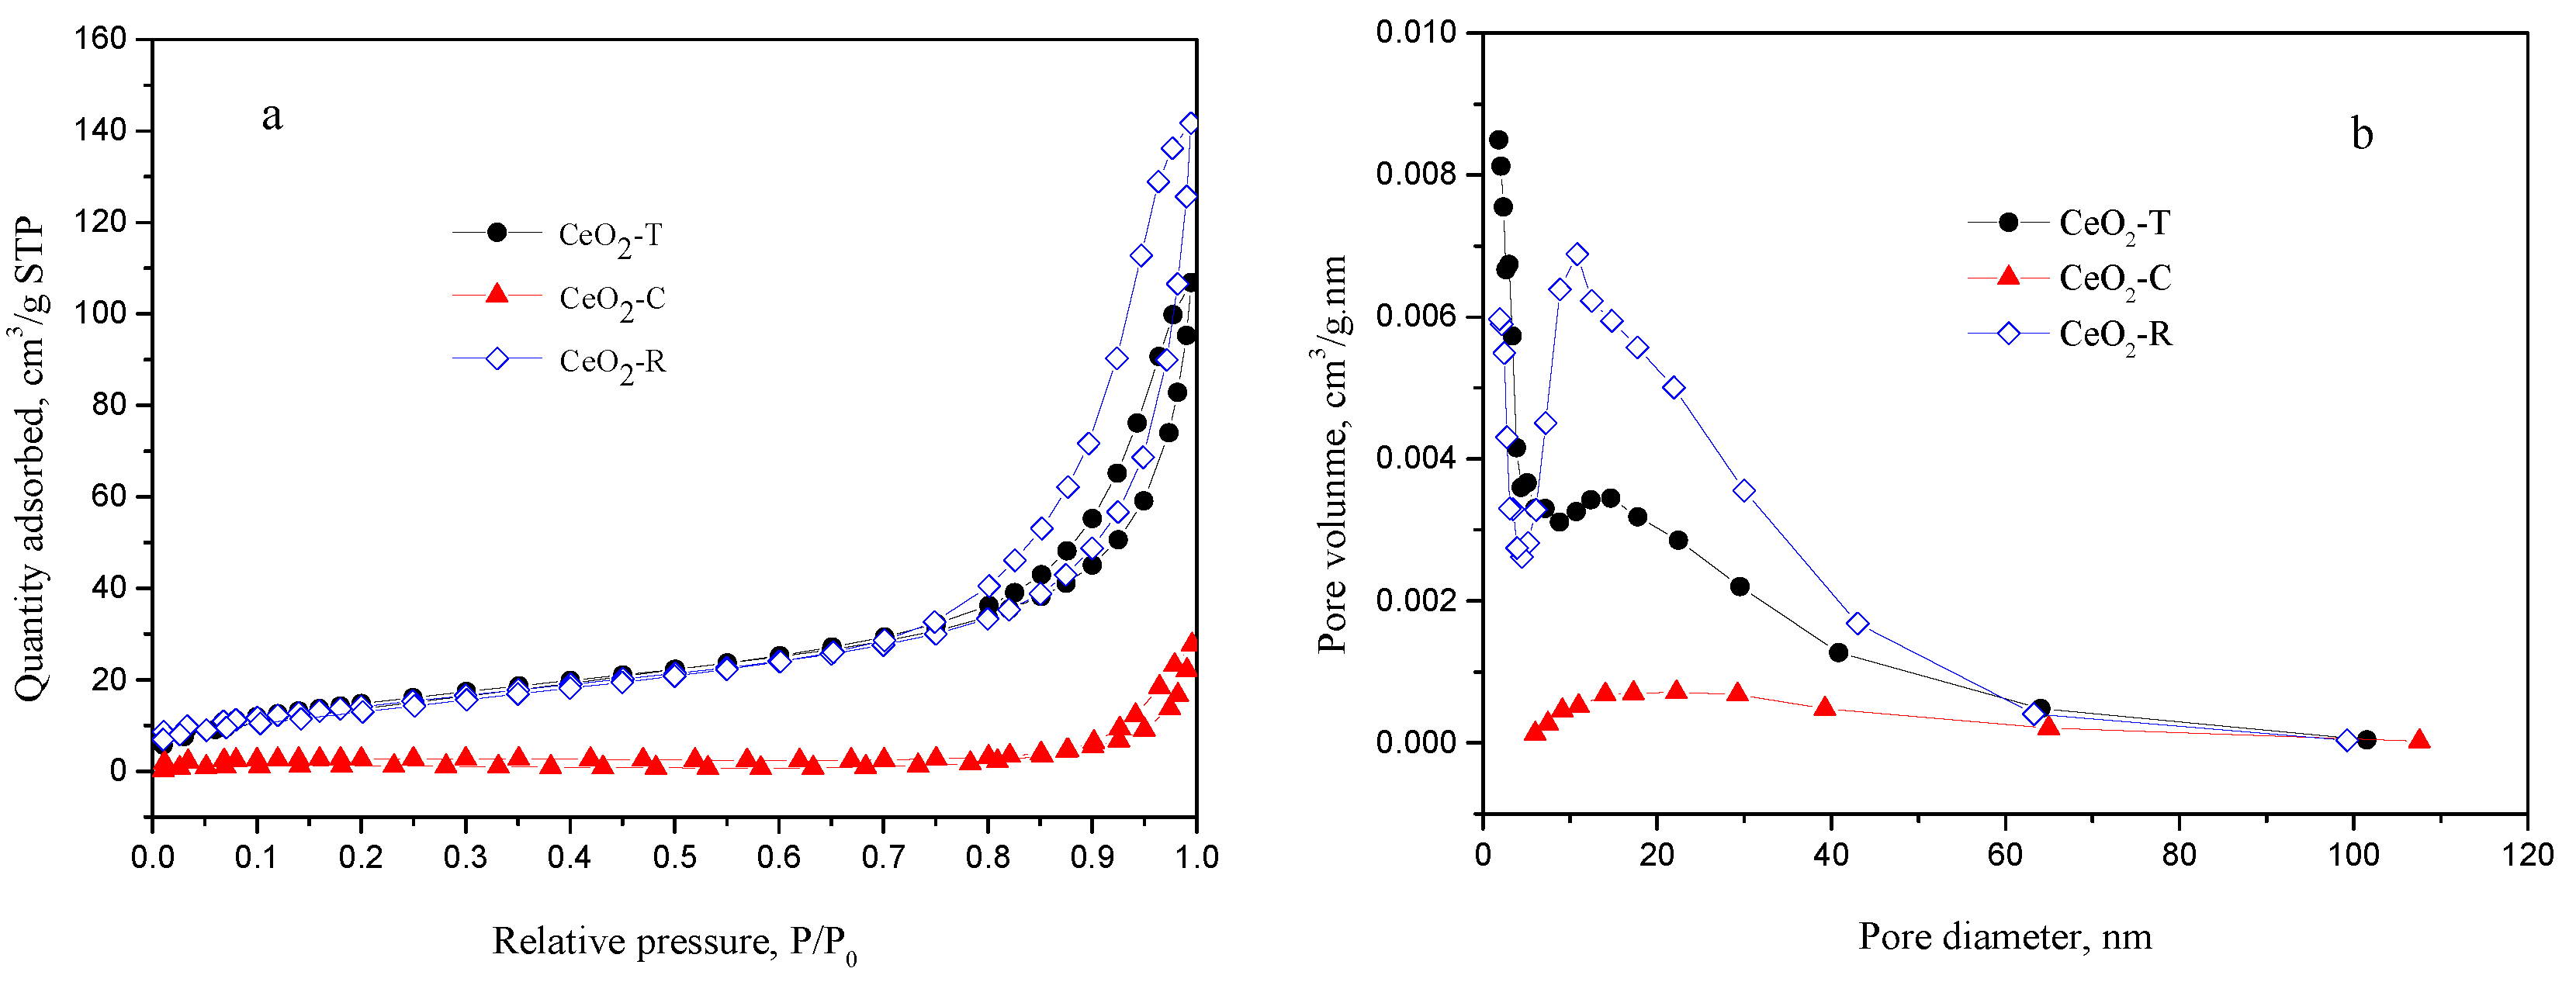
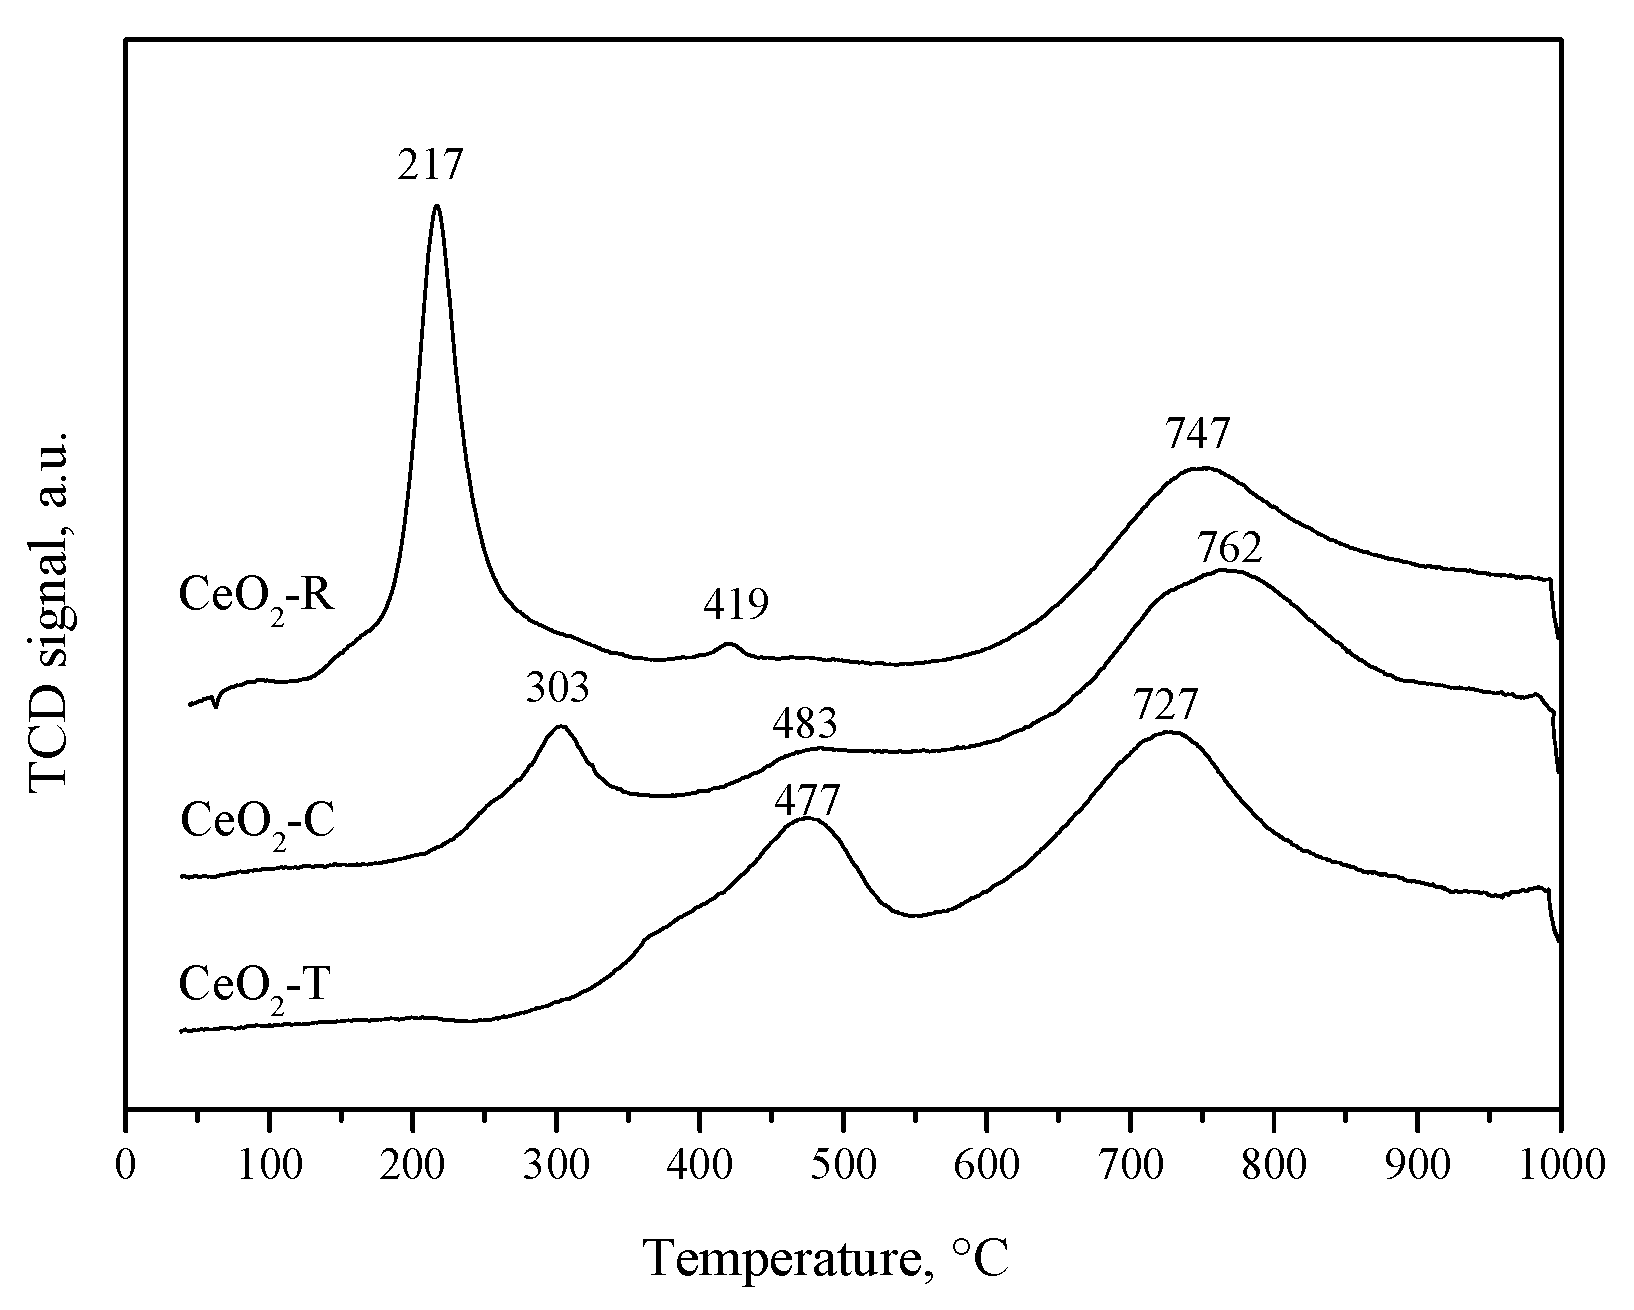
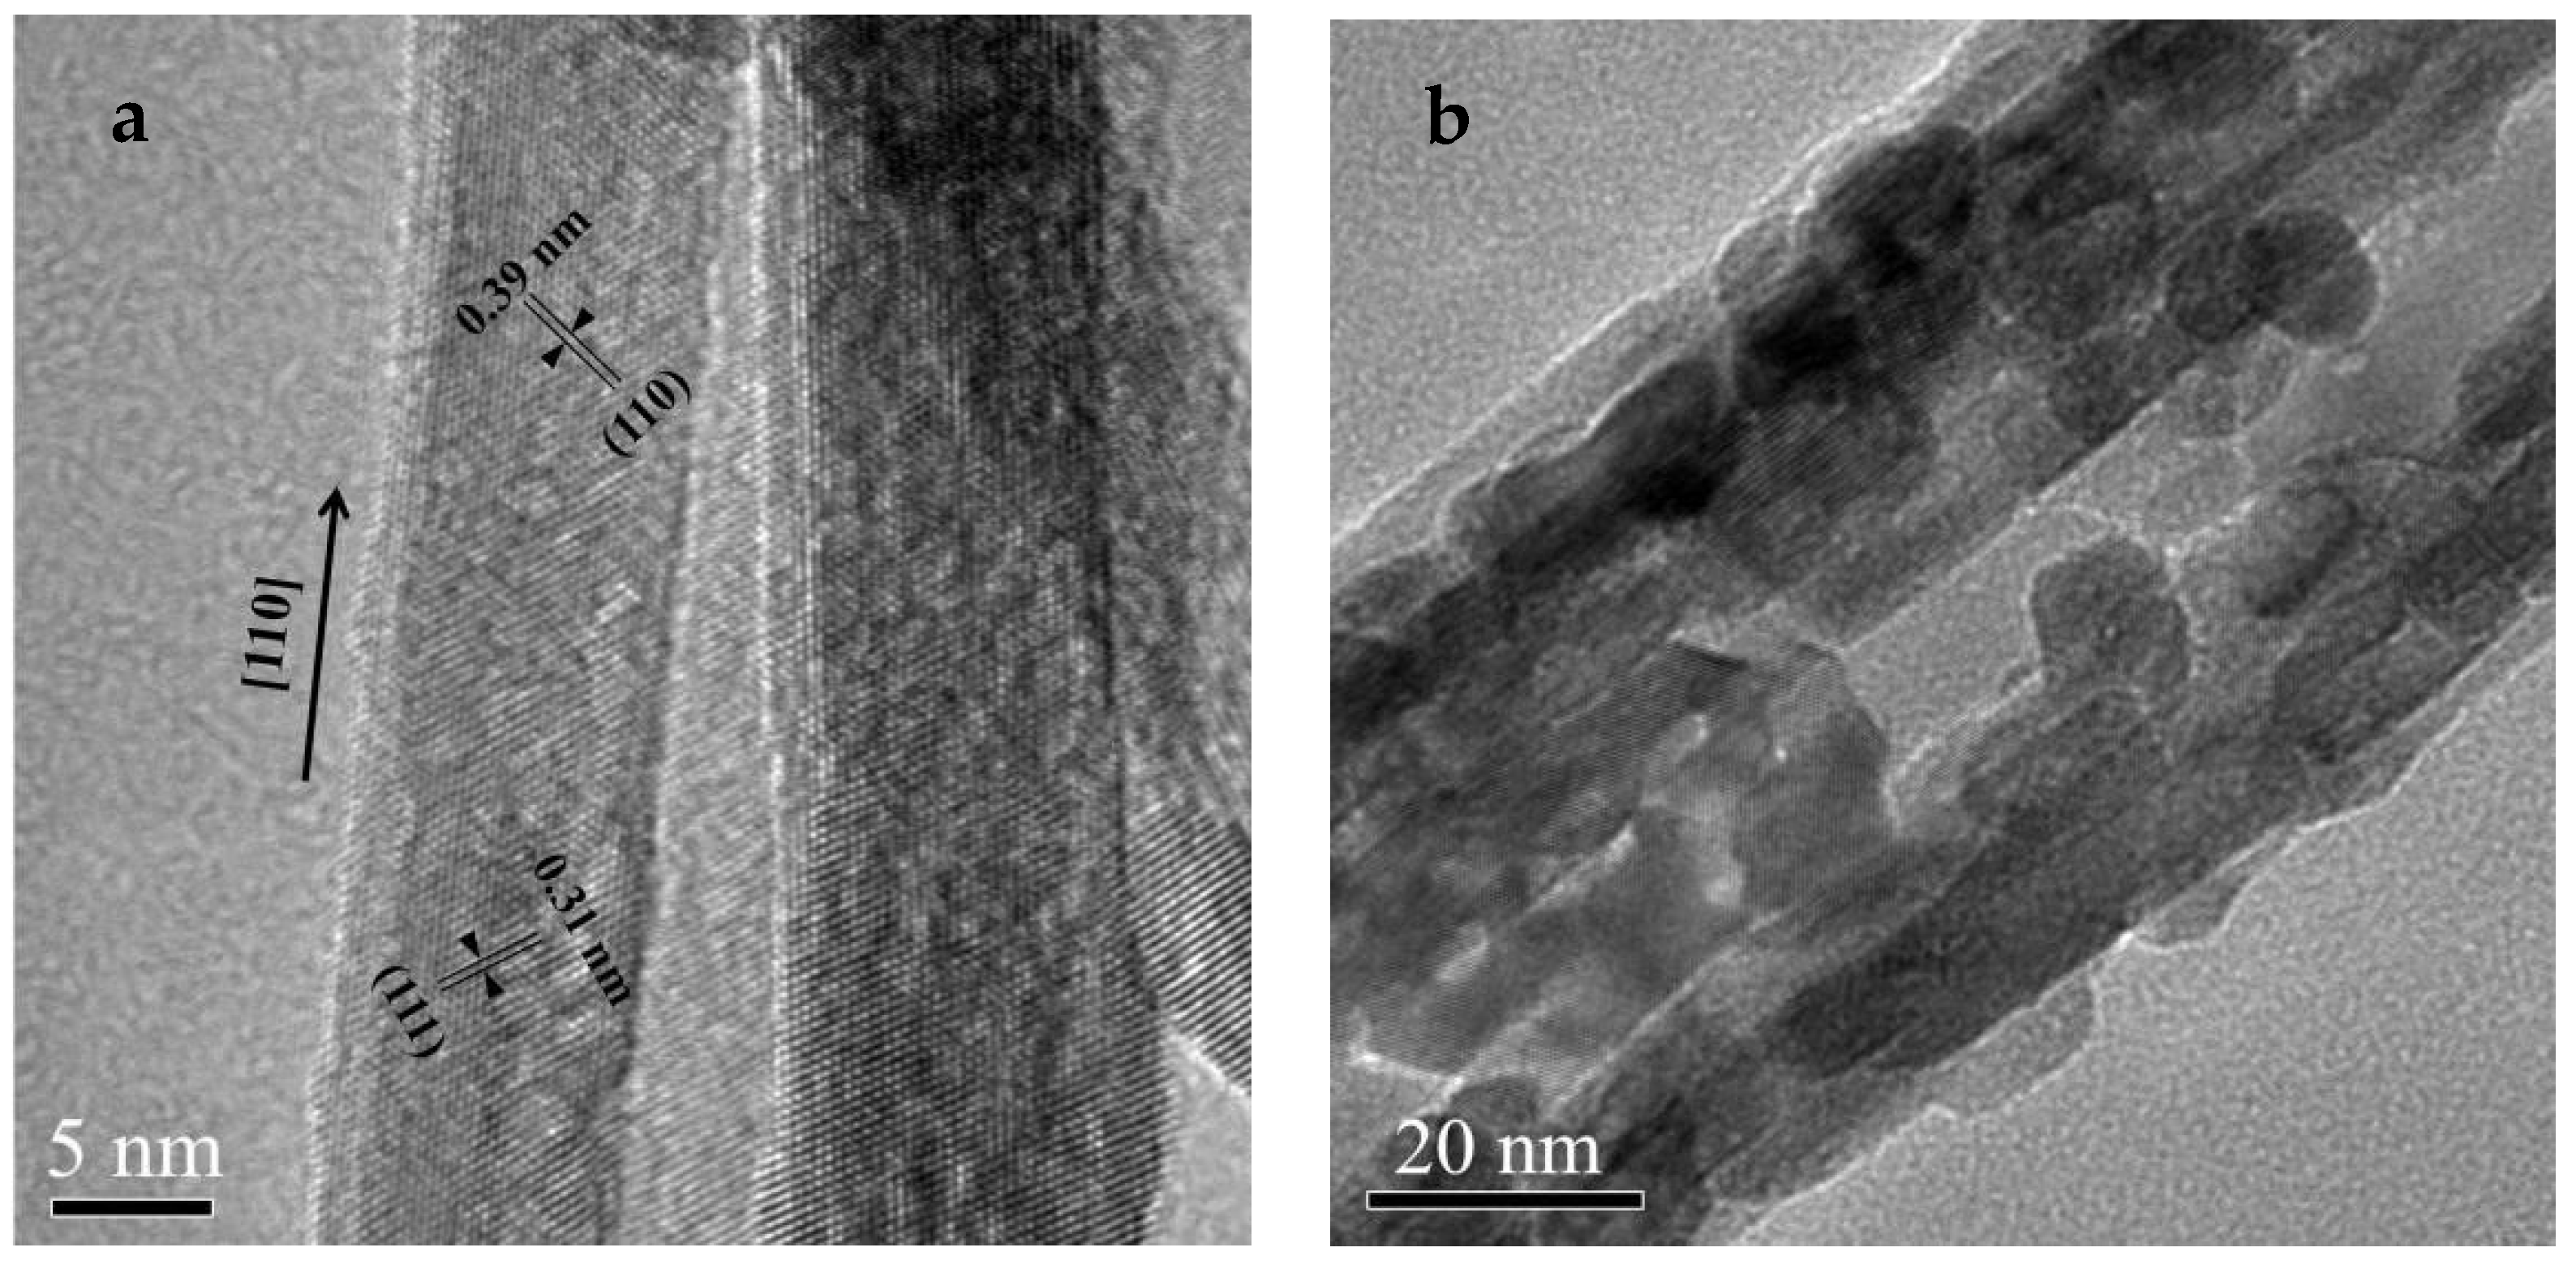
2.1. Catalyst Characterization

XRD patterns of the three CeO2 samples with different morphologies are shown in Figure 1. There were diffraction peaks at 2θ = 28.5°, 33.1°, 47.5°, 56.3°, 59.1°, 69.4°, 76.7° and 79.1°, which can be ascribed to the {111}, {200}, {220}, {311}, {222}, {400}, {331} and {420} planes of CeO2, respectively. The patterns agree well with those of CeO2 with fluorite structure (JCPDS Card No. 43-1002). There was no significant difference between the patterns of CeO2-R and CeO2-C, and the peaks were strong and sharp. However, the peaks in the pattern of CeO2-T were relatively weak and the full width at half maximum (FWHM) was larger than those of the other two samples. This indicates that CeO2-T is composed of small crystal particles.
The morphologies of the three CeO2 samples were characterized by SEM and TEM. As shown in Figure 2a1,a2, CeO2-R are rod-like particles with lengths of 300 nm–1 μm and diameters of 20–40 nm. Moreover, it can be seen from the SEM image of CeO2-R, there were some plate-like particles. However, in the TEM image, it is almost impossible to find the particles with the ‘two dimensional’ structure. Maybe the ultrasonic treatment during the sample preparation for TEM measurement would be the cause for the disappearance of the special structure.
CeO2-T particles represent the straight tube morphology with lengths of 1–5 μm and external diameters of 30–70 nm (Figure 2a2,b2). Some near-spherical shape particles, with sizes smaller than 30 nm are also found adhered to the outside of the tube. In addition, from the SEM image, part of the CeO2-T shows the side-opening tube structure. Zhao et al. [25] indicated that CeO2 nanotubes might be formed through a process of dissolution-recrystallization, anisotropic growth and self-crimping of the Ce(OH)3 crystal seed. Under the influence of P123, Ce(OH)3 grew along the {110} direction and presented a sheet structure. Then the self-crimping of the sheet structure occurred to reduce the surface energy and it ended with a tube structure. The unfinished self-crimping would lead to a side-opening tube structure. As shown in Figure 2b2, the TEM image of CeO2-T reveals that its tube wall was composed of small CeO2 crystals, with diameters less than 20 nm, which are much smaller than those which formed the particles of CeO2-R or CeO2-C. This is consistent with the results of XRD. However, some ordered tube-like structures are also found in CeO2-T (Figure 2d1). The SAED (Selected Area Electron Diffraction) patterns are shown in Figure 2d2, and the bright point reflections indicate the tube-like particles observed were monocrystals.
Figure 2c1 gives the SEM image of CeO2-C. It can be clearly seen that CeO2 particles of different sizes with cubic morphology were formed along with many small particles. The TEM image, Figure 2c2, shows that the small particles also had cube like morphologies. The particles of CeO2-C, with length of the side about 40–280 nm, had smooth surfaces and ordered morphologies.
The textural properties of the three CeO2 catalysts were investigated by N2 adsorption- desorption at 196 °C, and the results are shown in Table 1 and Figure 3. The specific surface areas of CeO2-R (51.4 m2/g) and CeO2-T (55.6 m2/g) were much larger than that of CeO2-C (9.3 m2/g), which is due to the secondary pores that formed by the packing of CeO2 particles with one-dimensional structures, both rod and tube. In addition, the surface area of CeO2-T was a little larger than that of CeO2-R, which might be attributed to its tubular structure that has two surfaces of inside and outside. As shown in Figure 3, all of the three samples exhibited type IV adsorption isotherms with hysteresis loops of an H3 type, which were due to capillary condensation in mesoporous pores. It can also be seen in Figure 3 that the pores of all CeO2 samples were in the mesoporous range, and the pore size distribution of CeO2-R was more uniform. The adsorption capacity of N2 on CeO2-C was very small, which is accordance with its small surface area.

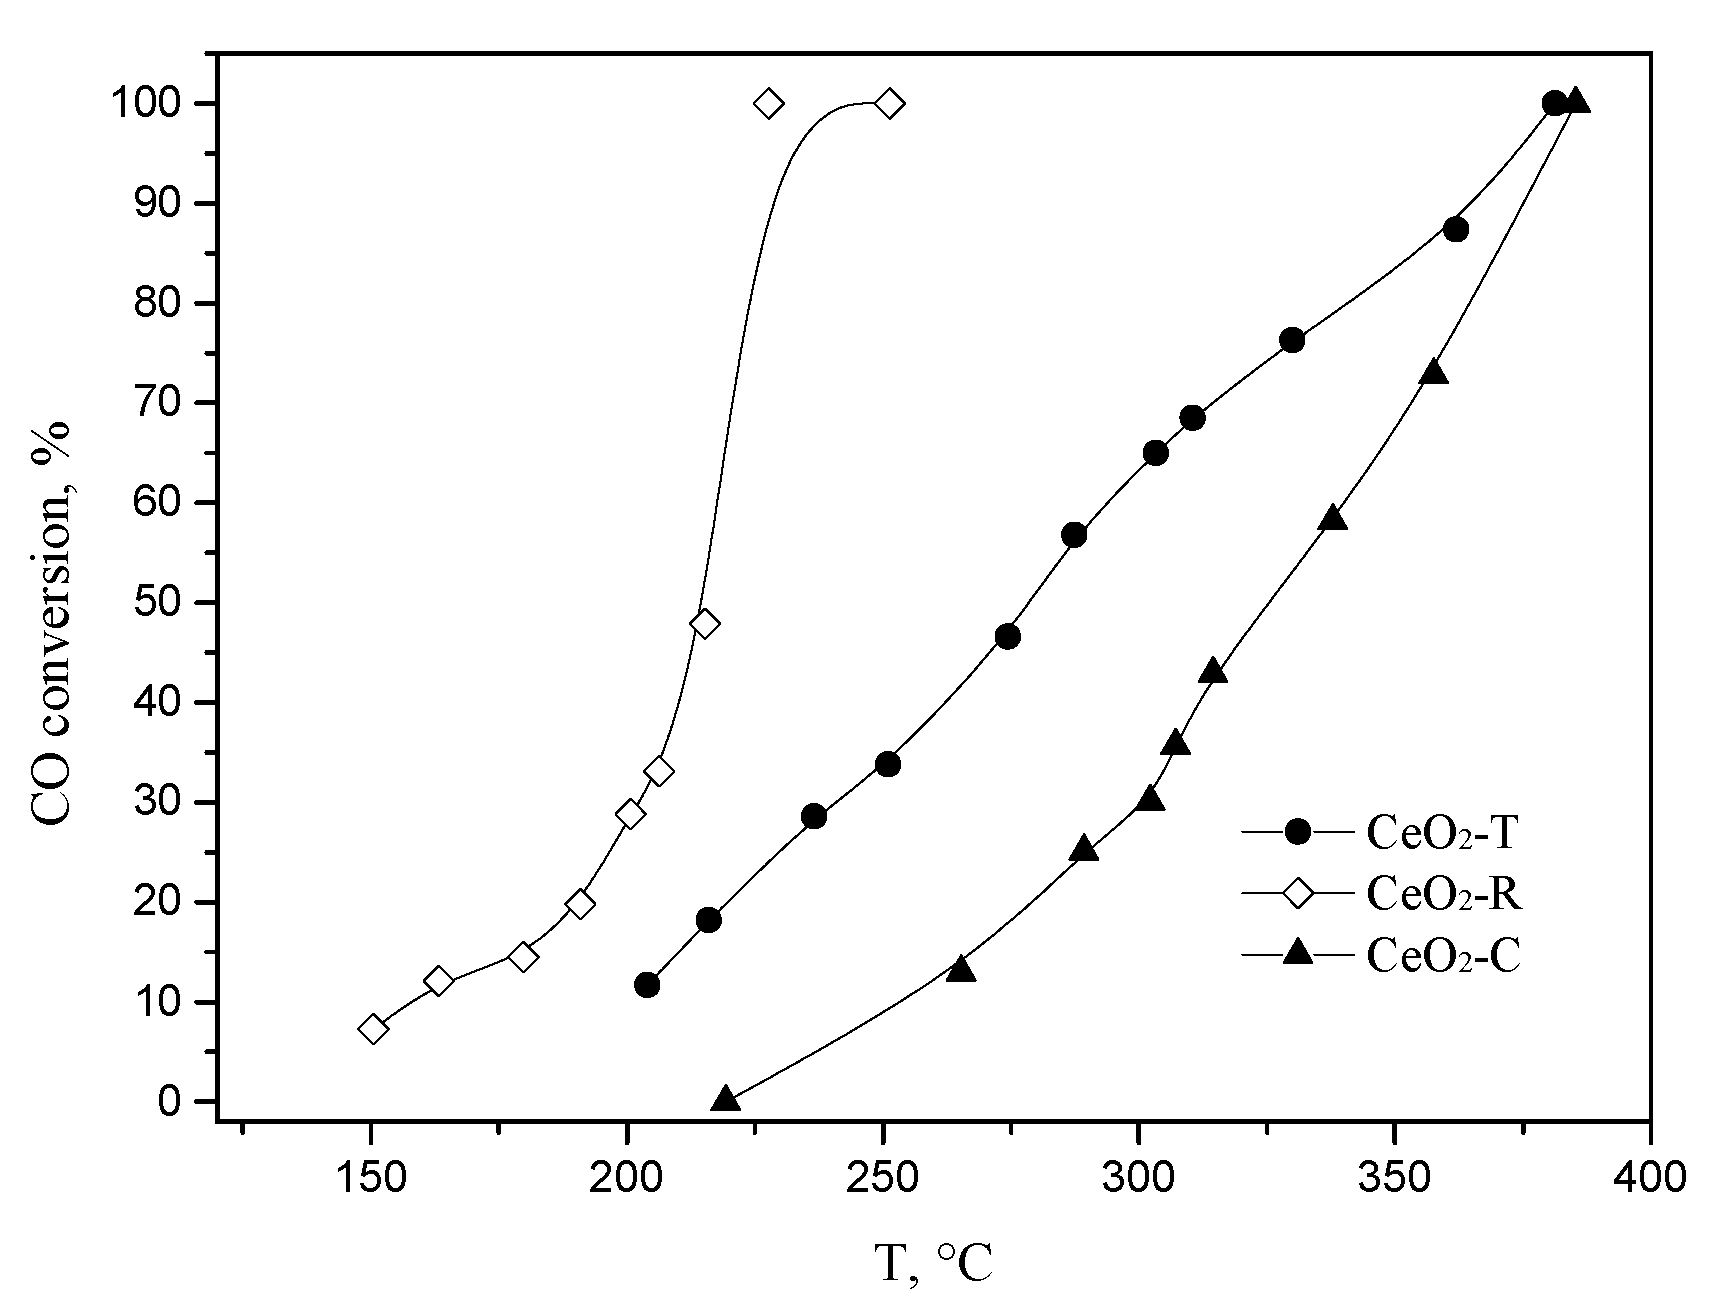
2.2. CO Oxidation Catalyzed by CeO2

The three CeO2 samples with different morphologies were evaluated for their activity in CO oxidation. The results are shown in Figure 4 and Table 1. The CO conversion increased with temperature over all three CeO2 catalysts and CeO2-R exhibited the highest activity. Moreover, the catalytic activity of CeO2-R for CO oxidation was sensitive to reaction temperature. The CO conversion was 28.8% at 200 °C, and it increased promptly to 90.0% at 228 °C. CeO2-T showed almost the same T90 as CeO2-C, but its activity at low temperature was superior to the latter. Because of the relatively large specific surface area, CeO2 with tube like morphologies usually exhibits higher activity in catalytic reaction than the others. Pan et al. [26] found that CeO2 nanotubes gave the best activity for CO oxidation among CeO2 with various morphologies, and they believed this could be due to its high surface area. Zhao et al. [27] also found CeO2 nanotubes demonstrated better catalytic activity on methylene blue decolorization, which could be explained by the exposure of higher active surface {110} and considerable defects on the surface of the CeO2 nanotubes.
To find out the reasons for the difference between the catalytic performance of the three catalysts, H2-TPR measurements were carried out. The results are exhibited in Figure 5 and Table 2.
There were two reduction peaks at 477 °C and 727 °C in TPR curve of CeO2-T. The low temperature peak was attributed to the reduction of surface oxygen species. The latter, high temperature peak, was attributed to the lattice oxygen in the bulk phase [18]. Unlike CeO2-T’s, in the TPR curve of CeO2-C, there was a third peak at 303 °C besides the surface and bulk phase oxygen peak at 483 °C and 762 °C. Table 2 gives the H2 consumption in relation to the reduction peaks, and it suggests that the bulk oxygen amounts in CeO2-T and CeO2-C were almost equal. However, the surface oxygen quantity in CeO2-C was much lower than that in CeO2-T. If the H2 consumption of the peak at 303 °C is counted, the surface oxygen quantity of CeO2-C (401 μmol/g) approximately equaled that of CeO2-T (415 μmol/g). Thus, the peak at 303 °C should be attributed to another kind of surface oxygen species that can be reduced at much lower temperature, which could be called Surface O-II. It is usually considered that the surface oxygen of CeO2 shows higher activity and can easily react with the adsorbed CO [27]. Gurbani et al. [28] indicated that the higher redox capacity of the catalyst, the higher activity for CO oxidation. Therefore, according to the H2-TPR results, CeO2-C should have superior activity to CeO2-T for CO oxidation. However, the evaluation shows the opposite result and CeO2-T exhibited higher activity than CeO2-C. This may due to the large surface area of CeO2-T (55.6 m2/g) compared to CeO2-C (9.3 m2/g). Li et al. [29] prepared CeO2 samples with different surface areas (67–205 m2/g) and found that the catalytic activity for CO oxidation increased with a specific surface area of CeO2. Guo et al. [30] also revealed similar results using CeO2 catalysts with surface areas of 21–364 m2/g.
Similar to CeO2-C, there were three reduction peaks in the TPR curve of CeO2-R. The bulk oxygen reduction temperature was 747 °C, and the surface oxygen reduction temperature decreased to 419 °C with a small H2 consumption of 26 μmol/g. The third strongest reduction peak was at 217 °C with a H2 consumption of 436 μmol/g. All the data above-mentioned reveal that there were a large amount of surface oxygen species which could be reduced easily and were more active for CO oxidation. Moreover, CeO2-R had a relatively large specific surface area (51.4 m2/g) which was also one of the causes for its high activity.
In addition, High Resolution Transmission Electron Microscope (HRTEM) was conducted to confirm the shape and size of CeO2-R and CeO2-T particles. Figure 6a shows that the surface of CeO2-R was smooth and its growth direction was along the {110} orientation. While CeO2-T (Figure 6b) was composed of small particles, smaller than 20 nm, which assembled the hollow tubular structure. Zhou et al. [31] has indicated that CeO2 nanorods had unusually exposed {001} and {110} planes which were more reactive for CO oxidation than the irregular nanoparticles, that exposed more of the stable {111} planes. Therefore, in this study, the catalytic activity of CeO2-T for CO oxidation was inferior to that of CeO2-R, because the former was a combination of small particles and did not have the characteristics of CeO2 nanotubes, though it had a tubular-like structure.
A comparison of the activity of CeO2-R with reported catalysts is illustrated in Table 3. Because the feed gas composition and space velocity were different, the values here allow only a qualitative comparison. It can be seen from the data in Table 3 that CeO2-R provided the lowest T90 which means the best catalytic activity. However, it’s worth noting that CeO2 core-shell microspheres, reported by Zhang et al. [32], also exhibited excellent activity for CO oxidation with T90 of 275 °C when space velocity was 60,000 mL·gcat−1·h−1, though the reduction temperature of surface oxygen species over their catalyst was much higher than that of CeO2-R. Combined with our experimental results and data from references, it could be concluded that it’s not easy to determine the catalytic activities of CeO2 samples for CO oxidation. Many factors, including morphology, size, texture properties, oxygen species reducibility, and/or something else, may influence the reaction synergistically.

3. Materials and Methods

3.1. Materials

All of the reagents were analytical grade and used without further purification. Polyethylene oxide-polypropylene oxide-polyethyleneoxide (PEO-PPO-PEO) triblock co-polymers (P123) was purchased from Sigma-Aldrich (ST. Louis, MO, USA). Cerium (III) chloride heptahydrate, cerium (III) nitrate nexahydrate, aqueous ammonia (25%) and sodium hydroxide were purchased from Sinoreagent (Shanghai, China).

3.2. Preparation of CeO2 with Different Morphologies

3.2.1. CeO2 Nanorods

Preparation of CeO2 nanorods was carried out via a hydrothermal process. Typically, 6 g of Ce(NO3)3·6H2O, 84 g of NaOH and 150 mL of deionized water were mixed and stirred for 30 min. Then, the mixture was transferred into an autoclave with a Teflon liner and underwent the hydrothermal reaction process at 110 °C for 24 h. After that, the precipitate was filtered, repeatedly washed with deionized water (Jingchun, Tianjin, China) and anhydrous ethanol (Kermel, Tianjin, China) several times until the pH reached 7. Finally, it was dried at 80 °C and calcined at 500 °C for 4 h. The obtained sample was rod-like CeO2 and denoted as CeO2-R.

3.2.2. CeO2 Nanotubes

Firstly, 17.4 g of P123 with a molecule of 5800 was dissolved in a mixture of 60 mL ethanol and 60 mL deionized water in an ultrasonic water bath for 1 h at room temperature. Then, 5.58 g of CeCl3·7H2O was added into the solution and stirred for 30 min. After that, NH3·H2O was added dropwise until the pH was adjusted to 10 and a red flocculent precipitate was formed. After stirring for another 1 h, the mixture was transferred into an autoclave with a Teflon liner for the hydrothermal reaction process at 160 °C for 72 h. Thirdly, the precipitate was filtered, repeatedly washed with deionized water and anhydrous ethanol several times until the pH reached 7. Finally, the solid was dried at 80 °C and calcined at 500 °C for 4 h. The obtained sample was denoted as CeO2-T.

3.2.3. CeO2 Nanocubes

Typically, 6 g of Ce(NO3)3·6H2O, 84 g of NaOH and 150 mL of deionized water were mixed and stirred for 30 min. Then, the mixture was transferred into an autoclave with a Teflon liner and underwent the hydrothermal reaction process at 160 °C for 24 h. After that, the precipitate was filtered, repeatedly washed with deionized water and anhydrous ethanol several times until the pH reached 7. Finally, it was dried at 80 °C and calcined at 500 °C for 4 h. The sample was denoted as CeO2-C.

3.3. Catalyst Characterization

X-ray diffraction (XRD) patterns were recorded using a Rigaku D/Max-2500 X-ray diffractometer (Tokyo, Japan) with Cu Kαradiation (40 kV, 100 mA) at the scanning range of 5°–85°. The scanning electron microscopy (SEM) images were recorded on a FEI Nova NanoSEM 450 (Hillsboro, OR, USA) and all samples were gold-coated. Transmission electron microscope (TEM) images and selected area electron diffraction (SAED) were obtained with a FEI Tecnai G2 F20 (Hillsboro, OR, USA) at 200 kV.
The textural properties of the samples were measured by a N2 adsorption–desorption method using a Micromeritics ASAP 2020 M+C physisorption analyzer (Norcross, GA, USA). The specific surface area was calculated by a BET method. Hydrogen temperature-programmed reduction (H2-TPR) was carried out using a Micromeritics AutoChem II-2920 automated catalyst characterization system (Norcross, GA, USA). The sample (0.1 g) was purged in Ar (50 mL/min) at ambient temperature. After that, the flowing gas was changed to a H2/Ar mixture (10%/90%, 50 mL/min) and the sample was heated to 1000 °C at an increasing rate of 10 °C/min. The H2 consumption was tested using a thermal conductivity detector (TCD).

3.4. Catalytic Activity Tests

The catalytic activity test for CO oxidation was performed in a fixed-bed reactor (a stainless steel tube reactor with an inner diameter of 10 mm and length of 30 cm) at atmospheric pressure in the temperature range of 150–400 °C. The catalyst (500 mg, 40–60 mesh) was mounted in the reactor, and the reaction gas mixture (CO:O2:N2 = 1%:9%:90%) was fed through the catalyst bed at a designed flow rate.
The composition of the gas mixture was analyzed using an online Agilent 7890B gas chromatograph (Agilent Technologies, Santa Clara, CA, USA) equipped with a TCD detector. The CO conversion (XCO) was calculated as follows:
X CO ( % ) = [ CO ] in [ CO ] out [ CO ] in × 100

4. Conclusions

In summary, nanostructured CeO2 samples with rod (CeO2-R), cubic (CeO2-C) and tube (CeO2-T) morphologies were prepared through a hydrothermal method. It was shown that CeO2-R exhibits the highest catalytic activity for CO oxidation (T90 was 228 °C at space velocity of 12,000 mL·gcat−1·h−1) than the prepared samples with other morphologies, such as CeO2-T and CeO2-C. Characterization of the CeO2-R catalyst has shown that there are much more easily reducible oxygen species, with a reduction temperature of 217 °C on its surface, which was responsible for the high catalytic activity. It should be emphasized that CeO2-R sample possessed a large specific surface area (51.4 m2/g), that could be another reason of its superior activity.

Author Contributions

Investigation, G.F. and W.H.; writing and original draft preparation, G.F. and Z.W.; writing, review and editing, F.L. and W.X.; project administration, W.X.

Funding

This research was funded by Natural Science Foundation of Hebei [B2015202228], Natural Science Foundation of Tianjin [17JCYBJC20100] and the Funding Programme for Scientific Activities of Selected Returns from abroad of Hebei [CL201605].

Conflicts of Interest

The authors declare no conflicts of interest.

References

  1. Wang, J.X.; Zhuo, Y.; Zhou, Y.; Wang, H.J.; Yuan, R. Ceria doped zinc oxide nanoflowers enhanced luminol-based electrochemiluminescence immunosensor for amyloid-β detection. ACS Appl. Mater. Interfaces 2016, 8, 12968–12975. [Google Scholar] [CrossRef] [PubMed]
  2. Suzuki, K.; Miyazaki, H.; Yuzuriha, Y.; Maru, Y.; Izu, N. Characterization of a novel gas sensor using sintered ceria nanoparticles for hydrogen detection in vacuum conditions. Sens. Actuators B. Chem. 2017, 250, 617–622. [Google Scholar] [CrossRef]
  3. Chandrakala, E.; Praveen, J.P.; Kumar, A.; James, A.R.; Das, D. Strain-induced structural phase transition and its effect on piezoelectric properties of (BZT-BCT)-(CeO2) ceramics. J. Am. Ceram. Soc. 2016, 99, 3659–3669. [Google Scholar] [CrossRef]
  4. Kim, C.K.; Kim, T.; Choi, I.Y.; Soh, M.; Kim, D.; Kim, Y.J.; Jang, H.; Yang, H.S.; Kim, J.Y.; Park, H.K.; et al. Ceria nanoparticles that can protect against ischemic stroke. Angew. Chem. Int. Ed. 2012, 51, 11039–11043. [Google Scholar] [CrossRef] [PubMed]
  5. Xu, C.; Lin, Y.; Wang, J.; Wu, L.; Wei, W.; Ren, J.; Qu, X. Nanoceria-triggered synergetic drug release based on CeO2-capped mesoporous silica host-guest interactions and switchable enzymatic activity and cellular effects of CeO2. Adv. Healthc. Mater. 2013, 2, 1591–1599. [Google Scholar] [CrossRef] [PubMed]
  6. Montini, T.; Melchionna, M.; Monai, M.; Fornasiero, P. Fundamentals and catalytic applications of CeO2-based materials. Chem. Rev. 2016, 116, 5987–6041. [Google Scholar] [CrossRef] [PubMed]
  7. Mei, Z.; Li, Y.; Fan, M.; Zhao, L.; Zhao, J. Effect of the interactions between Pt species and ceria on Pt/ceria catalysts for water gas shift: The XPS studies. Chem. Eng. J. 2015, 259, 293–302. [Google Scholar] [CrossRef]
  8. Manwar, N.R.; Chilkalwar, A.A.; Nanda, K.K.; Chaudhary, Y.S.; Subrt, J.; Rayalu, S.S.; Labhsetwar, N.K. Ceria supported Pt/PtO-nanostructures: Efficient photocatalyst for sacrificial donor assisted hydrogen generation under visible-NIR light irradiation. ACS Sustain. Chem. Eng. 2016, 4, 2323–2332. [Google Scholar] [CrossRef]
  9. Haneda, M.; Kaneko, T.; Kamiuchi, N.; Ozawa, M. Improved three-way catalytic activity of bimetallic Ir–Rh catalysts supported on CeO2–ZrO2. Catal. Sci. Technol. 2015, 5, 1792–1800. [Google Scholar] [CrossRef]
  10. Alikin, E.A.; Vedyagin, A.A. High temperature interaction of rhodium with oxygen storage component in three-way catalysts. Top. Catal. 2016, 59, 1033–1038. [Google Scholar] [CrossRef]
  11. Lykhach, Y.; Figueroba, A.; Camellone, M.F.; Neitzel, A.; Skála, T.; Negreiros, F.R.; Vorokhta, M.; Tsud, N.; Prince, K.C.; Fabris, S.; et al. Reactivity of atomically dispersed Pt2+ species towards H2: Model Pt-CeO2 fuel cell catalyst. Phys. Chem. Chem. Phys. 2016, 18, 7672–7679. [Google Scholar] [CrossRef] [PubMed]
  12. Ang, M.L.; Oemar, U.; Saw, E.T.; Mo, L.; Kathiraser, Y.; Chia, B.H.; Kawi, S. Highly active Ni/xNa/CeO2 catalyst for the water–gas shift reaction: Effect of sodium on methane suppression. ACS Catal. 2014, 4, 3237–3248. [Google Scholar] [CrossRef]
  13. Mamontov, G.V.; Grabchenko, M.V.; Sobolev, V.I.; Zaikovskii, V.I.; Vodyankina, O.V. Ethanol dehydrogenation over Ag-CeO2/SiO2 catalyst: Role of Ag-CeO2 interface. Appl. Catal. A–Gen. 2016, 528, 161–167. [Google Scholar] [CrossRef]
  14. Wang, C.; Wen, C.; Lauterbach, J.; Sasmaz, E. Superior oxygen transfer ability of Pd/MnOx-CeO2 for enhanced low temperature CO oxidation activity. Appl. Catal. B. Environ. 2017, 206, 1–8. [Google Scholar] [CrossRef]
  15. Hou, T.; Yu, B.; Zhang, S.; Xu, T.; Wang, D.; Cai, W. Hydrogen production from ethanol steam reforming over Rh/CeO2 catalyst. Catal. Commun. 2015, 58, 137–140. [Google Scholar] [CrossRef]
  16. Wang, Y.; Zhao, J.; Wang, T.; Li, Y.; Li, X.; Yin, J.; Wang, C. CO2 photoreduction with H2O vapor on highly dispersed CeO2/TiO2 catalysts: Surface species and their reactivity. J. Catal. 2016, 337, 293–302. [Google Scholar] [CrossRef]
  17. Li, Y.; Shen, W. Morphology-dependent nanocatalysis on metal oxides. Sci. China Chem. 2012, 55, 2485–2496. [Google Scholar] [CrossRef] [Green Version]
  18. Yuan, Y.; Wang, Z.; An, H.; Xue, W.; Wang, Y. Oxidative carbonylation of phenol with a Pd-O/CeO2-nanotube catalyst. Chin. J. Catal. 2015, 36, 1142–1154. [Google Scholar] [CrossRef]
  19. Gawade, P.; Mirkelamoglu, B.; Ozkan, U.S. The role of support morphology and impregnation medium on the water gas shift activity of ceria-supported copper catalysts. J. Phys. Chem. C 2010, 114, 18173–18181. [Google Scholar] [CrossRef]
  20. Hou, F.; Li, H.; Yang, Y.; Dong, H.; Cui, L.; Zhang, X. Preparation and catalytic oxidation of CO with specific morphology and porous nano CeO2. Chem. Ind. Eng. Prog. 2017, 36, 2481–2487. [Google Scholar] [CrossRef]
  21. Zhou, Y.; Wang, Z.; Liu, C. Perspective on CO oxidation over Pd-based catalysts. Catal. Sci. Technol. 2015, 5, 69–81. [Google Scholar] [CrossRef]
  22. Ta, N.; Zhang, M.; Li, J.; Li, H.; Li, Y.; Shen, W. Morphology-dependent redox and catalytic properties of CeO2 nanostructures: Nanowires, nanorods and nanoparticles. Catal. Today 2009, 148, 179–183. [Google Scholar] [CrossRef]
  23. González-Rovira, L.; Sánchez-Amaya, J.M.; López-Haro, M.; del Rio, E.; Hungría, A.B.; Midgley, P.; Calvino, J.J.; Bernal, S.; Botana, F.J. Single-step process to prepare CeO2 nanotubes with improved catalytic activity. Nano Lett. 2009, 9, 1395–1400. [Google Scholar] [CrossRef] [PubMed]
  24. Zhang, X.; Hou, F.; Yang, Y.; Wang, Y.; Liu, N.; Chen, D.; Yang, Y. A facile synthesis for cauliflower like CeO2 catalysts from Ce-BTC precursor and their catalytic performance for CO oxidation. Appl. Surf. Sci. 2017, 423, 771–779. [Google Scholar] [CrossRef]
  25. Zhao, X.B.; You, J.; Lu, X.W.; Chen, Z.G. Hydrothermal synthesis, characterization and property of CeO2 nanotube. J. Inorg. Mater. 2011, 26, 159–164. [Google Scholar] [CrossRef]
  26. Pan, C.; Zhang, D.; Shi, L.; Fang, J. Template-free synthesis, controlled conversion, and CO oxidation properties of CeO2 nanorods, nanotubes, nanowires, and nanocubes. Eur. J. Inorg. Chem. 2008, 15, 2429–2436. [Google Scholar] [CrossRef]
  27. Zhan, W.C.; Guo, Y.; Gong, X.Q.; Guo, Y.L.; Wang, Y.Q. Surface oxygen activation on CeO2 and its catalytic performances for oxidation reactions. Sci. Sin. Chim. 2012, 42, 433–445. [Google Scholar] [CrossRef]
  28. Gurbani, A.; Ayastuy, J.L.; González-Marcos, M.P.; Gutiérrez-Ortiz, M.A. CuO-CeO2 catalysts synthesized by various methods: Comparative study of redox properties. Int. J. Hydrogen Energy 2010, 35, 11582–11590. [Google Scholar] [CrossRef]
  29. Li, X.; Chen, F.; Lu, X.; Ni, C.; Chen, Z. Modified-EISA synthesis of mesoporous high surface area CeO2 and catalytic property for CO oxidation. J. Rare Earth 2009, 27, 943–947. [Google Scholar] [CrossRef]
  30. Guo, M.N.; Guo, C.X.; Jin, L.Y.; Wang, Y.J.; Lu, J.Q.; Luo, M.F. Nano-sized CeO2 with extra-high surface area and its activity for CO oxidation. Mater. Lett. 2010, 64, 1638–1640. [Google Scholar] [CrossRef]
  31. Zhou, K.; Wang, X.; Sun, X.; Peng, Q.; Li, Y. Enhanced catalytic activity of ceria nanorods from well-defined reactive crystal planes. J. Catal. 2005, 229, 206–212. [Google Scholar] [CrossRef]
  32. Zhang, L.; Zhang, L.; Xu, G.; Zhang, C.; Li, X.; Sun, Z.; Jia, D. Low-temperature CO oxidation over CeO2 and CeO2@Co3O4 core-shell microspheres. New J. Chem. 2017, 41, 13418–13424. [Google Scholar] [CrossRef]
Figure 1. XRD patterns of CeO2 with different morphologies.
Catalysts 08 00535 g001
Figure 2. SEM and TEM images of CeO2 with different morphologies. (a1,b1,c1) are SEM images of CeO2-R, CeO2-T and CeO2-C; (a2,b2,c2) are TEM images of CeO2-R, CeO2-T and CeO2-C; (d1,d2) are SAED of CeO2-T.
Catalysts 08 00535 g002
Figure 3. N2 adsorption-desorption isotherms (a) and pore size distribution (b) of CeO2 with different morphologies.
Catalysts 08 00535 g003
Figure 4. Catalytic activity of CeO2 with different morphologies in CO oxidation.
Catalysts 08 00535 g004
Figure 5. H2-TPR curves of CeO2 with different morphologies.
Catalysts 08 00535 g005
Figure 6. HRTEM images of CeO2-R (a) and CeO2-T (b).
Catalysts 08 00535 g006
Table 1. Textural properties of CeO2 samples and their catalytic performance for CO oxidation.
EntryCatalystSBET (m2/g)Pore Volume (cm3/g)Pore Diameter (nm)Reaction Temperature (°C) 1
T10T50T90
1CeO2-R51.40.21814.2158216228
2CeO2-T55.60.15811.5203278366
3CeO2-C9.30.04329.8253325375
1 m(Cat) = 500 mg; GHSV = 12,000 mL·gcat−1·h−1; T10, T50 and T90 represent temperatures that CO conversions are 10%, 50% and 90%, respectively.
Table 2. H2-TPR results of CeO2 with different morphologies.
SamplePeak Temperature (°C)H2 Uptake (μmol/g)
Surface O-IISurface OBulk OSurface O-IISurface OBulk O
CeO2-T---477727---415697
CeO2-C303483762193208668
CeO2-R21741974743626665
Table 3. Comparison of different CeO2 catalysts for CO oxidation.
CatalystSBET (m2/g)TSOR1 (°C)Feed Gas (mL·gcat−1·h−1)T90 (°C)References
CeO2-R51.4217CO:O2:N2 = 1%/9%/90% (12,000)228This work
CeO2-R51.4217CO:O2:N2 = 1%/9%/90% (18,000)242This work
CeO2-R51.4217CO:O2:N2 = 1%/9%/90% (24,000)253This work
cauliflower like CeO274.5490CO:O2:He = 1%/20%/79% (60,000)370 2[24]
CeO2 nanowires130~527 3CO:O2:He = 1%/21%/78% (9000)300[22]
CeO2 nanorods128~520 3CO:O2:He = 1%/21%/78% (9000)310[22]
CeO2 nanoparticles364---CO:O2:N2 = 1%/1%/98% (4800)282[30]
CeO2 core-shell microspheres87.8487CO:O2:N2 = 1%/20%/79% (60,000)275[32]
1 Surface oxygen species reduction temperature. 2 The temperature for 98% CO conversion. 3 The temperature was obtained from the TPR curve directly because the authors did not give the exact data.

