Article

Water: Friend or Foe in Catalytic Hydrogenation? A Case Study Using Copper Catalysts

by
Alisa Govender
1,2,
Abdul S. Mahomed
1 and
Holger B. Friedrich
1,*
1
School of Chemistry and Physics, University of KwaZulu-Natal, Durban 4041, South Africa
2
Group Technology, Research & Technology, Sasol South Africa (Pty) Ltd., 1 Klasie Havenga Road, Sasolburg 1947, South Africa
*
Author to whom correspondence should be addressed.
Catalysts 2018, 8(10), 474; https://doi.org/10.3390/catal8100474
Submission received: 14 September 2018 / Revised: 2 October 2018 / Accepted: 4 October 2018 / Published: 19 October 2018
(This article belongs to the Special Issue Catalysts Deactivation, Poisoning and Regeneration)

Abstract

:
Copper oxide supported on alumina and copper chromite were synthesized, characterized, and subsequently tested for their catalytic activity toward the hydrogenation of octanal. Thereafter, the impact of water addition on the conversion and selectivity of the catalysts were investigated. The fresh catalysts were characterized using X-ray diffraction (XRD), BET surface area and pore volume, SEM, TEM, TGA-DSC, ICP, TPR, and TPD. An initial catalytic testing study was carried out using the catalysts to optimize the temperature and the hydrogen-to-aldehyde ratio—which were found to be 160 °C and 2, respectively—to obtain the best conversion and selectivity to octanol prior to water addition. Water impact studies were carried out under the same conditions. The copper chromite catalyst showed no deactivation or change in octanol selectivity when water was added to the feed. The alumina-supported catalyst showed no change in conversion, but the octanol selectivity improved marginally when water was added.

Graphical Abstract

1. Introduction

Catalytic hydrogenation reactions are often used in the chemical industry to convert productswith little commercial importance, obtained from other processes, to products with an increased demand and need in the chemical industry [1]. Such reactions find applications in the preparation of pharmaceuticals and fine chemicals [2]. Oxygenated compounds, such as aldehydes, are an example of the starting material utilized in catalytic hydrogenation in the fine chemicals sector to produce alcohols. Typically, Ni systems are utilized for aldehyde hydrogenation, however, they sometimes, due to their high activity, lead to abnormal levels of side products, such as esters, acetals, and other aldol condensation type products. Consequently, Cu has been used in certain instances for the hydrogenation of aldehydes or similar compounds to limit such side reaction products [3,4].
However, due to their lower activity, Cu catalysts need to operate at higher temperatures. In industry this may require higher steam pressures in heat exchangers, which are responsible for heating up the feed to the reactors [5]. It is possible for these heat exchangers to develop leaks, resulting in water ingress into the reactor via the feed, thus affecting the activity of the catalyst [6]. Sometimes, the effect can be detrimental, depending on how much water has ingressed into the reactor. Another source of water could recycle to the hydrogenation reactor when distillation processes upfield of the reactor experience process upsets, for example, reboiler tube leaks [7]. In any case, water is certainly a potential problem in any catalytic process, and its effect warrants some investigation [8,9,10].
In regards to copper catalysts, much of the deactivation studies have been focused on catalysts for CO hydrogenation for methanol synthesis, low-temperature water-gas shift, and selective hydrogenation catalysts, amongst others [11,12,13,14]. A fundamental question that arises is whether water can actually be identified as a poison or not. In fact, in some hydrogenation reactions, the addition of water enhances the activity [15]. Water as a poison is usually associated with the oxidation of the active metal, acceleration of sintering, and even leaching of the active metals [16].
Typically, copper chromite catalysts have been used for hydrogenation applications, however, Cr has been identified as being environmentally unfriendly [17]. Nonetheless, copper chromite catalysts are still being used in various catalytic processes globally [4]. Thus, various other relatively safer supports have been studied to replace chromium, e.g., alumina [18]. However, in so doing, its impact against poisons will also need consideration when compared to copper chromite.
Hence, for this study, as part of our interest in catalyst deactivation and regeneration in catalytic hydrogenation [19], octanal hydrogenation to octanol was used as a model reaction to investigate the influence of water during the hydrogenation process using copper catalysts supported on Al2O3 and as copper chromite, and to ascertain its effect on the octanal conversion and product selectivity.

2. Results and Discussion

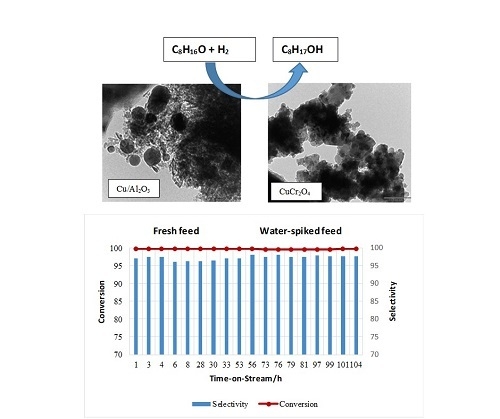
2.1. Catalyst Characterization

The copper loading for each catalyst is listed in Table 1 and was between 24 and 26 wt. %, reasonably close to the nominal loading of 25%. From the BET surface area measurements listed in Table 1, it can be observed that the surface area of CuO/Al2O3 is significantly higher than that of CuCr2O4. Both the variance in surface area and in crystallite size is ascribed to the manner in which the materials were synthesized, with CuO supported for the alumina material, compared to the particles of co-precipitated CuCr2O4.
The diffractograms for CuO/Al2O3, Al2O3, and CuCr2O4are shown in Figure S1a–c, respectively, in the Supplementary Information. Individual peaks corresponding to CuO are observed in Figure S1a, however, peaks corresponding to gamma alumina (γ-Al2O3) are not seen in the diffractogram [20]. This is most probably due to the overlap of these peaks with those of the CuO, since the JCPDS files for each compound list similar d-spacing values. Upon examining the diffractogram of γ-Al2O3 (Figure S1b), broad low-intensity peaks are seen. The position of these peaks coincides with the high-intensity CuO peaks, thus confirming the overlap of these peaks with those of CuO. Peaks corresponding to CuCr2O4 are observed in Figure S1c, confirming this phase as the dominant phase for this catalyst system [21]. CuO could not be detected, however, overlapping of the peaks with those of CuCr2O4 does not preclude its presence.
The TPR profiles for CuO/Al2O3, CuCr2O4, and unsupported CuO are presented in Figure 1a–c, respectively. The data obtained from these profiles (temperature at maximum and degree of reducibility) are given in Table 2. The reduction peak seen for CuO/Al2O3 (Figure 1a) at 231 °C and the first shoulder peak for CuCr2O4 (Figure 1b) seen at 240 °C correspond to the reduction of dispersed CuO. The reduction peaks at 298 °C and 308 °C, respectively, correspond to the reduction of bulk CuO that interacts with the support [22,23,24]. The CuCr2O4 catalyst shows another reduction peak between 400 and 500 °C, which can be ascribed to the bulk reduction of CuCr2O4. The TPR profile of unsupported CuO (as shown in Figure 1c) displays a reduction peak at 416 °C that corresponds to the reduction of bulk CuO. The broadness of the peak is an indication of the particle size range and the inherent difficulty associated with the reduction of unsupported CuO. From Table 2, it is observed that both catalysts show very similar values with respect to the degree of reducibility, suggesting that the active site density is very similar for both systems.
The NH3 TPD results of the catalysts indicating acid strength and acid site concentration are presented in Table 3. The acid strength of the catalysts is described by three regions, namely, weak, medium, and strong acid sites over the temperature ranges 200–310 °C, 310–500 °C, and 500–1000 °C, respectively. The data listed in Table 3 show that the alumina-supported CuO has both weak and strong acid sites, whilst CuCr2O4 shows the presence of weak, medium, and strong acid sites. Although the total acidity is higher for CuCr2O4, it is the acid site density of the different regions that is significant for the reactions occurring during the process.
The backscattered SEM images for each of the different catalytic systems are presented in Figure 2. For CuO supported on alumina, the backscattered SEM image shows brighter regions, which correspond to CuO particles, and darker/gray regions corresponding to alumina (Figure 2a). The CuO particles are seen to exist as clusters and appear to be present on the surface of the alumina particles. The SEM image for the copper chromite catalyst does not show any distinct morphology. Owing to the synthesis method to prepare this catalyst, it appears quite chunky and irregular. This corresponds well to the lower surface area obtained for this system. Due to the similarity in atomic number between Cu and Cr, the backscattered SEM image of the catalyst (Figure 2b) provides no unambiguous information.
The TEM images for the catalysts are given in Figure 3. The CuO particles appear spherical or somewhat lobed shaped for both systems, the difference being the particle sizes. Table 1 gives the average particle size obtained from TEM for each of the catalysts, with the alumina-supported catalyst having the smaller average size.
The chromia catalyst has a larger average particle size owing to the synthesis method, and this is also reflected in the surface area.

2.2. Catalytic Testing—Water Impact Studies

Water impact studies were carried out at 160 °C and with a hydrogen-to-aldehyde ratio of 2 (H2:octanal, 2:1). These conditions were established in a previous study as the optimum for octanal conversion and octanol selectivity [25]. Once steady-state conversion was reached using the fresh feed, the water-spiked feed was introduced to the system.

2.2.1. Effect of Water on the Hydrogenation of Octanal Using CuO/Al2O3

Figure 4 shows the conversion of octanal and the selectivity to octanol when the reaction was carried out using the fresh feed and the water-spiked feed. Prior to water addition, the conversion of octanal reached steady state after 1 h on stream at a value of 99% and remained steady at this value for 30 h. After this time, the water-spiked feed was introduced into the system and the reaction was allowed to proceed for a further 70 h. During this time, the conversion remained at the high level (99%), indicating that the presence of water in the feed did not have a negative impact on the catalyst. The selectivity to octanol reached a value of approximately 97% during the first 30 h of the reaction in the absence of water. However, once the water-spiked feed was introduced, the selectivity increased to approximately 98.5% and remained at this value for the duration of the reaction.
With the slight increase in the selectivity to octanol, there was a corresponding decrease in the acid/base catalyzed reaction products, such as C16 diol and C24-acetal [26,27,28]. It is clear from the results that the presence of water did not oxidize the available Cu during the reaction, considering that the conversion remained unchanged. Wang et al. reported in their study on the hydrogenation of hexanal and propanal using sulfided Ni–Mo/Al2O3 as catalysts that water proved beneficial in improving the selectivity to the alcohols, however, they noticed a decrease in conversion [26]. It is surprising, however, that the selectivity to octanol does not decrease owing to the possibility of forming more Brønsted sites with the addition of water. This is reasoned by water interacting with the Brønsted site via hydrogen bonding. The interaction occurs either via one molecule of water or clusters that may have formed, depending on the proximity of the acid sites and the concentration of water on the surface. Similar behavior has been reported for zeolite materials [29]. The result of this behavior caused a slight reduction in the total acidity of the catalyst and thus allowed an increase in the octanol selectivity. A more comprehensive list of other byproducts are shown in the Supplementary Information, Figure S2, for one of the data points.

2.2.2. Effect of Water on the Hydrogenation of Octanal Using CuCr2O4

The conversion of octanal and the selectivity to octanol during the hydrogenation of octanal using the fresh feed and the water-spiked feed are shown in Figure 5. The octanal conversion reached 99% over the CuCr2O4 catalyst and remained steady at this value for 26 h. Upon introduction of the water-spiked feed, the conversion remained at 99%. The selectivity to octanol reached approximately 96.3% during the first 31 h of the reaction when using the fresh feed, and after introducing the water-spiked feed, an insignificant increase in selectivity was observed.
The major byproduct formed during the reaction with the fresh feed and the water-spiked feed was the C16 diol. The selectivity to the C16 diol when using the fresh feed was about 2%, which remained unchanged when water was introduced. Similarly, all other byproducts showed only minor changes in selectivity after introducing the water-spiked feed into the system. The full selectivity list of byproducts for an arbitrary data point is shown in the Supplementary Information, Figure S3.
For the alumina catalyst, it was observed that the presence of water in the feed stream improved the selectivity to octanol by suppressing the formation of byproducts. However, a key factor favoring this trend is the presence of surface hydroxyls on the catalyst support. A minor increase in the selectivity to octanol was obtained when using CuCr2O4 as the catalyst, indicating that the effect of water on the hydrogenation of octanal was not as pronounced as when CuO/Al2O3 was used as the catalyst.

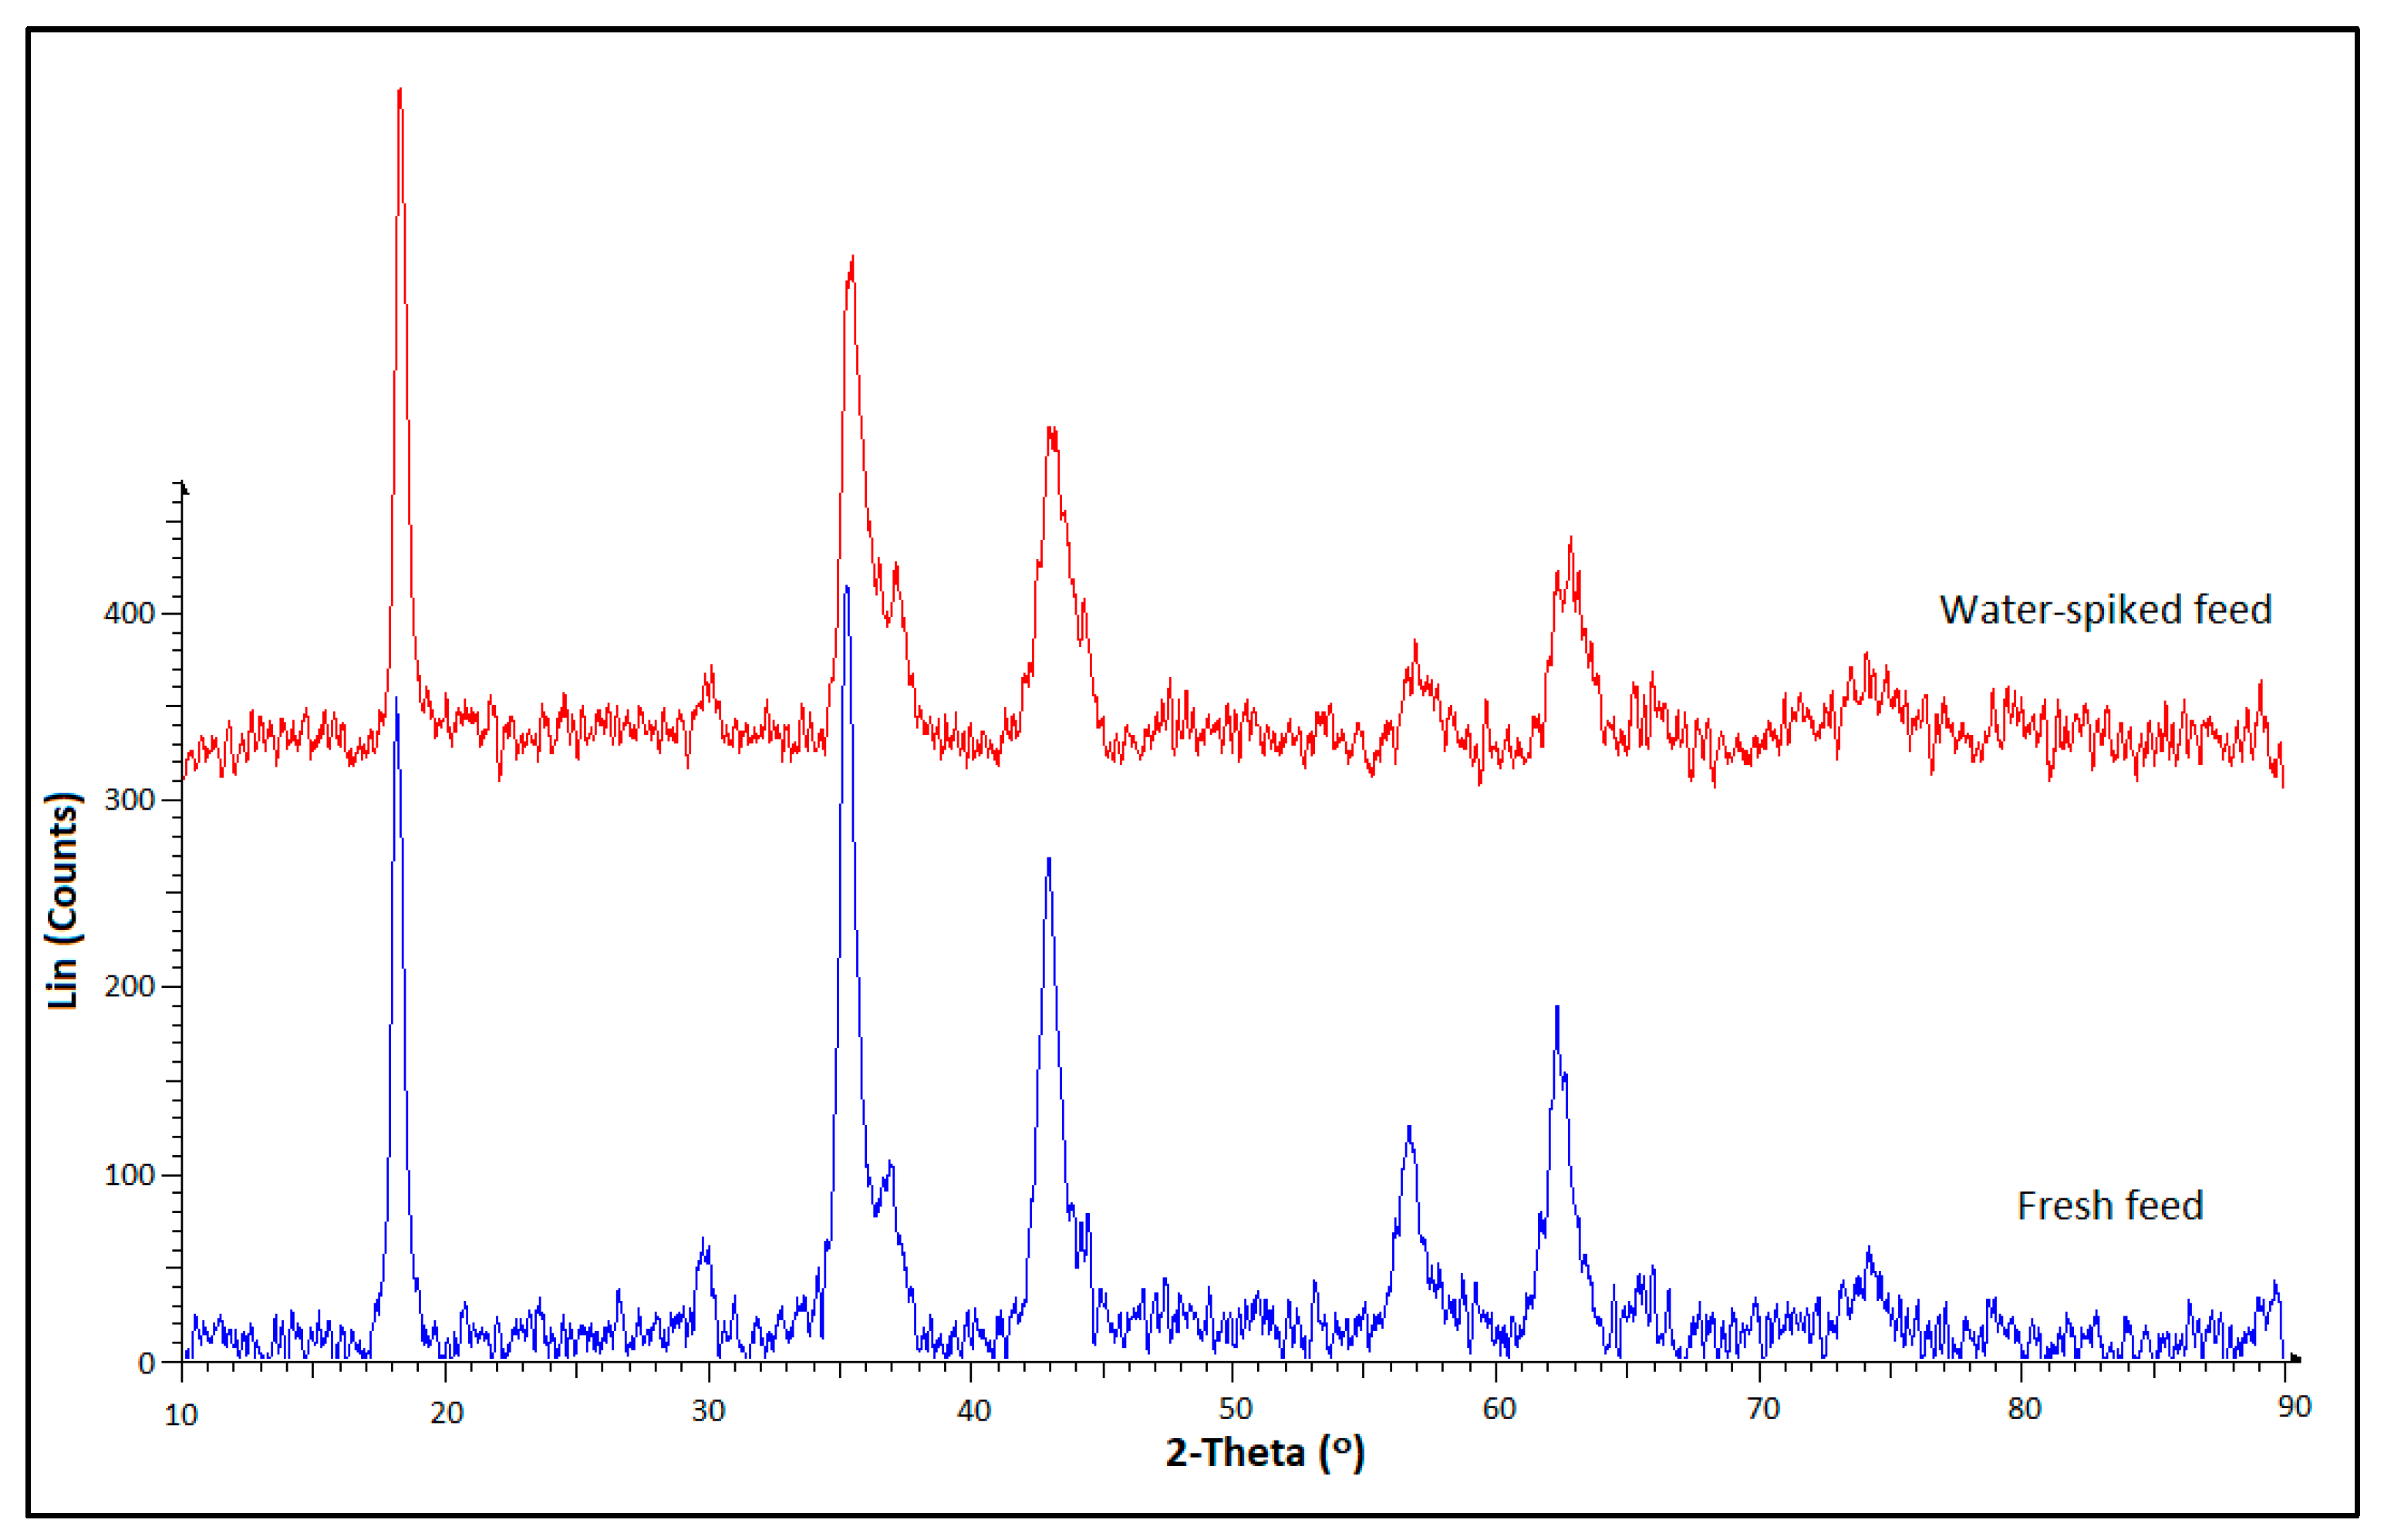
2.3. Used Catalyst Characterization

The diffractograms for Cu/Al2O3 and CuCr2O4after the reaction with the fresh feed and the water-spiked feed are shown in Figure 6 and Figure 7, respectively. These diffractograms show the presence of characteristic copper (Cu0) peaks (JCPDS 4-0836) and some CuO peaks. In addition, the diffractogram for the CuCr2O4 catalyst (Figure 7) reveals peaks attributed to the phases CuCr2O4, Cr2O3, and Cu2O.The full width at half-maximum (FWHM) and the X-ray diffraction (XRD) crystallite size are listed in Table 4. The FWHM for Cu/Al2O3 used for the reaction with the water-spiked feed was negligibly different to the value obtained for the catalyst used for the reaction with the fresh feed, however, a significant change was observed for the CuCr2O4, with an increase of 0.5° for the FWHM of the catalyst used for the reaction with the water-spiked feed.
This indicates that the catalyst suffered a loss of crystallinity during the reaction with the water-spiked feed. The average particle size for both catalysts after the reaction with the water-spiked feed was slightly smaller in comparison to the catalyst used for the reaction with the fresh feed. This smaller particle size translated to a higher BET surface area, shown in Table 4, compared to the catalysts prior to testing. It was noted that the average particle size of the catalyst used with the water-free feed was slightly larger compared to that of the fresh catalyst, yet the BET surface area was higher. This could be attributed to some sintering of the copper allowing the higher-exposed alumina support and, to some extent, the chromite phase, to cause the increase.
The SEM images for Cu/Al2O3 and CuCr2O4 after the reaction with the fresh feed and the water-spiked feed are shown in Figure 8 and Figure 9, respectively. These images show minor differences in the morphology of the used catalyst between Cu/Al2O3 and CuCr2O4 used for the reaction with the fresh feed and the water-spiked feed. This shows that the catalysts were robust to the water, showing no signs of breakage. The EDS composition scanning map data for Cu/Al2O3 and CuCr2O4 after the reaction with the fresh feed and the water-spiked feed are shown in Figures S4–S7 in the Supplementary Information, respectively. These maps show that the distribution of the Cu-rich particles is relatively similar for the catalysts after exposure to both the feeds. However, a change in the morphology of the Cu/Al2O3 catalyst could possibly have occurred, thus also influencing the selectivity in that way.

3. Materials and Methods

The method of co-precipitation was used to synthesize CuCr2O4 and the wet impregnation method was used to prepare CuO/Al2O3.The syntheses of the catalysts were carried out using modifications of the method of Gredig et al. [30] and Bando et al. [31].
The CuCr2O4 catalyst was synthesized from metal nitrate solutions with sodium hydroxide (NaOH) at a constant temperature of 298 K and at a pH of approximately 7. The metal nitrate solutions were added dropwise to a round-bottomed flask containing distilled water under vigorous stirring. At the same time, 2 M NaOH was added dropwise to regulate the pH and assist in precipitation. The slurry was aged for half an hour at room temperature and constant pH (7).The resulting precipitate was filtered, washed with distilled water, and dried overnight at 120 °C. The dried catalyst was crushed and thereafter calcined in air for 8 h at 550 °C. For the alumina-supported catalyst, a copper nitrate solution was prepared by dissolving the required amount of copper nitrate in sufficient water to allow dissolution of the metal salt. The solution was then added to the catalyst support under stirring. The slurry obtained was stirred for 24 h. There after, the water was slowly evaporated by gentle heating with vigorous stirring. The resulting solid obtained was oven-dried overnight at 120 °C and thereafter calcined in air for 8 h at 600 °C (alumina catalyst).The catalysts were pelletized and sieved to a particle size of 300–600 microns.
X-ray diffraction (XRD) diffractograms were obtained using a Bruker D8 ADVANCE X-ray diffractometer (Bruker, Karlsruhe, Germany) employing Cu Kα radiation (λ = 1.5418 Å). Prior to the SEM and EDS analyses, the samples were mounted on an aluminium stub using double-sided carbon tape and subsequently gold sputter-coated using a Polaron E5100 coating unit and carbon-coated using a Jeol JEE-4C vacuum evaporator (Joel, Peabody, MA, USA)for the SEM and EDS analyses, respectively. The secondary (normal) and backscattered SEM images were viewed on a Leo 1450 scanning electron microscope (Carl Zeiss AG, Oberkochen, Germany). The EDS composition scanning and certain secondary images were done on a Jeol JSM-6100 scanning microscope (Joel, Peabody, MA, USA) fitted with a Bruker EDX detector. The TEM images were viewed on a Jeol JEM-1010 electron microscope (Joel, Peabody, MA, USA). The elemental composition of the catalysts was determined by ICP-OES on a Perkin Elmer Precisely Optical Emission Spectrometer Optima 5300 DV (PerkinElmer, Shelton, CT, USA). Prior to analysis, the catalyst samples were digested with concentrated nitric acid. The specific surface area and pore volumes of the catalyst were obtained by using the BET nitrogen physisorption analysis using a Micrometrics Gemini instrument (Micrometrics, Atlanta, GA, USA) with nitrogen adsorbate at −196 °C. TPR and TPD were carried out on a Micrometrics Autochem II Chemisorption Analyzer (Micrometrics, Atlanta, GA, USA).Prior to both analyses, the samples were pre-treated with argon flowing at a rate of 30 mL/min, upto 350 °C, at a rate of 20 °C/min. For the H2-TPR, the pre-treated sample was then subjected to 5% H2 in argon flowing at a rate of 30 mL/min, whilst the temperature was linearly increased from 90 °C to 600 °C at a rate of 10 °C/min. The hydrogen consumption was monitored by a thermal conductivity detector. For the NH3-TPD, the pre-treated sample was reduced with 5% H2 in argon and thereafter treated with helium for 1 h to remove excess hydrogen. A 4% NH3 in helium gas mixture was then passed through the system and allowed to adsorb onto the surface of the catalyst for half an hour. Helium gas was then passed through at a flow rate of 30 mL/min, whilst the temperature was linearly increased from 100 °C to 1000 °C at a rate of 10 °C/min. The amount of ammonia desorbed was monitored using a thermal conductivity detector.
The hydrogenation reaction was carried out using a fixed bed reactor. A stainless-steel (grade 316) tube with an inner diameter of 15 mm and a length of 325 mm was used as the reactor tube. The amount of gas entering the reactor was controlled by means of Brooks’s mass flow meters (0–300 mL/min) (Brooks Instruments, Hatfield, PA, USA), which were calibrated before use. The liquid feed was introduced to the reactor by means of a LabAlliance Series II isocratic HPLC pump (ASI, Richmond, CA, USA). Due to the high exotherm associated with the hydrogenation of octanal, a 10 wt. % octanal in octanol (diluent) feed was used as the fresh feed, whilst for the water impact studies, a water-spiked feed with1.8 wt. % water in the fresh feed was used, which is below the saturation point at 25 °C [32].The product leaving the reactor tube was collected in a 500 mL sampling cylinder. The back-pressure regulator maintained the pressure within the system to the desired value. The gas leaving the back-pressure regulator entered a Ritter drum-type wet gas flow meter (TG1—model 5 with a PVC drum and casing) which allowed for the quantification of off-gas flowing during the run time of the experiment.
The catalyst was nitrogen-treated in situ at 170 °C at a flow to give a GHSV of 1000 h−1. After this time, the reactor was cooled to 130 °C and hydrogen was introduced into the system in increments of 5 vol. %. Once the system stabilized, the nitrogen flow was decreased accordingly, until the hydrogen concentration was 100%, whilst maintaining a constant GHSV. The temperature was then increased to 200 °C and the catalyst was allowed to reduce overnight with pure hydrogen. Once this reduction process was complete, the reactor system was pressurized to 60 bar, the temperature was reduced to 160 °C, and the feed was introduced. The hydrogen flow rate was set to the desired value (GHSV = 464 h−1) and the liquid feed was passed through the reactor (LHSV = 16 h−1) to maintain a H2:octanal ratio of 2:1. The liquid product formed was collected in the sampling cylinder and was sampled in approximately 1.5 h intervals. The product was analyzed by GC Perkin Elmer Clarus 500 with an FID detector (Perkin Elmer, Akron, OH, USA). A Petro-Elite column (length = 50 m and diameter = 200 μm) was used for the analyses. The typical reaction time was 5 days, which included the baseline testing as well as the effect of the water-spiked feed.
The used catalysts were dried under a flow of ultrapure nitrogen (99.999%, Afrox, Durban, South Africa) and removed from the reactor under a nitrogen blanket. The catalysts were analyzed immediately to avoid or minimize the oxidation of the copper.

4. Conclusions

Copper oxide supported on alumina and chromia were synthesized and characterized. XRD showed characteristic peaks for CuO for the alumina-supported catalysts and established the chromite phase for the CuCr2O4 catalyst. This was also confirmed by microscopy analyses of the two systems. The catalysts contained between 24 and 26 wt. % copper, and the BET surface area was higher for the alumina-supported catalyst, however, both catalysts showed a high degree of reduction under H2. The exposure of the catalysts to a water-spiked feed with approximately 1.8 wt. % water showed very little variance in the conversion of the catalyst when compared to the feed without water. For the reaction over CuO/Al2O3, the conversion remained unchanged (at 99%) after the introduction of the water-spiked feed, however, an increase in the selectivity to octanol (1.5%) was observed and was attributed to the interaction of the water molecules with the surface hydroxyls on alumina. For the reaction over CuCr2O4, the conversion of octanal, as well as the octanol selectivity, remained essentially unchanged after the introduction of the water-spiked feed. From characterization of the used catalysts by SEM and XRD, it was determined that the presence of water did not negatively impact the physical structure of the catalyst. The particle size was observed to have decreased for the water-spiked feed and increased marginally for the feed without water when compared to the fresh catalyst. These results indicate that Cu/Al2O3 maybe a robust, viable alternative to the copper chromite catalyst for these hydrogenation reactions.

Supplementary Materials

The following are available online at https://www.mdpi.com/2073-4344/8/10/474/s1, Figure S1: Diffractograms of (a) CuO/Al2O3; (b) the Al2O3 support and (c) CuCr2O4, Figure S2: Selectivity to the various by-products formed during the hydrogenation of octanal using the fresh feed and the water-spiked feed over CuO/Al2O3, Figure S3: Selectivity to the various by-products formed during the hydrogenation of octanal using the fresh feed and the water-spiked feed over CuCr2O4, Figure S4: (a–c) EDS composition map data for Cu/Al2O3 used for the reaction with fresh feed, Figure S5: (a–c) EDS composition map data for Cu/Al2O3 used for the reaction with water-spiked feed, Figure S6: (a–c) EDS composition map data for CuCr2O4 used for the reaction with fresh feed, Figure S7: (a–c) EDS composition map data for CuCr2O4 used for the reaction with water-spiked feed.

Author Contributions

H.B.F. and A.S.M. led the project and coordinated the study. A.G. conceived and executed the experiments, including catalyst characterization and catalytic testing. A.G. and A.S.M. prepared the manuscript, and editing was done by A.S.M. and H.B.F. The manuscript submission was coordinated by H.B.F. All authors read and approved the final manuscript.

Funding

This research was funded by SASOL R&D and THRIP.

Acknowledgments

We thank James Wesley-Smith, Sharon Eggers, and Priscilla Martins (EM Unit at UKZN) for the TEM and SEM analyses. We also thank Francois Human and Enrico Caricato of SASOL R&D for assistance with the reactor setup.

Conflicts of Interest

The authors declare no conflict of interest.

References

  1. Rioux, R.M.; Vannice, M.A. Hydrogenation/dehydrogenation reactions: Isopropanol dehydrogenation over copper catalysts. J. Catal. 2003, 216, 362–376. [Google Scholar] [CrossRef]
  2. Satterfield, C.N. Heterogeneous Catalysis in Industrial Practice; McGraw Hill: New York, NY, USA, 1991. [Google Scholar]
  3. Lok, M. Structure and Performance of Selective Hydrogenation Catalysts. Available online: https://www.topsoe.com/sites/default/files/martin_lok_structure_and_performance_of_selective_hydrogenation_catalysts.pdf (accessed on 5 October 2018).
  4. Prasad, R.; Singh, P. Applications and Preparation Methods of Copper Chromite Catalysts: A Review. Bull. Chem. React. Eng. Catal. 2011, 6, 63–113. [Google Scholar] [CrossRef]
  5. Zhang, D.; Liu, G. Heat Exchanger Network Integration of a Hydrogenation Process of Benzene to Cyclohexene Considering the Reactor Conversion. Chem. Eng. Trans. 2017, 61, 283–288. [Google Scholar]
  6. Woods, D.R. Successful Trouble Shooting for Process Engineers: A Complete Course in Case Studies; Wiley: Darmstadt, Germany, 2006. [Google Scholar]
  7. Kister, H.Z. What Caused Tower Malfunctions in the Last 50 Years? Chem. Eng. Res. Des. 2003, 81, 5–26. [Google Scholar] [CrossRef]
  8. Chang, J.-R.; Lin, T.-B.; Cheng, C.-H. Pd/Δ-Al2O3 Catalysts for Isoprene Selective Hydrogenation: Regeneration of Water-Poisoned Catalysts. Ind. Eng. Chem. Res. 1997, 36, 5096–5102. [Google Scholar] [CrossRef]
  9. Wang, W.-J.; Qiao, M.-H.; Li, H.-X.; Dai, W.-L.; Deng, J.-F. Study on the deactivation of amorphous NiB/SiO2 catalyst during the selective hydrogenation of cyclopentadiene to cyclopentene. Appl. Catal. A: Gen. 1998, 168, 151–157. [Google Scholar] [CrossRef]
  10. Ma, Z.; Jia, R.; Liu, C.; Mi, Z. Production of hydrogen peroxide from carbon monoxide, water, and oxygen over alumina supported amorphous ni catalysts. Chem. Lett. 2002, 31, 884–885. [Google Scholar] [CrossRef]
  11. Twigg, M.V.; Spencer, M.S. Deactivation of supported copper metal catalysts for hydrogenation reactions. Appl. Catal. A Gen. 2001, 212, 161–174. [Google Scholar] [CrossRef]
  12. Argyle, M.; Bartholomew, C. Heterogeneous Catalyst Deactivation and Regeneration: A Review. Catalysts 2015, 5, 145–269. [Google Scholar] [CrossRef] [Green Version]
  13. Rao, R.S.; Walters, A.B.; Vannice, M.A. Influence of crystallite size on acetone hydrogenation over copper catalysts. J. Phys. Chem. B 2005, 109, 2086–2092. [Google Scholar] [CrossRef] [PubMed]
  14. Vasiliadou, E.S.; Lemonidou, A.A. Investigating the performance and deactivation behaviour of silica-supported copper catalysts in glycerol hydrogenolysis. Appl. Catal. A Gen. 2011, 396, 177–185. [Google Scholar] [CrossRef]
  15. Masson, J.; Cividino, P.; Court, J. Selective hydrogenation of acetophenone on chromium promoted raney nickel catalysts. III. The influence of the nature of the solvent. Appl. Catal. A Gen. 1997, 161, 191–197. [Google Scholar] [CrossRef]
  16. Bartholomew, C.H. Mechanisms of catalyst deactivation. Appl. Catal. A Gen. 2001, 212, 17–60. [Google Scholar] [CrossRef]
  17. Rao, R.; Dandekar, A.; Baker, R.T.K.; Vannice, M.A. Properties of Copper Chromite Catalysts in Hydrogenation Reactions. J. Catal. 1997, 171, 406–419. [Google Scholar] [CrossRef]
  18. Rajkhowa, T.; Marin, G.B.; Thybaut, J.W. A comprehensive kinetic model for Cu catalyzed liquid phase glycerol hydrogenolysis. Appl. Catal. B Environ. 2017, 205, 469–480. [Google Scholar] [CrossRef]
  19. Mahlaba, S.V.L.; Valand, J.; Mahomed, A.S.; Friedrich, H.B. A study on the deactivation and reactivation of a Ni/Al2O3 aldehyde hydrogenation catalyst: Effects of regeneration on the activity and properties of the catalyst. Appl. Catal. B Environ. 2018, 224, 295–304. [Google Scholar] [CrossRef]
  20. Suresh, S.; Karthikeyan, S.; Jayamoorthy, K. FTIR and multivariate analysis to study the effect of bulk and nano copper oxide on peanut plant leaves. J. Sci. Adv. Mater. Devices 2016, 1, 343–350. [Google Scholar] [CrossRef]
  21. Ma, Z.; Xiao, Z.; van Bokhoven, J.A.; Liang, C. A non-alkoxide sol-gel route to highly active and selective Cu-Cr catalysts for glycerol conversion. J. Mater. Chem. 2010, 20, 755–760. [Google Scholar] [CrossRef]
  22. Chen, L.; Horiuchi, T.; Osaki, T.; Mori, T. Catalytic selective reduction of no with propylene over Cu-Al2O3 catalysts: Influence of catalyst preparation method. Appl. Catal. B: Environ. 1999, 23, 259–269. [Google Scholar] [CrossRef]
  23. Luo, M.-F.; Fang, P.; He, M.; Xie, Y.-L. In situ XRD, Raman, and TPR studies of CuO/Al2O3 catalysts for CO oxidation. J. Mol. Catal. A Chem. 2005, 239, 243–248. [Google Scholar] [CrossRef]
  24. Zhou, R.; Yu, T.; Jiang, X.; Chen, F.; Zheng, X. Temperature-programmed reduction and temperature-programmed desorption studies of CuO/ZrO2 catalysts. Appl. Surf. Sci. 1999, 148, 263–270. [Google Scholar] [CrossRef]
  25. Chetty, T.; Dasireddy, V.D.B.C.; Callanan, L.H.; Friedrich, H.B. Continuous Flow Preferential Hydrogenation of an Octanal/Octene Mixture Using Cu/Al2O3 Catalysts. ACS Omega 2018, 3, 7911–7924. [Google Scholar] [CrossRef]
  26. Wang, X.; Saleh, R.Y.; Ozkan, U.S. Reaction network of aldehyde hydrogenation over sulfided Ni–Mo/Al2O3 catalysts. J. Catal. 2005, 231, 20–32. [Google Scholar] [CrossRef]
  27. Chang, Y.-C.; Ko, A.-N. Vapor phase reactions of acetaldehyde over type X zeolites. Appl. Catal. A Gen. 2000, 190, 149–155. [Google Scholar] [CrossRef]
  28. Luo, S.; Falconer, J.L. Acetone and Acetaldehyde Oligomerization on TiO2 Surfaces. J. Catal. 1999, 185, 393–407. [Google Scholar] [CrossRef]
  29. Nascimento, M.A. Theoretical Aspects of Heterogeneous Catalysis; Kluwer: Dordrecht, The Netherlands, 2001. [Google Scholar]
  30. Gredig, S.V.; Maurer, R.; Koeppel, R.; Baiker, A. Copper-catalyzed synthesis of methylamines from CO2. H2 and NH3. Influence of support. J. Mol. Catal. A Chem. 1997, 127, 133–142. [Google Scholar] [CrossRef]
  31. Bando, K.K.; Sayama, K.; Kusama, H.; Okabe, K.; Arakawa, H. In-situ FT-IR study on CO2 hydrogenation over Cu catalysts supported on SiO2, Al2O3, and TiO2. Appl. Catal. A Gen. 1997, 165, 391–409. [Google Scholar] [CrossRef]
  32. Lang, B.E. Solubility of Water in Octan-1-ol from (275 to 369) K. J. Chem. Eng. Data 2012, 57, 2221–2226. [Google Scholar] [CrossRef]
Figure 1. TPR profile of (a) CuO/Al2O3; (b) CuCr2O4; and (c) unsupported CuO.
Catalysts 08 00474 g001
Figure 2. (a) Backscattered SEM images of CuO/Al2O3; (b) backscattered SEM image of CuCr2O4.
Catalysts 08 00474 g002
Figure 3. (a) TEM images of CuO/Al2O3; (b) TEM image for CuCr2O4.
Catalysts 08 00474 g003
Figure 4. Conversion of octanal and the selectivity to octanol for the hydrogenation of octanal using the fresh feed and the water-spiked feed over CuO/Al2O3. (60 bars, 160 °C, H2:octanal ratio of 2:1).
Catalysts 08 00474 g004
Figure 5. Conversion of octanal and selectivity to octanol for the hydrogenation of octanal using fresh feed and water-spiked feed over CuCr2O4. (60 bars, 160 °C, H2:octanal ratio of 2:1).
Catalysts 08 00474 g005
Figure 6. Diffractogram of the used Cu/Al2O3 after the reaction with fresh feed only and water-spiked feed.
Catalysts 08 00474 g006
Figure 7. Diffractogram of the used CuCr2O4 after the reaction with fresh feed only and water-spiked feed.
Catalysts 08 00474 g007
Figure 8. SEM image of Cu/Al2O3 after (a) the reaction with fresh feed and (b) reaction with the water-spiked feed.
Catalysts 08 00474 g008
Figure 9. SEM image of CuCr2O4 after (a) the reaction with fresh feed and (b) reaction with the water-spiked feed.
Catalysts 08 00474 g009
Table 1. Physical characterization data.
CatalystCu Loading/wt. %BET Surface Area/m2 g−1Total Pore Volume/cm3 g−1Average TEM Particle Size/nm
CuO/Al2O323.5128.80.4285 (0.6530) a16
CuCr2O426.325.30.369730
a Pore volume of alumina in parenthesis.
Table 2. List of temperature at maximum (Tm) and degree of reduction of Cu, as determined by H2-TPR.
CatalystTemperature at Maximum (Tm)/°CDegree of Reduction a/%
Unsupported CuO (Bulk)416-
CuO/Al2O3231, 29884.4
CuCr2O4308, 468, shoulder peaks at 240 and 54185.8
a Determined using the equation: moles H2 consumed/moles reducible Cu*100.
Table 3. The acid strength and acidity of each catalyst.
Acid Strength Temperature (°C)Acid Sites Concentration (μmol g−1 of Cat)
CatalystTm at ATm at BTm at CAcidity at AAcidity at BAcidity at CTotal Acidity
CuO/Al2O3244-6361288-5041791
CuCr2O42614649878471014781938
A = Weak Acid Site (200–310 °C); B = Medium Acid Site (310–500 °C); and C = Strong Acid Site (500–1000 °C).
Table 4. Full width at half-maximum (FWHM) values and the crystallite size of the highest-intensity Cu peak for each catalyst and BET surface area after the reaction using fresh feed and water-spiked feed.
CatalystFWHM/°Average Particle Size/nmBET Surface Area/m2 g−1
Cu/Al2O3 fresh feed0.26423141.7
Cu/Al2O3 water-spiked feed0.25815143.9
CuCr2O4 fresh feed0.7993333.5
CuCr2O4 water-spiked feed1.3352436

