
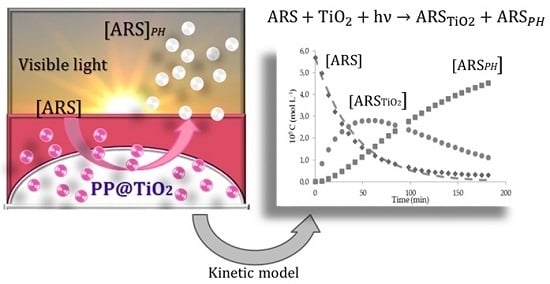
Kinetic Model for Simultaneous Adsorption/Photodegradation Process of Alizarin Red S in Water Solution by Nano-TiO2 under Visible Light


Abstract
:
1. Introduction
2. Results
3. Materials and Methods
3.1. Reagents and Materials
3.2. Methods
3.2.1. Photocatalysts Preparation
3.2.2. Operative Procedure for Kinetic Study
4. Conclusions
Author Contributions
Conflicts of Interest
References
- Agrawal, A.; Pandey, R.S.; Sharma, B. Water Pollution with Special Reference to Pesticide Contamination in India. J. Water Resource Prot. 2010, 2, 432–448. [Google Scholar] [CrossRef]
- Hill, M.K. Understanding Environmental Pollution, 3rd ed.; Cambridge University Press: New York, NY, USA, 2010. [Google Scholar]
- Zaharia, C.; Suteu, D. Textile Organic Dyes—Characteristics, Polluting Effects and Separation/Elimination Procedures from Industrial Effluents—A Critical Overview. In Organic Pollutants Ten Years after the Stockholm Convention—Environmental and Analytical Update, 1st ed.; Puzyn, T., Ed.; InTech Europe: Rijeka, Croatia, 2012; pp. 55–86. [Google Scholar]
- Teh, C.M.; Mohamed, A.R. Roles of titanium dioxide and ion-doped titanium dioxide on photocatalytic degradation of organic pollutants (phenolic compounds and dyes) in aqueous solutions: A review. J. Alloys Compd. 2011, 509, 1648–1660. [Google Scholar] [CrossRef]
- Angelini, L.G.; Pistelli, L.; Belloni, P.; Bertoli, A.; Panconesi, S. Rubia tinctorum a source of natural dyes: Agronomic evaluation, quantitative analysis of alizarin and industrial assays. Ind. Crop. Prod. 1997, 6, 303–311. [Google Scholar] [CrossRef]
- Dickson, J.A.D. Carbonate Identification and Genesis as Revealed by Staining. J. Sediment. Petrol. 1966, 36, 491–505. [Google Scholar]
- Hatch, K.L.; Maibach, H.I. Textile dye dermatitis. J. Am. Acad. Dermatol. 1995, 32, 631–639. [Google Scholar] [CrossRef]
- Gautam, R.K.; Mudhoo, A.; Chattopadhyaya, M.C. Kinetic, equilibrium, thermodynamic studies and spectroscopic analysis of Alizarin Red S removal by mustard husk. J. Env. Chem. Eng. 2013, 1, 1283–1291. [Google Scholar] [CrossRef]
- Palmisano, G.; Augugliaro, V.; Pagliaro, M.; Palmisano, L. Photocatalysis: A promising route for 21st century organic chemistry. Chem. Commun. 2007, 33, 3425–3437. [Google Scholar] [CrossRef] [PubMed]
- Chong, M.N.; Jin, B.; Chow, C.W.K.; Saint, C. Recent developments in photocatalytic water treatment technology: A review. Water Res. 2010, 44, 2997–3027. [Google Scholar] [CrossRef] [PubMed]
- Kabra, K.; Chaudhary, R.; Sawhney, R. Treatment of Hazardous Organic and Inorganic Compounds through Aqueous-Phase Photocatalysis: A Review. Ind. Eng. Chem. Res. 2004, 43, 7683–7696. [Google Scholar] [CrossRef]
- Kumar, S.G.; Devi, L.G. Review on modified TiO2 photocatalysis under UV/visible light: Selected results and related mechanisms on interfacial charge carrier transfer dynamics. J. Phys. Chem. A 2011, 115, 13211–13241. [Google Scholar] [CrossRef] [PubMed]
- Hamdy, M.S.; Amrollahi, R.; Sinev, I.; Mei, B.; Mul, G. Strategies to design efficient silica-supported photocatalysts for reduction of CO2. J. Am. Chem. Soc. 2014, 136, 594–597. [Google Scholar] [CrossRef] [PubMed]
- Tseng, I.H.; Chang, W.C.; Wu, J.C.S. Photoreduction of CO2 using sol-gel derived titania and titania-supported copper catalysts. Appl. Catal. B 2002, 37, 37–48. [Google Scholar] [CrossRef]
- Ni, M.; Leung, M.K.L.; Leung, D.Y.C.; Sumathy, K. A review and recent developments in photocatalytic water-splitting using TiO2 for hydrogen production. Renew. Sust. Energy Rev. 2007, 11, 401–425. [Google Scholar] [CrossRef]
- Mo, J.; Zhang, Y.; Xu, Q.; Lamson, J.J.; Zhao, R. Photocatalytic purification of volatile organic compounds in indoor air: A literature review. Atmos. Environ. 2009, 43, 2229–2246. [Google Scholar] [CrossRef]
- Gaya, U.I.; Abdullah, A.H. Heterogeneous photocatalytic degradation of organic contaminants over titanium dioxide: A review of fundamentals, progress and problems. J. Photochem. Photobiol. C 2008, 9, 1–12. [Google Scholar] [CrossRef] [Green Version]
- Gogate, P.R.; Pandit, A.B. A review of imperative technologies for wastewater treatment I: Oxidation technologies at ambient conditions. Adv. Env. Res. 2004, 8, 501–551. [Google Scholar] [CrossRef]
- Fujishima, A.; Rao, T.N.; Tryk, D.A. Titanium dioxide photocatalysis. J. Photochem. Photobiol. C 2000, 1, 1–21. [Google Scholar] [CrossRef]
- Nakata, K.; Fujishima, A. TiO2 photocatalysis: Design and applications. J. Photochem. Photobiol. C 2012, 13, 169–189. [Google Scholar] [CrossRef]
- Konstantinou, I.K.; Albanis, T.A. TiO2-assisted photocatalytic degradation of azo dyes in aqueous solution: Kinetic and mechanistic investigations. A review. Appl. Catal. B. 2004, 49, 1–14. [Google Scholar] [CrossRef]
- Giovannetti, R.; D’ Amato, C.A.; Zannotti, M.; Rommozzi, E.; Gunnella, R.; Minicucci, M.; Di Cicco, A. Visible light photoactivity of Polypropylene coated Nano-TiO2 for dyes degradation in water. Sci. Rep. 2015, 5, 17801. [Google Scholar] [CrossRef] [PubMed]
- Chen, C.Y.; Hsu, L.J. Kinetic study of self-assembly of Ni(II)-doped TiO2 nanocatalysts for the photodegradation of azo pollutants. RSC Adv. 2015, 5, 88266–88271. [Google Scholar] [CrossRef]
- Kumar, K.V.; Porkodi, K.; Selvaganapathi, A. Constrain in solving Langmuir-Hinshelwood kinetic expression for the photocatalytic degradation of Auramine O aqueous solutions by ZnO catalyst. Dyes Pigm. 2007, 7, 246–249. [Google Scholar]
- Kesselman, J.M.; Lewis, N.S.; Hoffmann, M.R. Photoelectrochemical Degradation of 4-Chlorocatechol at TiO2 Electrodes: Comparison between Sorption and Photoreactivity. Environ. Sci. Technol. 1997, 31, 2298–2302. [Google Scholar] [CrossRef]
- Chen, C.Y.; Liu, Y.R. Robust and Enhanced Photocatalytic Performance of Coupled CdSe/TiO2 Photocatalysts. Sci. Adv. Mater. 2015, 7, 1053–1057. [Google Scholar] [CrossRef]
- Atkins, P.; De Paula, J. Physical Chemistry, 8th ed.; W.H. Freeman and Company: New York, NY, USA, 2006. [Google Scholar]


| [ARS]0 (mol·L−1) | [PP@TiO2]A | [ARS]0 (mol·L−1) | [PP@TiO2]P-25 | ||
|---|---|---|---|---|---|
| k × 102 (min−1) | k × 102 (min−1) | ||||
| k1 | k2 | k1 | k2 | ||
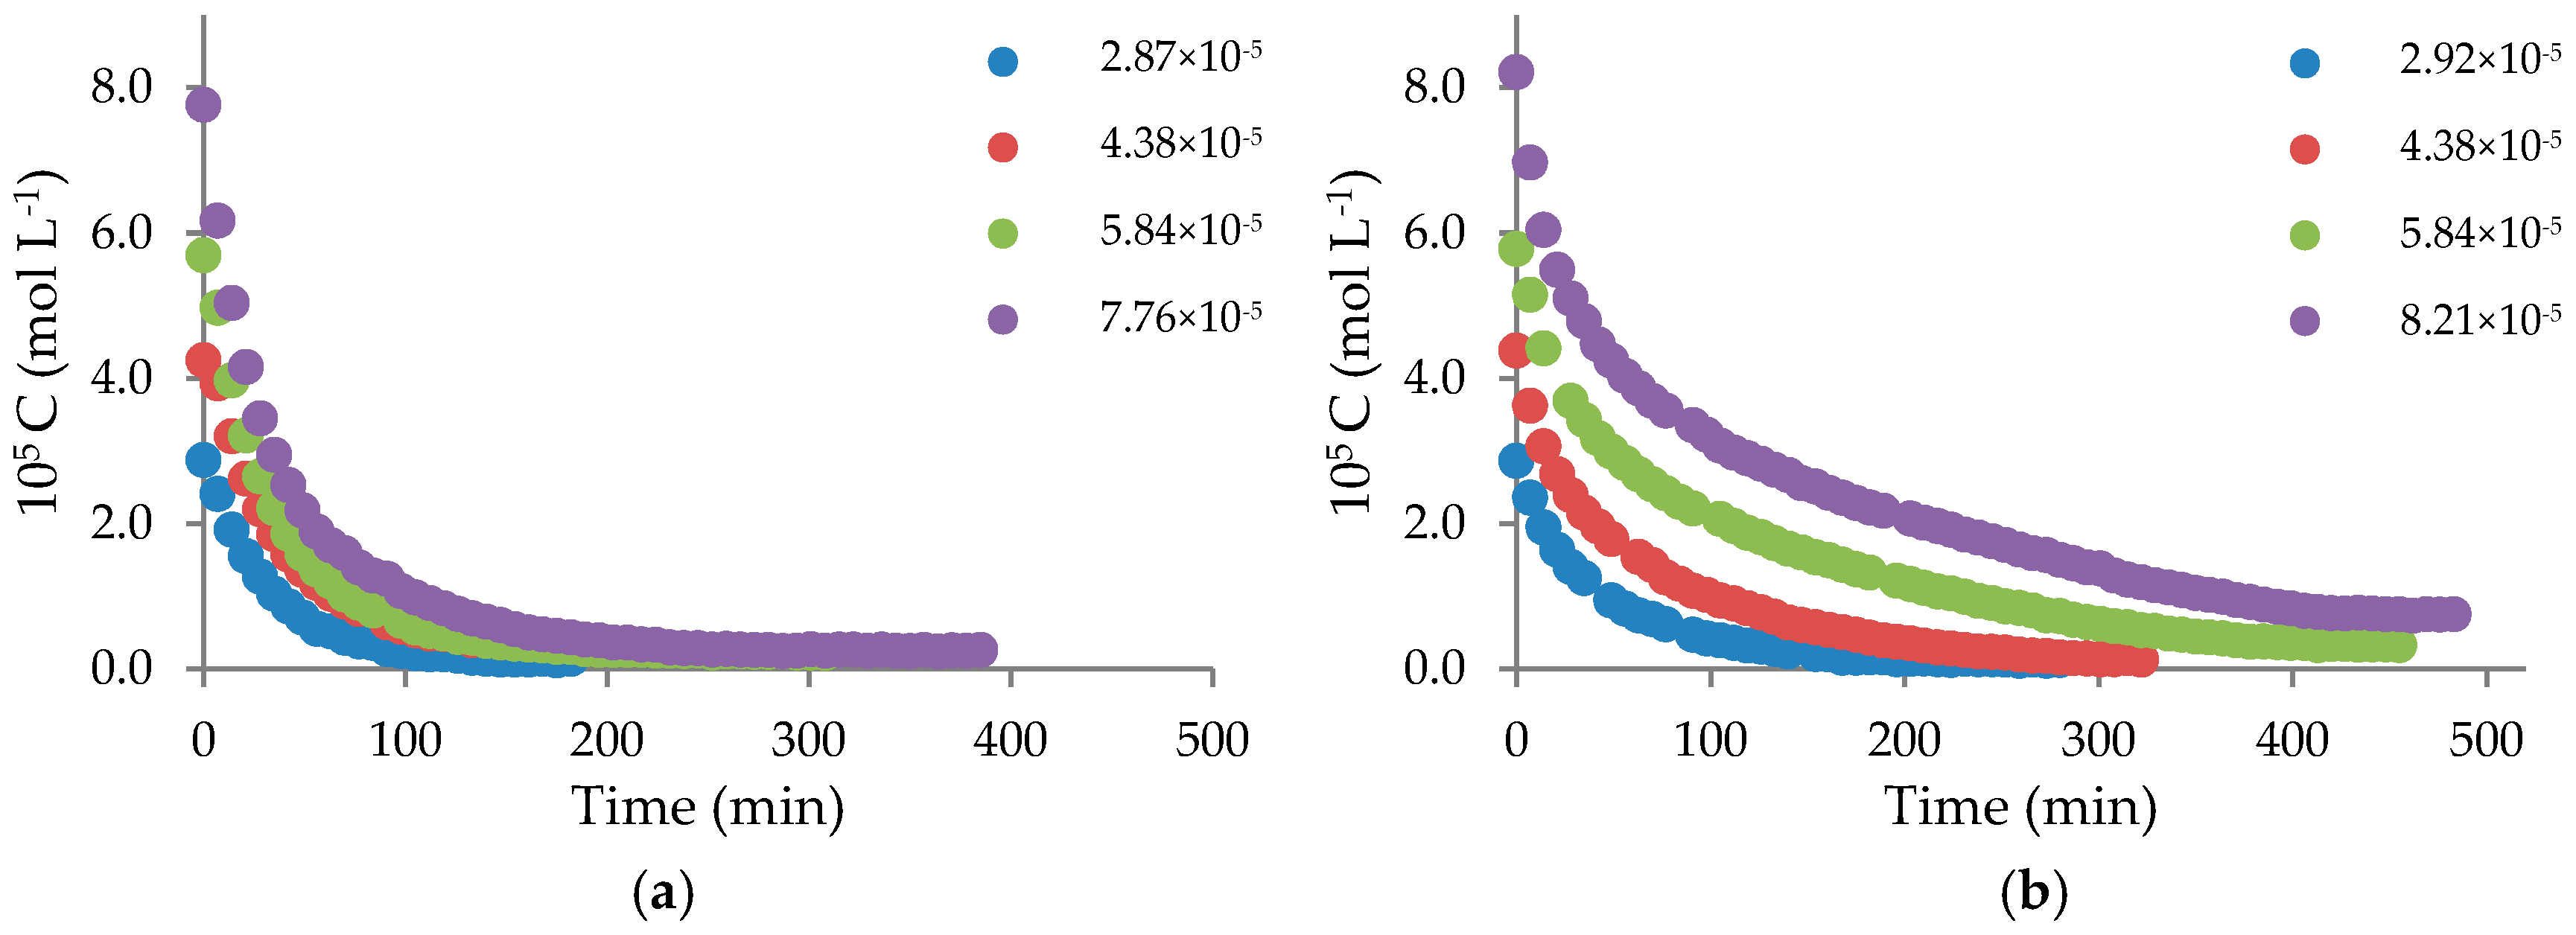
| 2.87 × 10⁻⁵ | 2.57 ± 0.02 | 1.45 ± 0.02 | 2.92 × 10⁻⁵ | 2.07 ± 0.02 * | 1.59 ± 0.02 |
| 4.38 × 10⁻⁵ | 2.54 ± 0.03 | 2.11 ± 0.03 * | 4.38 × 10⁻⁵ | 2.83 ± 0.03 * | 1.55 ± 0.03 * |
| 5.84 × 10⁻⁵ | 2.27 ± 0.03 | 1.23 ± 0.02 * | 5.84 × 10⁻⁵ | 3.34 ± 0.02 * | 0.67 ± 0.02 * |
| 7.76 × 10⁻⁵ | 2.62 ± 0.02 | 0.67 ± 0.03 | 8.21 × 10⁻⁵ | 4.31 ± 0.04 | 0.34 ± 0.02 |
| [PP@TiO2]A | [PP@TiO2]P-25 | ||
|---|---|---|---|
| [ARS]0 (mol·L−1) | k1/k2 | [ARS]0 (mol·L−1) | k1/k2 |
| 2.87 × 10⁻⁵ | 1.8 | 2.92 × 10⁻⁵ | 1.3 |
| 4.38 × 10⁻⁵ | 1.2 | 4.38 × 10⁻⁵ | 1.8 |
| 5.84 × 10⁻⁵ | 1.9 | 5.84 × 10⁻⁵ | 5.0 |
| 7.76 × 10⁻⁵ | 4.0 | 8.21 × 10⁻⁵ | 12.7 |
© 2016 by the authors; licensee MDPI, Basel, Switzerland. This article is an open access article distributed under the terms and conditions of the Creative Commons Attribution (CC-BY) license (http://creativecommons.org/licenses/by/4.0/).
Share and Cite
Giovannetti, R.; Rommozzi, E.; D’Amato, C.A.; Zannotti, M. Kinetic Model for Simultaneous Adsorption/Photodegradation Process of Alizarin Red S in Water Solution by Nano-TiO2 under Visible Light. Catalysts 2016, 6, 84. https://doi.org/10.3390/catal6060084
Giovannetti R, Rommozzi E, D’Amato CA, Zannotti M. Kinetic Model for Simultaneous Adsorption/Photodegradation Process of Alizarin Red S in Water Solution by Nano-TiO2 under Visible Light. Catalysts. 2016; 6(6):84. https://doi.org/10.3390/catal6060084
Chicago/Turabian StyleGiovannetti, Rita, Elena Rommozzi, Chiara Anna D’Amato, and Marco Zannotti. 2016. "Kinetic Model for Simultaneous Adsorption/Photodegradation Process of Alizarin Red S in Water Solution by Nano-TiO2 under Visible Light" Catalysts 6, no. 6: 84. https://doi.org/10.3390/catal6060084
APA StyleGiovannetti, R., Rommozzi, E., D’Amato, C. A., & Zannotti, M. (2016). Kinetic Model for Simultaneous Adsorption/Photodegradation Process of Alizarin Red S in Water Solution by Nano-TiO2 under Visible Light. Catalysts, 6(6), 84. https://doi.org/10.3390/catal6060084