3.1. Rheological Characteristics of the Catalyst Support Precursor Dispersion
The rheological characterization of the catalyst support precursor dispersion in water was studied using the oscillating pendant drop technique [
23] before dissolving the catalyst precursor nitrate salt in the dispersion. The precursor support dispersion, despite its high silica loading, is a clear transparent liquid with relatively low constant simple shear viscosity (10 cp) due to the coating of the dispersed silica particles which reduces silica network formation [
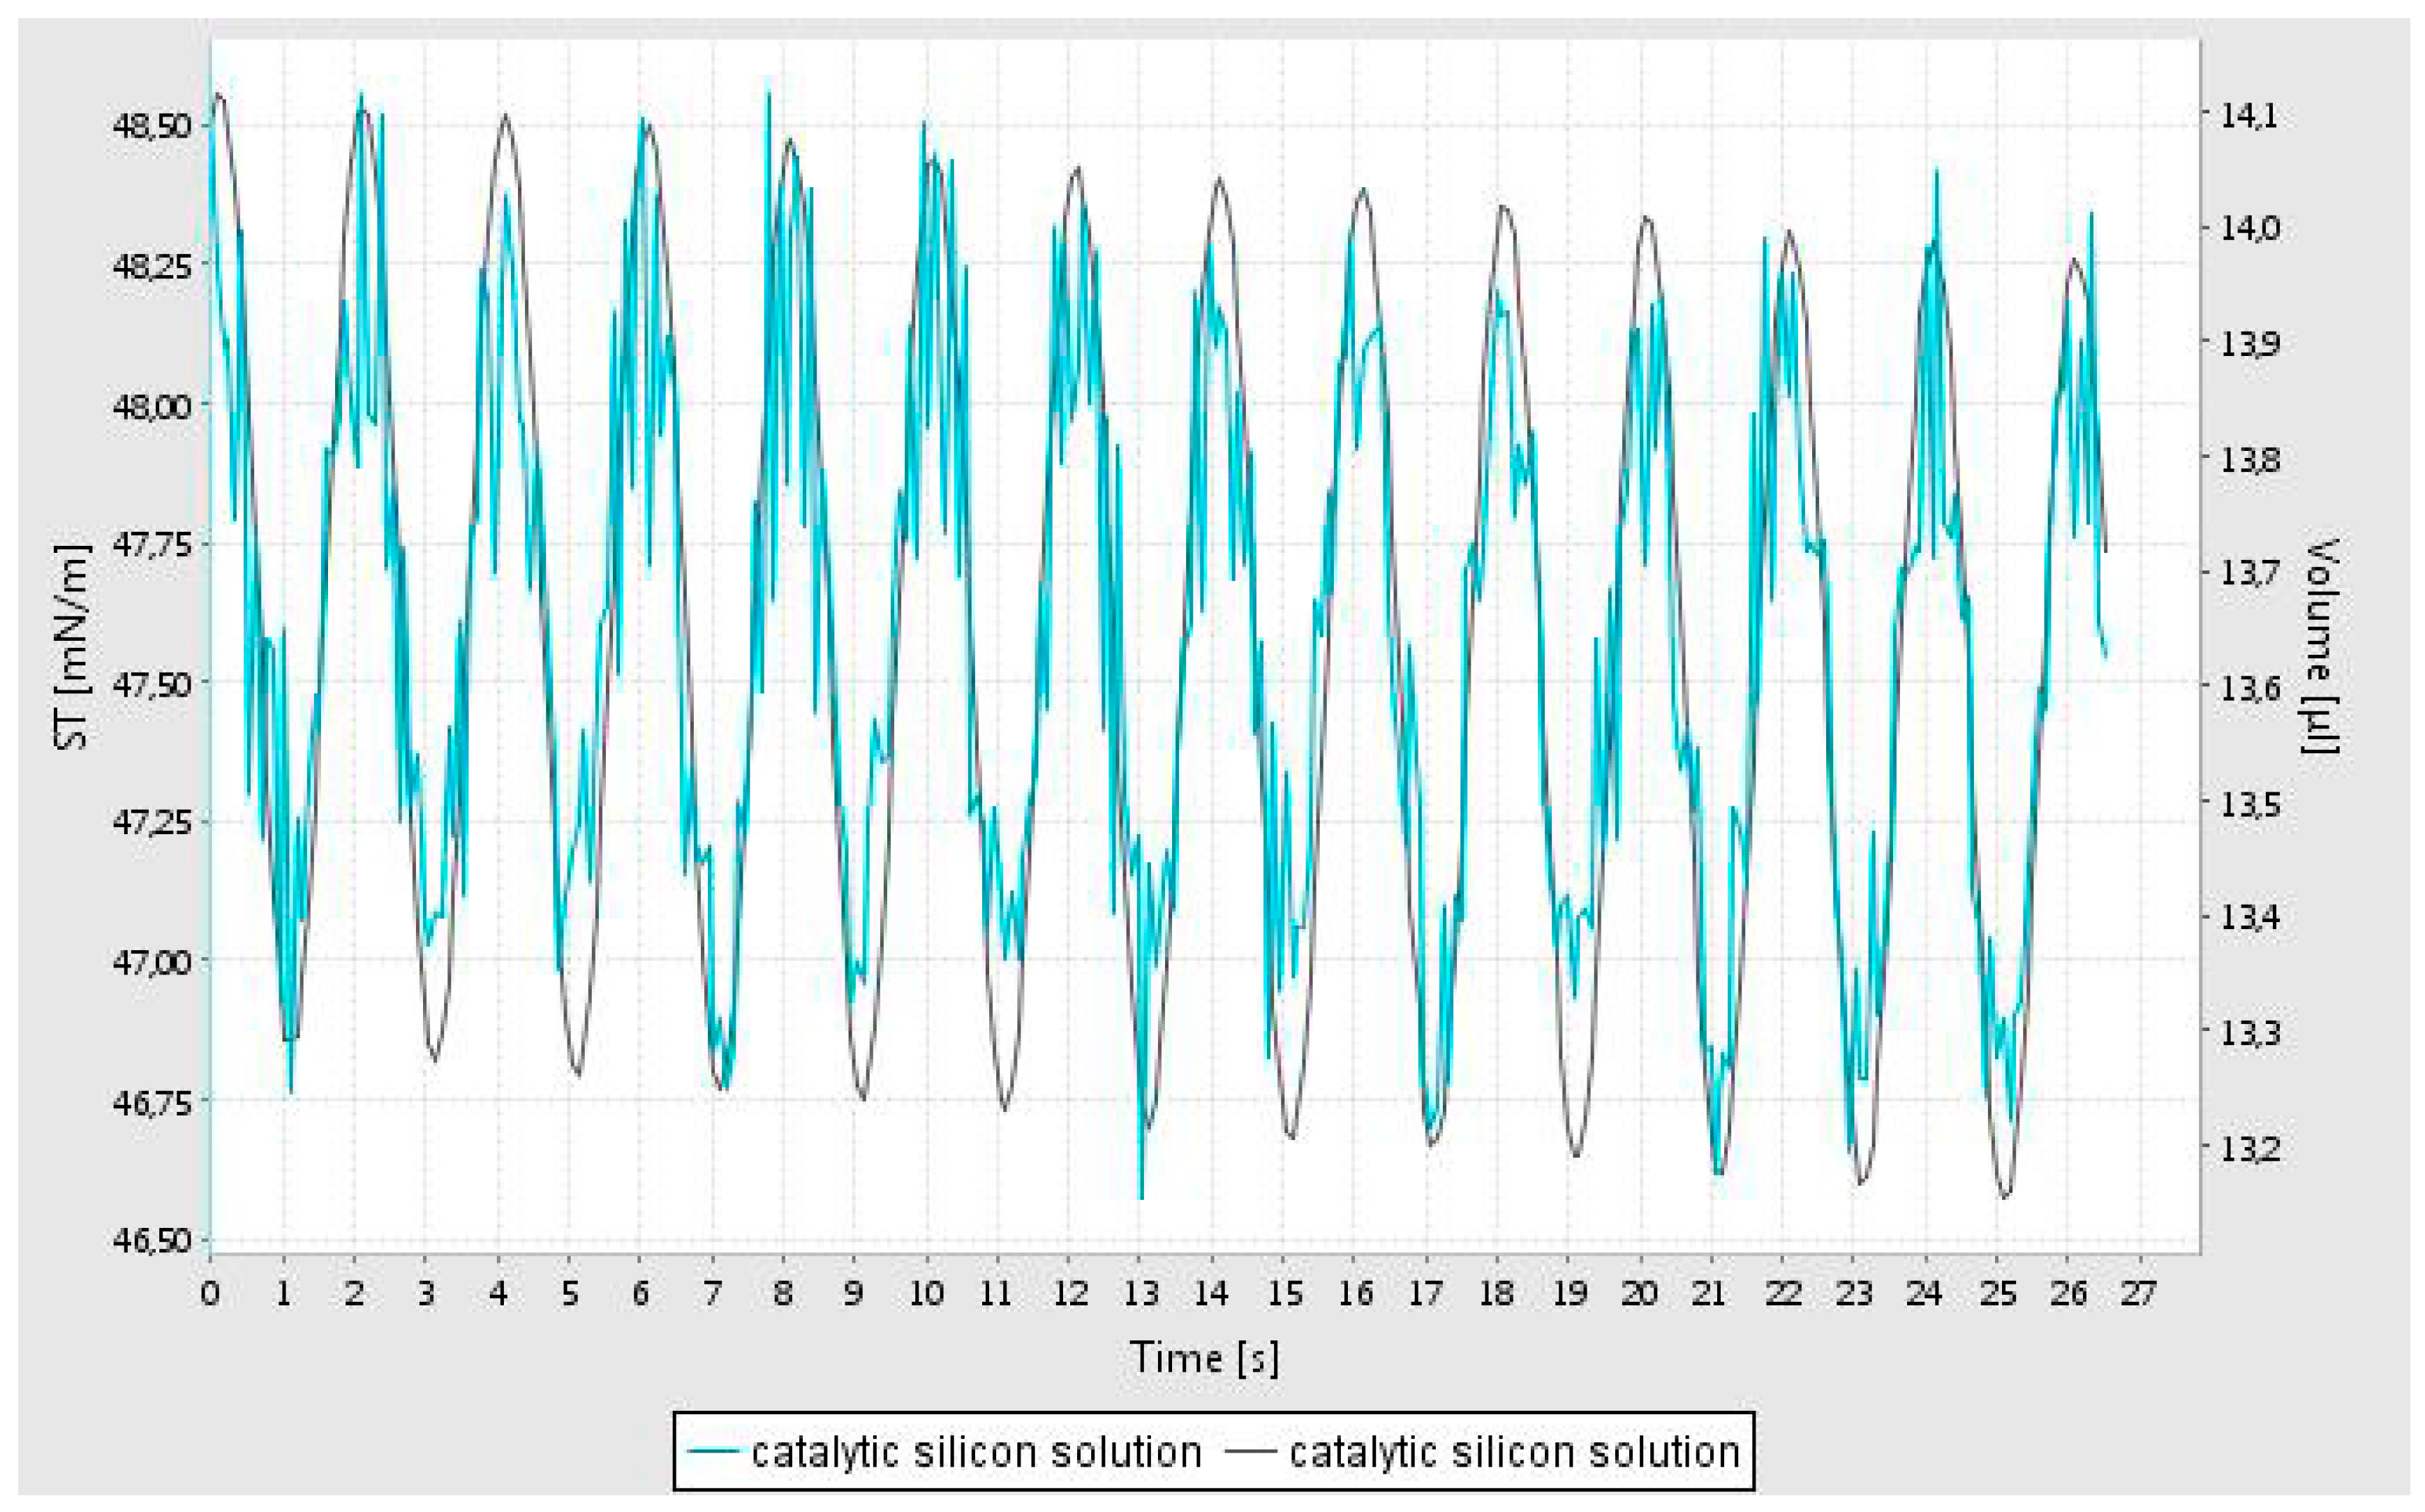
27]. In this method, a drop of fluid is generated at the tip of a syringe and the volume of the bubble is oscillated while imaging the bubble. It is important to note that in order to record the image of the oscillating bubble, the pendant bubble is illuminated. It was observed that although a bubble could be generated, during data acquisition, it become unstable and hence the data is confined to the first minute of bubble generation. From this data, the interfacial tension, elastic (storage) modulus (E’) and viscous (loss) modulus (E’’) are evaluated as a function of frequency of oscillations using well established theories [
23]. The oscillatory variation of the fluid volume and the computed interfacial tension is shown in
Figure 1. This data shows that the interfacial tension is unstable, indicating rapid alterations at the air-water interface.
Although the simple shear viscosity of the dispersion is constant (independent of shear rate in a simple shear flow) it however shows very high fluid elasticity as measured by the oscillating pendant drop method. This non-Newtonian rheological behavior indicates that it has a very high extensional viscosity [
27,
28] as indeed expected in liquids which are primarily used for surface coating applications. Elastic and viscous moduli (E’ and E’’) of the catalyst support dispersion solution were measured at 3 different frequencies (0.2; 0.5; and 1 Hz) and were found to be constant at E’ = 24 ± 1 mN/m and E’’ = 2.3 ± 0.1 mN/m.
In fact, this behavior has been predicted through the analysis of micro-rheological models of dispersions at oil-water or water-air interfaces using either nearly solid spherical nano-particles [
29] or 2-dimensional rod-like particles [
30].
When the interfacial rheology of the fluid containing the catalyst precursor nitrate salt (in this case ferric nitrate) and the silica support precursor dispersion was tested, the bubble instability was very fast and the bubble shape could not be fitted for analysis. In any case, instead of forming a bubble, the liquid climbed up the syringe thus no data could be acquired.
The above observations indicate that the fluid surface at air interface has solid-like behavior and that this behavior becomes unstable in the presence of a primary chromophore (nitrate) [
31] when the droplet is illuminated, thus producing NO
x and reactive hydroxyl radicals [
31] which, in the presence of organic species, (present as silica coating) causes the oxidation of the organic species, as indeed detected by XRD studies (
Section 3.12). Furthermore, due to the high storage modulus of the fluid, it is likely that such a fluid is capable of forming thin films despite the fact that it has a very large loading of nano-sized silica particles which can also promote the stability of emulsions/foams [
32,
33] as well as act as an anti-foaming agent/destabilizer [
34] depending on the hydrophobic-hydrophilic balance on the silica surface [
32,
33].
When ferric nitrate was added to the support precursor silica dispersion, the response of the pendant drop became unstable. It is well known that the orientation or phase behavior of light sensitive molecules (surfactants or surface active moieties) or nano-particles at interfaces can be altered by using light [
35,
36]. As nitrate acts as a primary chromophore, which in the presence of organic moieties produces nitrite [
31]. This ion is a possible source of NO and hydroxyl radicals [
31]. In the case of iron oxide [
37] and iron hydroxide [
38], we can expect further photocatalytic activity at the air/fluid interface.
These observations formed the bases of modelling of the current technique for the supported catalyst production through self-assembly of the catalyst precursor and silica support.
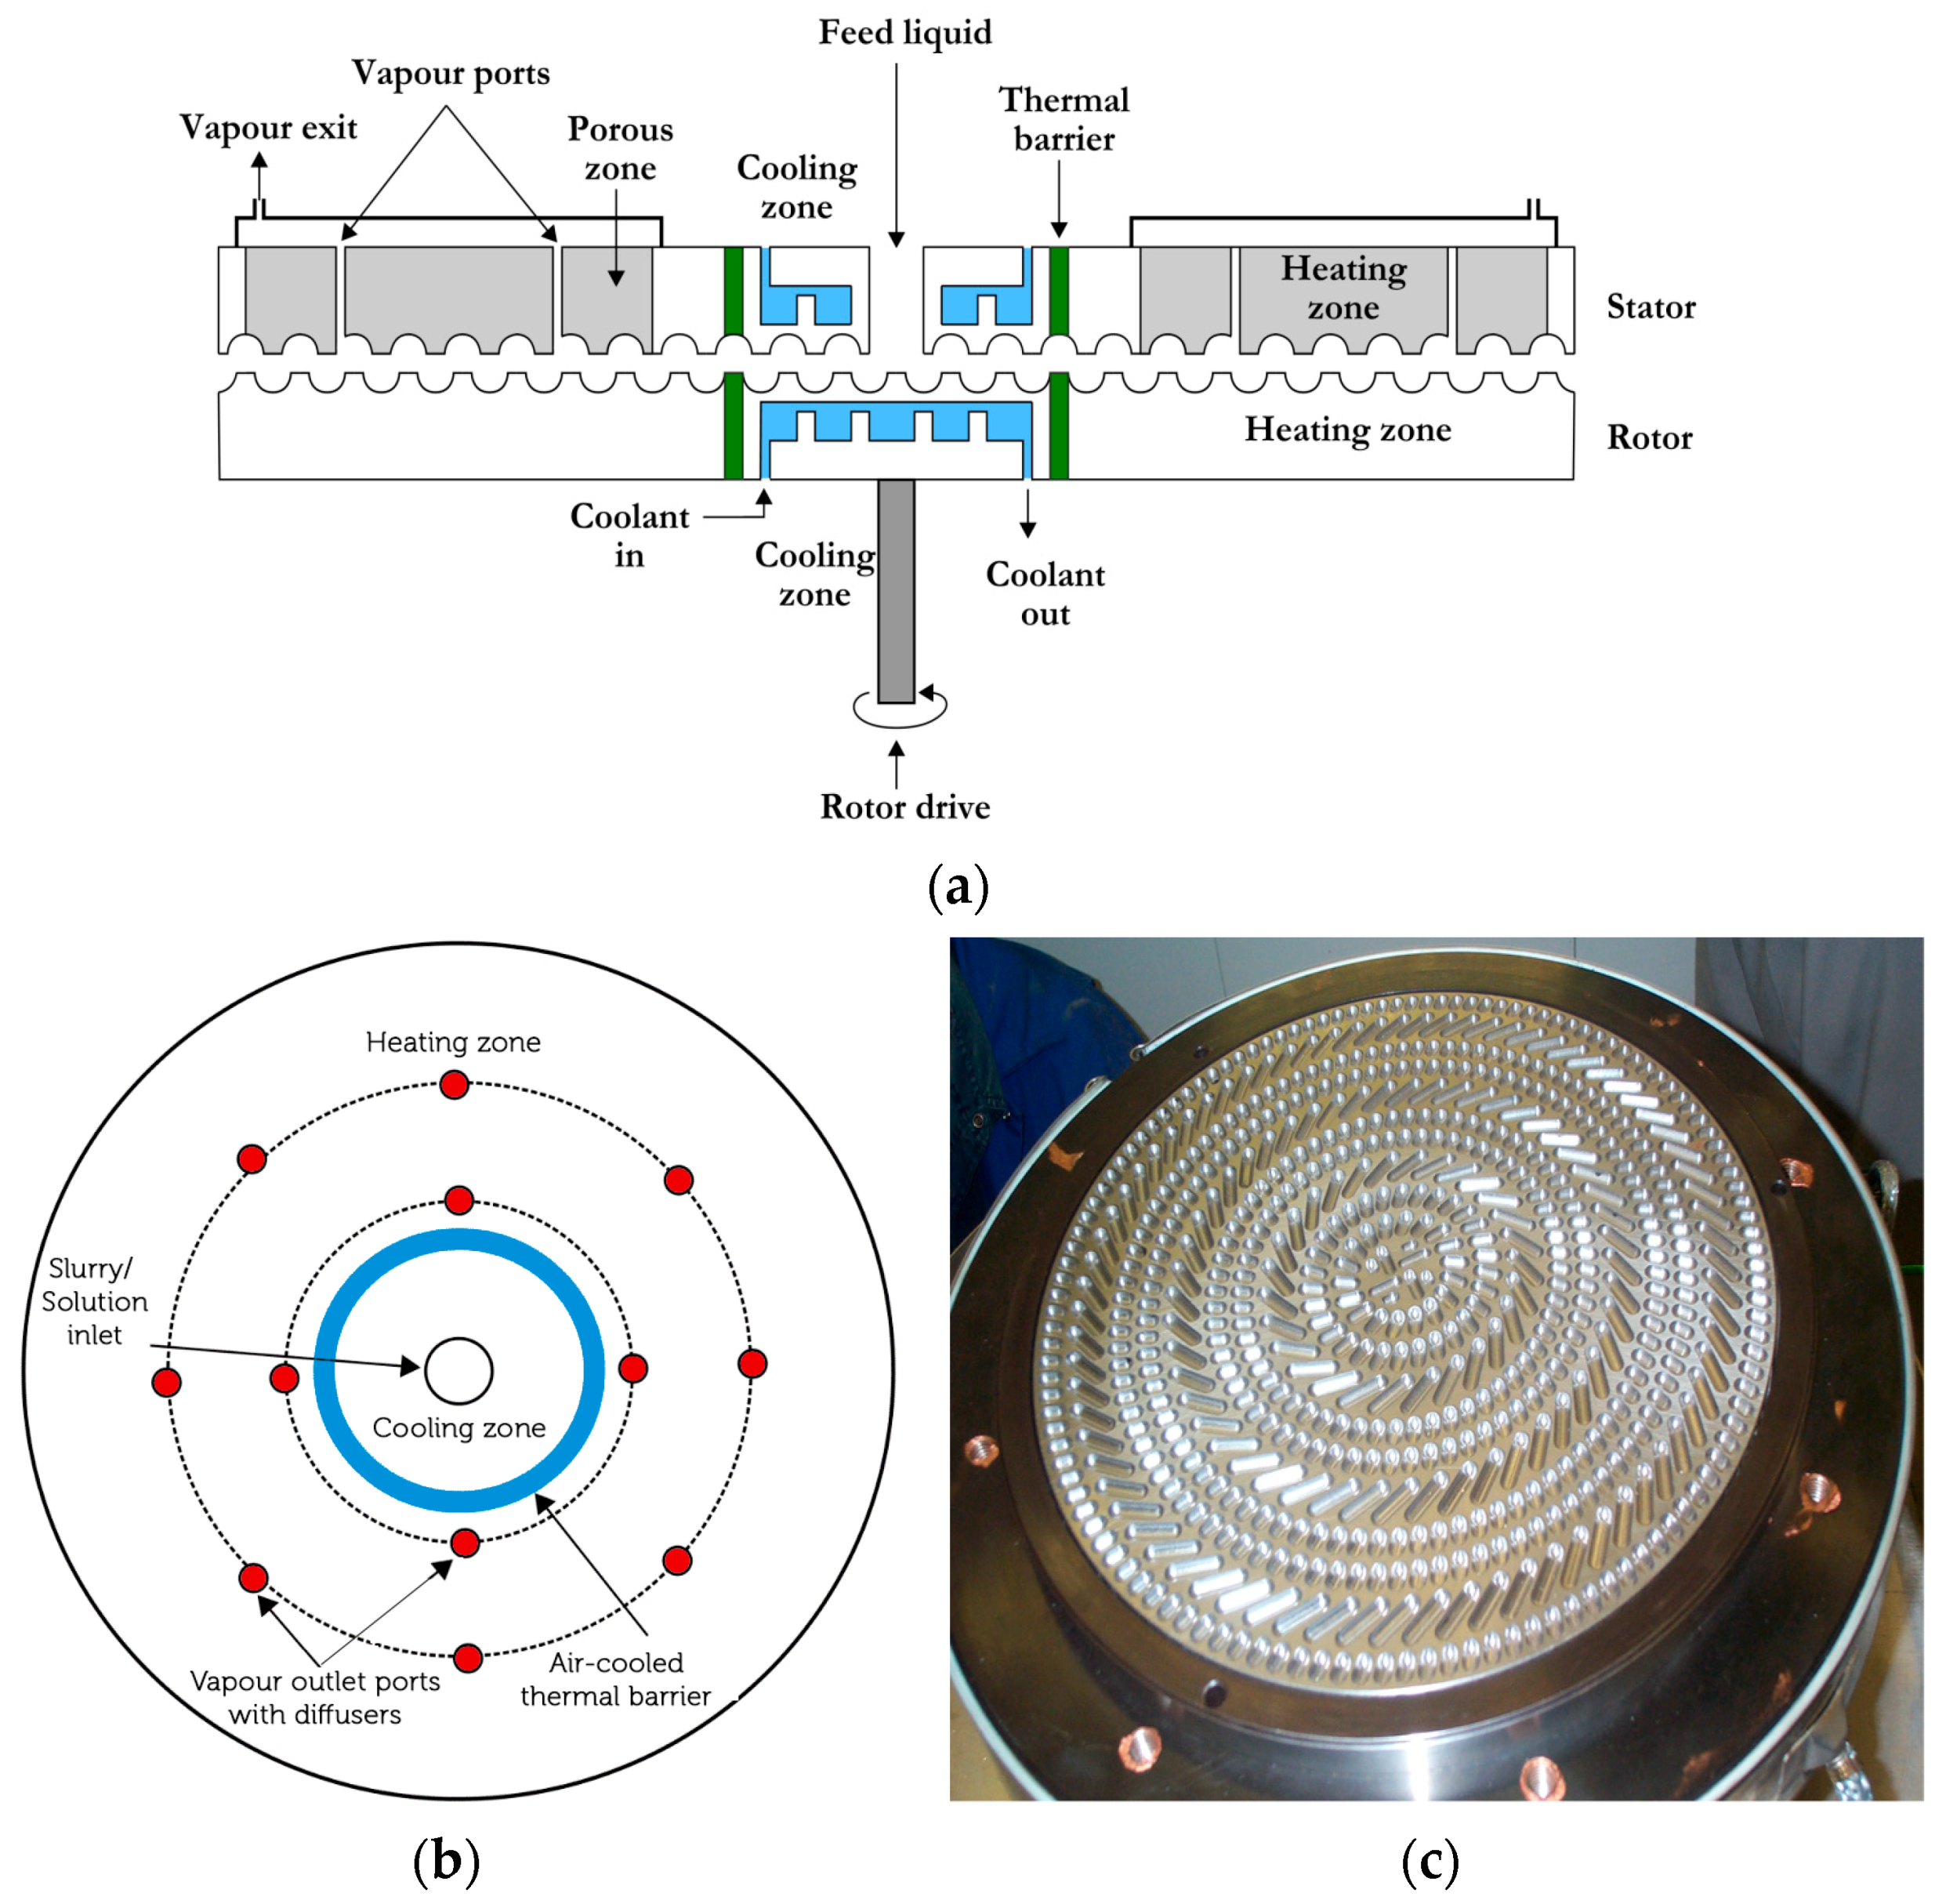
3.5. Preparation of Coated Silica Supported Catalyst Using GAP-Agglomerator
Supported metal catalysts are often used in agglomerated form. Here, we use a purpose built agglomerator in which liquid feed is converted into agglomerated solid particles after going through a liquid-to-solid phase transformation. This technique is known as flow induced agglomeration originally developed for polymeric systems [
43,
44]. The agglomerator consists of a rotor and stator which have closely packed cavities. These cavities can pump, convey highly viscous phases and after phase inversion, also convey the newly formed particles. The diagrammatical illustration of the GAP-agglomerator is shown in
Figure 5. The cross-section of the agglomerator (
Figure 5a) also illustrates the cooling and heating zones as well as ports for the removal of vapors and gases. The top-view of the agglomerator illustrates (
Figure 5b) the location of the vapor/gas removal ports. The cavity shape and their distribution on the rotor are shown in
Figure 5c.
The entrance to the rotor/stator of the agglomerator was kept at 90 °C while the rest of the disks were kept at 120 °C. The rotational speed was 30 rpm. Coated silica dispersion containing catalyst precursor, Co(NO3)2 at a molar ratio of [Co]/[Si] = 1/5 at room temperature was pumped into the equipment at a rate of 10 mL/min. Vapor was allowed to escape from the vapor ports as well as from the gap between the disks at the outlet. Catalyst precursor/support dispersion went through a highly viscous phase as the water content decreased. The constant mixing, and the design of the agglomerator cavities allow pumping of the highly viscous dispersions which eventually ‘crumbles’ and primary particles agglomerate. Agglomerated particles were discharged at the exit between the disks and were collected in the collection tray.
The particle size measurements indicate that the average particle size of the agglomerates was
D50 = 155 μm; particle size at 10% and 90% cumulative were
D10 = 42 μm and
D90 = 320 μm respective while the particle size span was
S = 1.08 indicating a very narrow size distribution. These samples were calcined as described in
Section 3.1. The resulting supported metal oxide was analyzed for surface area and catalyst size from XRD. Supported catalyst surface area was 238 m
2/g while the cobalt oxide size based on the strongest XRD-peak was 21.1 nm.
3.6. Supported Catalyst Generation within the Pores of Macro-Porous Foams
In chemical reactors, catalysts are used in a fixed bed or fluidized bed. Alternatively, catalysts can be fixed on the walls of so called structured or monolithic or micro-reactors. However, in such reactors, catalyst fixation on the reactor walls has some drawbacks, including low catalyst volume and a tendency for catalyst to erode, due to fluid flow and thermal/mechanical stress generation.
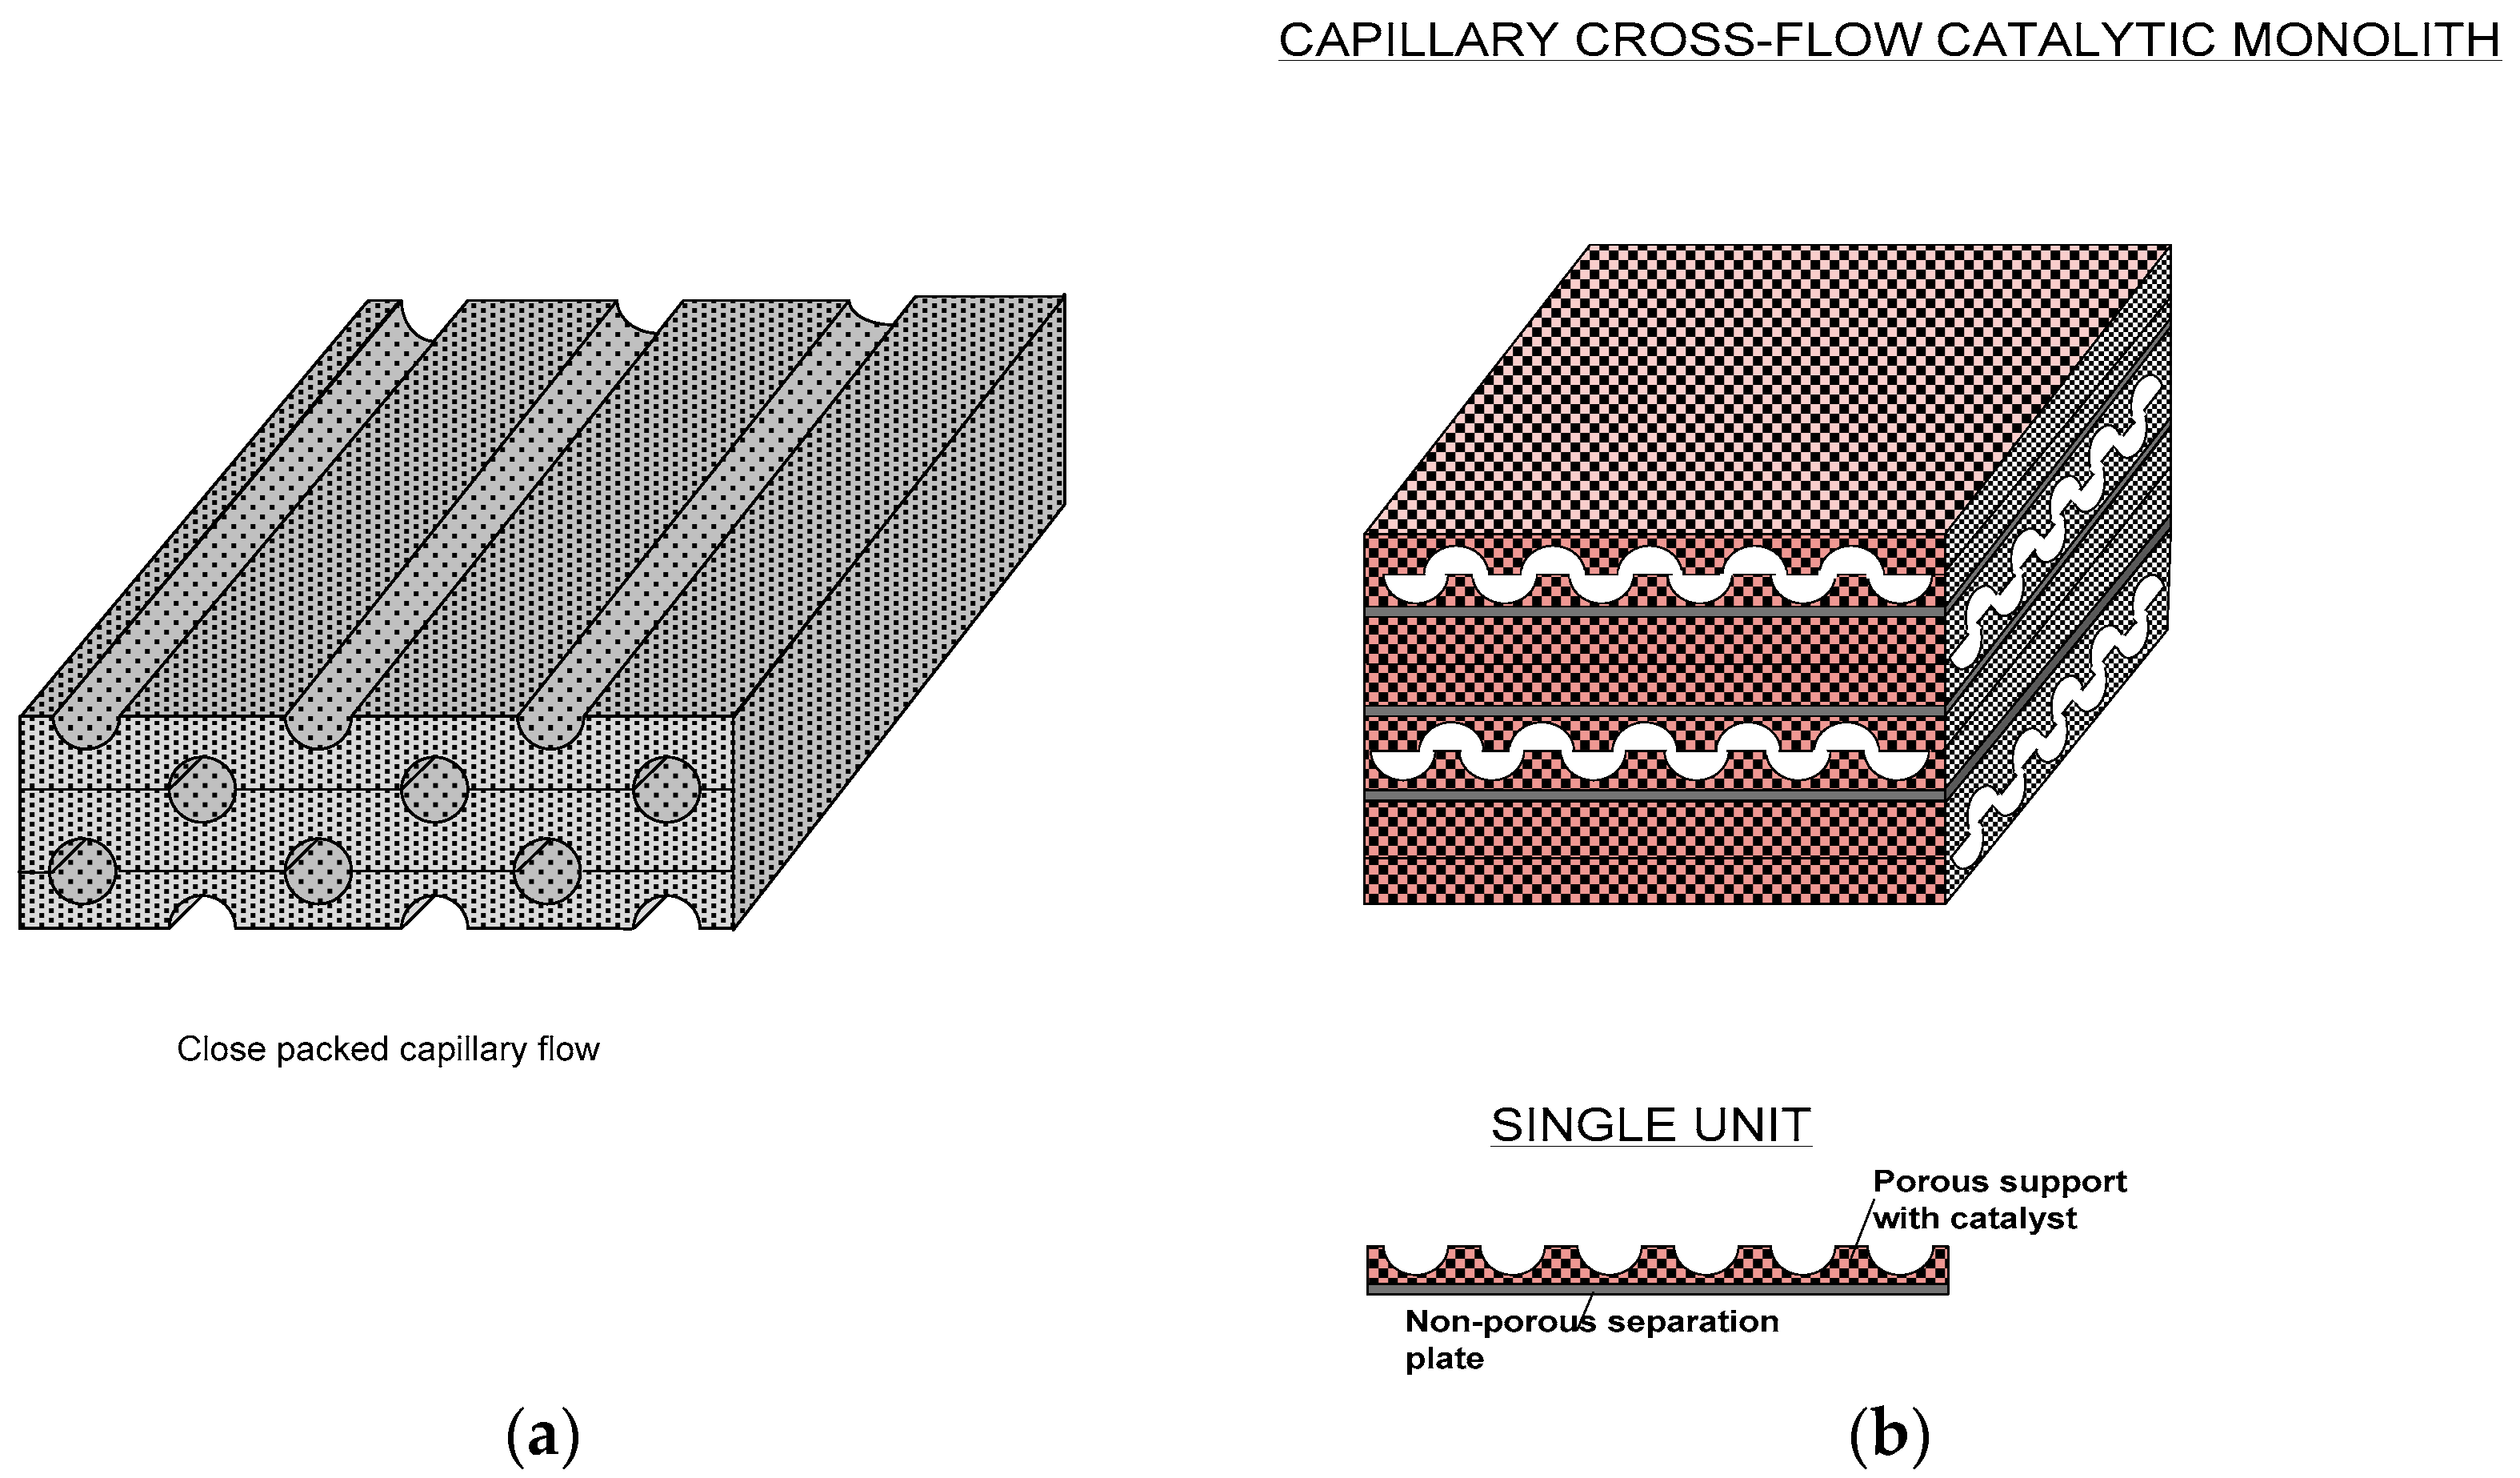
In order to prevent these drawbacks, the catalyst can be incorporated within the pores of metallic or ceramic foams which can then be fabricated into micro-reactors as illustrated in
Figure 6. Microreactor fabrication (such as micro-capillary reactors) using metallic foams containing catalysts is especially simple since a series of parallel half capillaries or other types of channels can be formed and subsequently these plates can be assembled to form micro-channel reactors as shown in
Figure 6a. Main bulk flow of the reactants will be in these channels but they will readily diffuse into the foamed regions where the catalyst is present. The flow field can be tailored to promote heat and mass transfer through the geometry/architecture of these foamed structures. For example, the basic flat units with imprinted half capillaries can be off-set so that the channels are capillaric or even fully open in the transverse direction (
Figure 6b). Further facilitation in such reactors can be achieved by separating each structured plate by non-porous thin metal plates so that two sets of separate inlets-outlets can be obtained to carry out separate reactions in each set. Such systems are useful for rapid heat transfer.
In such porous channel reactors, catalyst erosion due to stresses generated through fluid flow and/or thermal gradients are prevented since the transport processes (momentum, heat and mass transport) are not by convection but through diffusion and the foam structure allows the absorption of thermal and mechanical stresses.
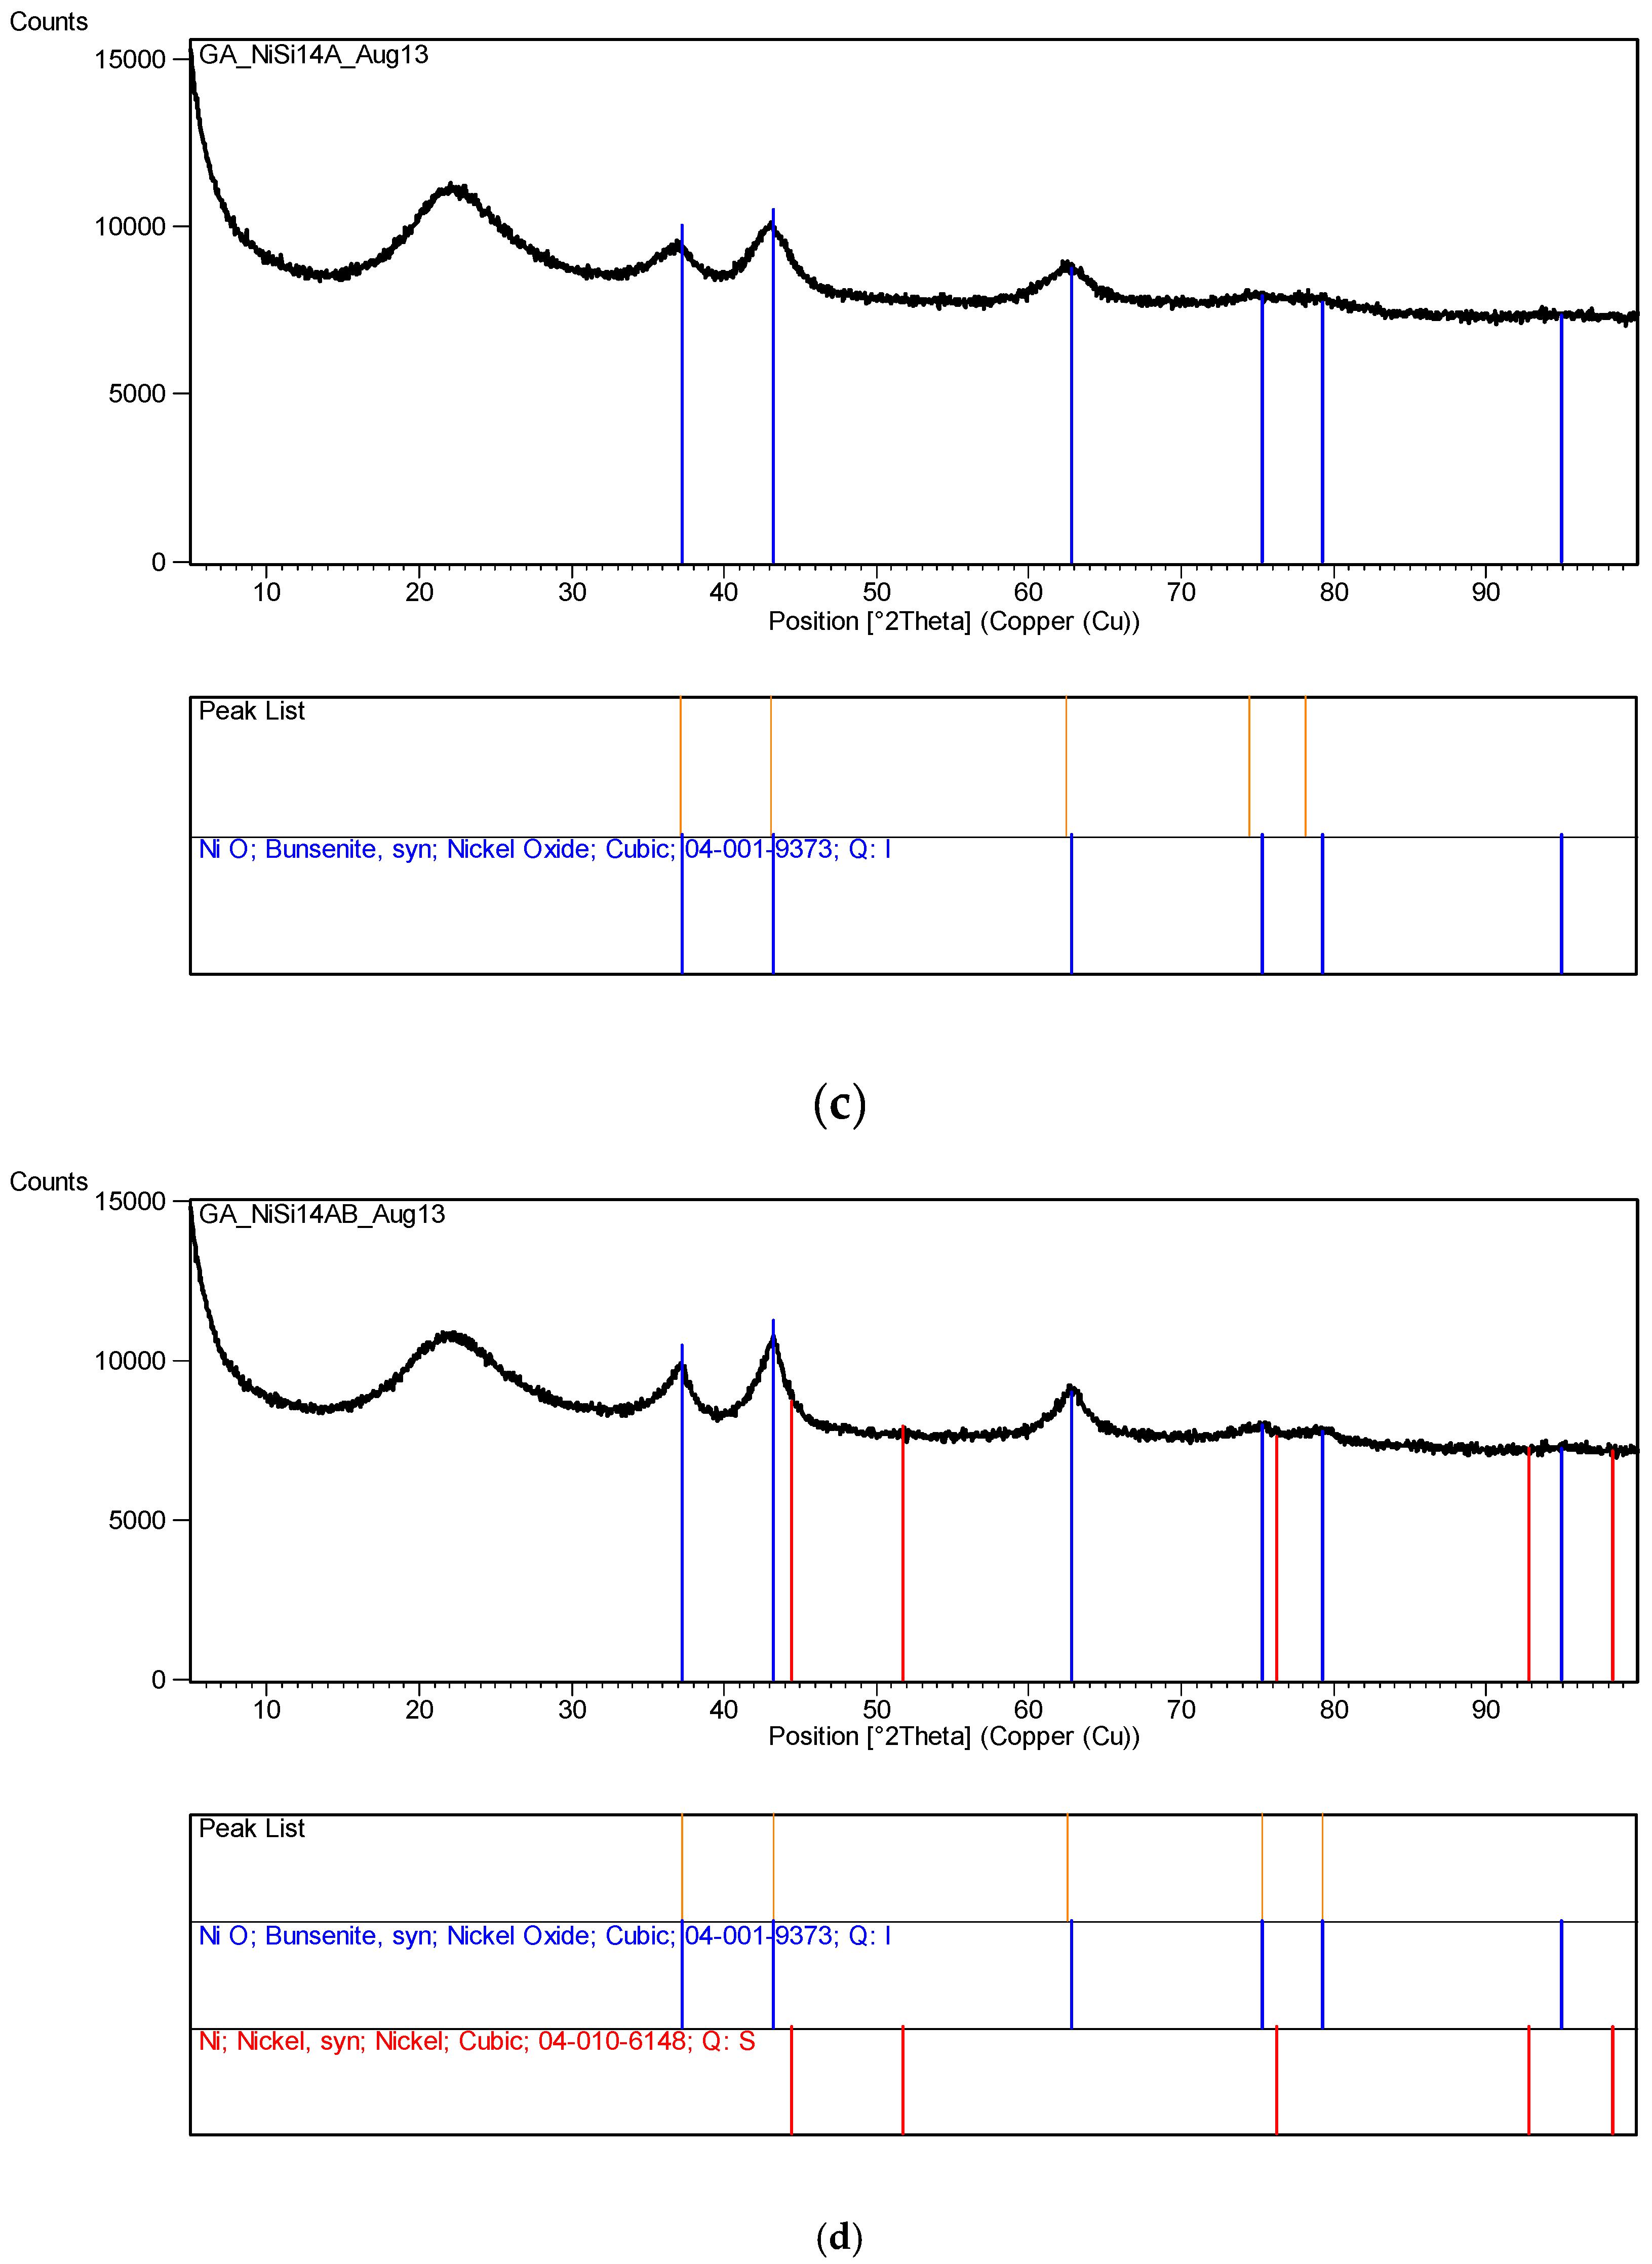
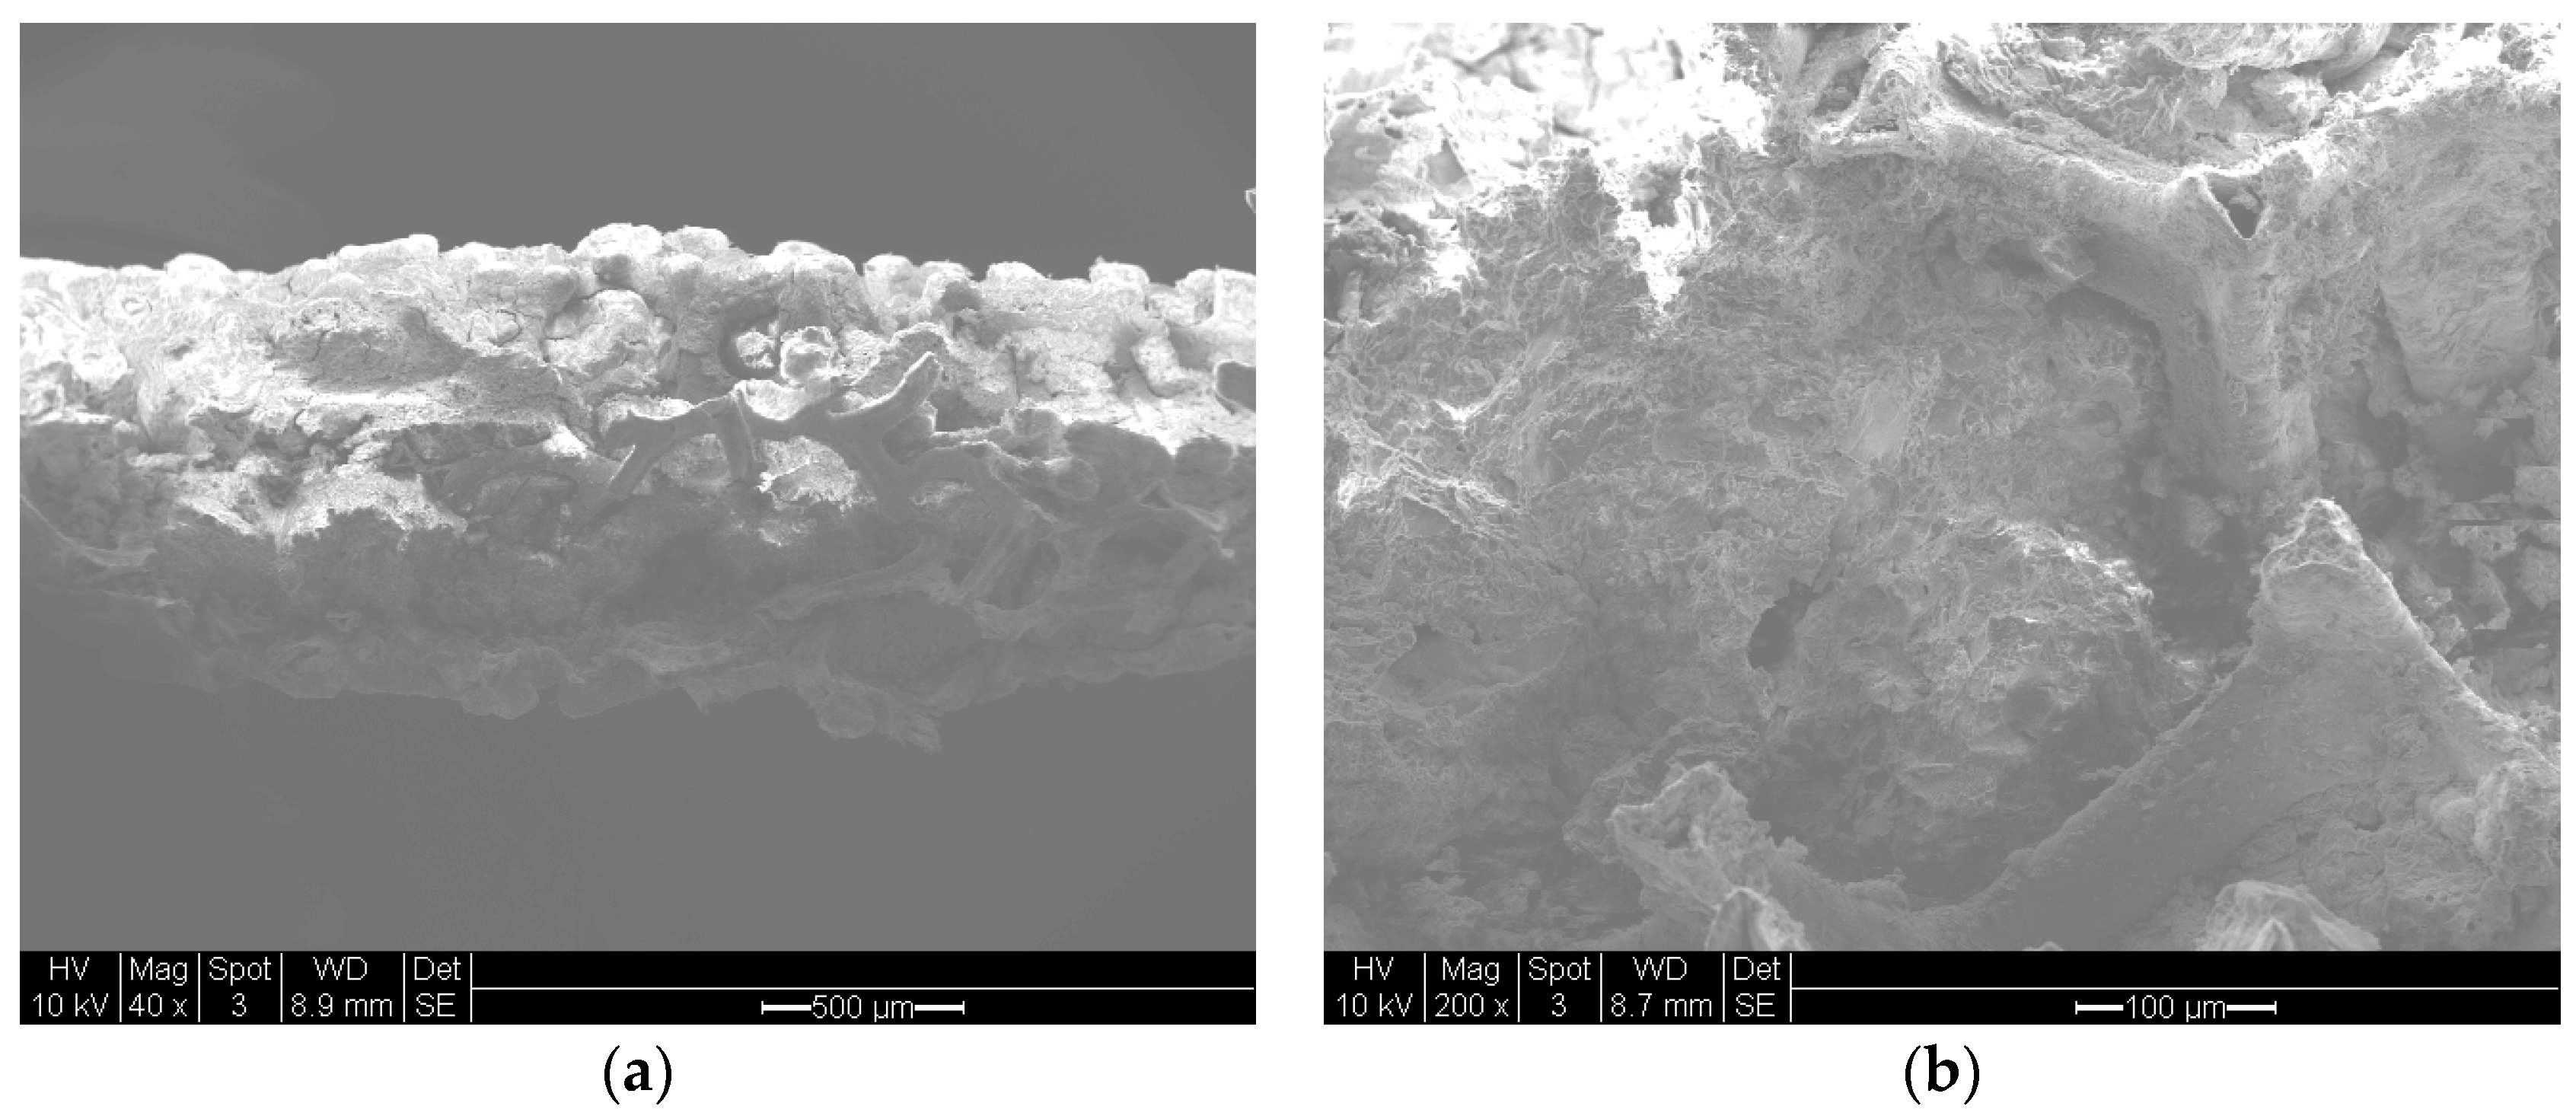
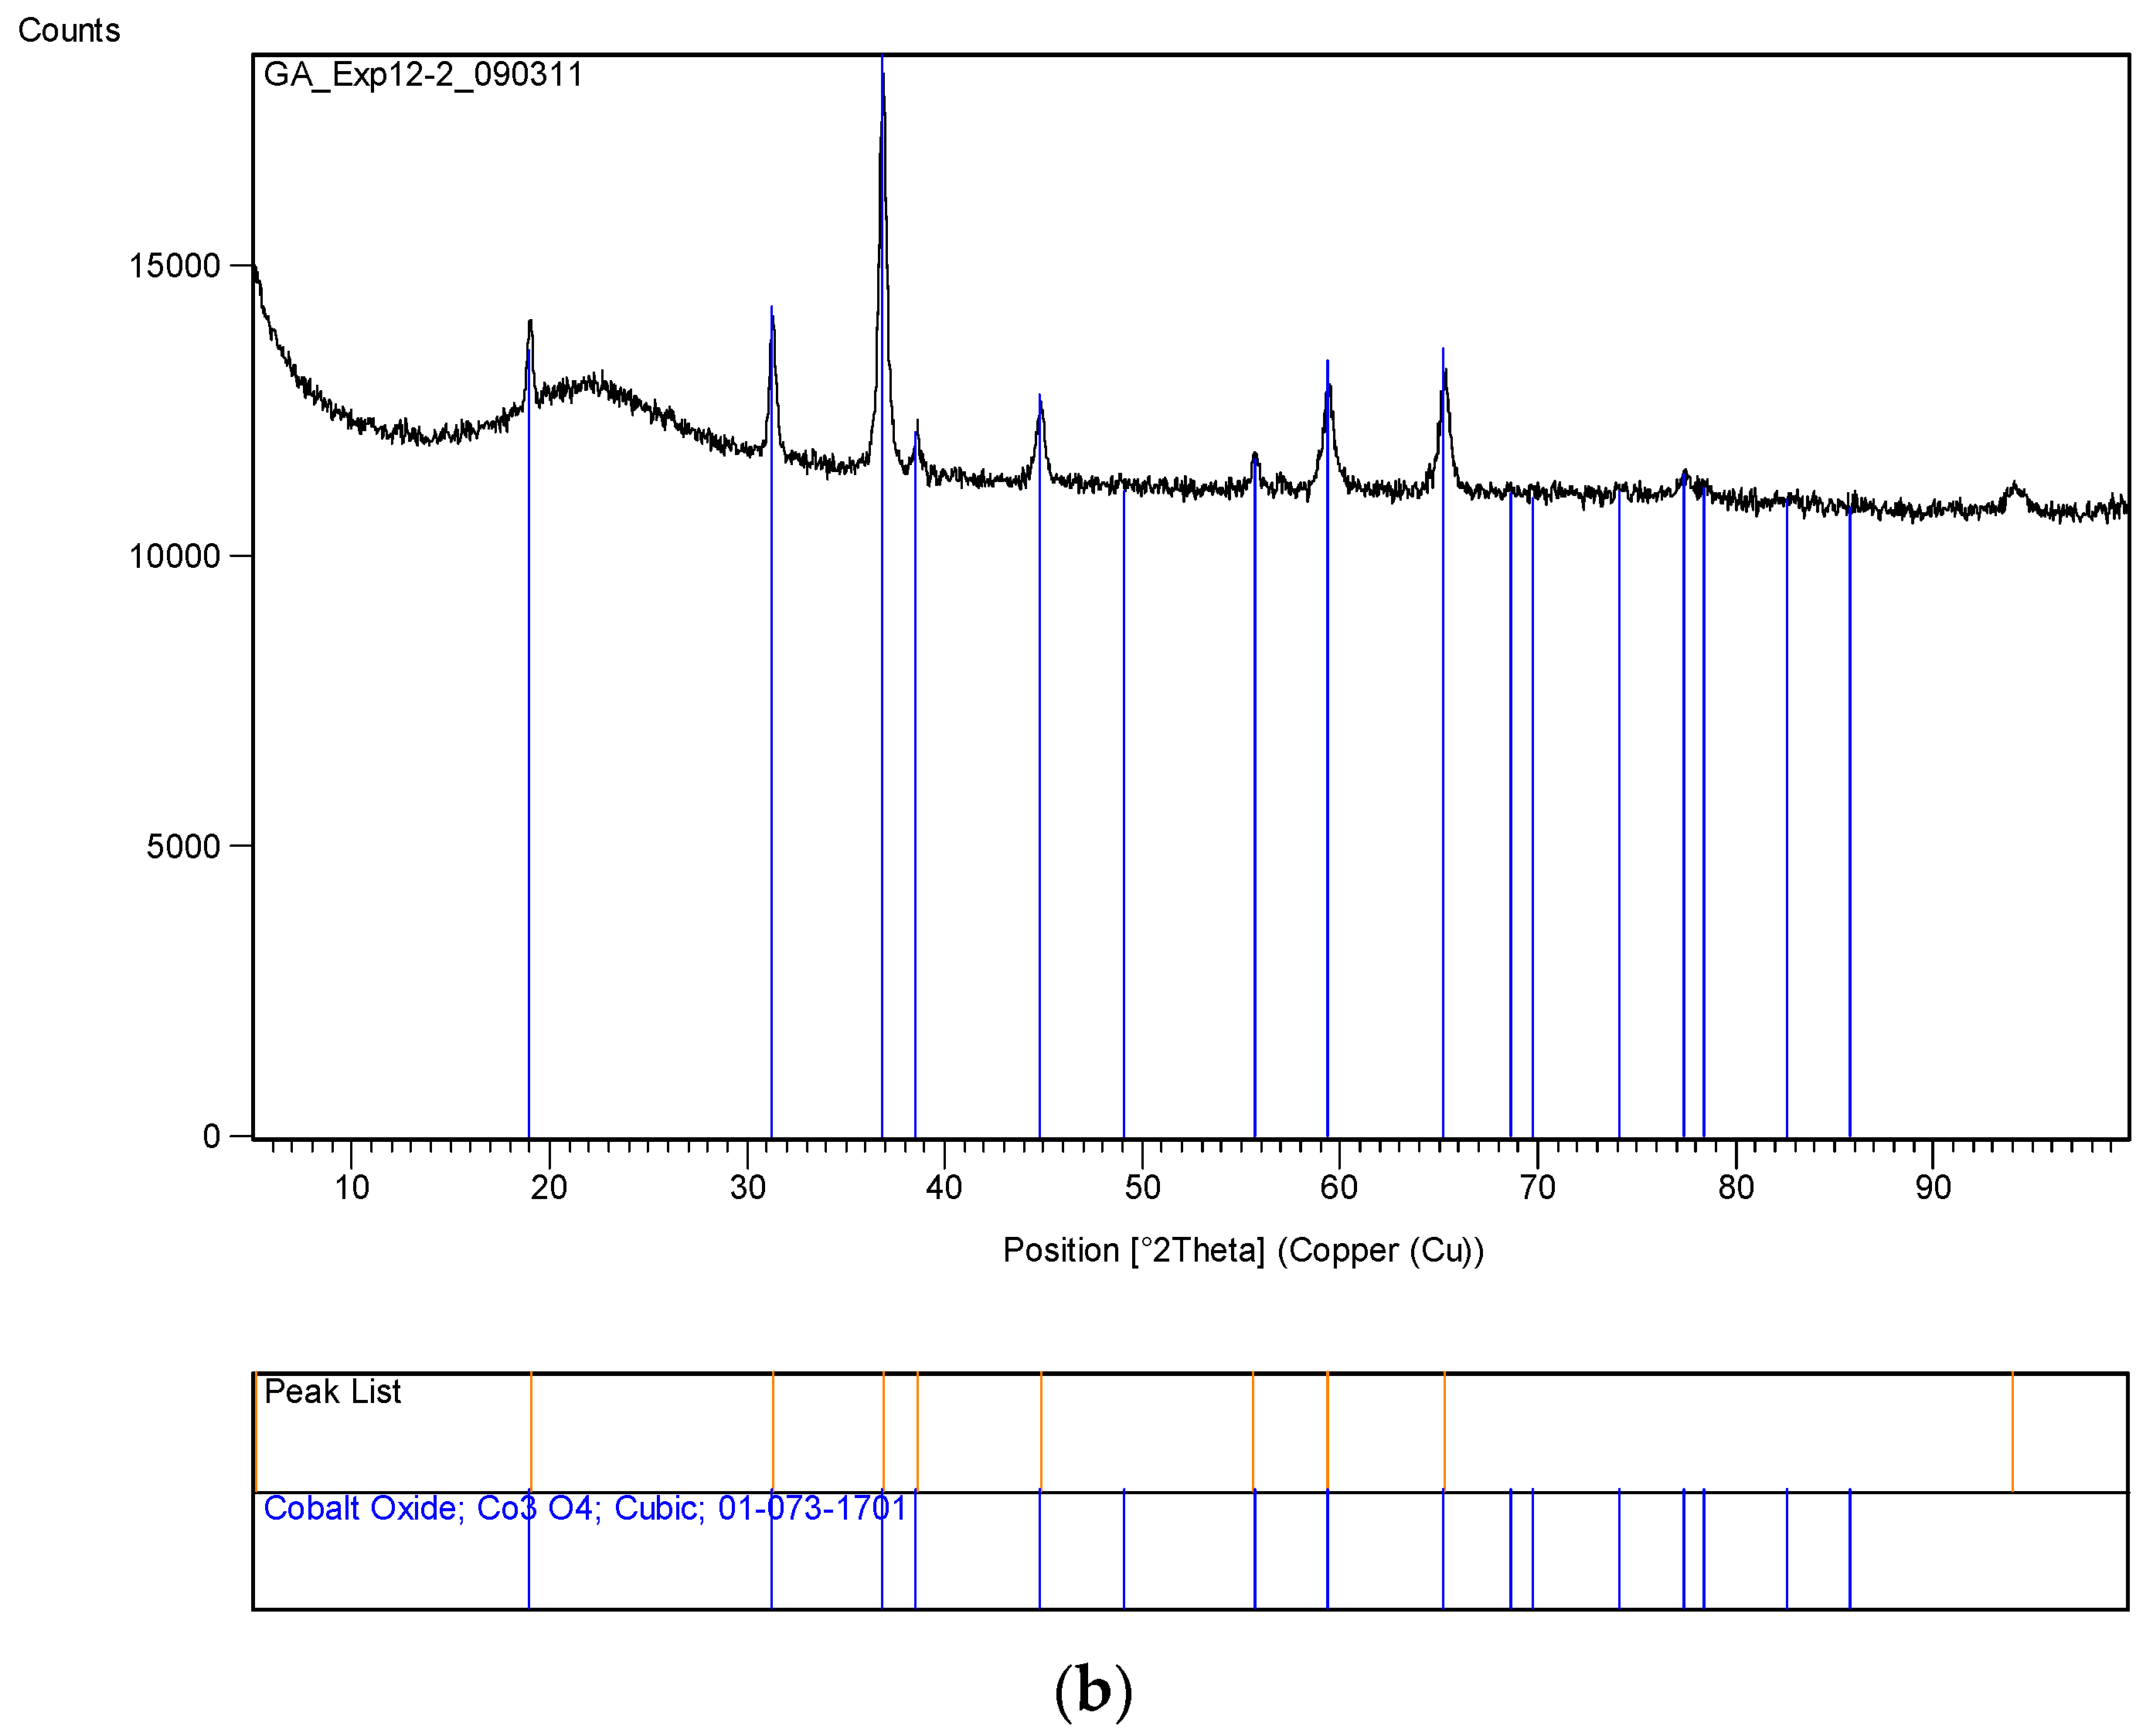
We used a nickel foam in order to incorporate silica supported cobalt catalysts. This system allows us to distinguish between the foam support (Ni) and the catalyst (Co) in XRD analysis. A support precursor fluid (Bindzil CC30) and cobalt catalyst precursor (Co(NO3)2) solution was prepared at the molar ratio of [Co]/[Si] = 1:4. Flat nickel foam (Recemat) plates, measuring 10 cm × 10 cm, were pressed against a set of 1 mm diameter stainless steel rods separated by 2 mm spaces in a hot press at 300 °C and 10 bar pressure for 2 min to form an imprint of the rods in the form of half capillaries. These plates were then soaked in the support + catalyst precursor fluid for 10 min and then placed in flat dishes with sufficient support + catalyst precursor solution covering them. These plates were then put into a furnace and heat treated at 600 °C (with 1 h heating time at a rate of 10 °C/min and 1 h dwell time at 600 °C followed by 24 h of cooling). Any excess catalyst from the surface was removed in an air stream and then examined under SEM followed by XRD analysis for the crystallite size of the silica supported cobalt oxide catalyst.
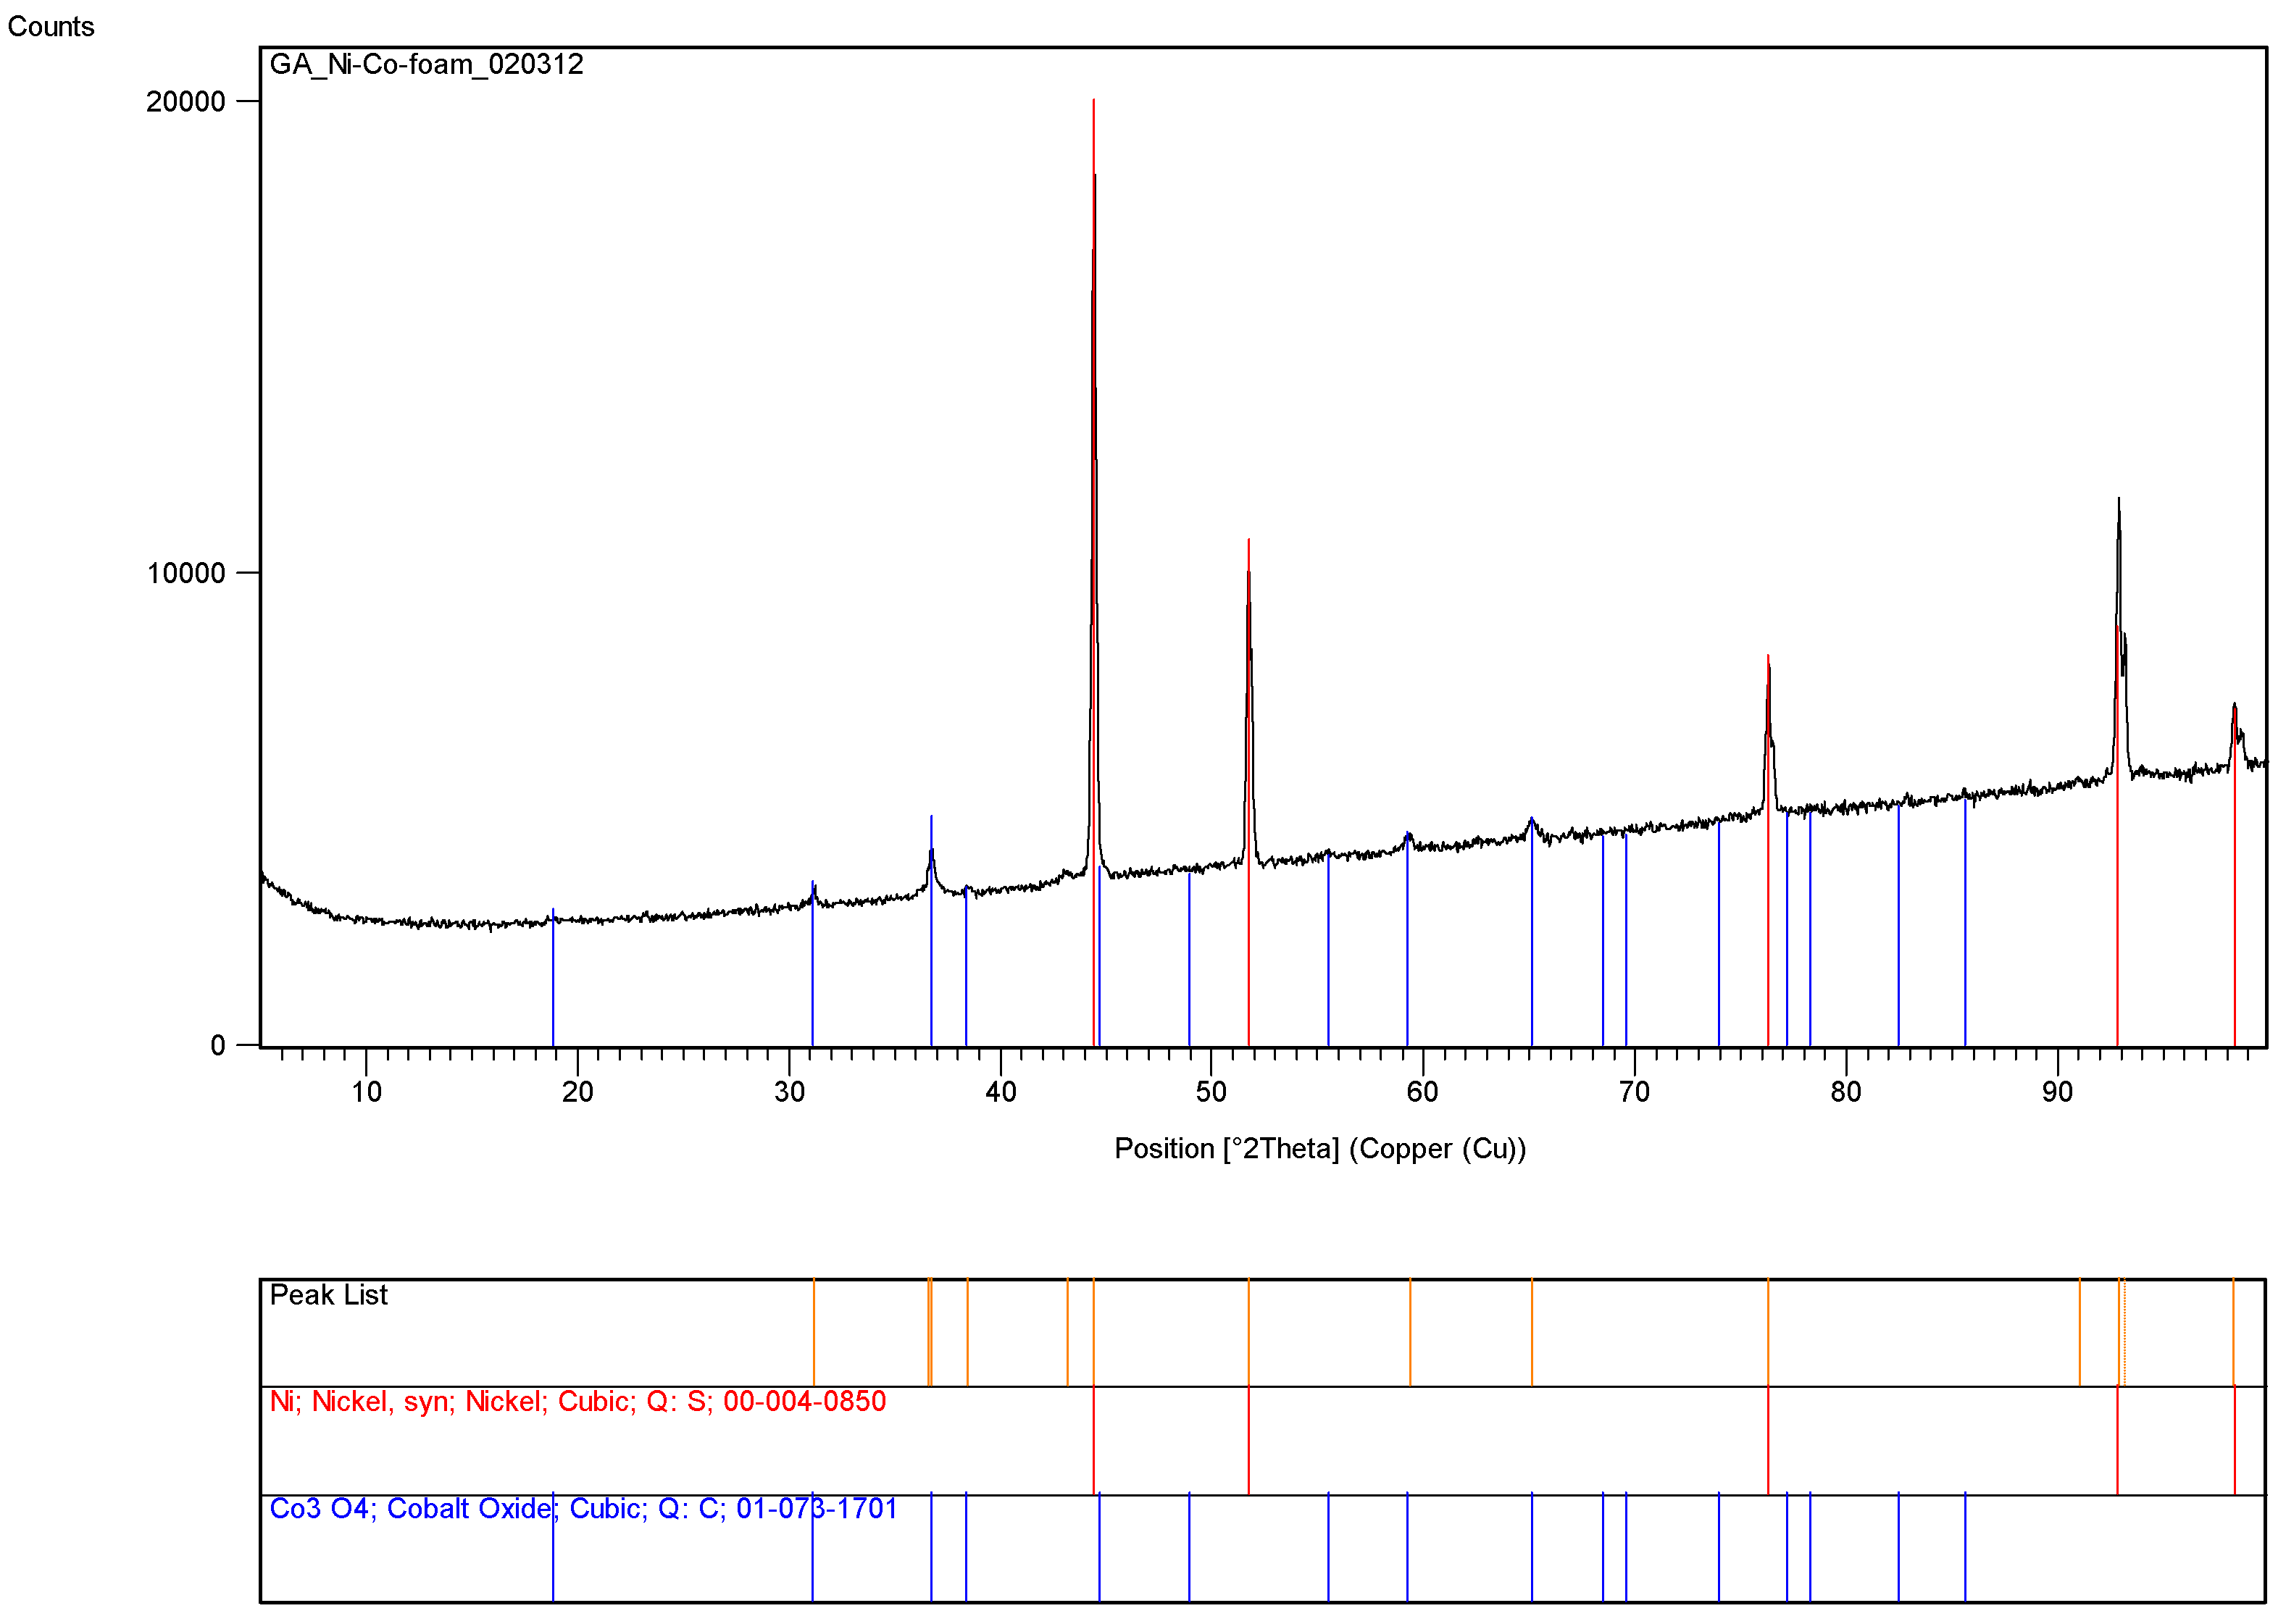
Figure 7 shows the presence of cobalt catalyst within the pores of the nickel foam while
Figure 8 illustrate the XRD-pattern of this catalyst system. Very sharp dominant peaks represent nickel while the smaller and broader peaks represent Co
3O
4 with crystallite size of 20.9 nm based on the dominant cobalt oxide peak at 2θ = 36.6°.
3.8. Thermochemical Preparation of Supported Catalysts
In order to use the supported metal oxide obtained from the catalyst precursor nitrate salt, it is necessary to reduce the resulting metal oxide for use as a catalyst. Furthermore, the organic coating on the catalyst support needs to be removed, unless it has a catalytic functionality. This coating can also be carbonized to obtain a mixed silica/carbon catalyst support.
The catalyst oxide reduction can be carried out typically at 550 °C using hydrogen. The type of catalyst developed here is also suitable as a high temperature heterogeneous catalyst and has been used in gas-to-liquid conversion processes [
45,
46,
47] including dry reforming [
45], ammonia synthesis [
46] and Fischer-Tropsch synthesis [
47]. However, high temperature catalyst oxide reduction or high temperature catalytic processes result in the enlargement of the catalyst size. Therefore, the catalyst oxide size after thermal treatment at high temperature will be a more realistic characteristic of the catalysts. Nevertheless, it is also possible to use these catalysts successfully for low temperature gas-to-liquid conversion processes using non-thermal plasma when the catalyst reduction is carried out in-situ at low temperatures, <250 °C [
8,
45,
46,
47].
It was also found that if the molar ratio of catalyst and support, [M]/[Si] (where M = Fe, Co, Ni in present case) is large or the pH is too low, the nitrate decomposition reaction did not take place although the highly porous (expanded) catalyst/silica precursor structure was formed.
For the reasons listed above, we also carried out the decomposition reaction of catalyst nitrate/silica support at 300 °C or 600 °C. Experiments at 300 °C were carried out in order to directly compare the thermal process with the microwave process although the maximum temperature in the microwave process was 225 °C and the decomposition reaction actually started at ca. 125 °C.
It was found that the thermal preparation of the catalyst using coated silica at 300 °C and 600 °C also resulted in film boiling and subsequent decomposition of nitrate to catalyst oxide and the formation of a highly porous catalyst. As described previously (
Section 3.2 and
Section 3.3) we have already prepared catalysts at 600 °C when the supported catalyst precursor underwent decomposition from a highly viscous state, without forming a film. Therefore, the comparison of catalysts obtained from these two methods should illustrate the mechanism of catalyst structure formation using microwave radiation.
We used the following methods for the thermal processes:
- (a)
Thermal decomposition with boiling at 300 °C (Method-A): 20 mL of the precursor solution containing Bindzil CC 30 and nickel nitrate was placed in a 1 liter beaker and placed in a high temperature furnace. The temperature was raised from room temperature to 300 °C at a rate of 10 °C/min. The sample was kept at this temperature for another 30 min before the heating was switched off. After a period of ca. 0.1 h, the sample was recovered in the form of an expanded black solid and subsequently analyzed for surface area, crystallite size and micro-to-nano size structure evaluation.
- (b)
Thermal decomposition with boiling at 600 °C with rapid heating-rapid cooling (Method-B): 20 mL of the precursor solution containing Bindzil CC 30 and nickel nitrate was placed in a 1 liter beaker and placed in a high temperature furnace. Temperature of the furnace was raised to 600 °C and the sample was put into the furnace. After a period of 0.1 h, the sample was removed and allowed to cool at room temperature.
- (c)
Thermal decomposition with boiling at 600 °C with slow heating-slow cooling (Method-C): After placing the precursor solution sample into the furnace, its temperature was raised from room temperature to 600 °C at a rate of 10 °C/min. The sample was kept at this temperature for another 60 min before the heating was switched off. After a period of 24 h (slow cooling process), the sample was recovered in the form of expanded supported metal oxide and subsequently analyzed for surface area, crystallite size and micro-to-nano size structure evaluation.
Method-C was also used to calcine the samples from microwave treatment, either as expanded silica supported metal nitrate (i.e., decomposition has not taken place) or as silica supported metal oxide (after decomposition of the nitrate salt) in order to compare the two methods.
3.10. UV-Radiation Induced Decomposition of Catalyst Precursor in Silica Dispersion
It was observed that ferric nitrate solutions in the presence of coated silica dispersion ([Fe]/[Si] ≤ 1/3) was unstable when exposed to solar radiation and produced NO2 while the solution gradually solidified with expansion. Photo-sensitivity of Fe(NO3)3 in the presence of coated silica was further confirmed during the “Pendant Drop” tests as described previously. The molar ratio of the catalyst to support was [Fe]/[Si] = 1/4 or 1/3. Under solar radiation, the precursor fluid appeared to bubble and flakes of mixed silica and iron oxides raised over the liquid, similar to the foam extraction process. In the meantime, the liquid became highly viscous.
In order to replicate these experiments, an agricultural plant growth cabinet which simulates solar radiation and atmospheric conditions (such as temperature and humidity) was used for the model solar irradiation. The growth cabinet operated continuously and in order to prevent the rapid evaporation of water from the solution, the relative humidity was kept at 50% while the temperature was constant at 25 °C. We used two types of dishes to contain the catalyst/support precursor fluid.
Method 1: Round bottom 9 cm diameter watch glasses to which was added 5 mL of the catalyst/support precursor fluid.
Method 2: 50 mL capacity glass beakers to which was added 10 mL catalyst/support precursor fluid.
These fluids were place on the sample tray of the agricultural growth cabinet and the solar simulant radiation was started. The radiation level of the growth cabinet was set at the maximum, giving a radiation dose at LUX = 82,000 lx. Radiation was continued for up to 120 h continuously.
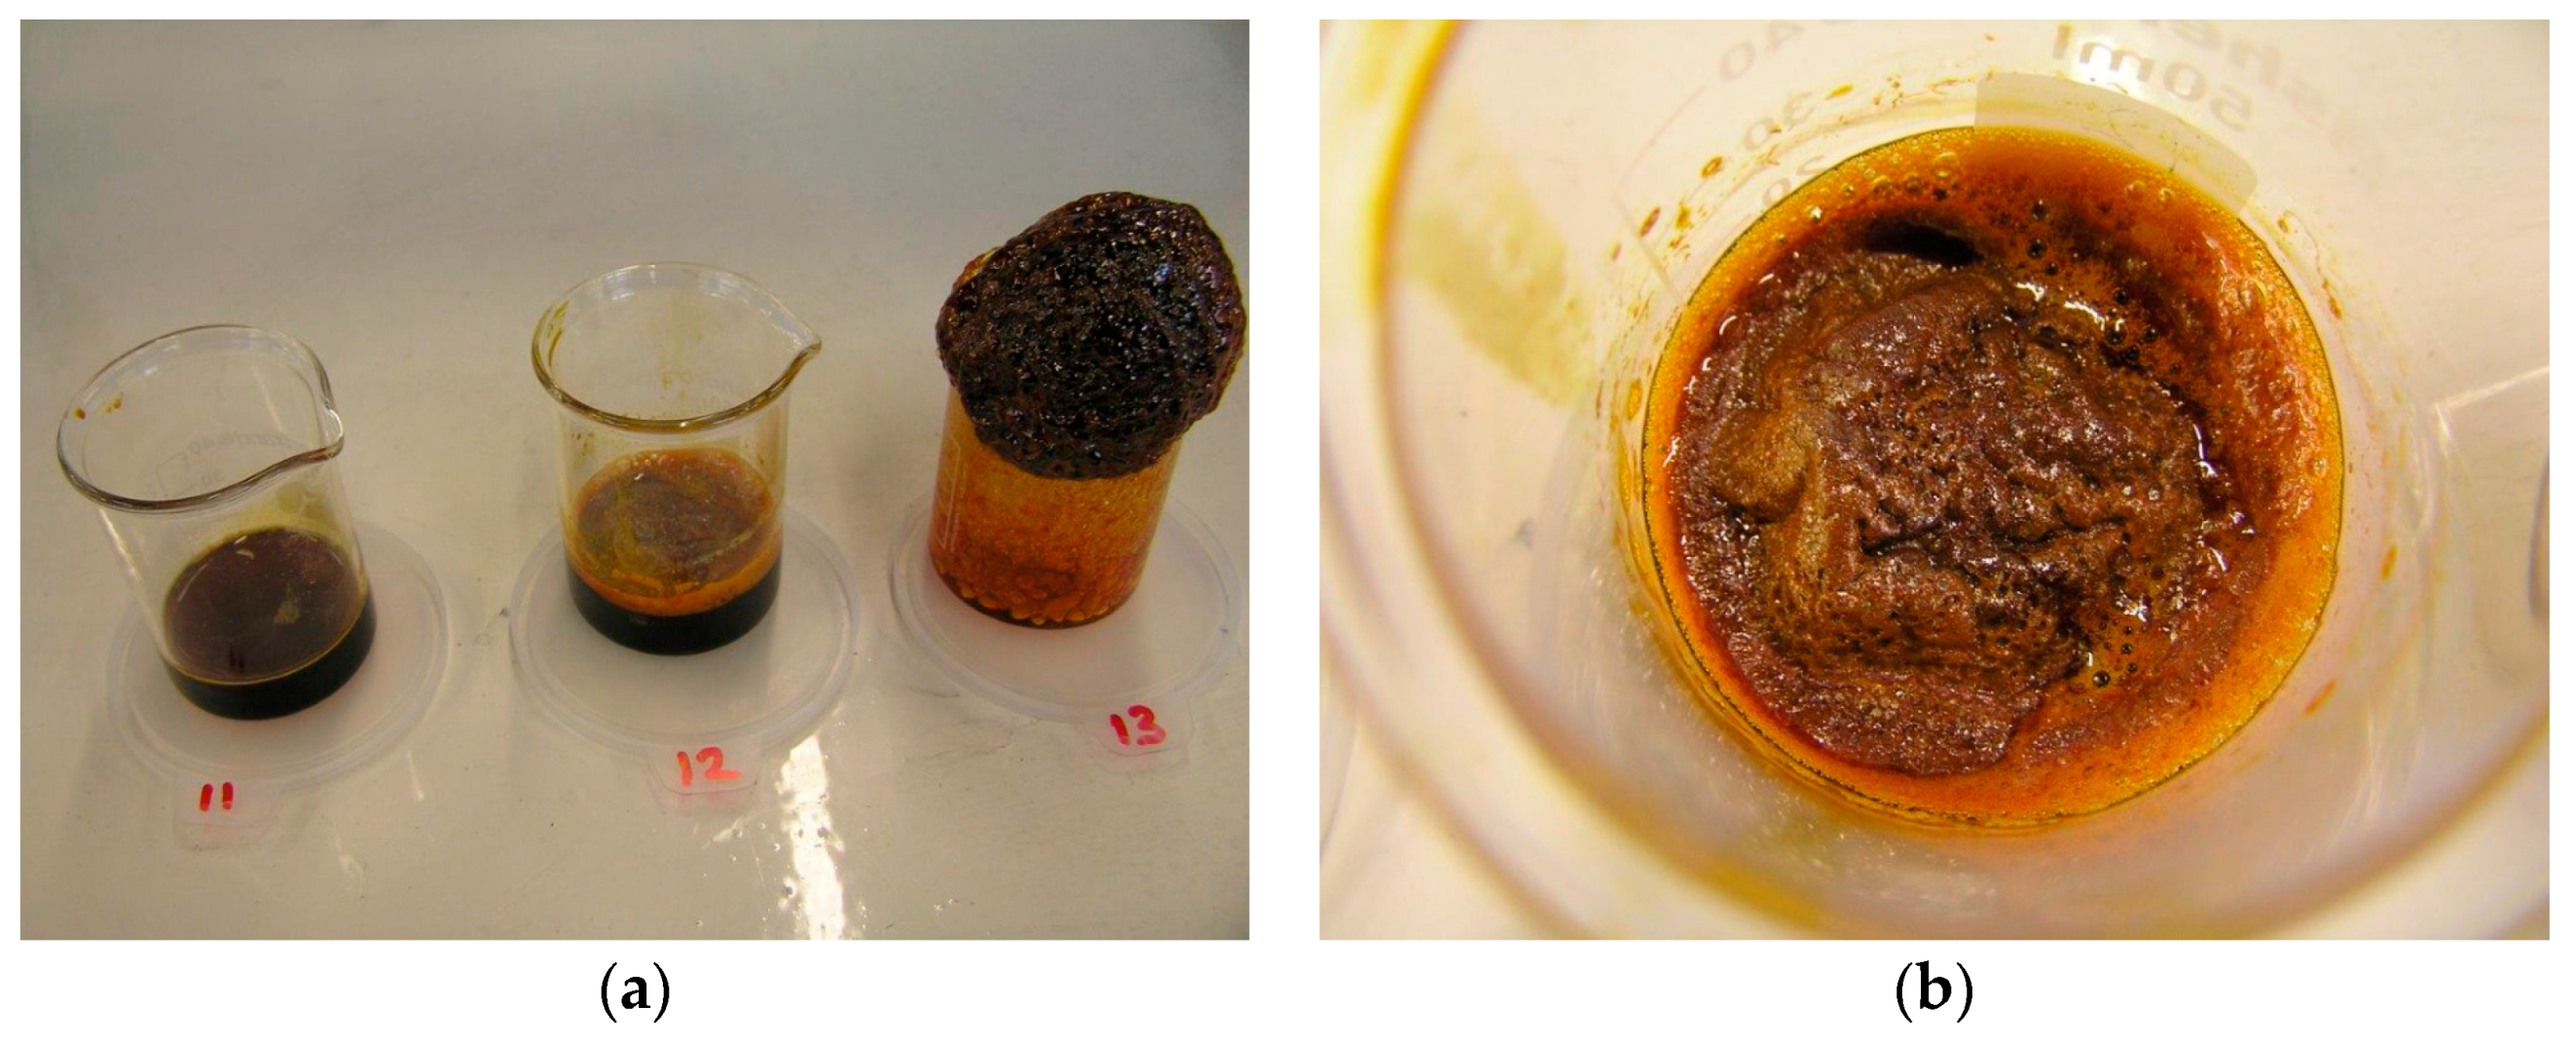
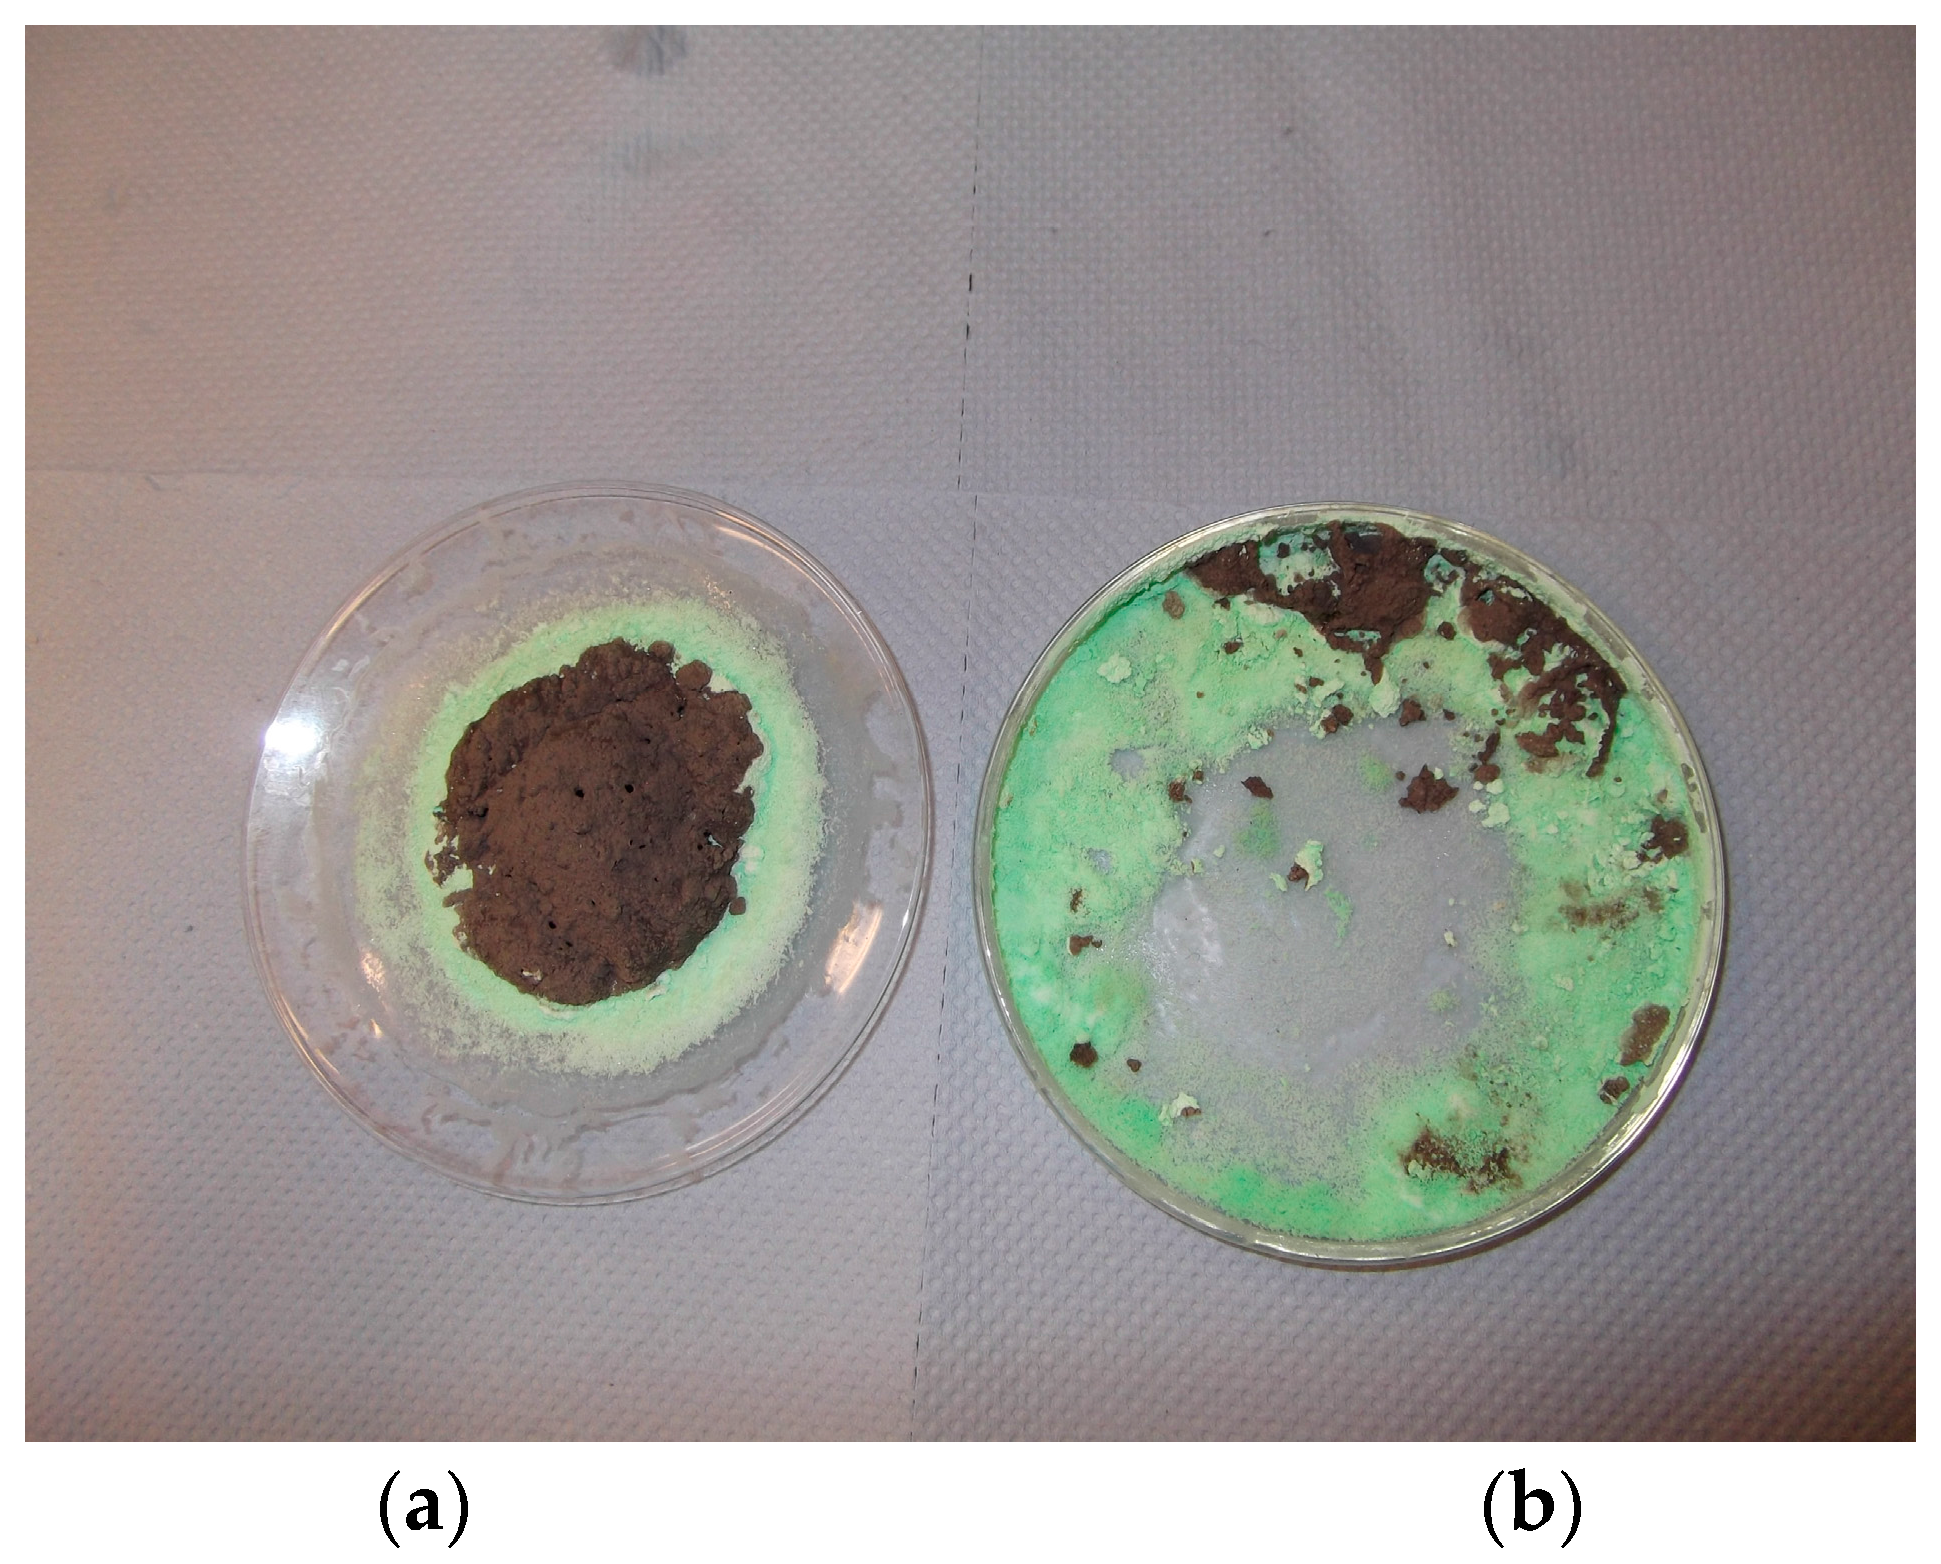
It was found that when the round bottom watch glasses were used, a dense but porous mixed oxide was obtained. However, when Fe(NO
3)
3 with silica dispersion was used by itself in the glass beaker, iron oxide flakes started to form and travelled to the top of the beaker where they accumulated or fell over the side towards the end of the irradiation. These observations are illustrated in
Figure 11. As seen in
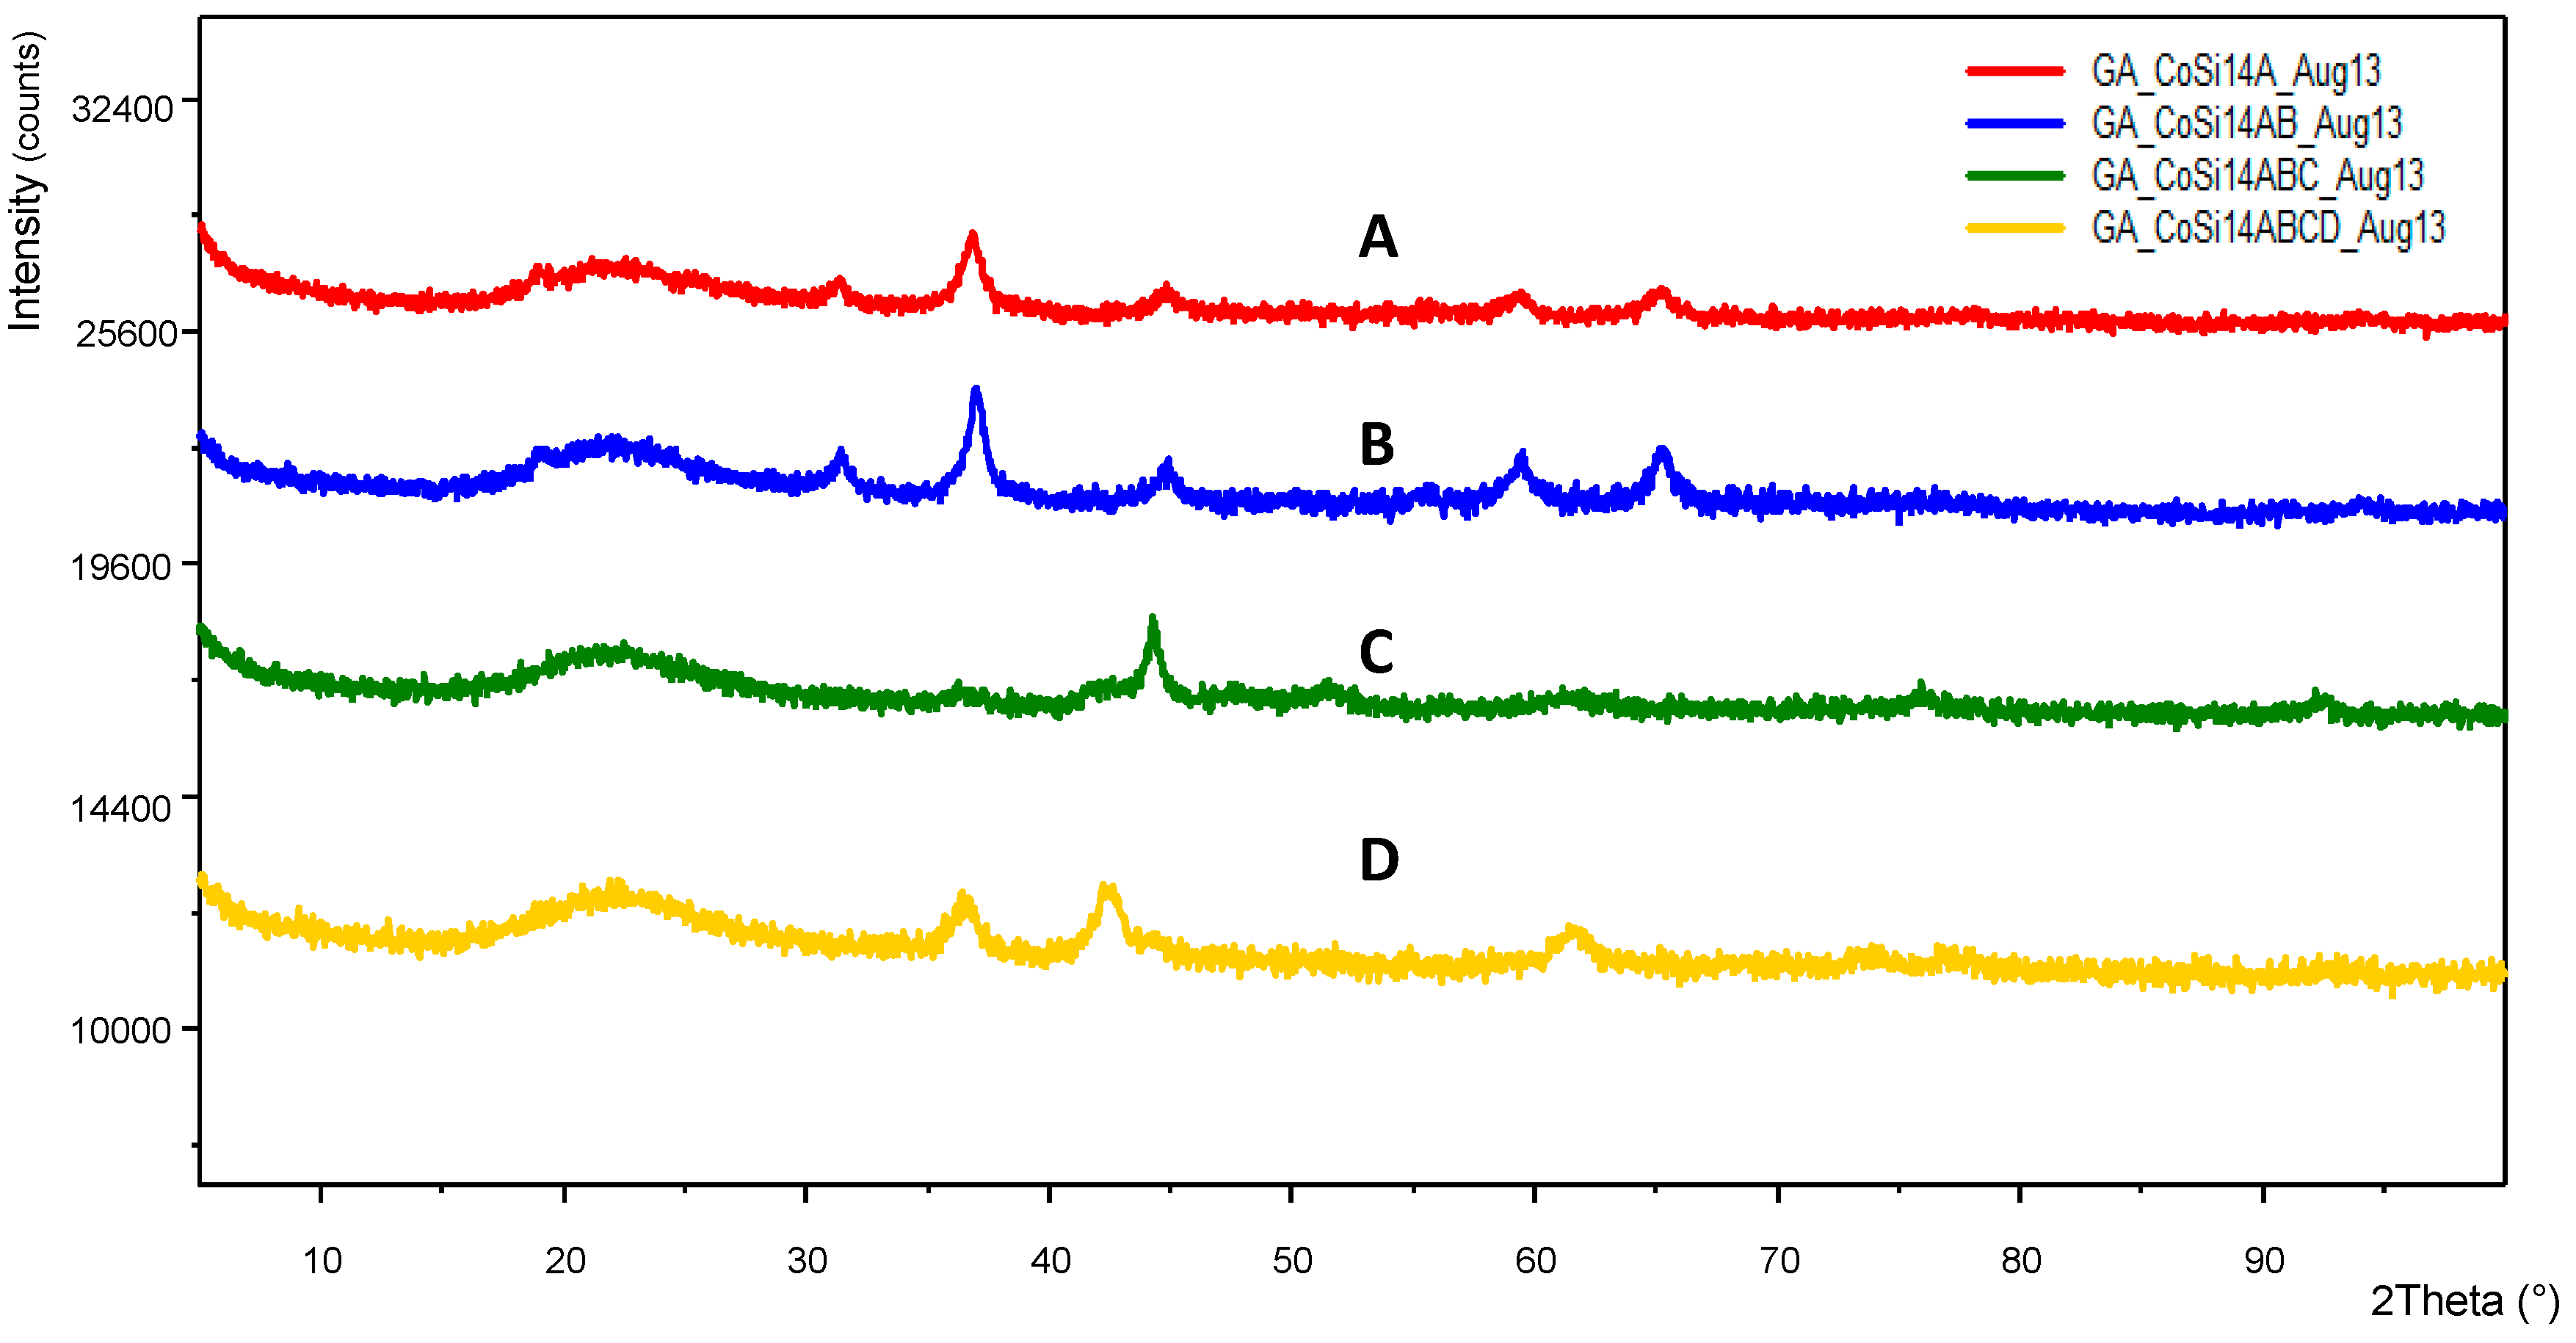
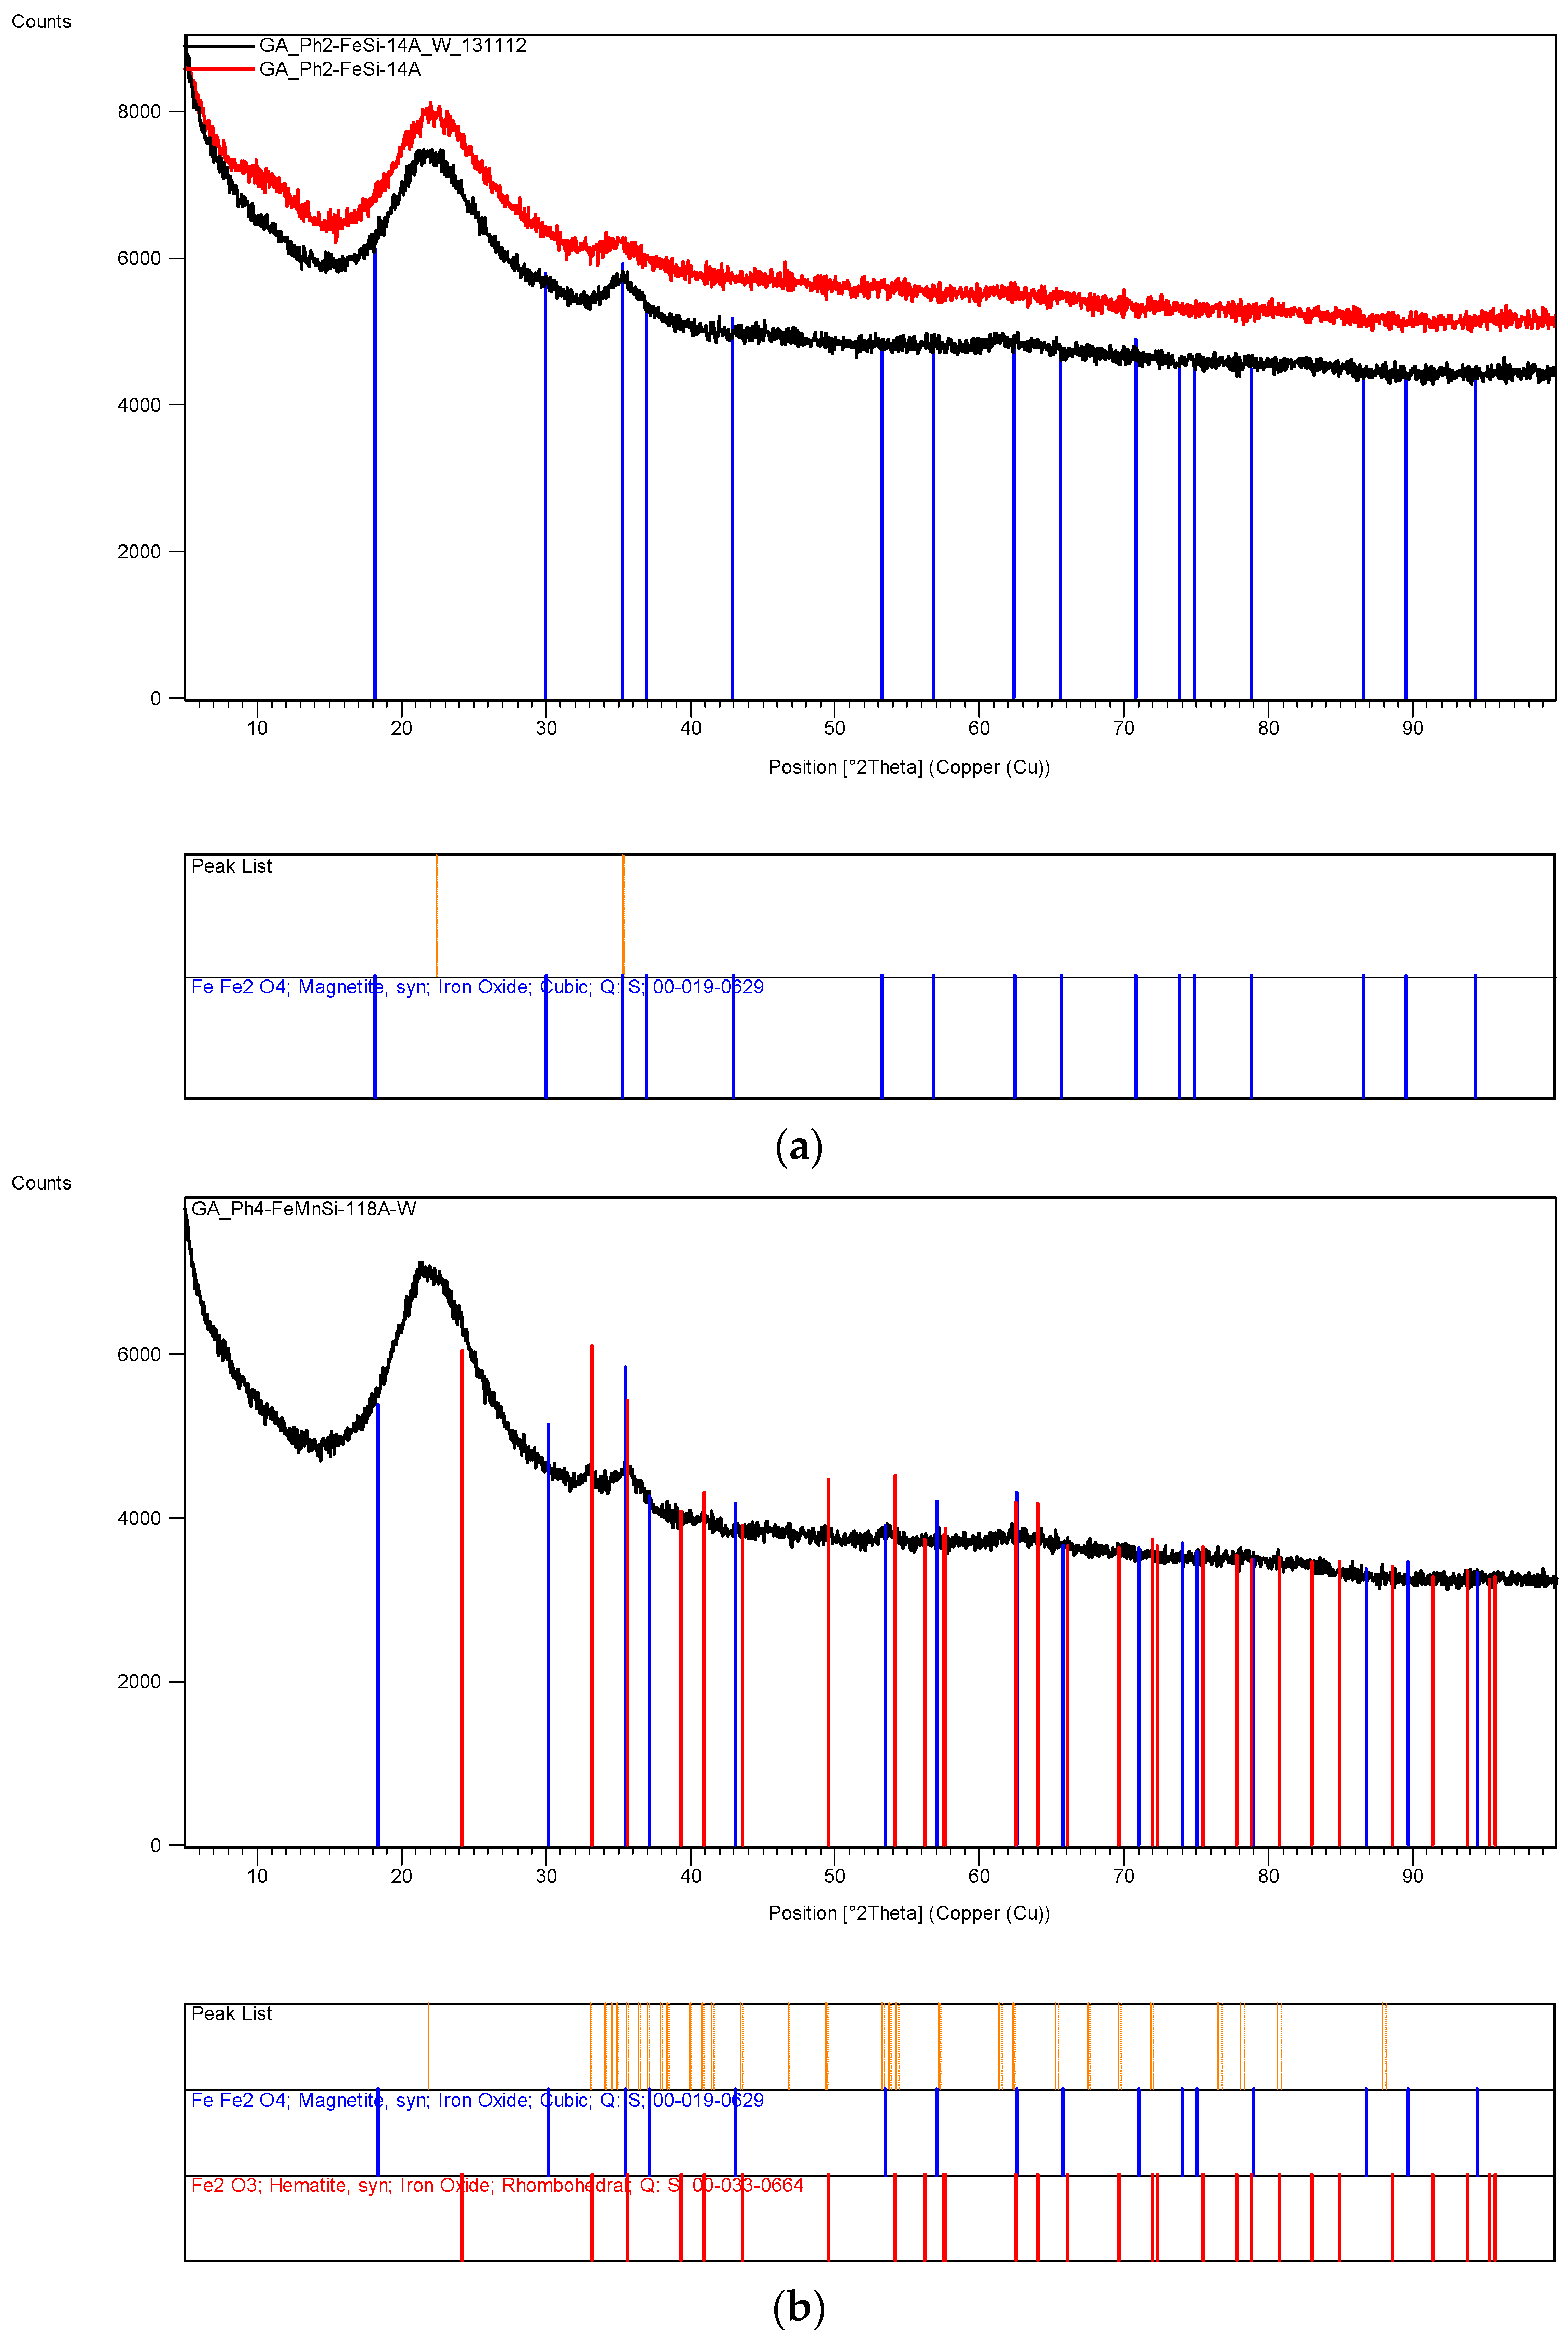
Figure 11a, when [Fe]/[Si] > 1/3 the decomposition of ferric nitrate does not take place. When [Fe]/[Si] ≤ 1/3 and a glass beaker was used, flakes of iron oxide traveled upward as flakes, while in a watch glass, formed flakes fell back into the solution.
Several other metal nitrates with coated silica ([M]/[Si] = 1/4) were also tested, including Al, Mg, Ca, Co, Ni, Zn and Mn. None of these metal nitrates decomposed even after 60 days of UV irradiation in the growth cabinet. However, Co solution ([Co]/[Si] = 1/4) appeared to form a gel on the surface which however disappeared after the removal of UV-radiation.
The XRD analysis of these decomposition samples ([Fe]/[Si] = 1/4 or 1/3) showed the formation of Fe3O4 (magnetite). They were then heat treated at 600 °C (1 h heating time and 1 h dwell time followed by 24 h of cooling). Samples which were not heat treated after UV-irradiation were washed in water to remove any unreacted nitrate, and then they were subjected to XRD, BET, SEM and TEM analysis.
3.13. Scanning Electron Microscopy (SEM) Studies
SEM and TEM studies were carried out in order to illustrate the structure of the catalyst and derive some conclusions about the possible mechanism of catalyst generation with a novel catalyst structure. However, this process required the examination of several hundreds of SEM and TEM images of the samples produced under different conditions with different catalysts. In the case of SEM studies, all the samples were sufficiently conductive so that coating with carbon or gold was not necessary thus allowing an accurate evaluation of the fine structure as well as EDX analysis when needed, provided that the magnification was below ca. 50,000. At magnifications above, the catalyst samples had to be coated with gold. It was also found that the TEM images of all the catalysts studied (namely Ni, Co, Fe) were similar, provided that they were produced through film formation from the catalyst/support precursor fluid containing the catalyst precursor nitrate and silane coated silica.
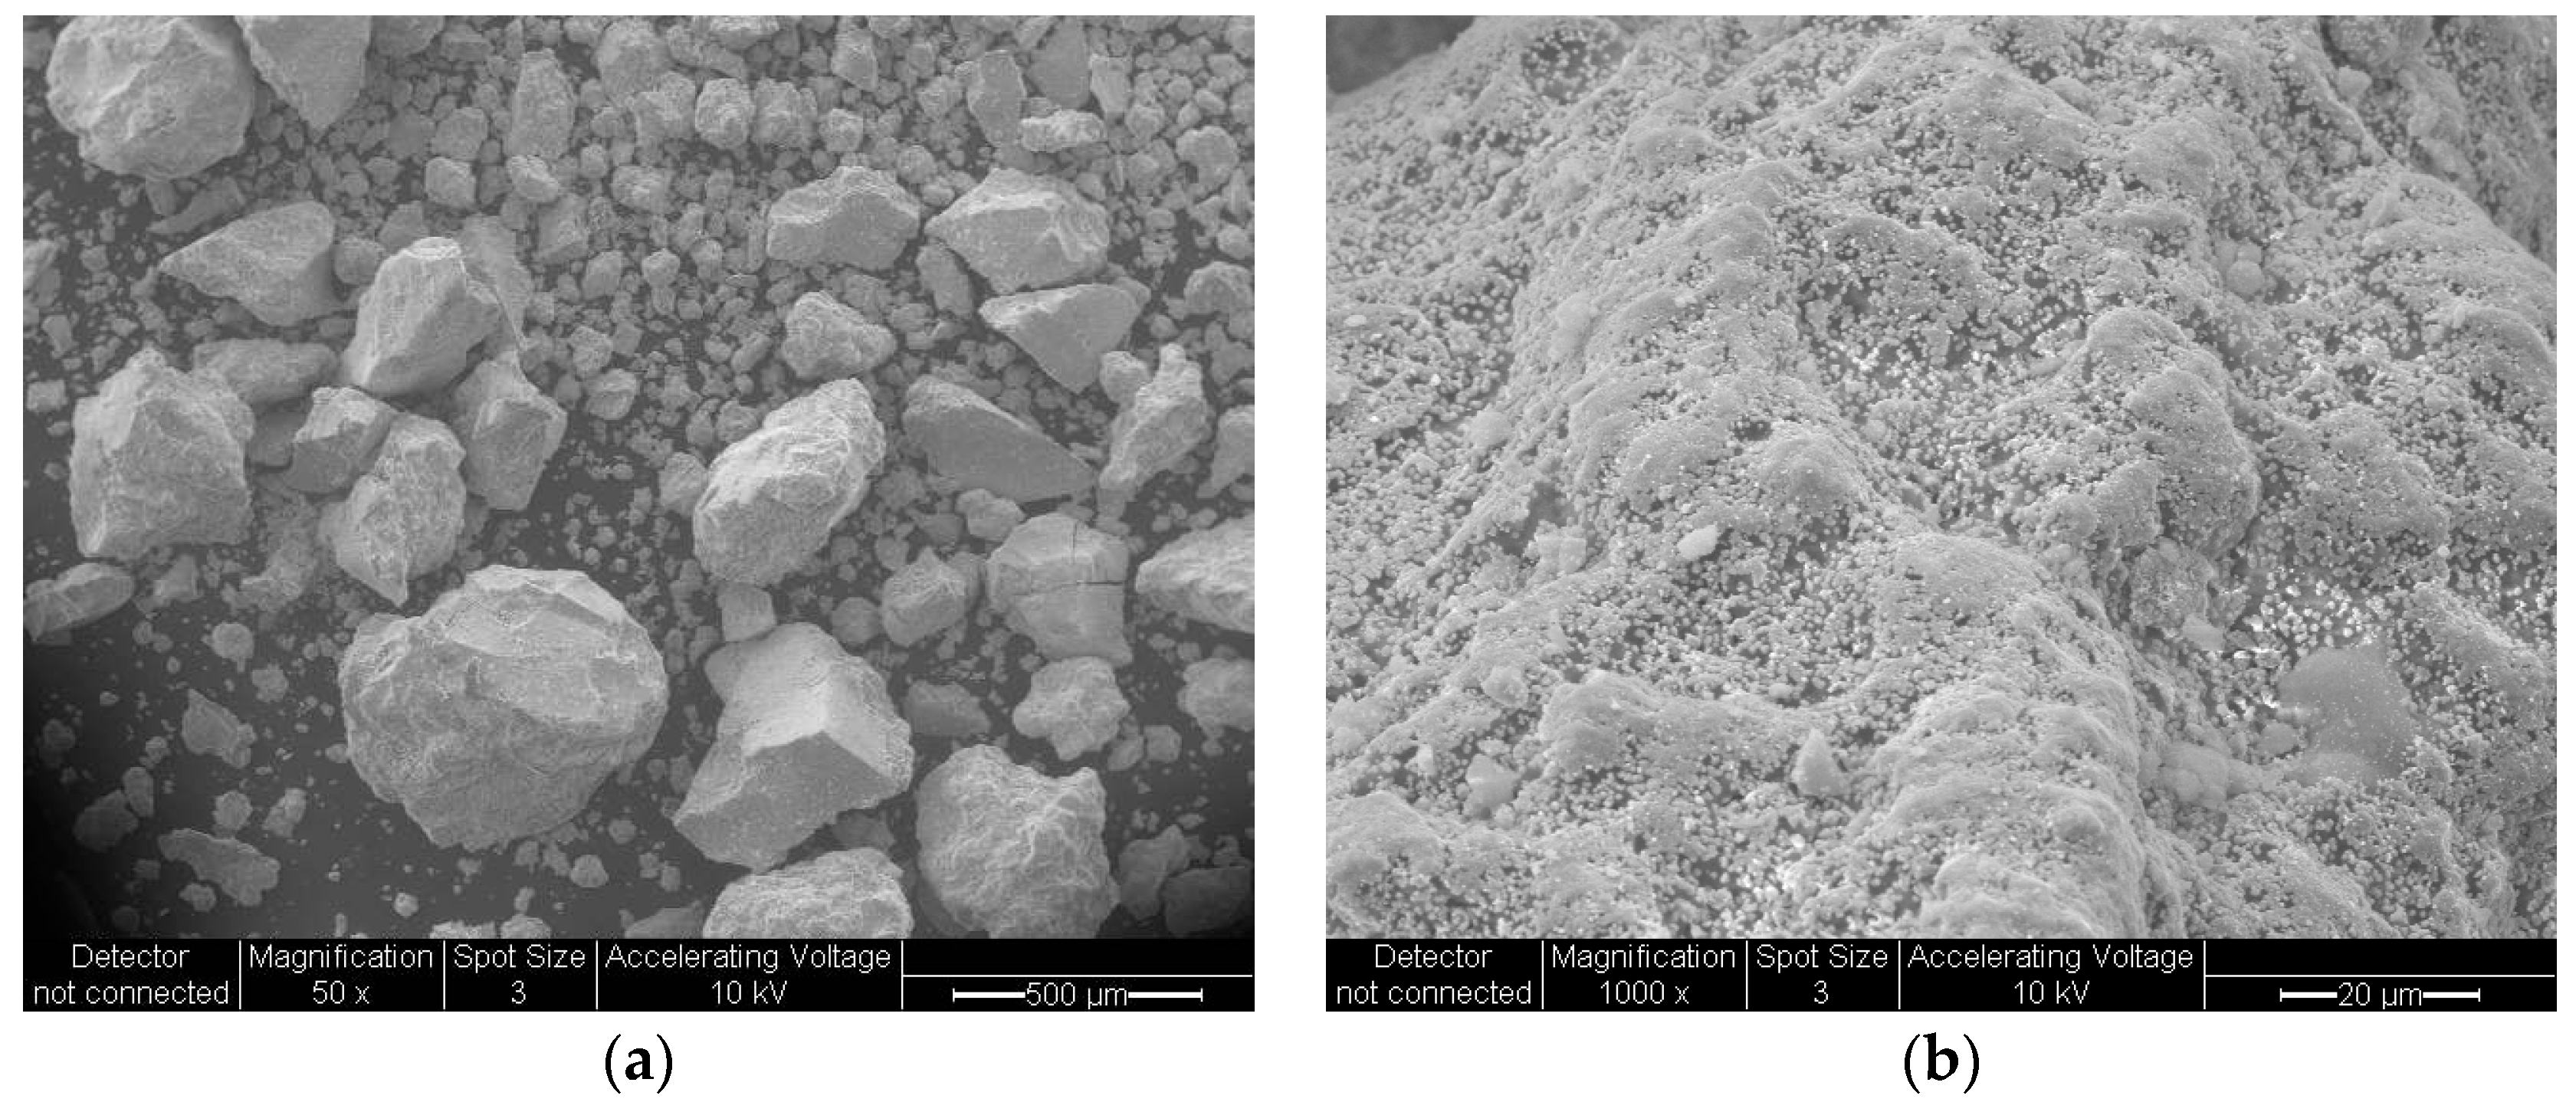
Figure 16 illustrates the SEM of a Co/Si = 1/5 (Haake Mixer, uncoated silica) catalyst when it was produced from the highly viscous uncoated silica dispersion using the Haake Mixer followed by calcination at 600 °C as described in
Section 3.4.1. These images show a highly dense structure. Although it had a very large surface area of 218 m
2/g; dominant cobalt oxide crystallite size (23.3 nm) was also very large as summarized in
Table 4.
When coated silica dispersion (Bindzil CC30) was used as the catalyst support precursor to obtain solid supported catalyst particles in which the Haake Mixer was the processing equipment (
Section 3.4), more porous overall structure was obtained as shown in
Figure 17. This SEM image is for Co/Si = 1/5 after it was heat treated at 600 °C using Method-C (
Section 3.8). The surface area of this sample was 182 m
2/g and the crystallite size was 22.4 nm.
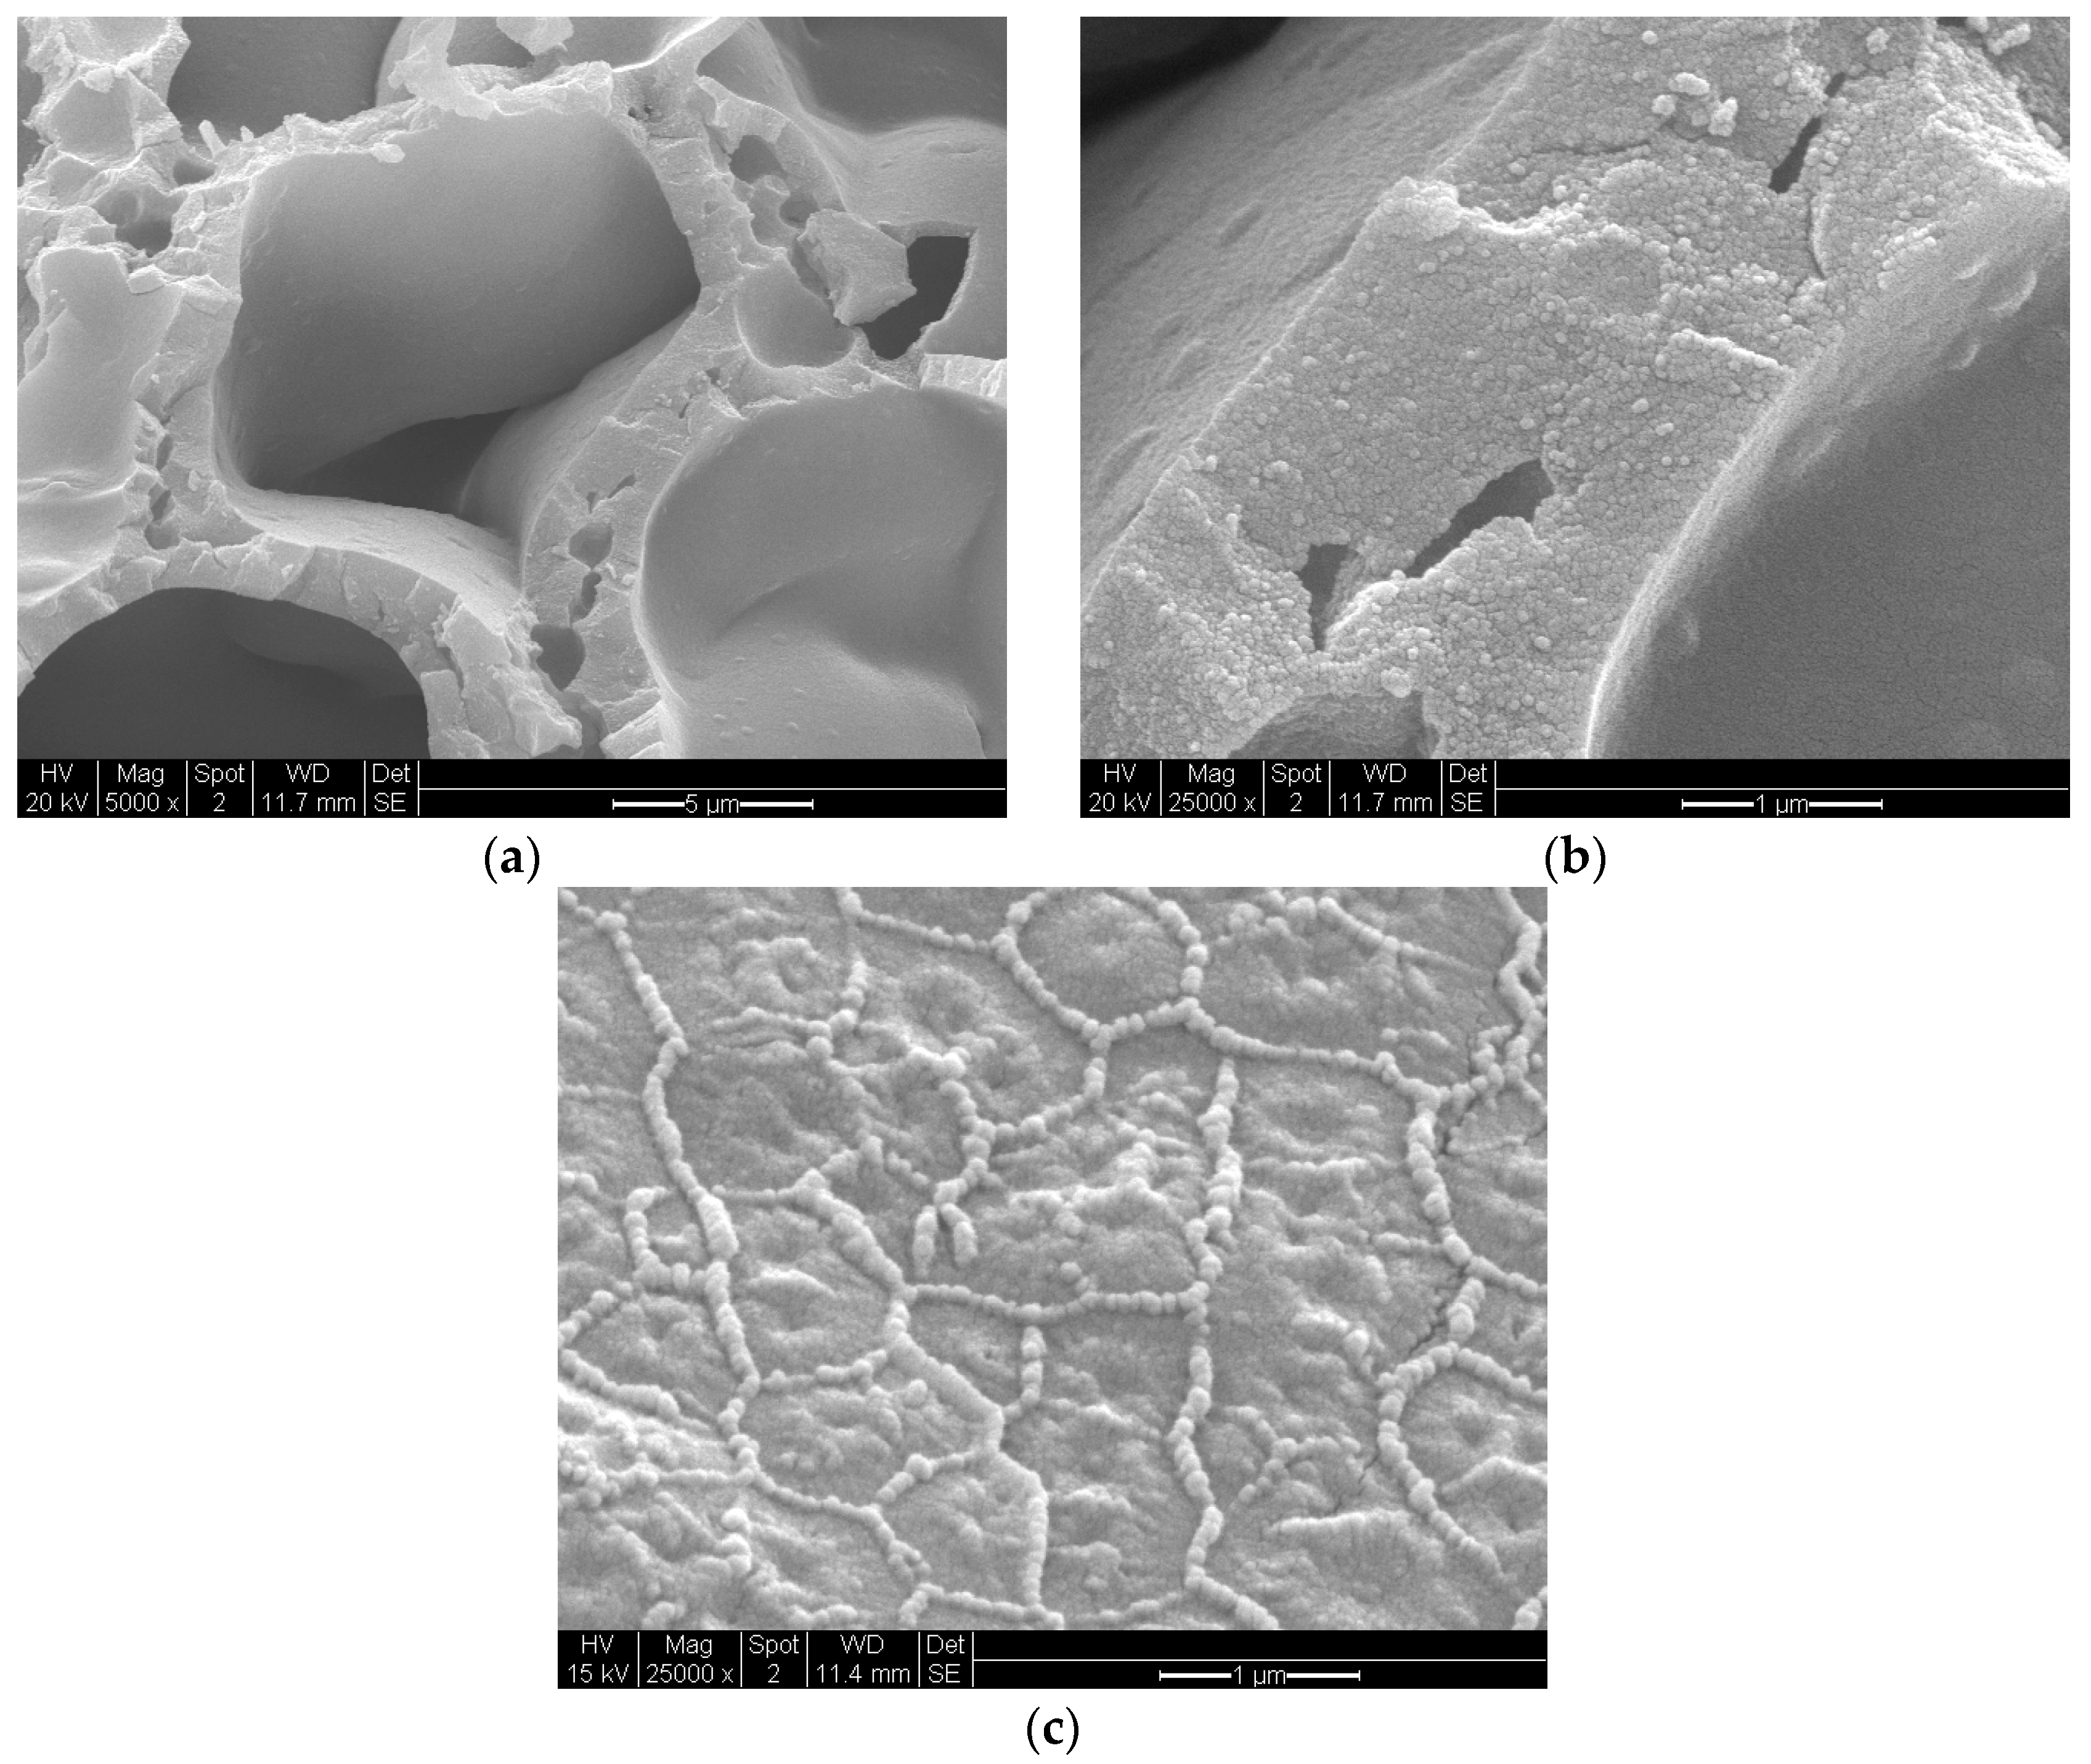
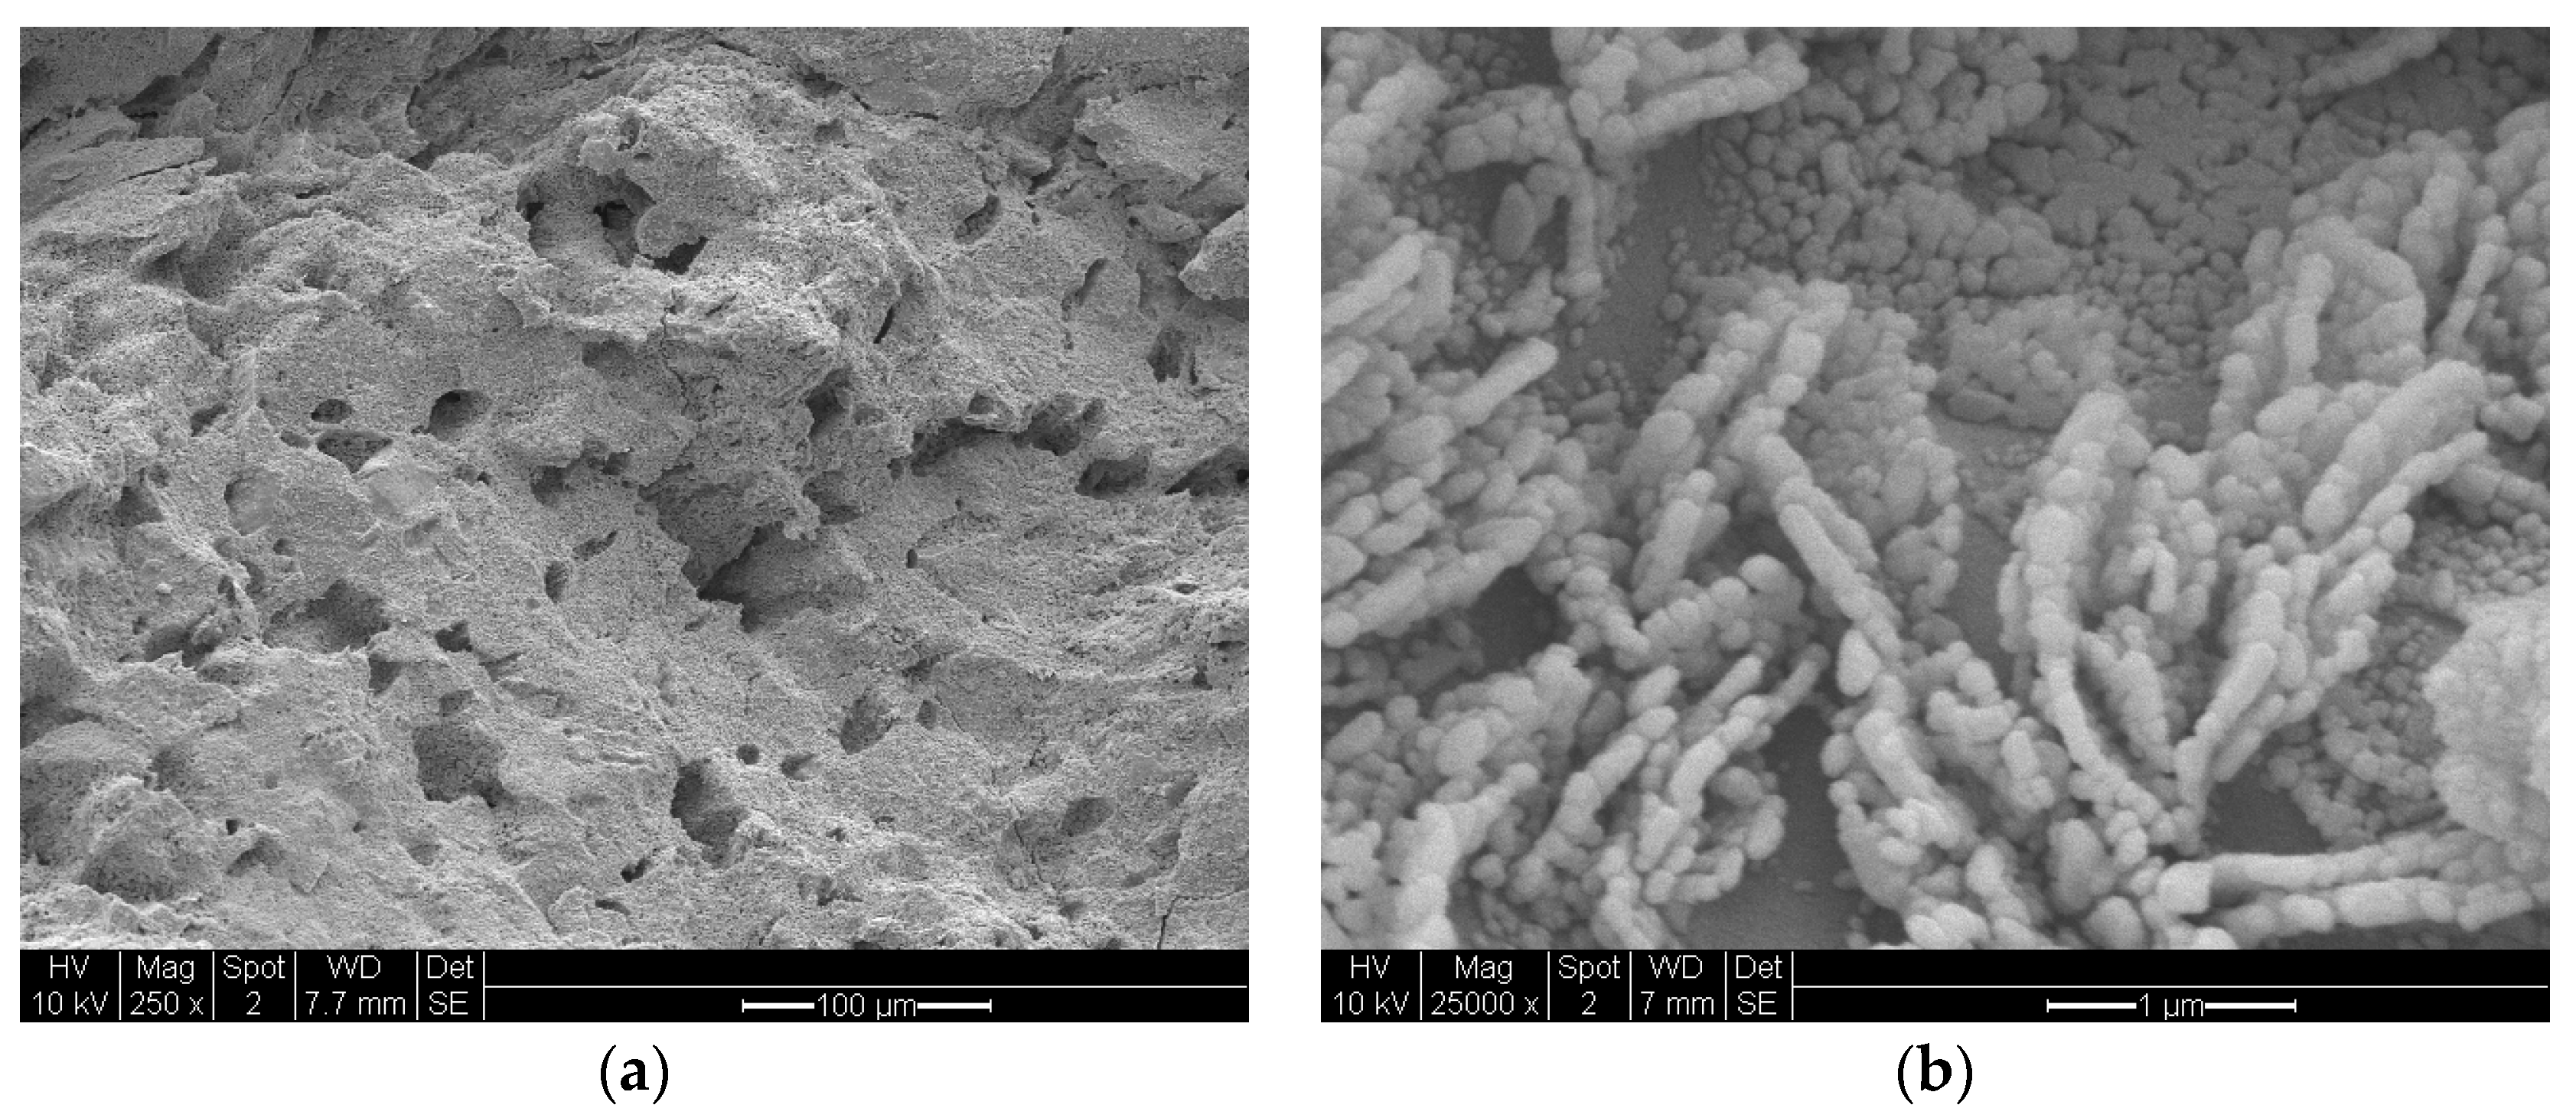
Figure 18 illustrates the highly porous structure of Co/Si = 1/4 Mw-AB catalyst which was obtained from the microwave irradiation of catalyst/support precursor fluid at 1 kW followed by heat treatment at 600 °C (Method-C,
Section 3.8).
Figure 18a shows the micro-porous structure while
Figure 18b illustrates the wall structure which indicates the presence of large surface pores and flower-like structures surrounded by boundary-lines. The flower-like patterns are further illustrated in
Figure 18c. It can be seen from
Table 1,
Table 2,
Table 3 and
Table 4, compared with Ni and Fe, the crystallite size of Co/Si is significantly large. This is partly because Co appears to prefer to be located at the precursor fluid/air interface by breaking through the silica surface. This results in “unconstrained” crystallite growth as discussed further in
Section 3.16.
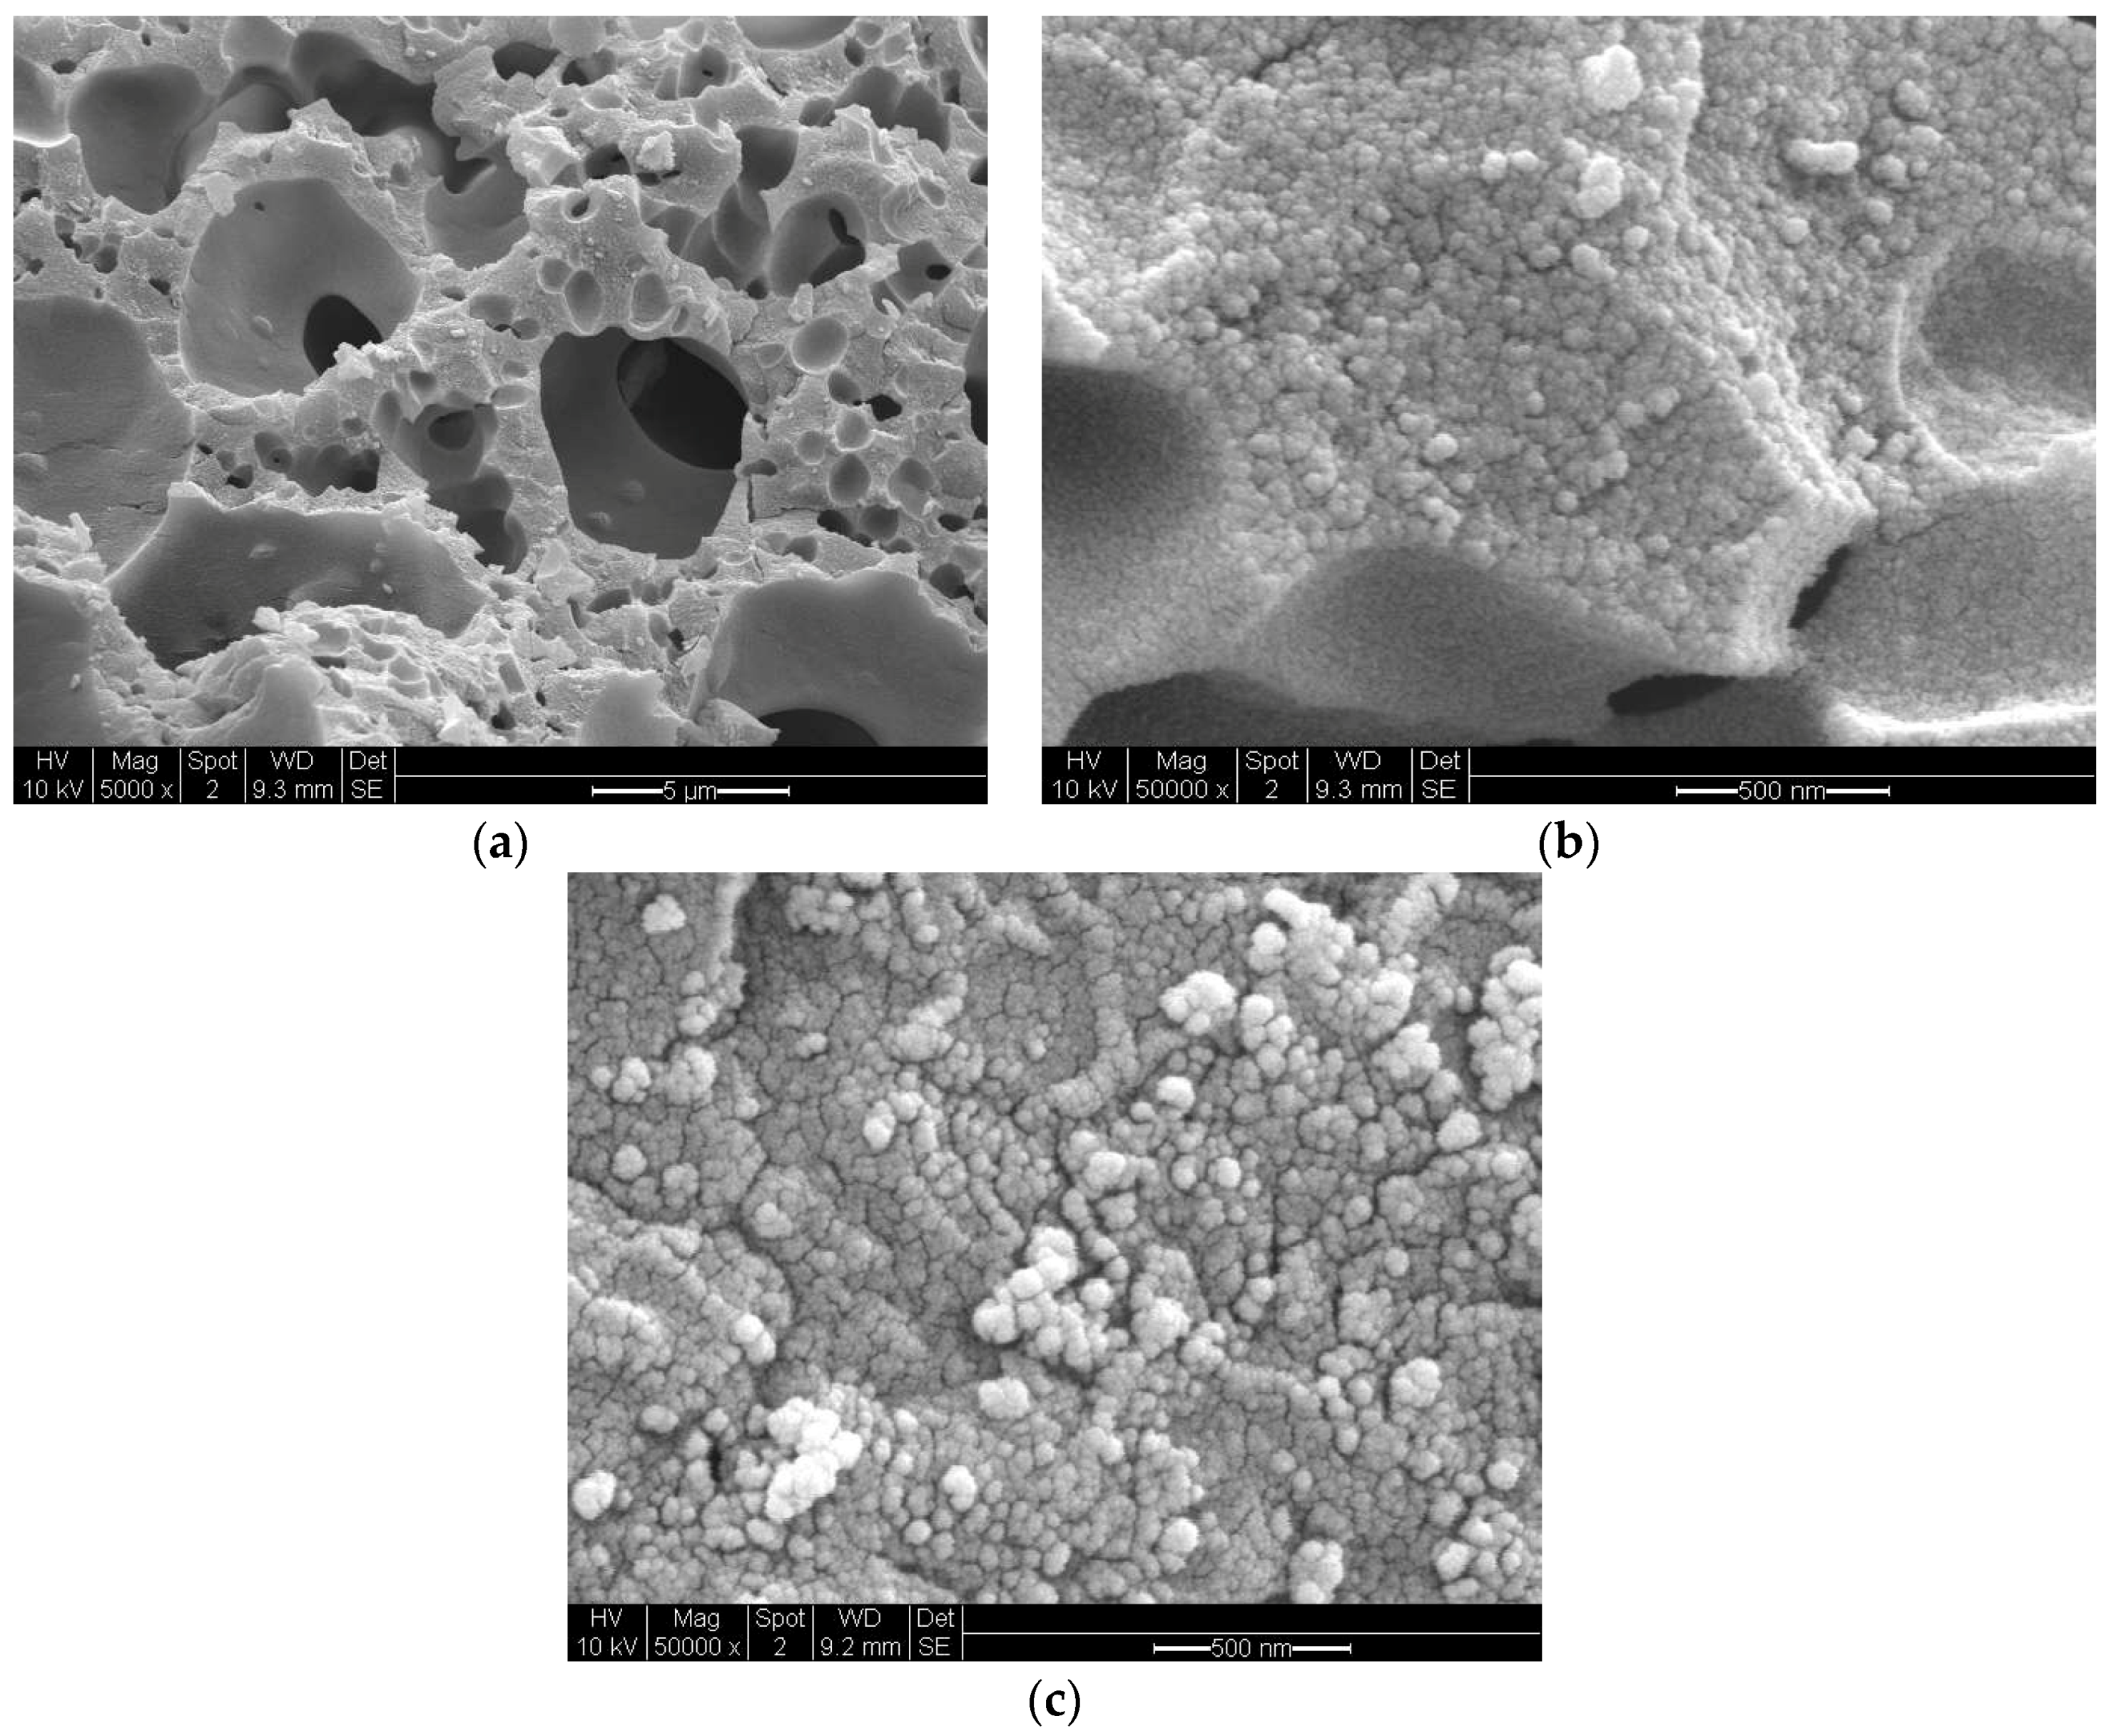
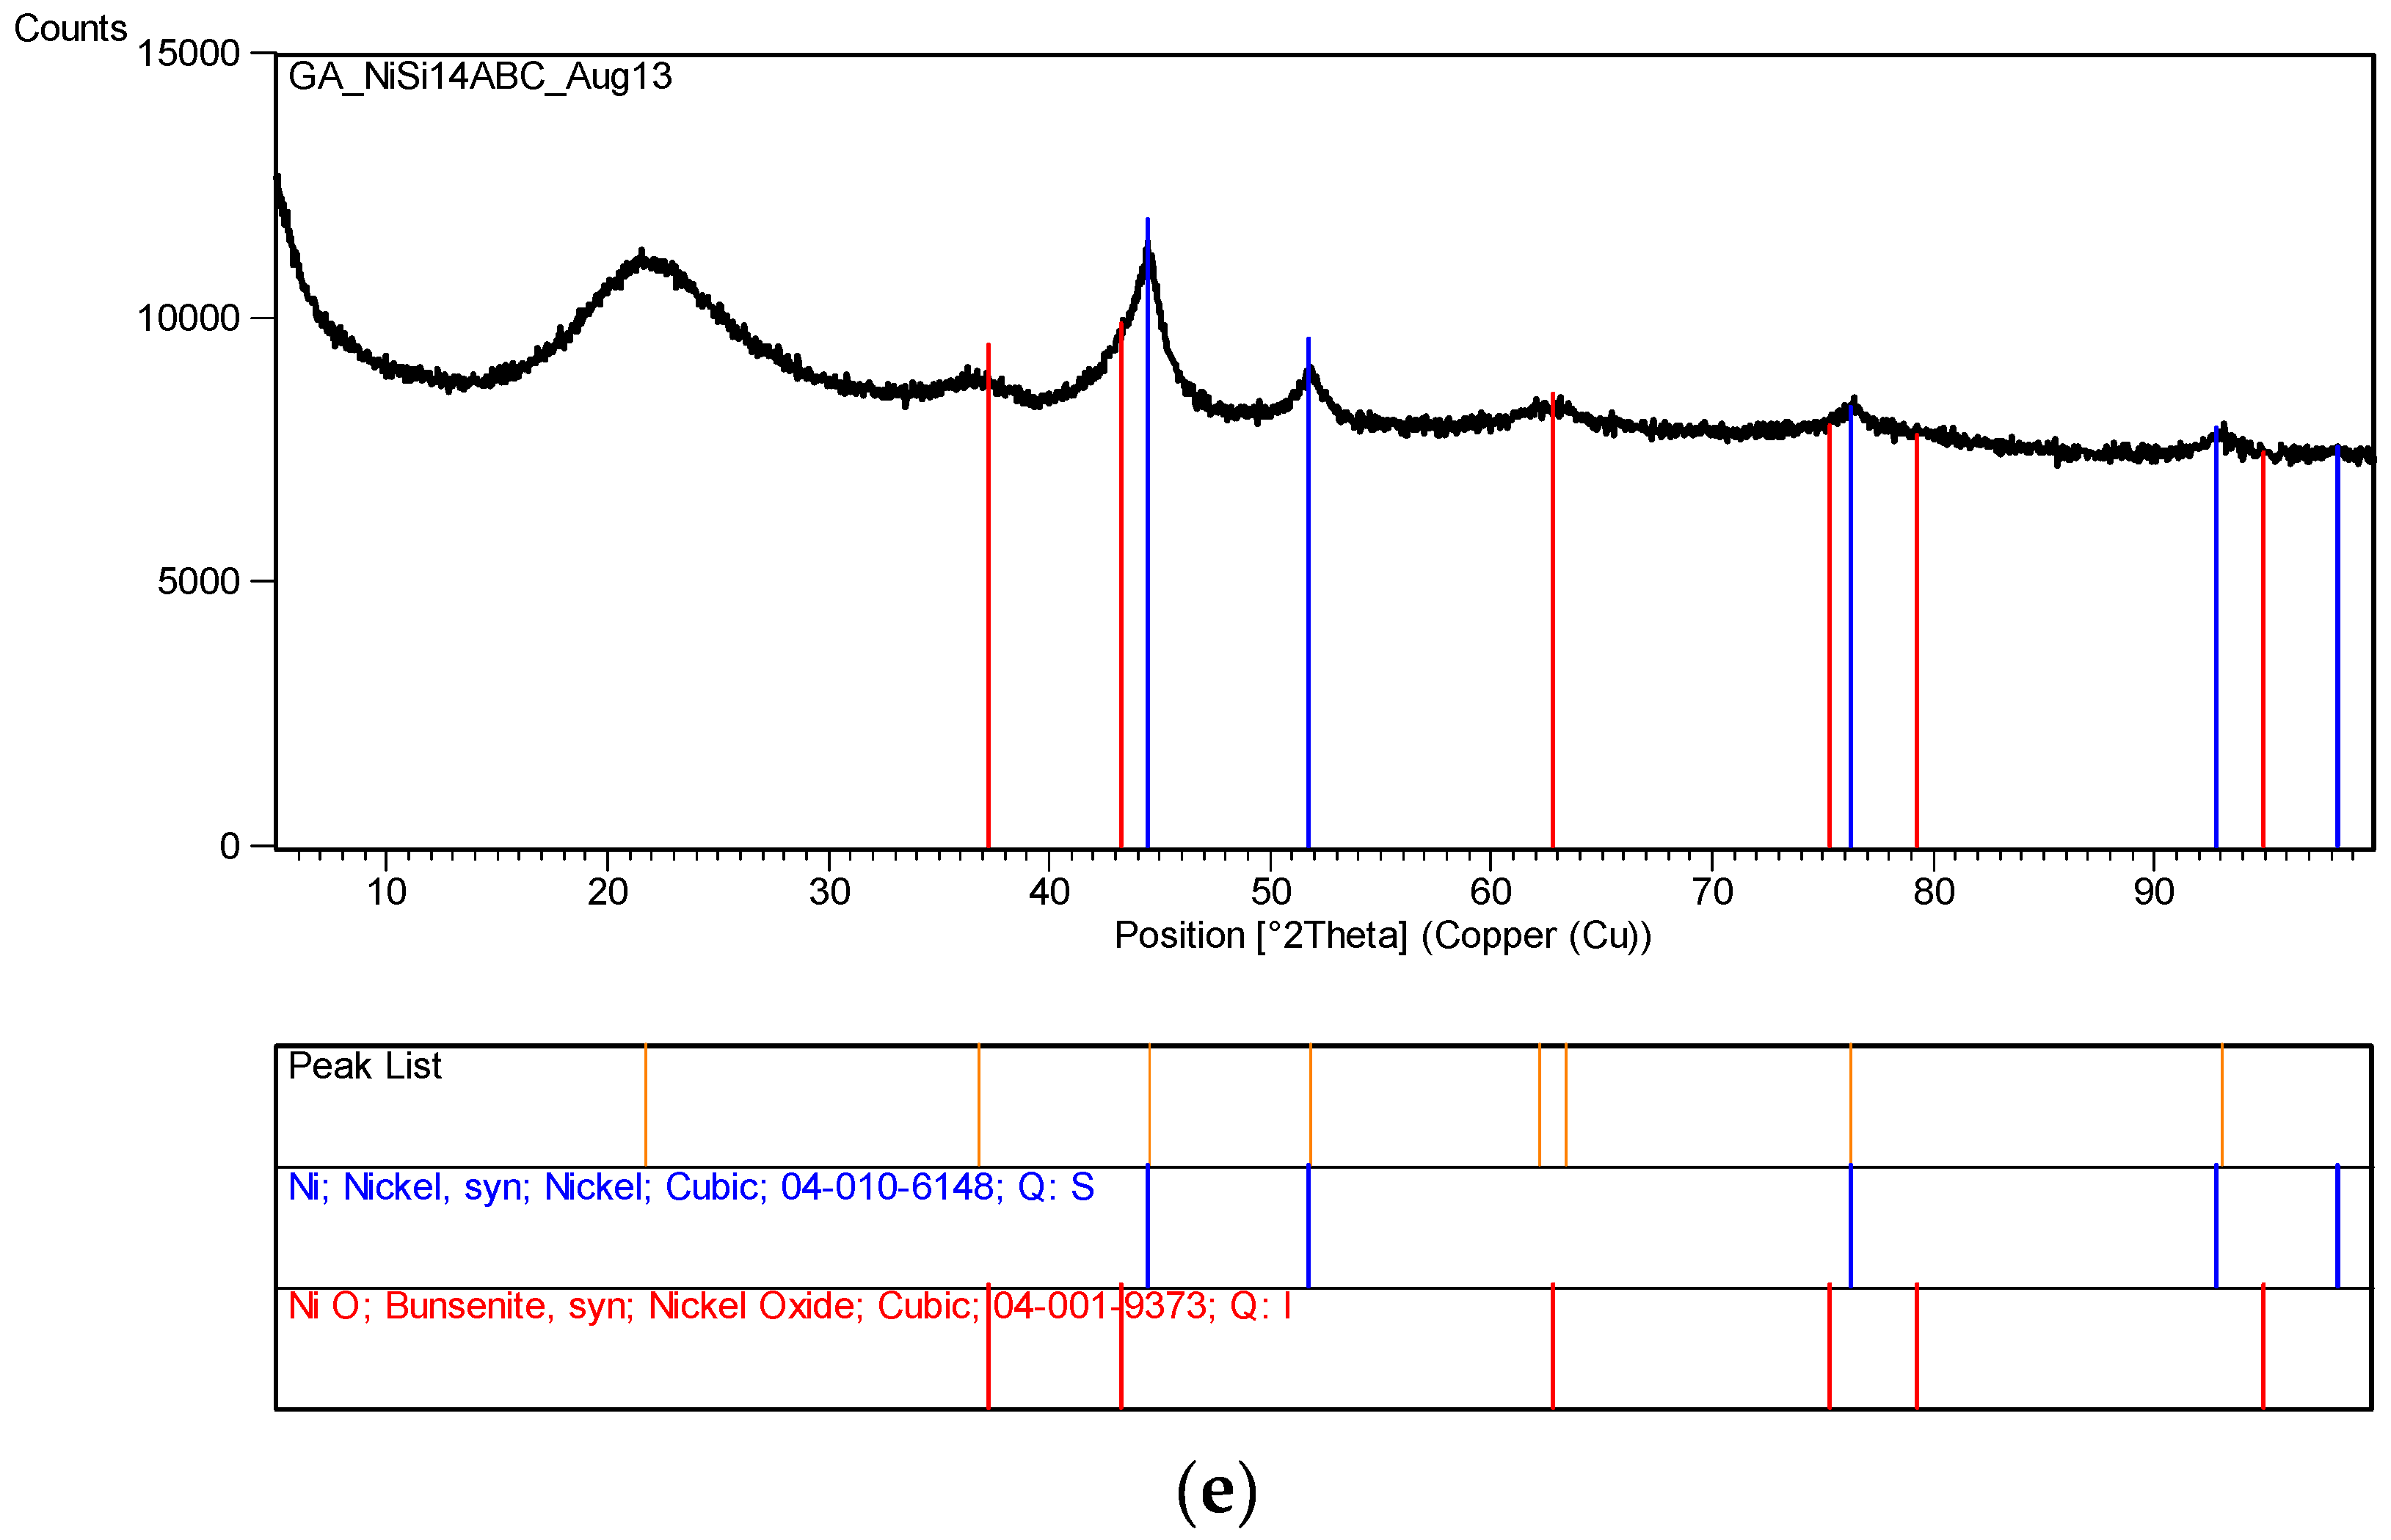
Figure 19 illustrates the porous structure of Ni/Si = 1/4 Mw-AB catalyst which was obtained from the microwave irradiation of catalyst/support precursor fluid at 1 kW followed by heat treatment at 600 °C (Method-C,
Section 3.8).
Figure 19a shows the micro-porous structure while
Figure 19b illustrates the wall structure. The surface of the catalyst walls (
i.e., air/fluid interface during processing) are also porous with significant reduction in surface pores compared with that obtained for Co/Si = 1/4Mw-AB. However, it is possible to obtain larger pores and larger wall pores by using chemical blowing agents incorporated in to the supported catalyst fluid [
8].
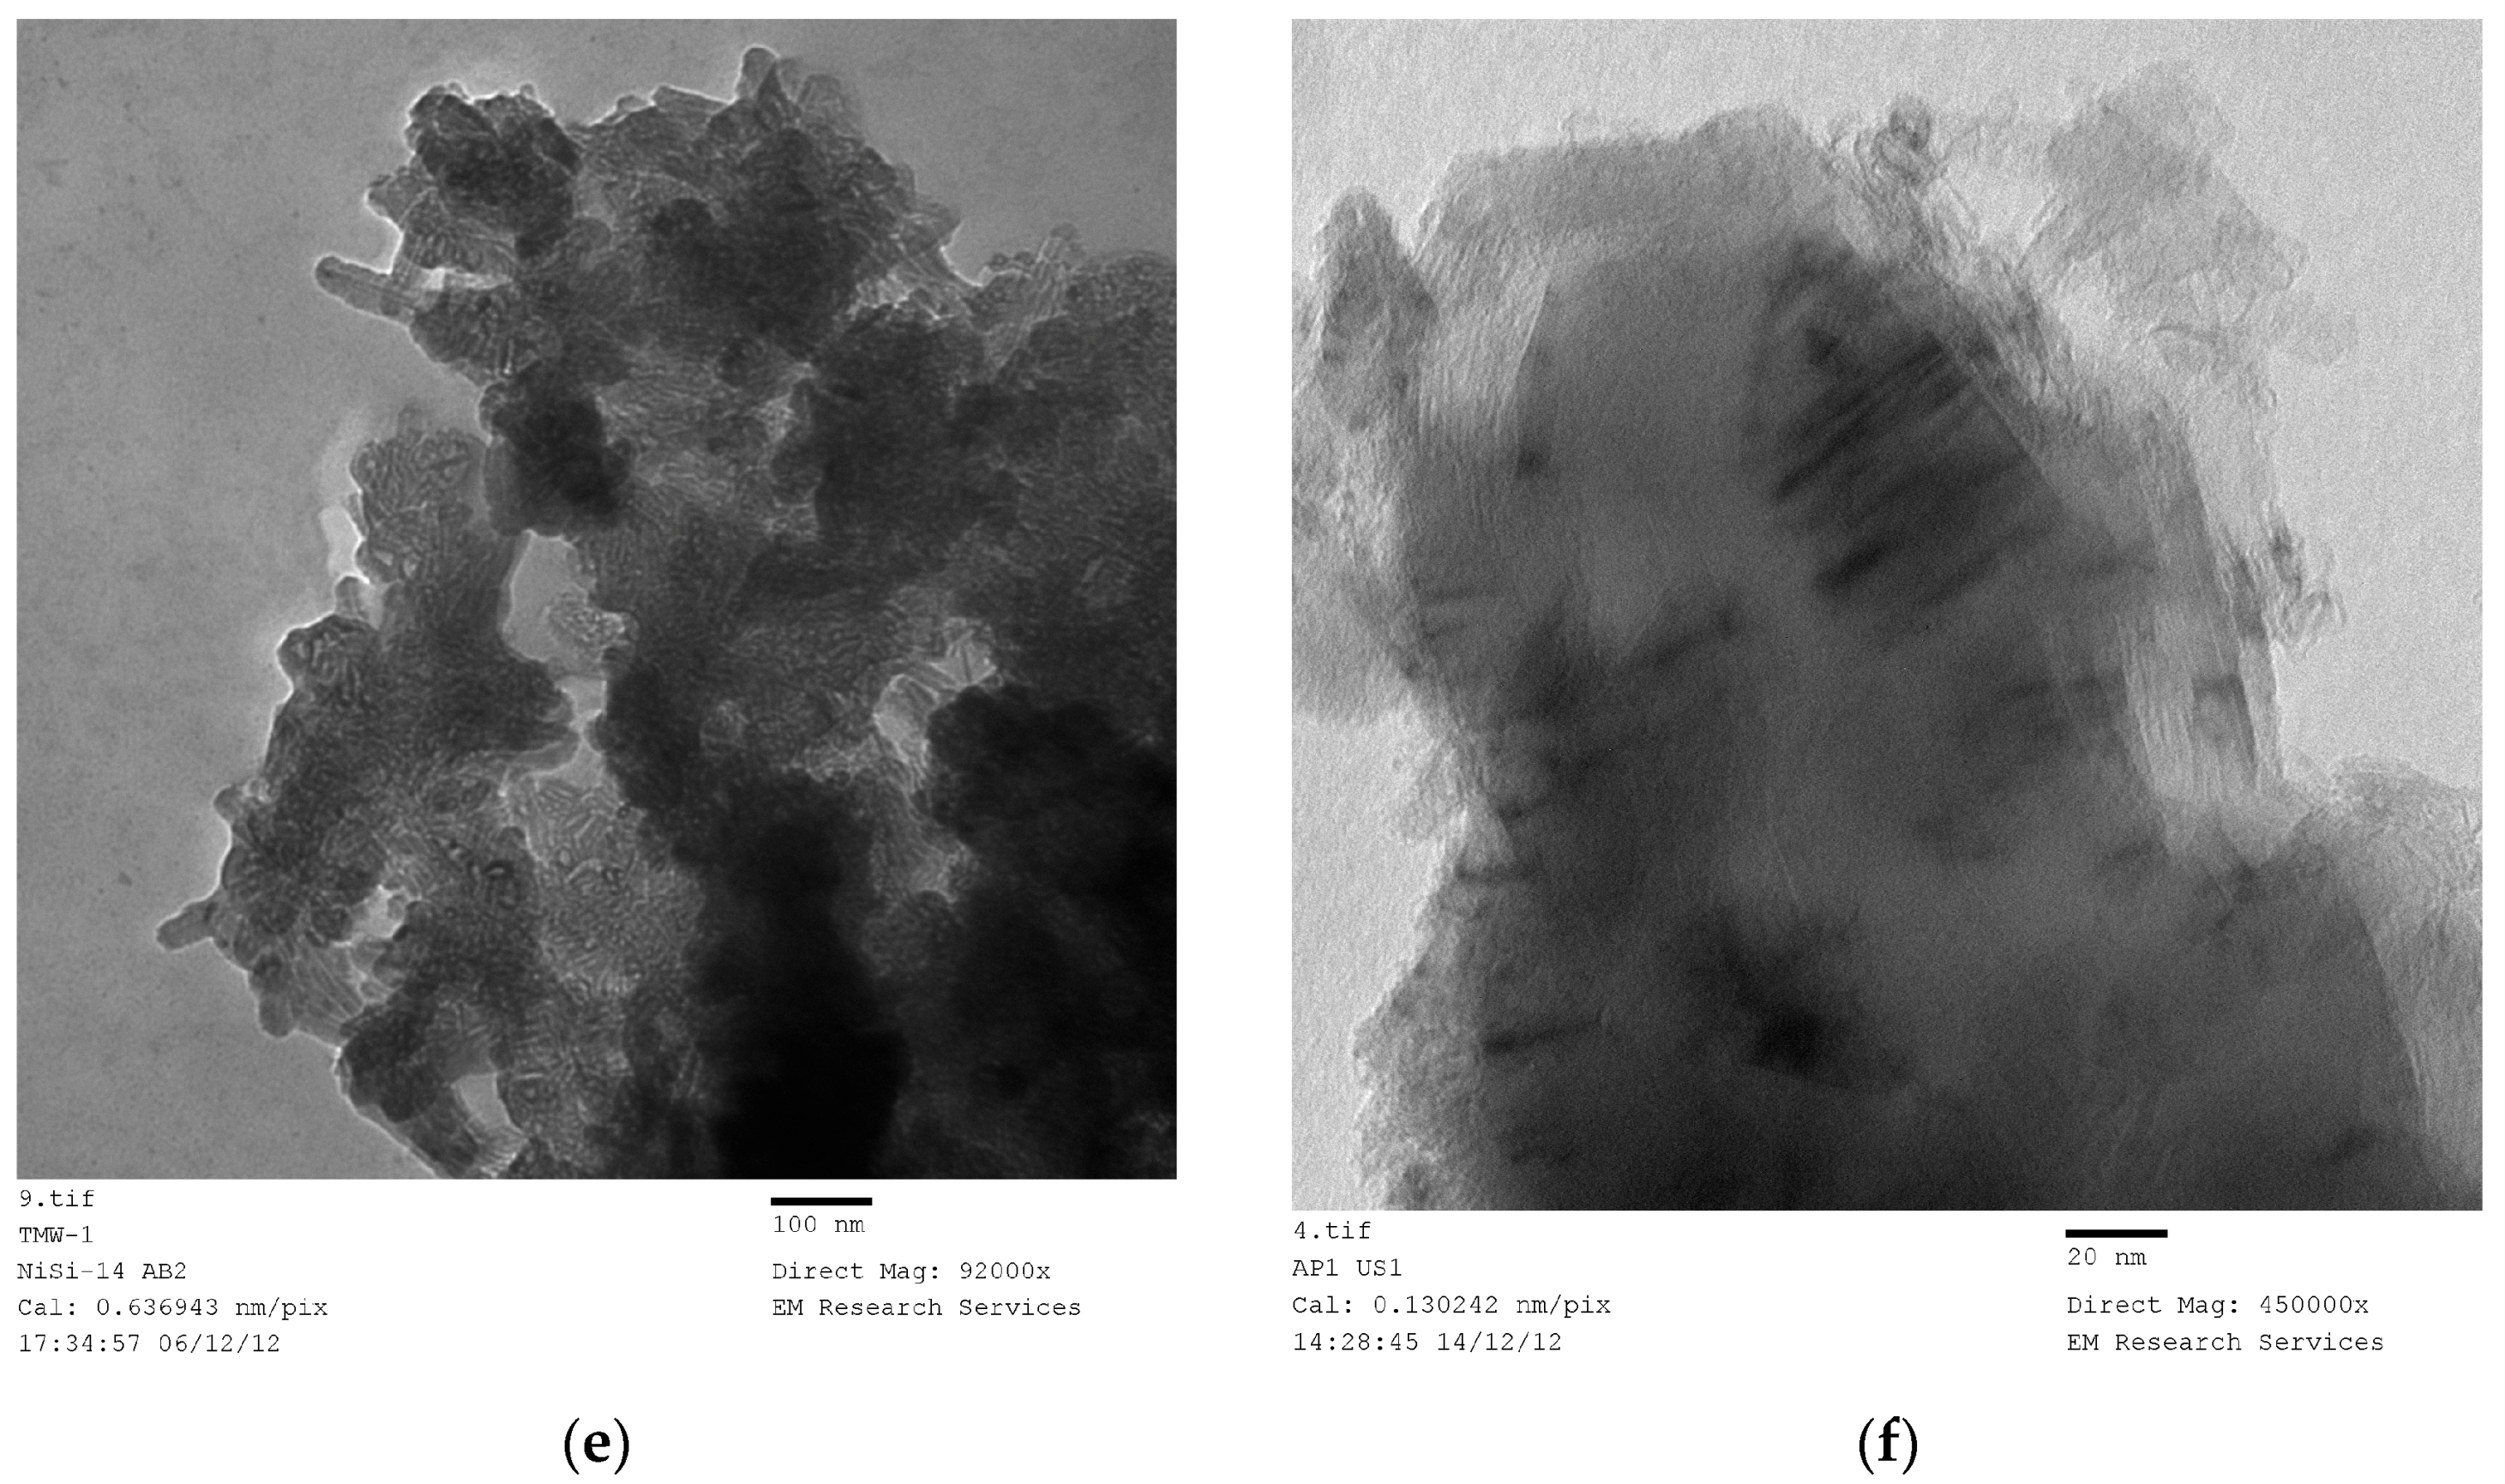
Figure 20 illustrates the structure of a Fe/Si = 1/4 Ph (washed) sample obtained through UV-irradiation of the precursor fluid for 120 h followed by washing in water.
Figure 20a is the overall structure and
Figure 20b is the wall structure. Although the structure of the Fe/Si = 1/4 Ph is highly porous, the connectivity is through meso-pores (
Figure 20a). The main structure is in the form of strands.
3.14. Transmission Electron Microscopy (TEM) Studies
SEM studies yield accurate images of the overall catalyst structure but they do not reveal anything about the catalyst shape, catalyst size and its distribution or any possible interactions with the catalyst support. Therefore, we have examined TEM images in order to evaluate these characteristics and to understand how they were formed under different processing conditions for different catalyst compositions. It was found that there is no single nano-structure associated with these catalysts but there are some common structures shared by all the catalysts studied. The heterogeneity of nano-scale structure is not surprising since small dynamic changes or driving forces at nano-scale can cause extensive spatial and time variations in the catalyst structure. Furthermore, recent advances in high resolution and sensitivity spatiotemporal spectroscopy also reveal that the heterogeneous catalysts behave almost like living-objects [
48]. However, the dominant nano-structures are dependent on the processing conditions as well as the catalyst composition. The sizes of the nano-structures are also dependent on the catalyst composition and catalyst preparation history.
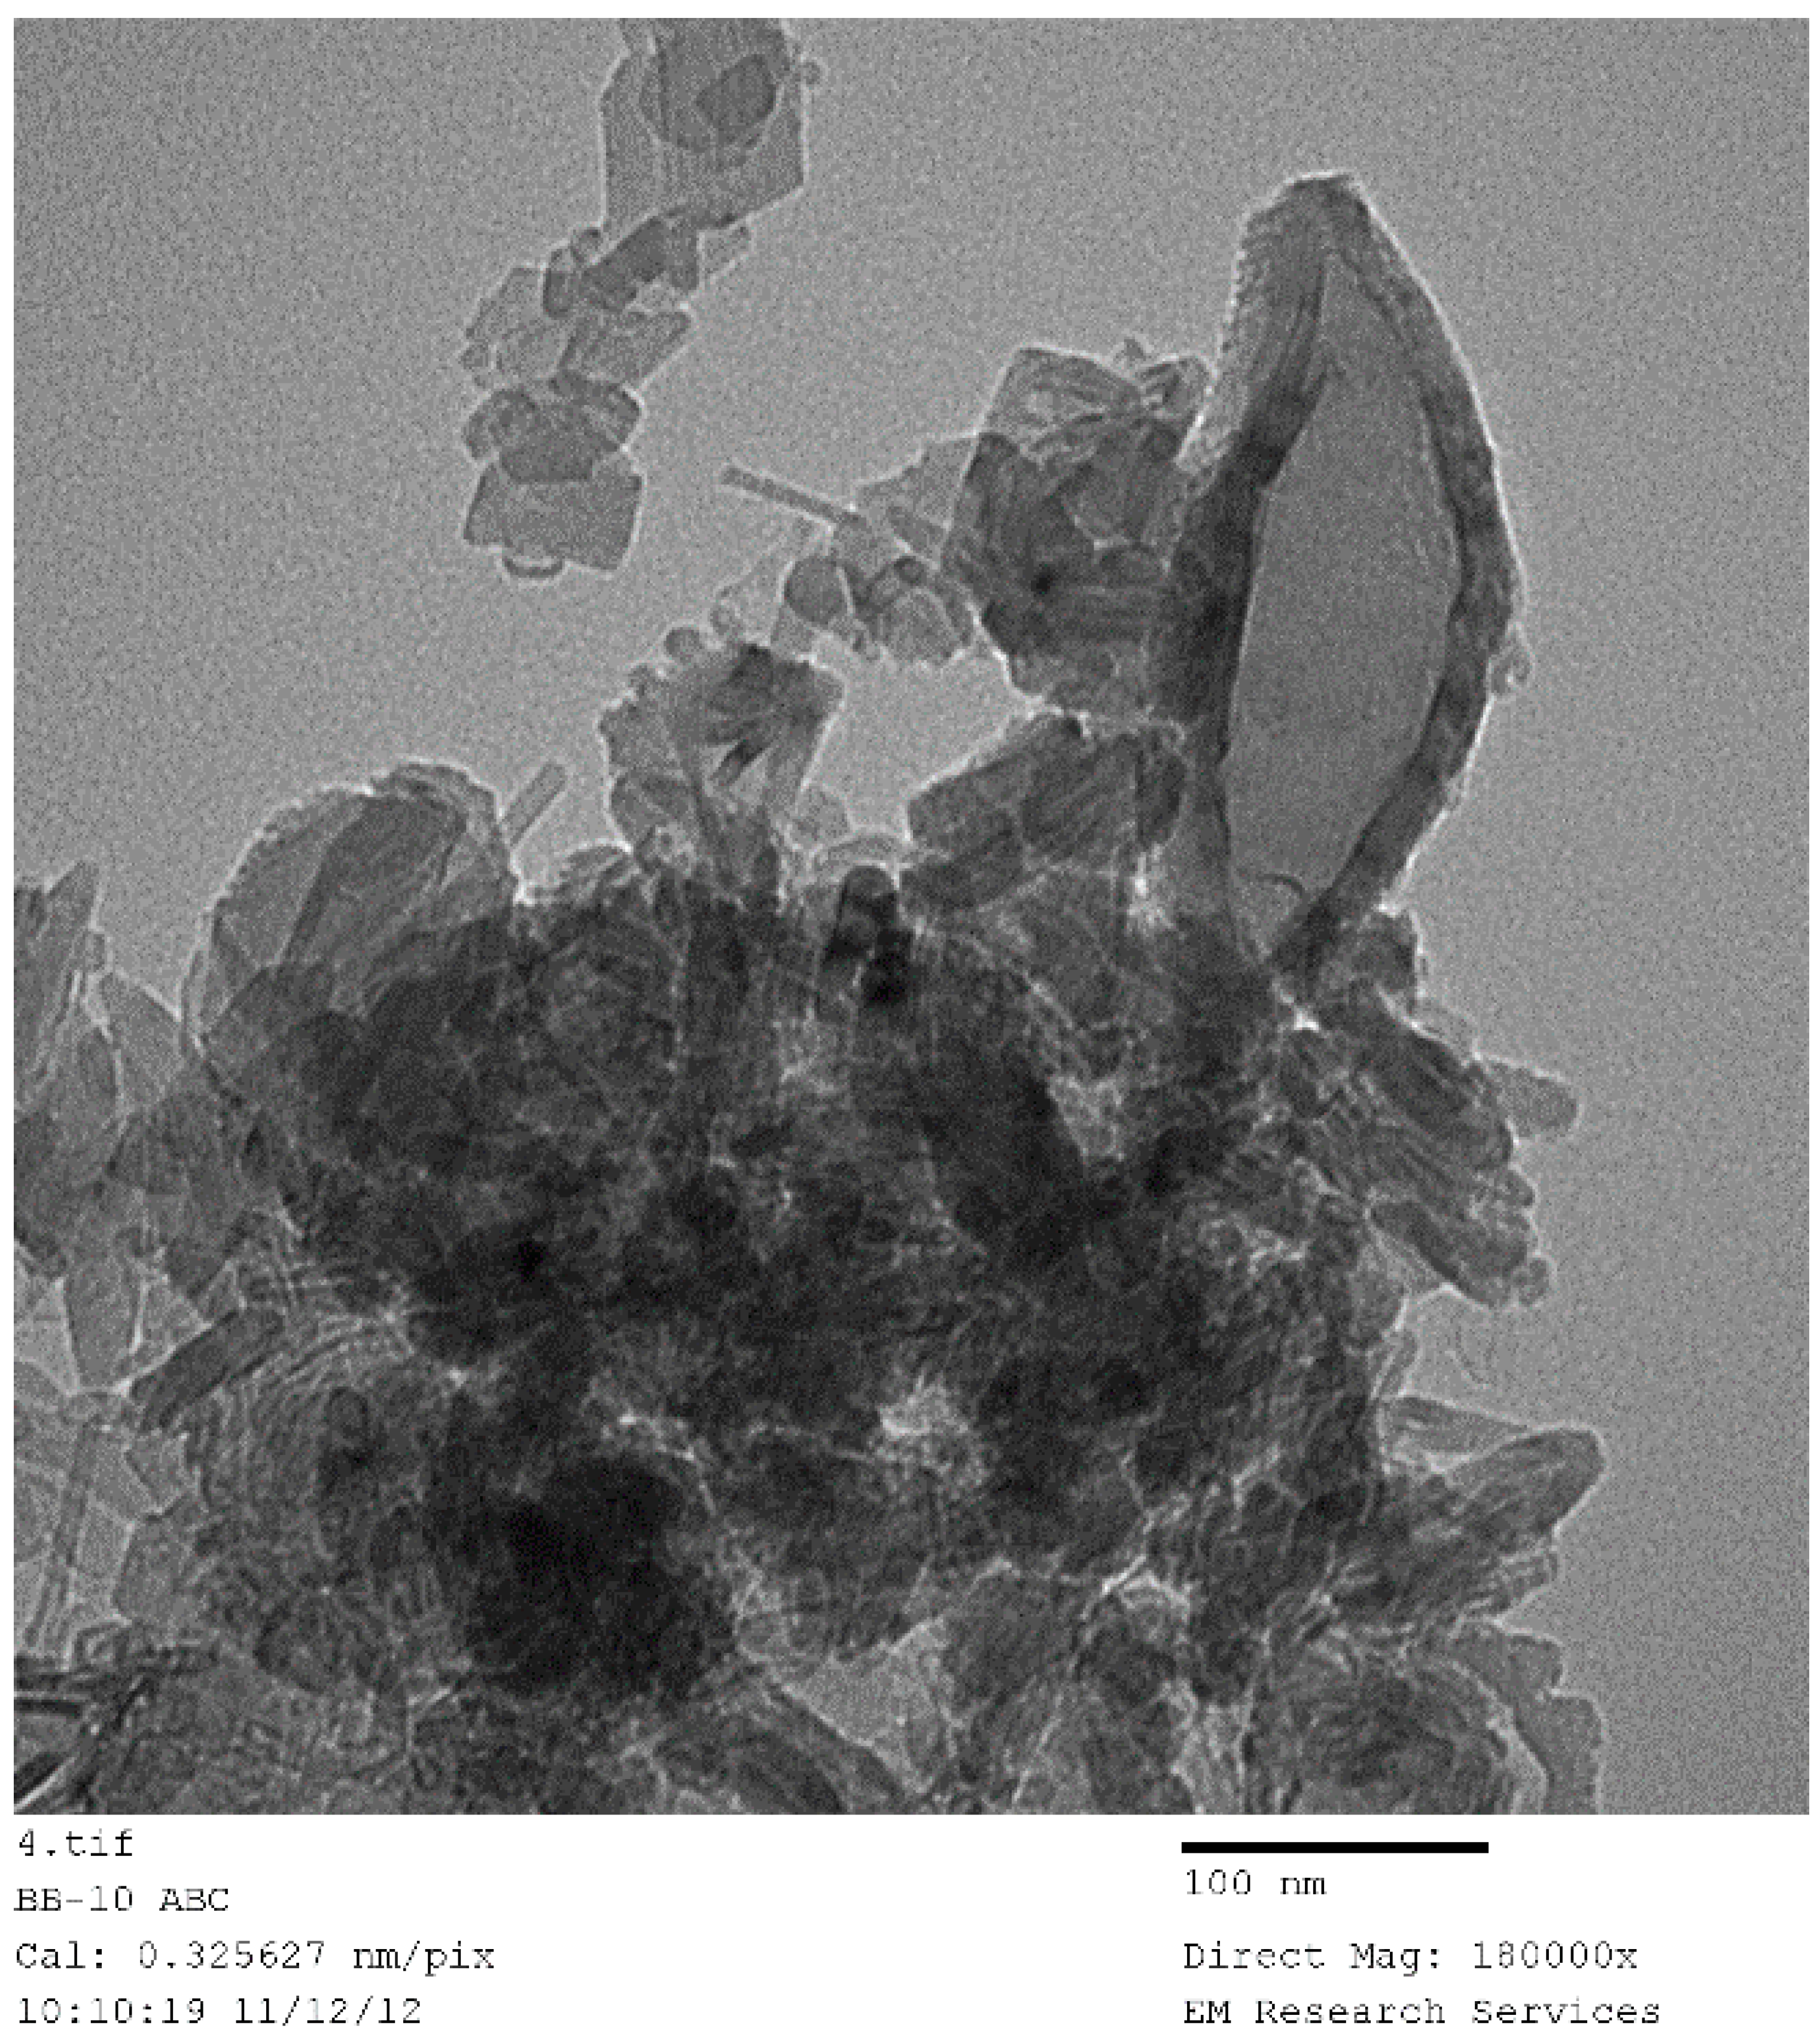
Figure 21 shows nearly all of the nano-structures encountered throughout this study. Here the catalyst (Co/Si = 1/4 Mw-ABC) was prepared by microwave irradiation of the catalyst/support precursor fluid for 4 min at 1 kW to obtain Co
3O
4, followed by heat treatment at 600 °C using Method-C (
Section 3.8). Co
3O
4, was then reduced by hydrogen for 24 h at 550 °C. However, it was observed from the TEM images that there were no significant changes in the catalyst nano-structure after the initial catalyst oxide formation. The BET and XRD analysis of the sample after the reduction stage gave BET = 130 m
2/g and XRD based catalyst size was 15.6 nm evaluated at 2θ = 44.3° as the dominant peak corresponding to metallic cobalt while CoO size at 2θ = 42.4° was 5.01 nm (See
Table 2).
Figure 21 shows a large (measuring
ca. 250 nm × 100 nm × 20 nm) closed ellipsoidal structure with wall thickness of
ca. 20 nm. It can also be observed that the wall of this structure has a bar-code type of printing representing the catalyst. This figure also shows several polyhedral structures in the form of rods or irregular shapes. These structures also contain layered detail similar to bar-codes observed in the case of the large ellipsoidal structure. We have collected a number of similar structures from other samples produced by thermal, microwave or photo-radiation or by combined thermal and microwave radiation. These TEM images illustrate the dominant structures in all the samples examined and presented in
Figure 22,
Figure 23 and
Figure 24.
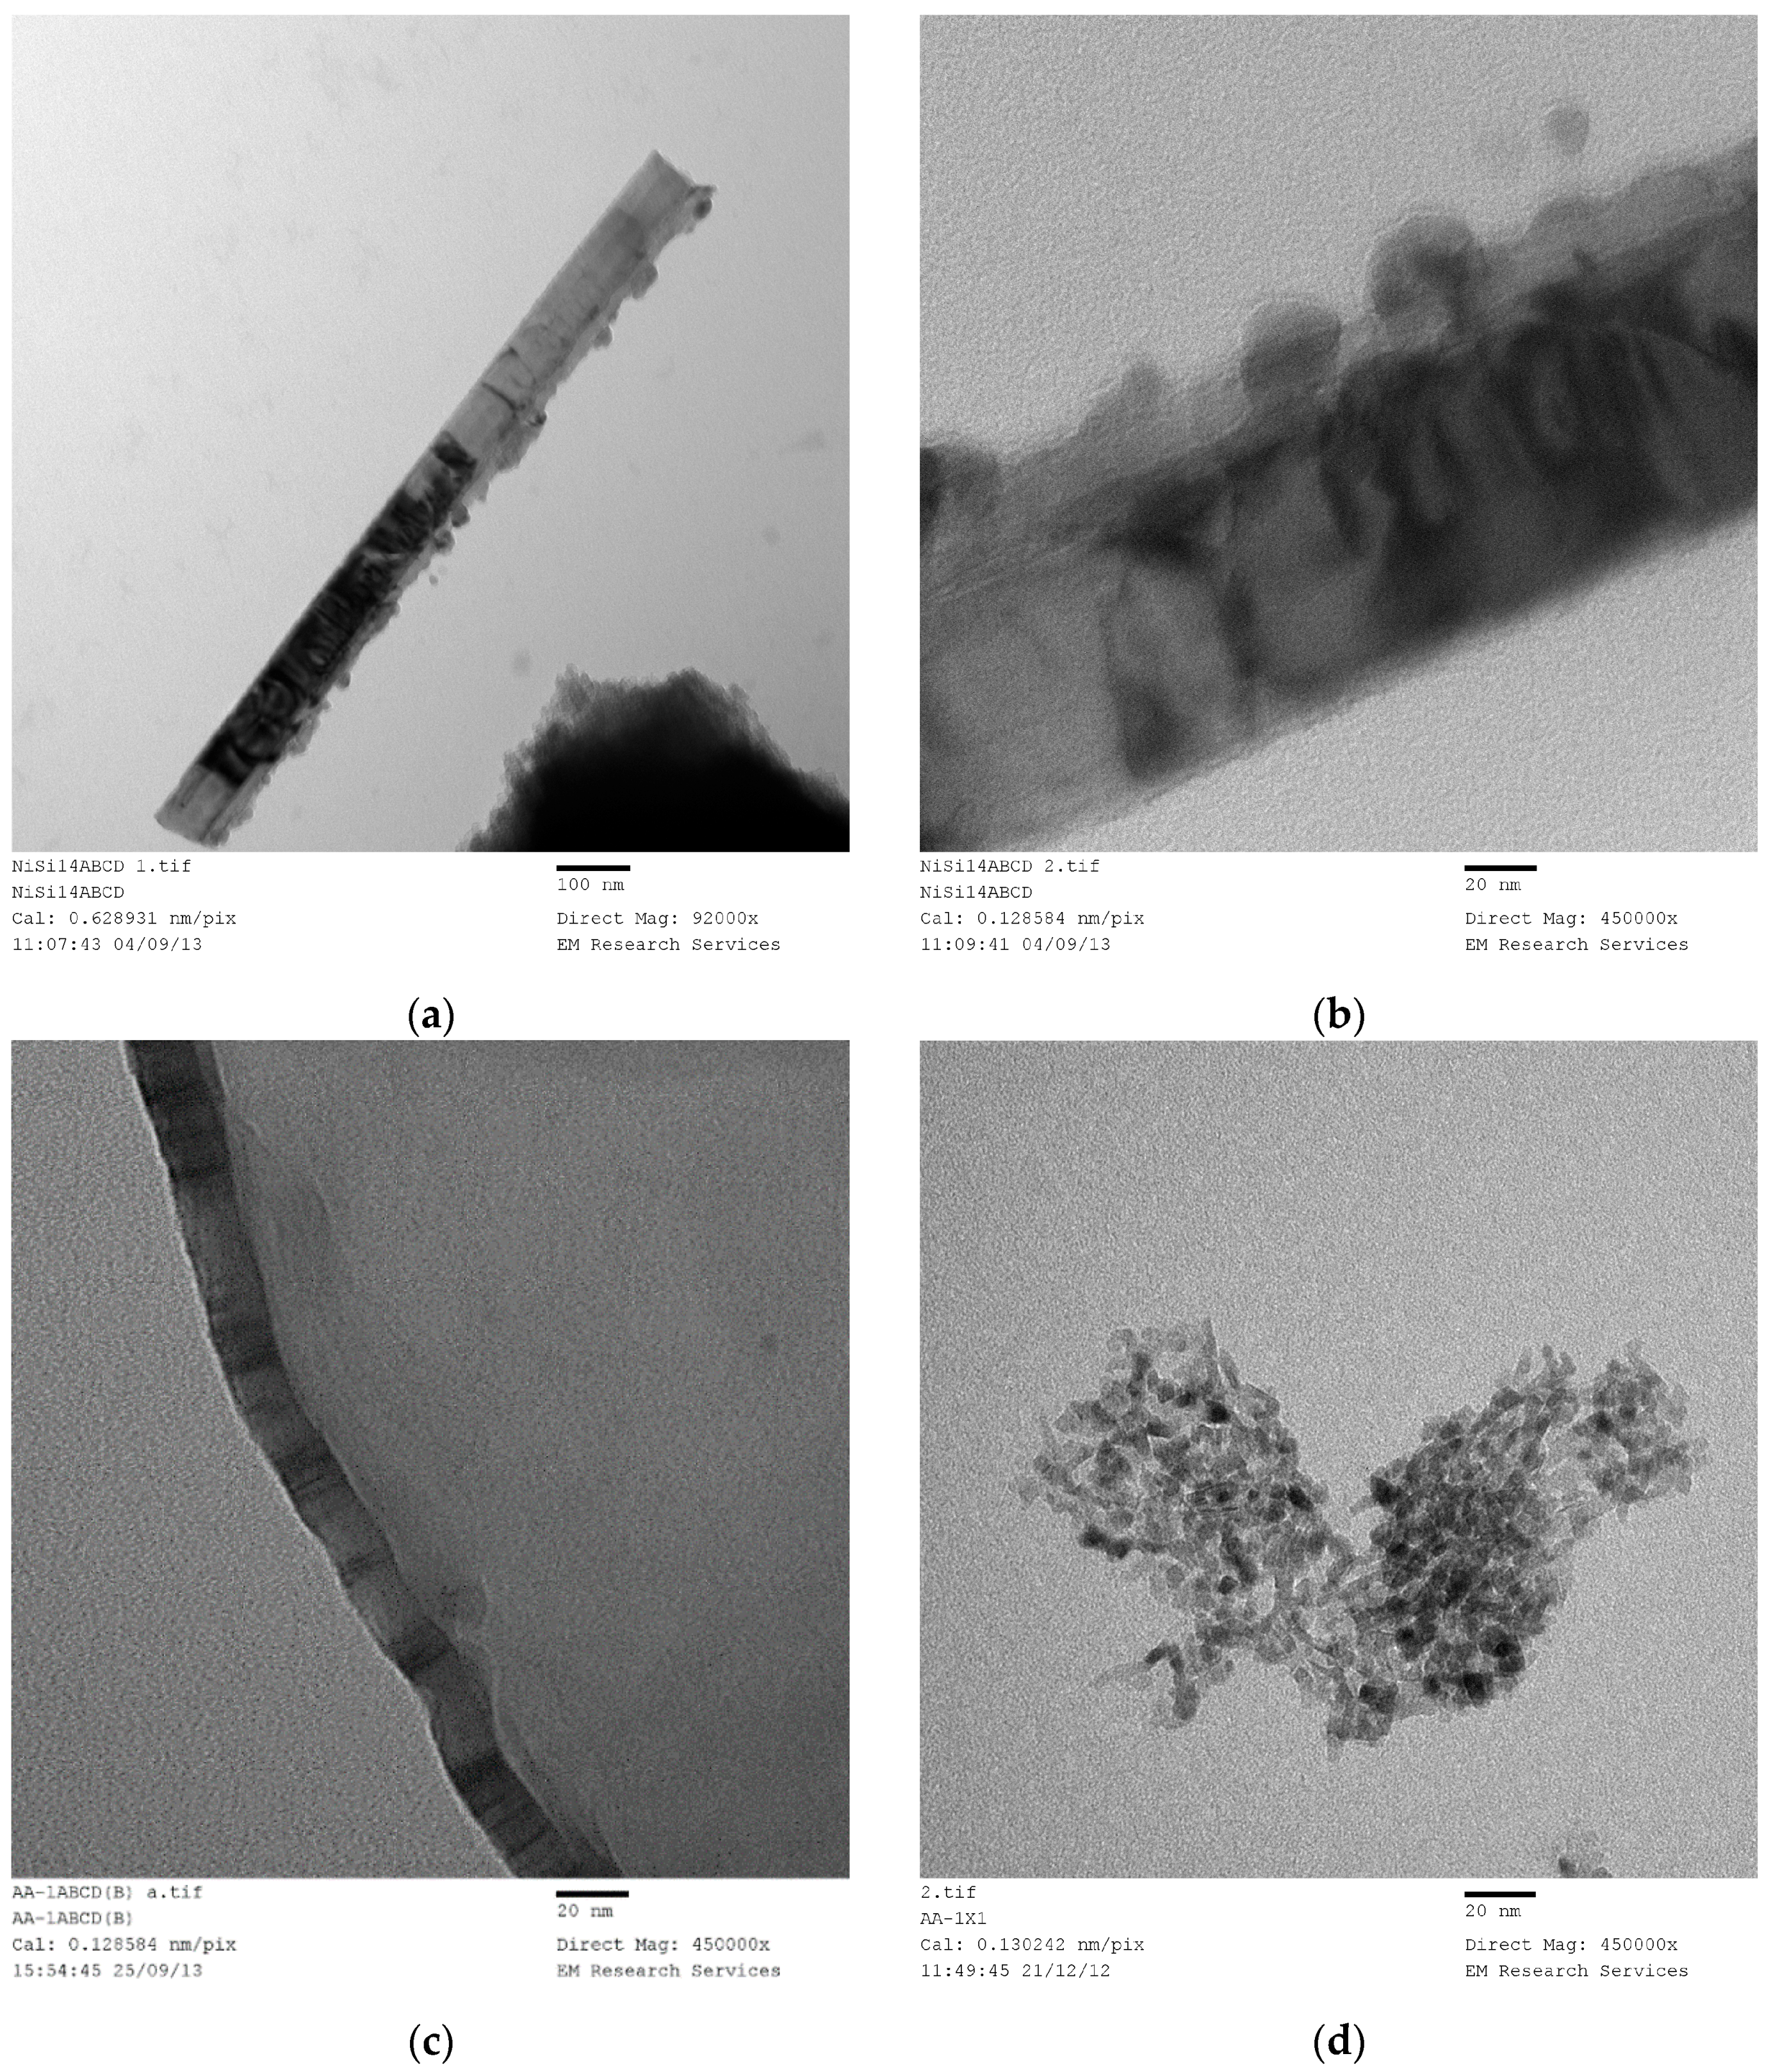
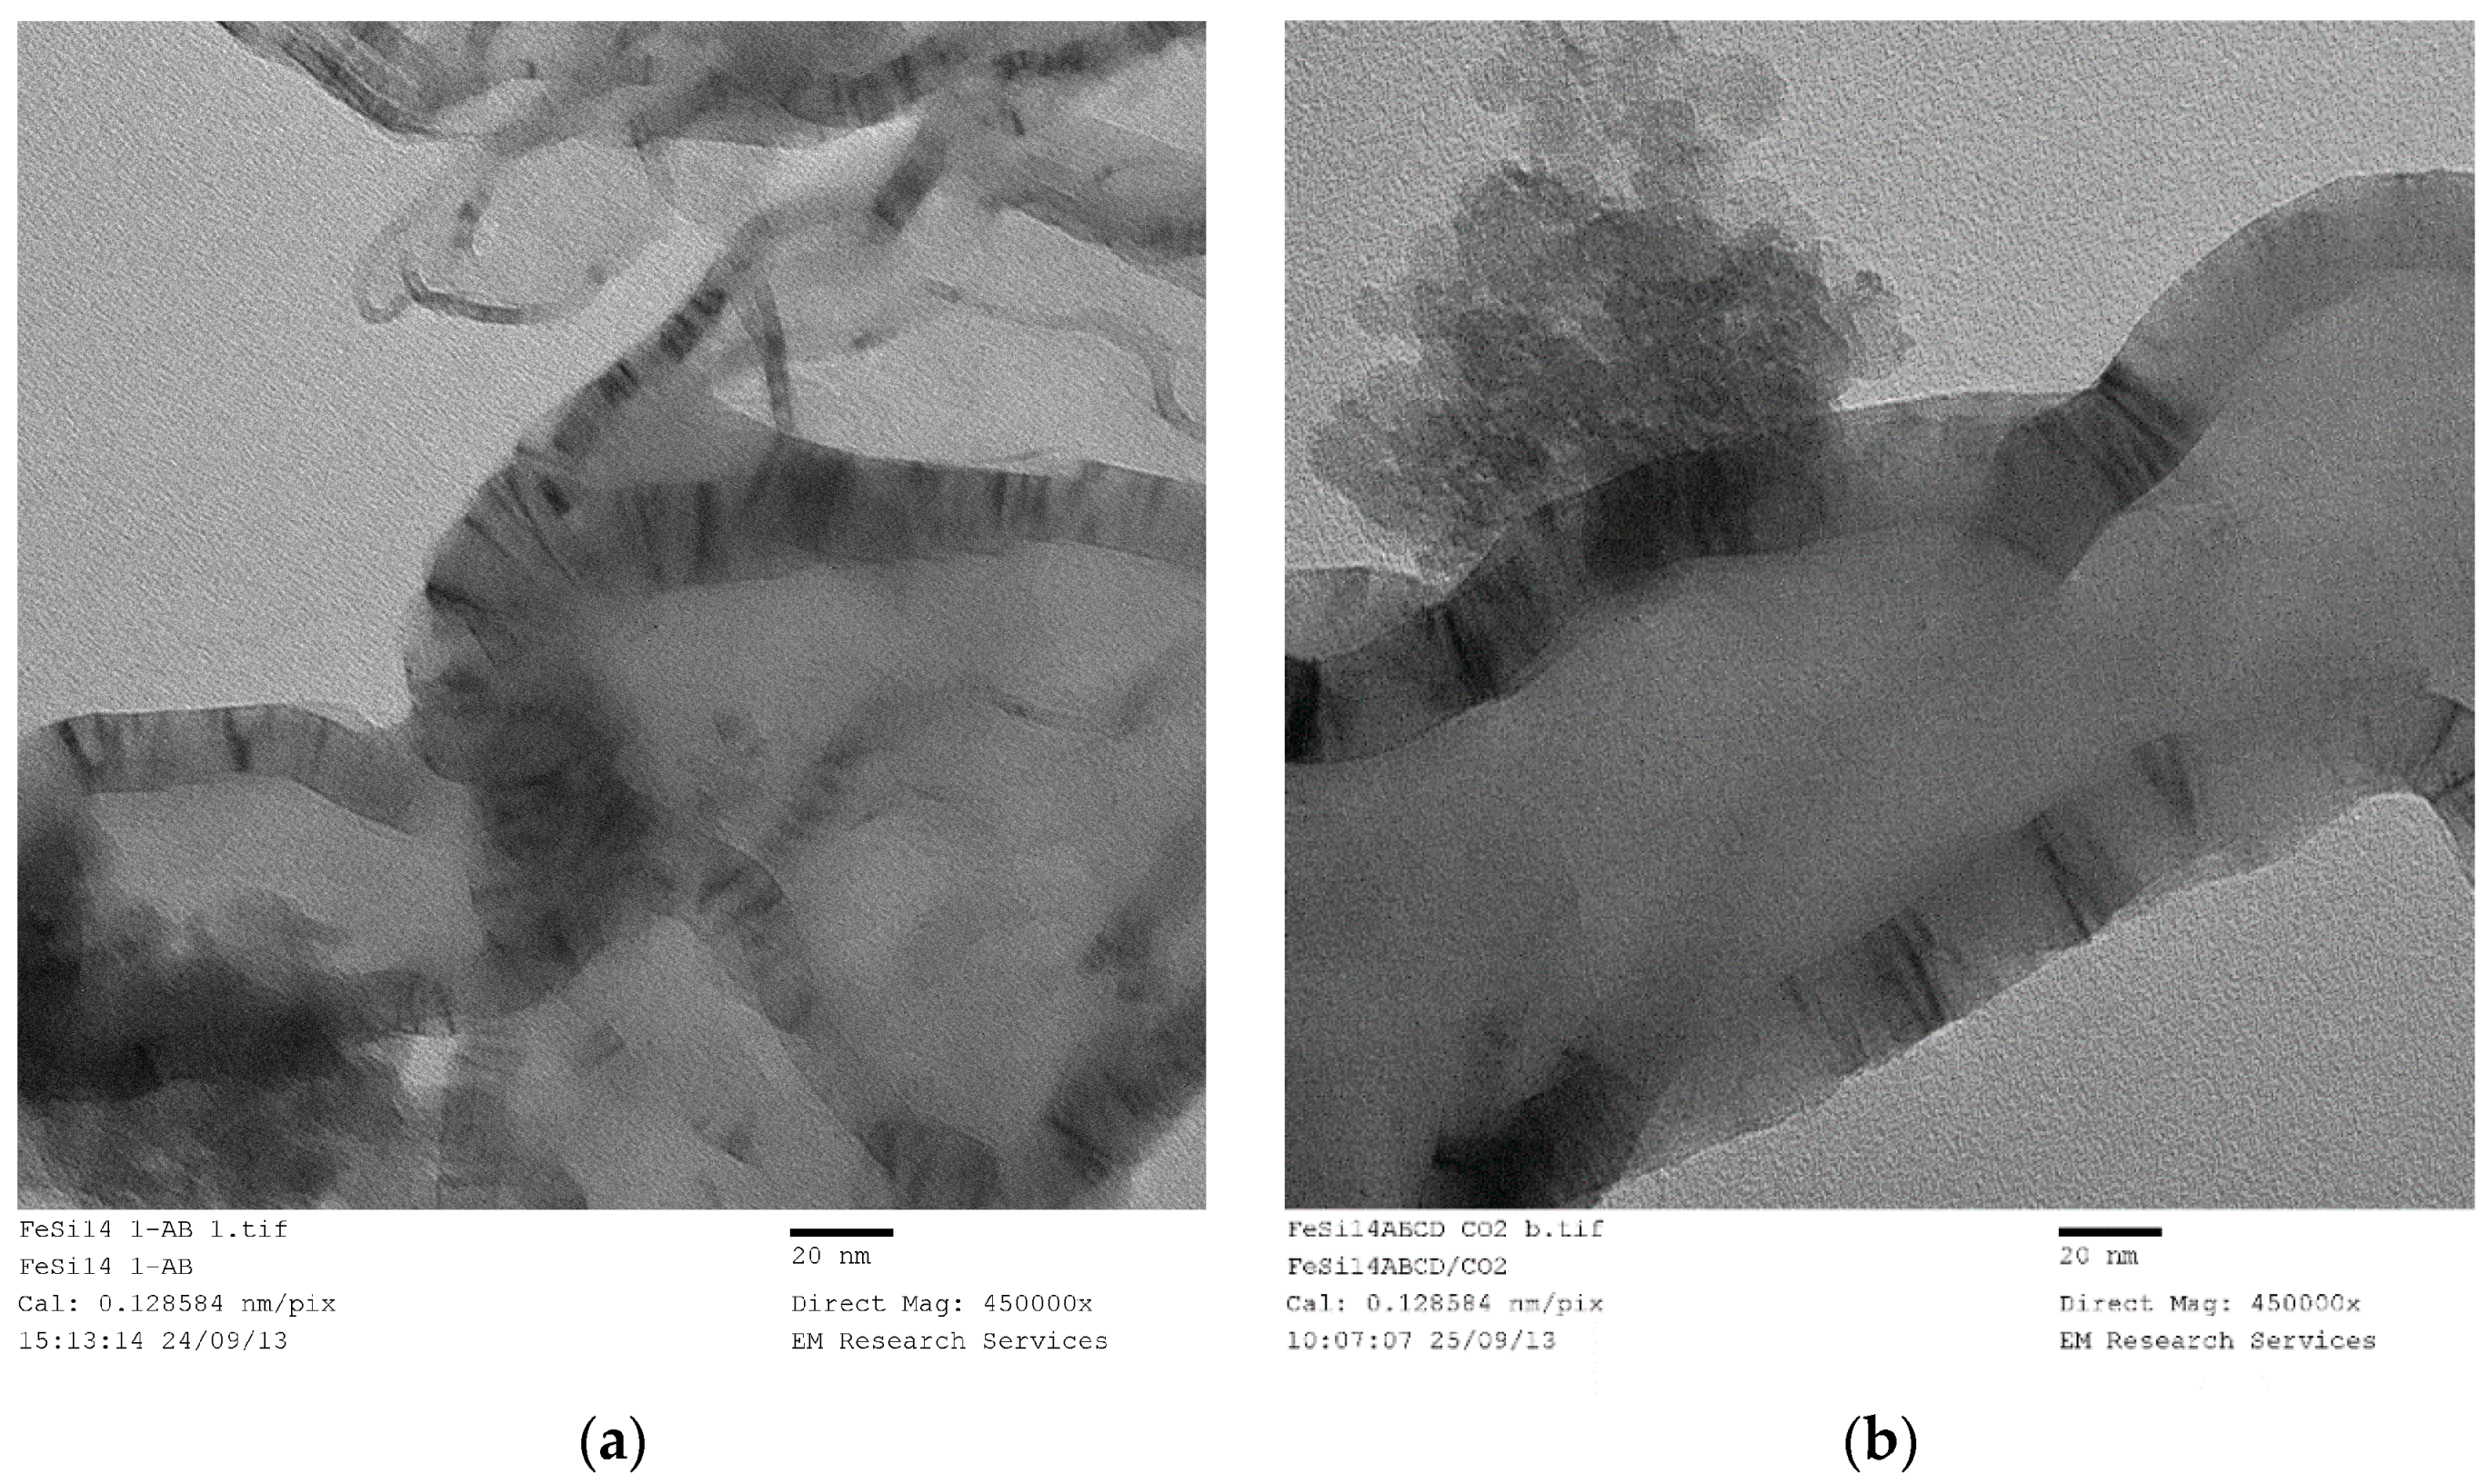
The basic bar-code type structure for several samples of differing catalysts and process history is shown in
Figure 22a–f.
Figure 22a,b illustrates a very long (1100 nm) and thick (20 nm) rectangular rod with a bar-code-like catalyst structure. This catalyst is coded as Ni/Si = 1/4 Mw-ABCD, indicating the catalyst history: The supported catalyst precursor fluid was microwaved at 1 kW, followed by heat treatment at 600 °C and then reduced in hydrogen at 550 °C and finally used in ammonia synthesis using a low temperature plasma reactor [
46]. The enlarged view of this structure is shown in
Figure 22b. The bar-code strips in this structure are rather irregular compared with other structures in general as seen in
Figure 22c–f. The catalyst history for these samples are given in the figure caption for
Figure 22. This difference is due to the fact that the bar-code strips are highly concentrated and they also overlap. The width of the bar-code strips can be as small as 0.6 nm (see
Figure 22c and
Figure 23d) but in general, they are approximately 2 nm. These strips of catalyst are separated by silica support with similar width. The height of the bar codes is also variable, ranging from a few nanometers to 20 nm. As for the length of the bar-code strips, it appears to be highly variable. Examination of several images show that they can be very small (
ca. 1 nm) but can reach
ca. 20 nm. It is difficult to be accurate since overlapping small bar-code strips can give the impression of continuity of the catalyst sheet.
As seen from
Figure 21,
Figure 22,
Figure 23 and
Figure 24, these bar-code structures are common in all of the catalysts systems irrespective of the type of energy used for processing, including UV-radiation as observed in
Figure 23c,d.
Figure 22e,f indicates that the processing using combined energy fields do not influence the catalyst structure. In
Figure 22e combined microwave and thermal energy were used (2 min) whereas, microwave and ultra-sound (US) were combined in the production of the sample in
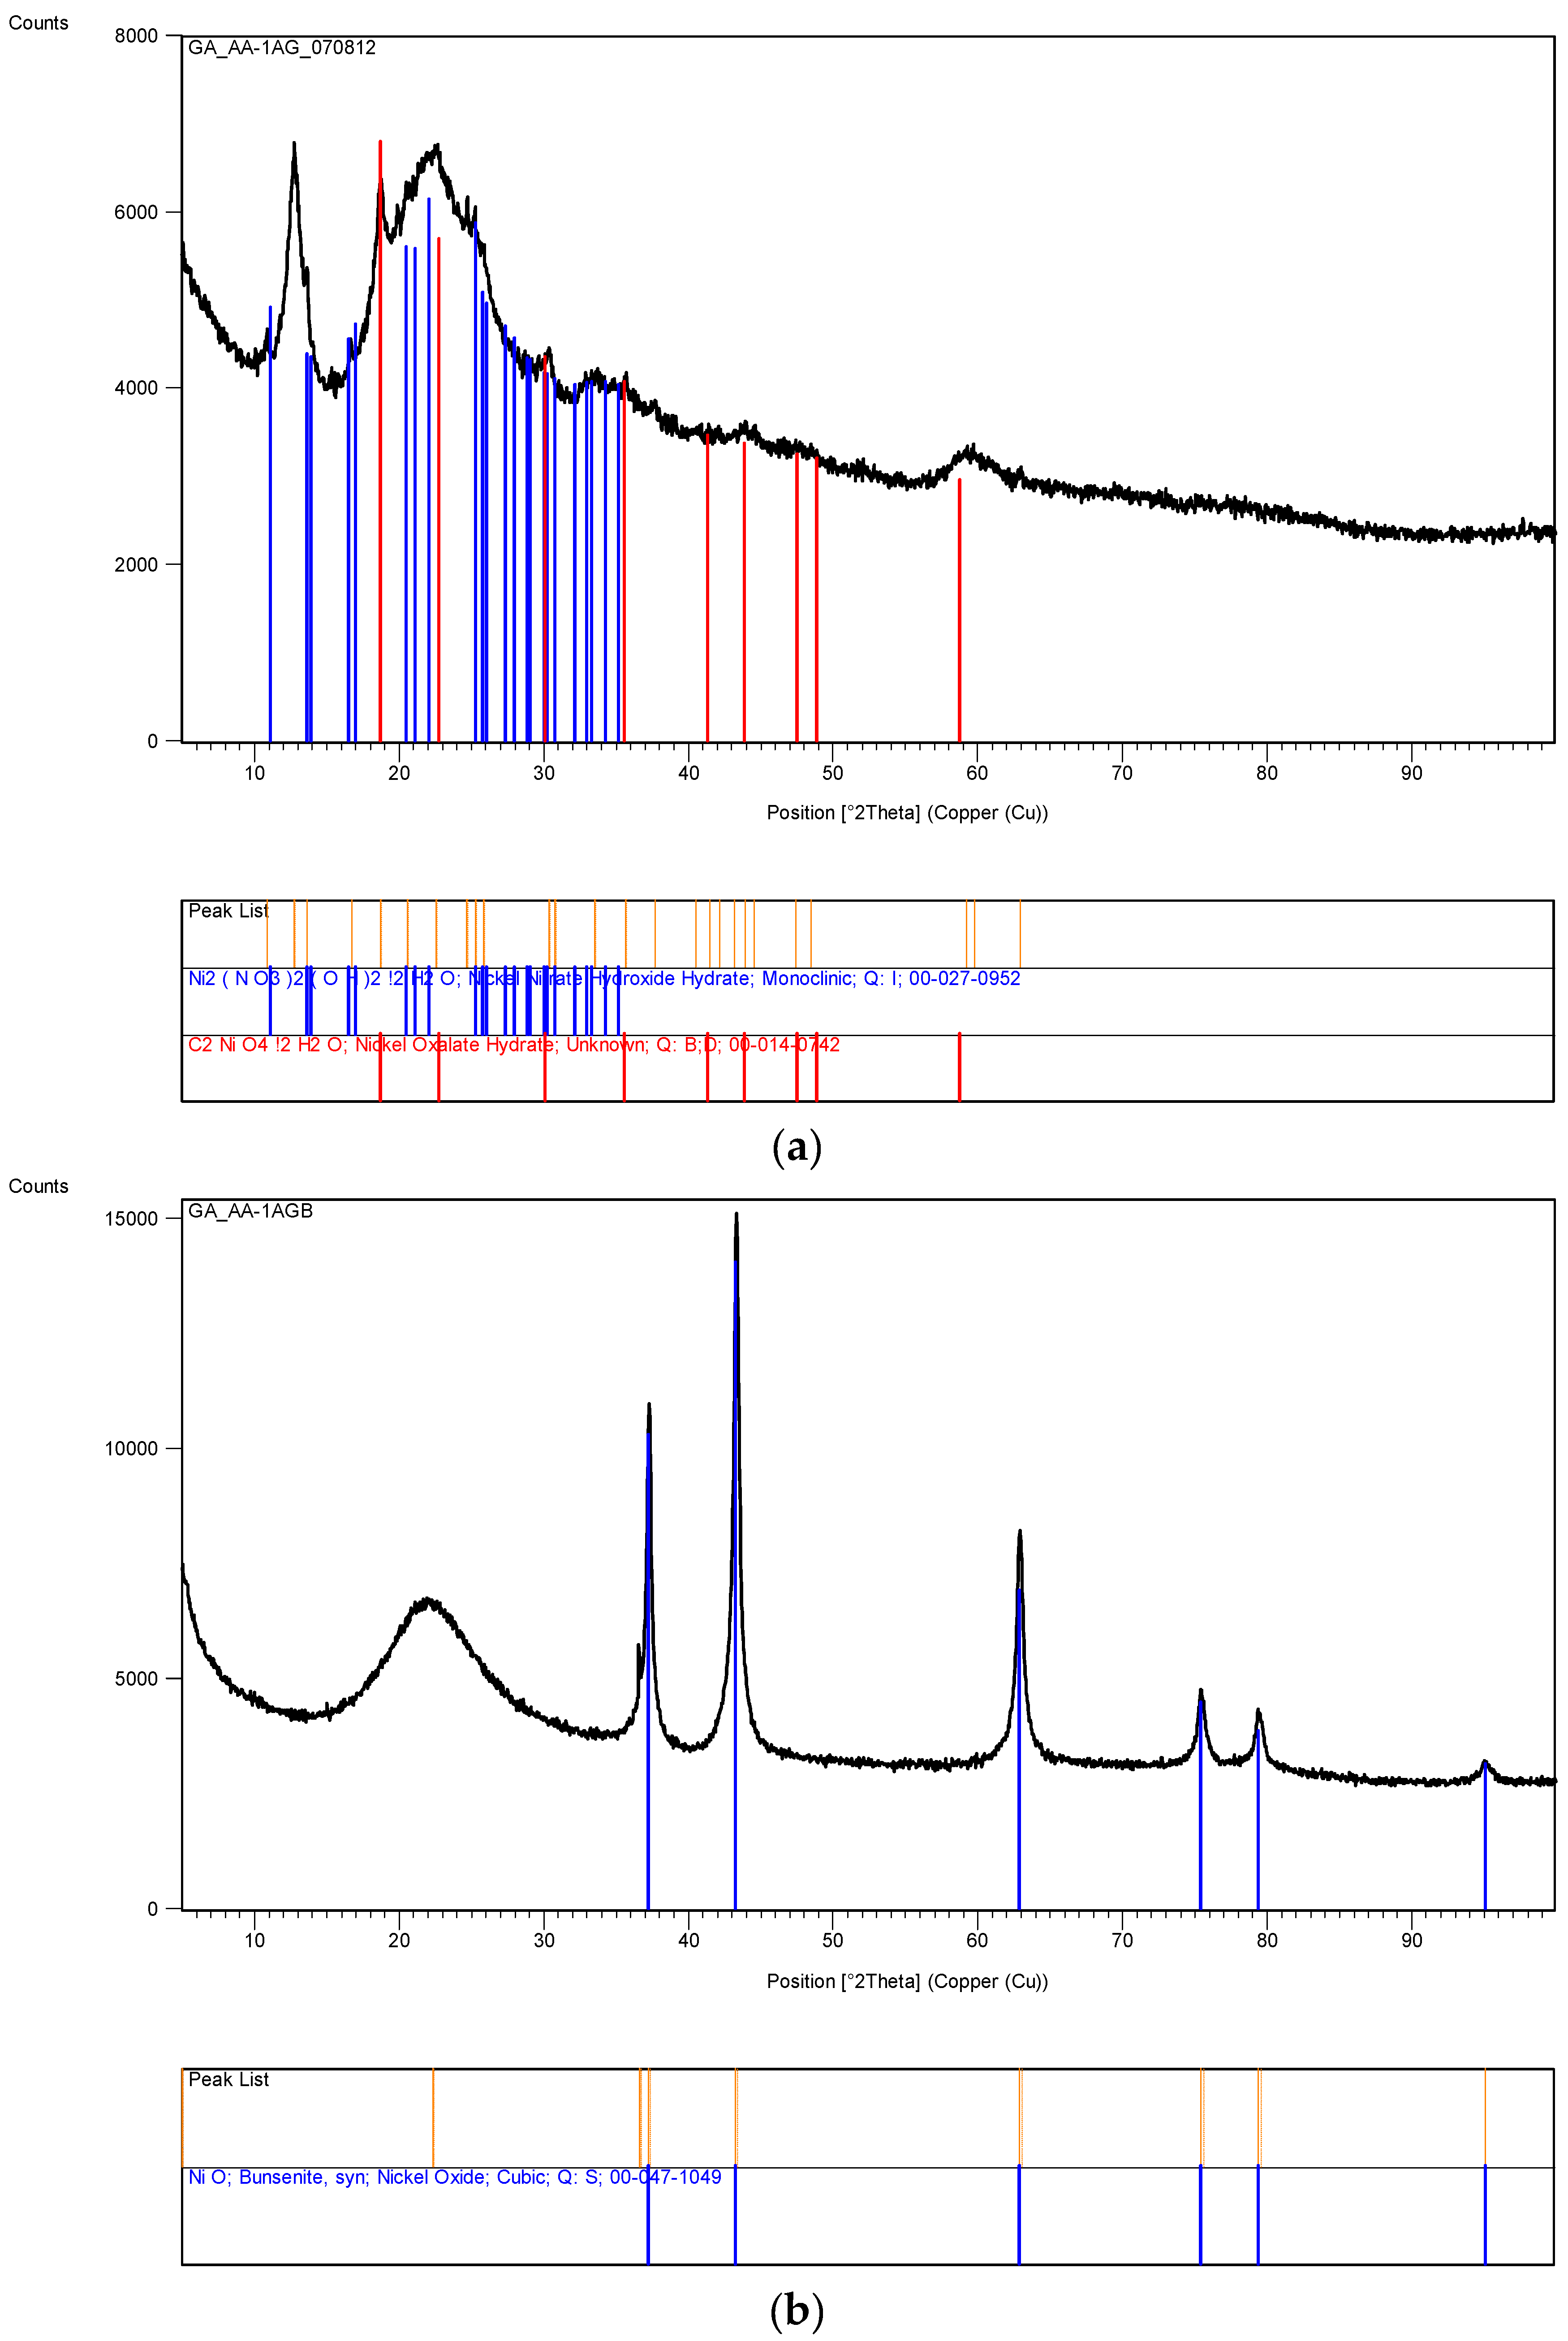
Figure 22f. However, the dimensions of the ribbons with bar-code strips/plates can be controlled in two ways. If the pH of the catalyst/support precursor solution is reduced from its natural pH (= 5.5) to pH = 0.2 with the addition of nitric acid, the ribbon dimensions are drastically reduced as seen in
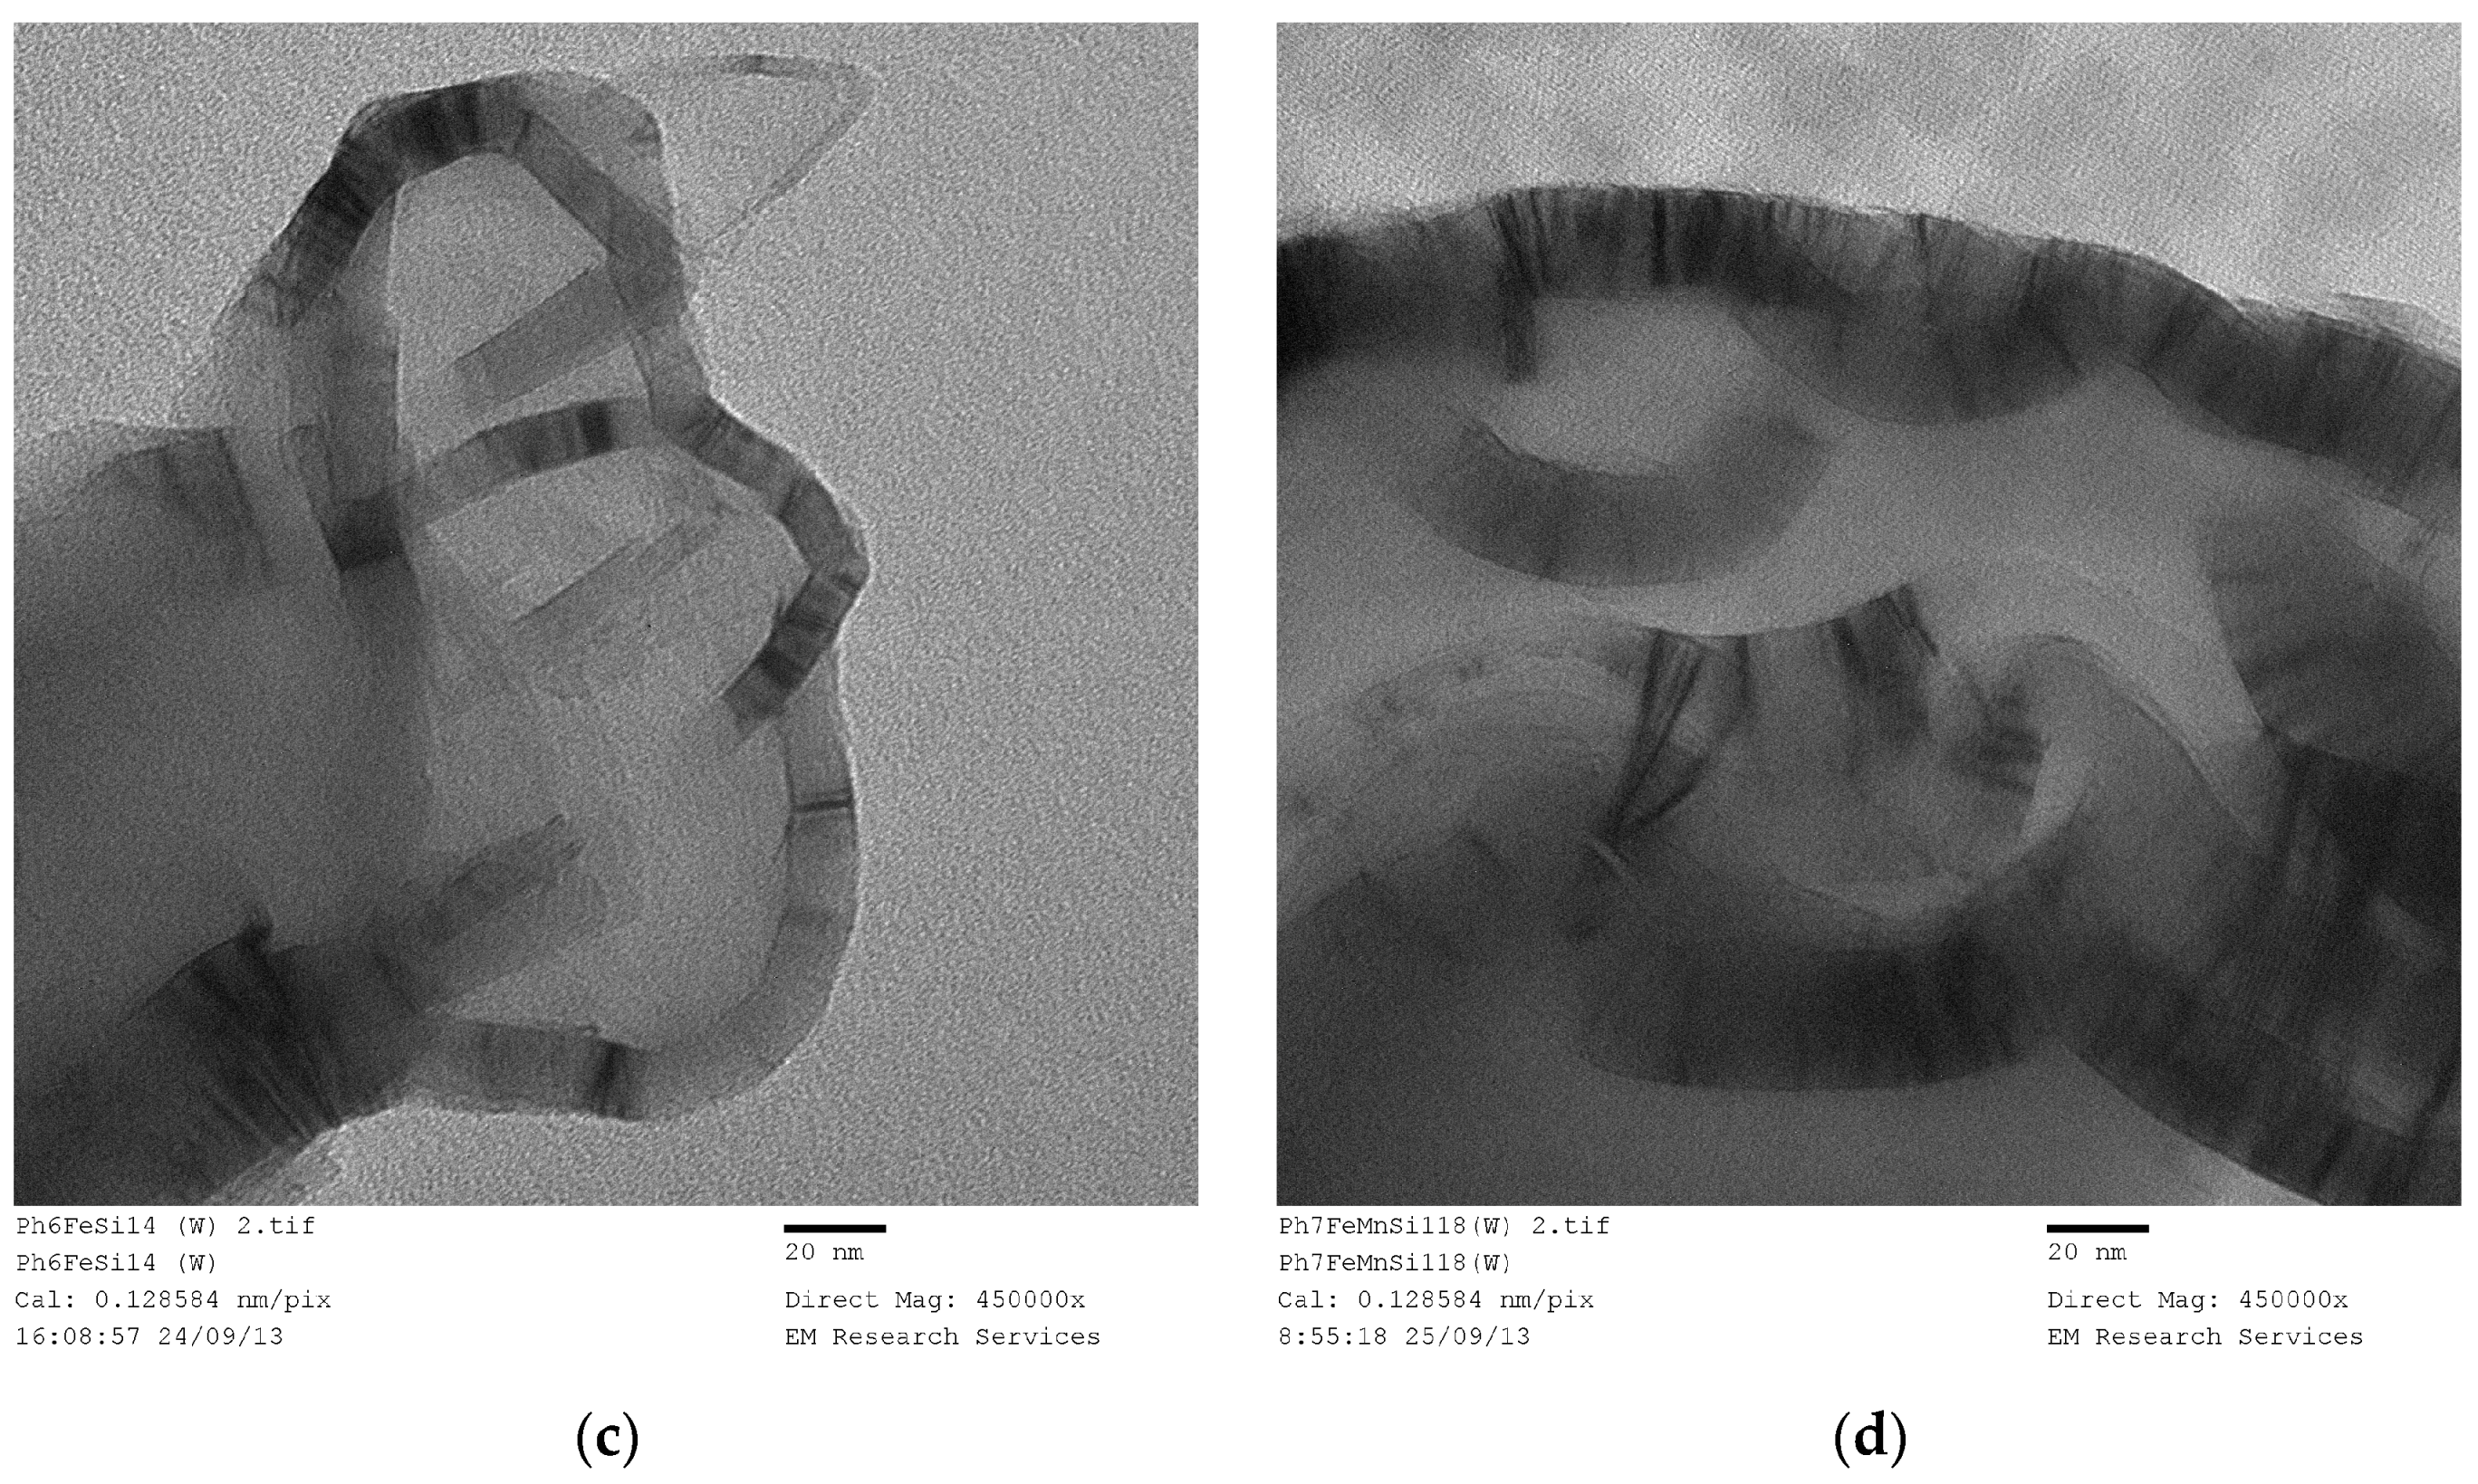
Figure 22d. In this case, the microwave irradiation of the catalyst precursor fluid did not result in the decomposition of the nitrate salt but a green porous solid structure was obtained. When this porous supported precursor structure was heat treated at 600 °C, the resulting supported catalyst (Ni/Si = 1/4 Mw-YB) had very large crystallite size (43.3 nm) as also apparent from
Figure 12b. Alternatively, if the energy input is too high, (
i.e., combined Thermal (Th) and Microwave (Mw) radiation), the overall dimensions of the ribbons are also reduced as seen in
Figure 22e.
The ribbons with bar-code strips can co-assemble to form lamellar structures as shown in
Figure 22f similar to lyotropic surfactant lamellar sheets based on surfactant bilayers. However, these self-assembly lamellar sheets are interrupted by defects as a result of mis-orientation or presence of large lamellae. When the lamellae with dense bar-code strips overlap, they will appear as dense and irregular catalyst depositions in TEM images as seen in
Figure 24a. In this figure, two disk-like particles (size 50 nm and 130 nm) with bar-code strips can be identified, together with several other more dense particles. For this reason, it is important to investigate the catalyst structure at very high magnifications with images taken from several areas of the TEM sample.
Figure 24b also shows particles which would appear as large dense catalyst particles at low magnifications, giving the impression that the catalyst size is very large. Here too, the catalyst structure is in the form of concentric lamellae also encountered in some lyotropic surfactant systems. In some cases, the catalyst structure appears as an aggregation of small particles next to the bar-code structures as seen in
Figure 22d and
Figure 23b.
Therefore, the catalyst size cannot be evaluated from the TEM images due to the heterogeneity of the catalyst structure, and that the catalyst particles are not spherical but in the form of lamellae. Although XRD based evaluation of the catalyst size yields a quantitative measure, in view of the various structures encountered in this study, it is not clear how these catalyst sizes relate to the actual size and its distribution.
Clearly, the TEM images presented in
Figure 21,
Figure 22,
Figure 23 and
Figure 24 show that the catalyst system presented in this study is fundamentally different from those prepared by wash-coating or deposition methods where a high surface area solid support (such as alumina, zeolites, silica, nano-tubes and rods) is impregnated by the catalyst precursor and subsequently reduced, leaving a deposit of metal catalyst particles on the solid support or in its pores. In the present case, both the catalyst and the support precursors are in liquid form and both are transformed to solid after the evaporation of water and subsequently heat treated/reduced to obtain the catalyst. The catalyst and the support therefore interact at the liquid state and the catalyst forms nano-scale lamellar structures in the form of bar-code strips or thin sheets separated by the support material. Therefore, the catalyst surface area per unit weight of catalyst is significantly higher compared with the catalyst generated through deposition methods. Furthermore, the catalyst loading is high while the accessibility of the catalyst is provided by hierarchic pore structure. The presence of lamellar structure with alternate catalyst-support layers, also prevents the enlargement of the catalyst when the supported catalyst is subjected to high temperatures.
As seen from the foregoing presentation, we have considered various methods of processing in order to establish the best technique as well as to understand the mechanism of catalyst generation by the current method. The techniques which do not allow the generation of porous catalyst/support precursor result in dense catalysts with significantly large catalyst size which also increases with increasing catalyst loading. Furthermore, if the catalyst loading is above a threshold for a given power input, conversion from supported catalyst precursor fluid to catalyst oxide/support does not take place. Therefore, microwave-radiation or photo-radiation can only be applied to certain catalysts below a certain catalyst loading. In this case, thermal treatment of the catalyst/support precursor needs to be applied with or without microwave/photo-radiation.
3.15. Summary of Catalyst Characteristics
In this study, our objectives are to obtain an efficient supported catalyst system and establish its mechanism of generation. Promising catalysts developed here have been successfully applied to Fischer-Tropsch synthesis [
45], dry reforming [
45] and ammonia production [
46]. However, in these studies, we have not optimized the catalyst properties for a given purpose, such as, selectivity or conversion. In these studies, we have considered the catalyst size, catalyst loading and the surface area of the catalyst system. Furthermore, in order to evaluate the mechanism of catalyst formation and to be able to compare the results obtained using different methods, we have adopted a heat treatment procedure in which the supported catalyst oxide obtained from microwave or UV-radiation were heat treated at 600 °C using Method-C (
Section 3.8) which resulted in an increase in catalyst oxide size. This treatment is also necessary in order to burn-off the coating on the catalyst surface before the catalyst reduction at 550 °C in a hydrogen atmosphere. In the case of the thermal method, heat treatment is part of the film/bubble generation process as well as subsequent removal of the coating on the silica support.
In some cases, the removal of the organic coating can be carried out at low temperatures (
ca. 150–250 °C), using low temperature Dielectric Discharge Plasma in the presence of oxygen [
8,
45] followed by reduction using hydrogen in the same plasma reactor. This process stops size enlargement at high temperatures.
However, the advantage of thermal treatment is that at high catalyst loading, higher microwave power is needed and the thermal process is a single step process for the catalyst oxide formation and removal of coating on silica. Clearly, if the catalyst support is preferred to be carbon, catalyst reduction can be carried out using nitrogen in a low temperature plasma reactor to carbonize the silica coating, followed by catalyst reduction.
Here, we summarize the variation of the Ni/Si catalyst surface area and catalyst size before they are ready for reduction using hydrogen. In each case, supported catalyst precursor fluid was used to obtain supported catalyst oxide.
Figure 25 and
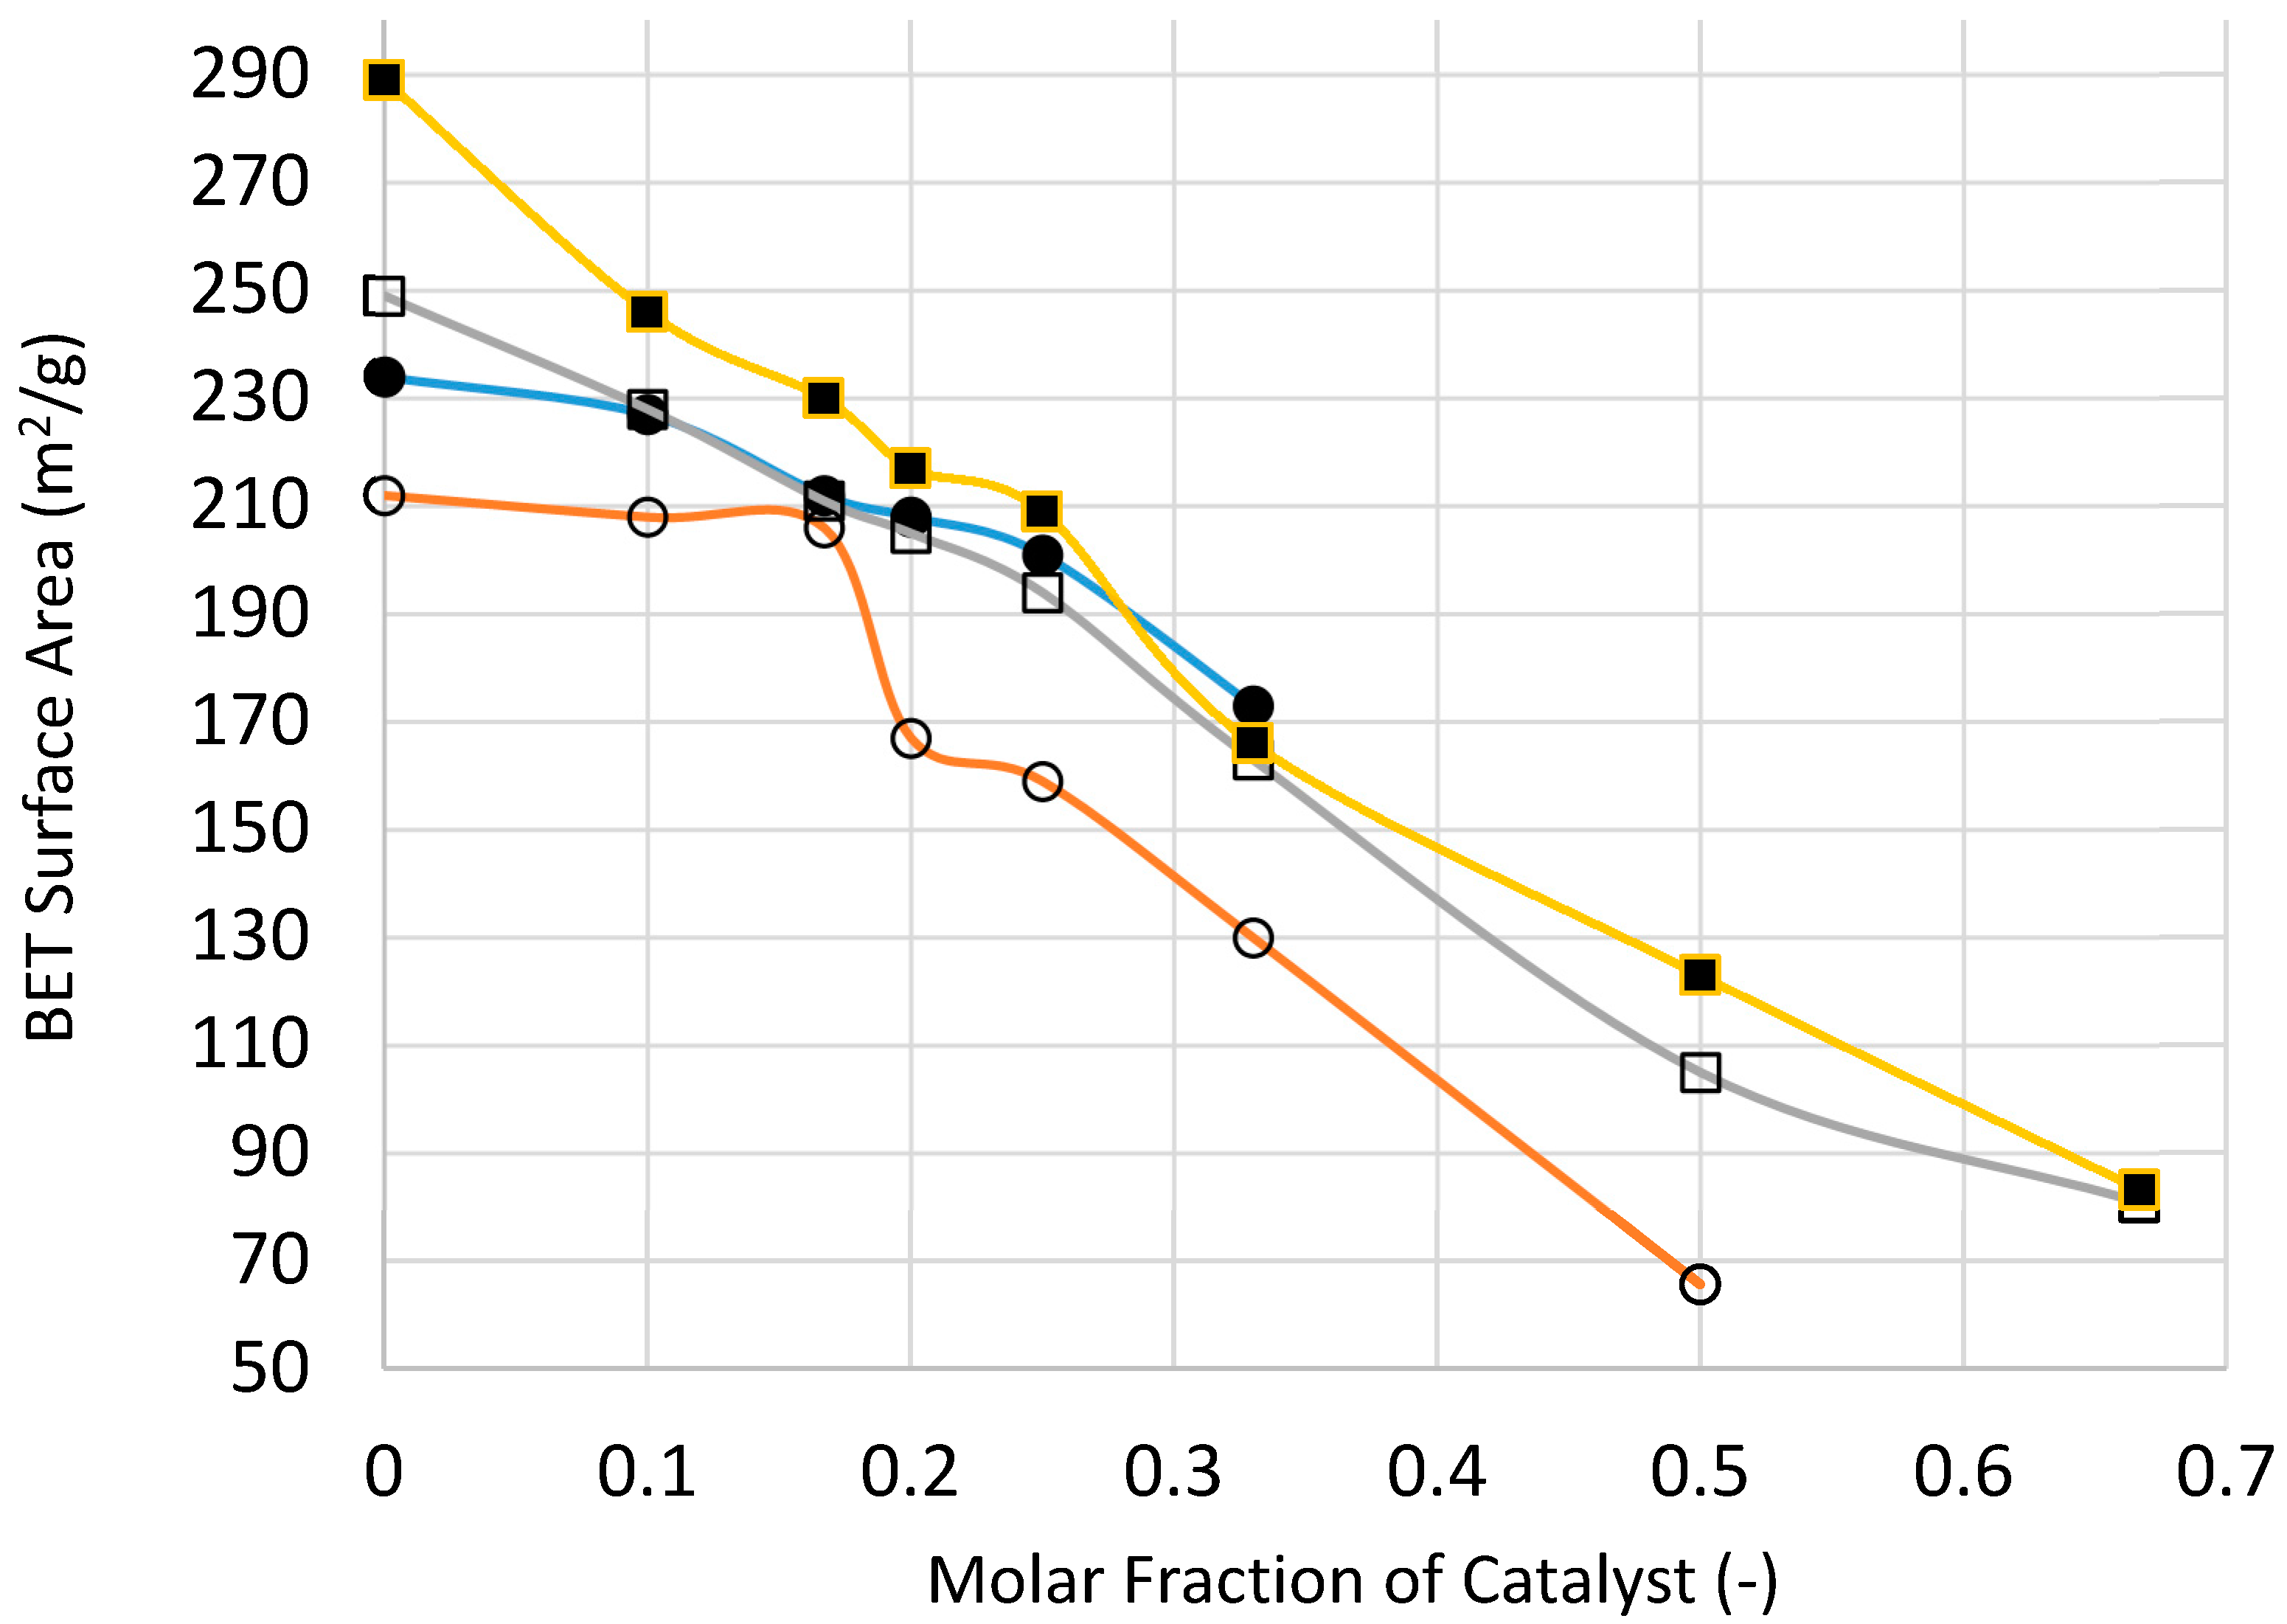
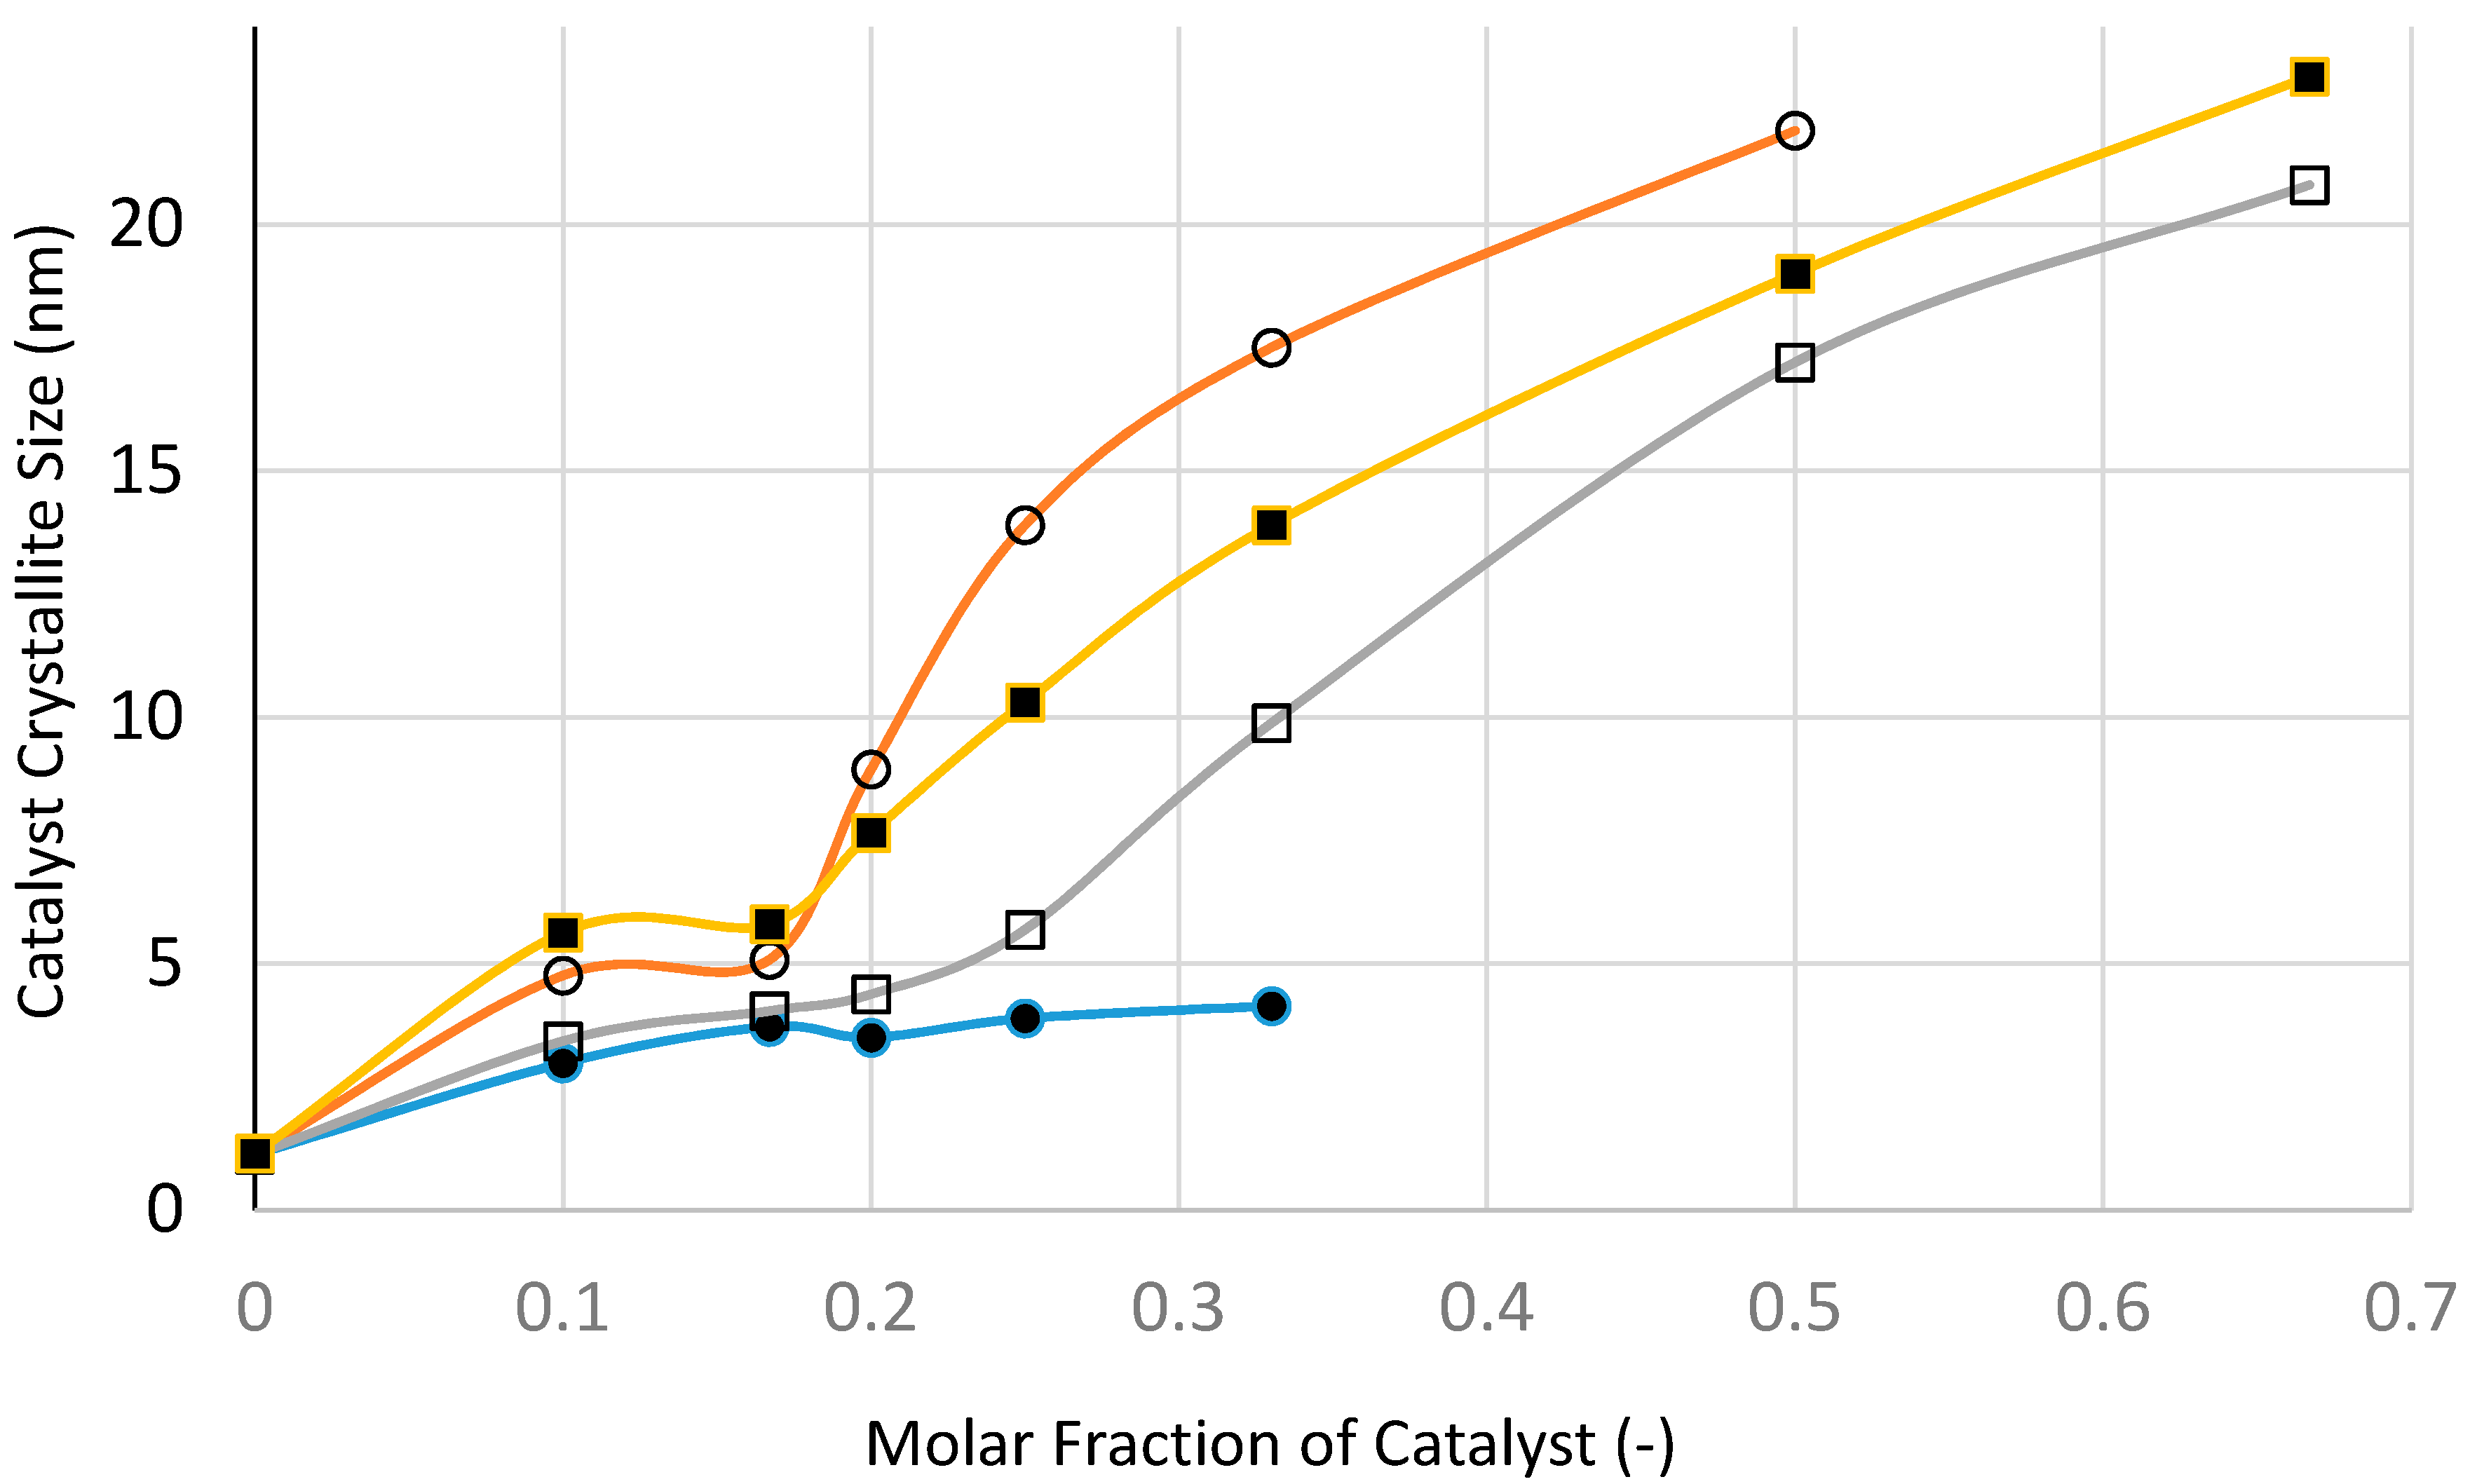
Figure 26 show the variation of catalyst surface area and catalyst size (based on XRD) with catalyst loading (catalyst molar fraction) defined as [Ni]/([Ni]+[Si]) as a function of processing condition, to investigate if microwave radiation before heat treatment has any beneficial effect.
Figure 25 indicates that the catalyst loading reduces the catalyst/support surface area which increases with increasing processing temperature as well as the duration of heat treatment. The reduction in surface area becomes less marked with increasing catalyst loading except when the heat treatment is at 300 °C. Surface area reduction with catalyst loading is partly due to increased density of the supported catalyst system. Nevertheless, microwave irradiation appears to yield higher surface area at high catalyst loading which can be attributed to smaller catalyst size, as indeed shown in
Figure 26.
If the density increase due to catalyst loading is taken into account, it can be shown that the surface area of the catalyst system in fact increases. Instead of using surface area per unit weight as a quantitative measure of surface area, a more realistic measure is in fact surface area per unit volume, or surface area density, measured in m
2/m
3. The importance of surface area density in heat and mass transfer processes is well known and for this reason it is also described as Transfer Area Density [
17]. In
Figure 25, the measured BET surface area of the silica support for the microwaved sample is 234 m
2/g. When [NiO]/[SiO
2] = 1/3 the BET surface area of the catalyst is 173 m
2/g. Assuming densities of 2.20 g/cm
3 for amorphous SiO
2 and 6.67 g/cm
3 for NiO, the corresponding surface area densities are 5.15 × 10
8 m
2/m
3 for SiO
2 support and 6.32 × 10
8 m
2/m
3 for the catalyst system (Ni/Si = 1/3 Mw-A), indicating some 20% increase in surface area of the catalyst oxide.
The variation of XRD-based catalyst size with catalyst loading shown in
Figure 26 indicates that at all catalyst loadings, microwave processing provides smaller catalyst size when compared with the other processes, especially at high catalyst loadings. Even after taking into account a slight increase in catalyst size following heat treatment at 600 °C using Method-C (see
Table 1), the microwave method still provides the smallest catalyst size.
Not surprisingly, fast heating and fast cooling at 600 °C is to be preferred to slow heating/slow cooling process at 600 °C. What is surprising is that the heat treatment at 300 °C provides by far the largest catalyst size compared with other methods. Below the catalyst loading of 20 mol %, the difference between all of the methods is not as marked as they are at high catalyst loadings. At this catalyst loading, the precursor fluid is able to form film/bubbles, a process which is hindered at high catalyst loading due to the decrease of silica concentration. Processing at 300 °C benefits from low temperature when the catalyst growth is hindered. However, at high catalyst loading, film formation is hindered (also due to low temperature) and hence the processing becomes similar to that with suppressed film formation. This is also true for fast heating and fast cooling at 600 °C which enhances film formation and suppresses catalyst aggregation due to prolonged heat treatment.
Microwave processing provides the best method, even if it is necessary to have a separate heat treatment stage (i.e., Method-C) to burn off the catalyst coating. If this is the case, the combined microwave and thermal process is the best option as it is also suitable as a continuous process. Furthermore, if a carbon support is needed for the catalyst, initial microwave decomposition followed by carbonization under an inert atmosphere provides a viable route.
3.16. A Tentative Mechanism of Catalyst Structure Development
Although the primary aim of this study is to produce supported catalysts with a high surface area and small and controlled catalyst size having a hierarchic pore size distribution for use in heterogeneous catalysis, we have also carried out experiments in order to illustrate the mechanism of catalyst system generation which appears to be novel and generic.
As demonstrated above, the micro- and nano-structure formation in the silica supported catalysts, including the mixed catalyst, is generic. The basic nano-structure in the form of bar-codes does not depend on the processing history and the processing energy source. However, at a constant catalyst loading, the catalyst size is strongly dependent on the way in which the supported catalyst system is prepared. In all cases, the catalyst system is prepared from a precursor dispersion of silica and catalyst precursor nitrate salt solution which is referred to as “Precursor Fluid”. If the catalyst support silica is not coated, the precursor dispersion is a highly viscous paste-like material which needs to be processed by using high-torque internal mixers, commonly encountered in polymer processing. If the support silica is coated to reduce the dispersion viscosity, the resulting dispersion (at the same silica concentration and silica particle size) also acquires elasticity (i.e., high elastic modulus and extensional viscosity) as a result of which coated silica dispersion can form thin films. If water is gradually evaporated (instead of rapid evaporation with film boiling) during mixing of the coated silica support with catalyst precursor nitrate solution for impregnation, a highly viscous, paste like material is also obtained.
The most important factor in the generation of small catalyst size and hierarchic pore structure is the ability of the catalyst precursor liquid to form film or bubbles. The bubble/film formation during microwave, UV-radiation or thermal treatment of the precursor fluid is clearly observable during processing. At this stage, the proto-catalyst structure is formed and as water is evaporated rapidly from the film, the proto-catalyst structure is frozen and when the film collapses back in to the precursor fluid it keeps its integrity because the air-liquid interface is stabilized by silica particles. These nucleated structures are sufficiently stable not to revert to a dispersion state. This conclusion is in line with the observations made for the pendant drop experiments described in
Section 3.1.
The evidence of bubble formation with a stabilized interface is also available from the TEM-images as shown in
Figure 21 and
Figure 23a–d as well as in
Figure 27. The bubble seen in
Figure 27 is in the form of an extended ellipsoid measuring some ca. 770 × 140 nm. The bubbles present in
Figure 21,
Figure 23a–d and
Figure 27 contain a number of smaller bubbles, presumably captured during the chaotic period of bubble formation and collapse. The thickness of the bubble wall is
ca. 20 nm which appears as a ribbon as seen in
Figure 22a–c as well as in
Figure 21,
Figure 23a–d and
Figure 27.
The bar-code structure (presented in
Figure 22a,b) measuring ca. 1100 nm × 80 nm is formed from the fracture of a large ellipsoidal bubble wall. When such semi-solid structures emerging during film formation aggregate through random packing, they form micro-porous structures. The overall micro-porous structure is best observed through SEM. However, due to the magnification limitations of SEM especially those associated with semi-conductors such as silica-metal oxides, it is not possible to reach the magnifications levels of TEM to observe the bar-code structures. Coating of these catalysts with a conductor will mask the inherent bar-codes. Reduction of the catalyst to enhance conductivity is a possibility, but due to oxidation of the metal during handling and the inherent semi-conductor nature of the catalyst, high resolution/magnification SEM investigation is not possible.
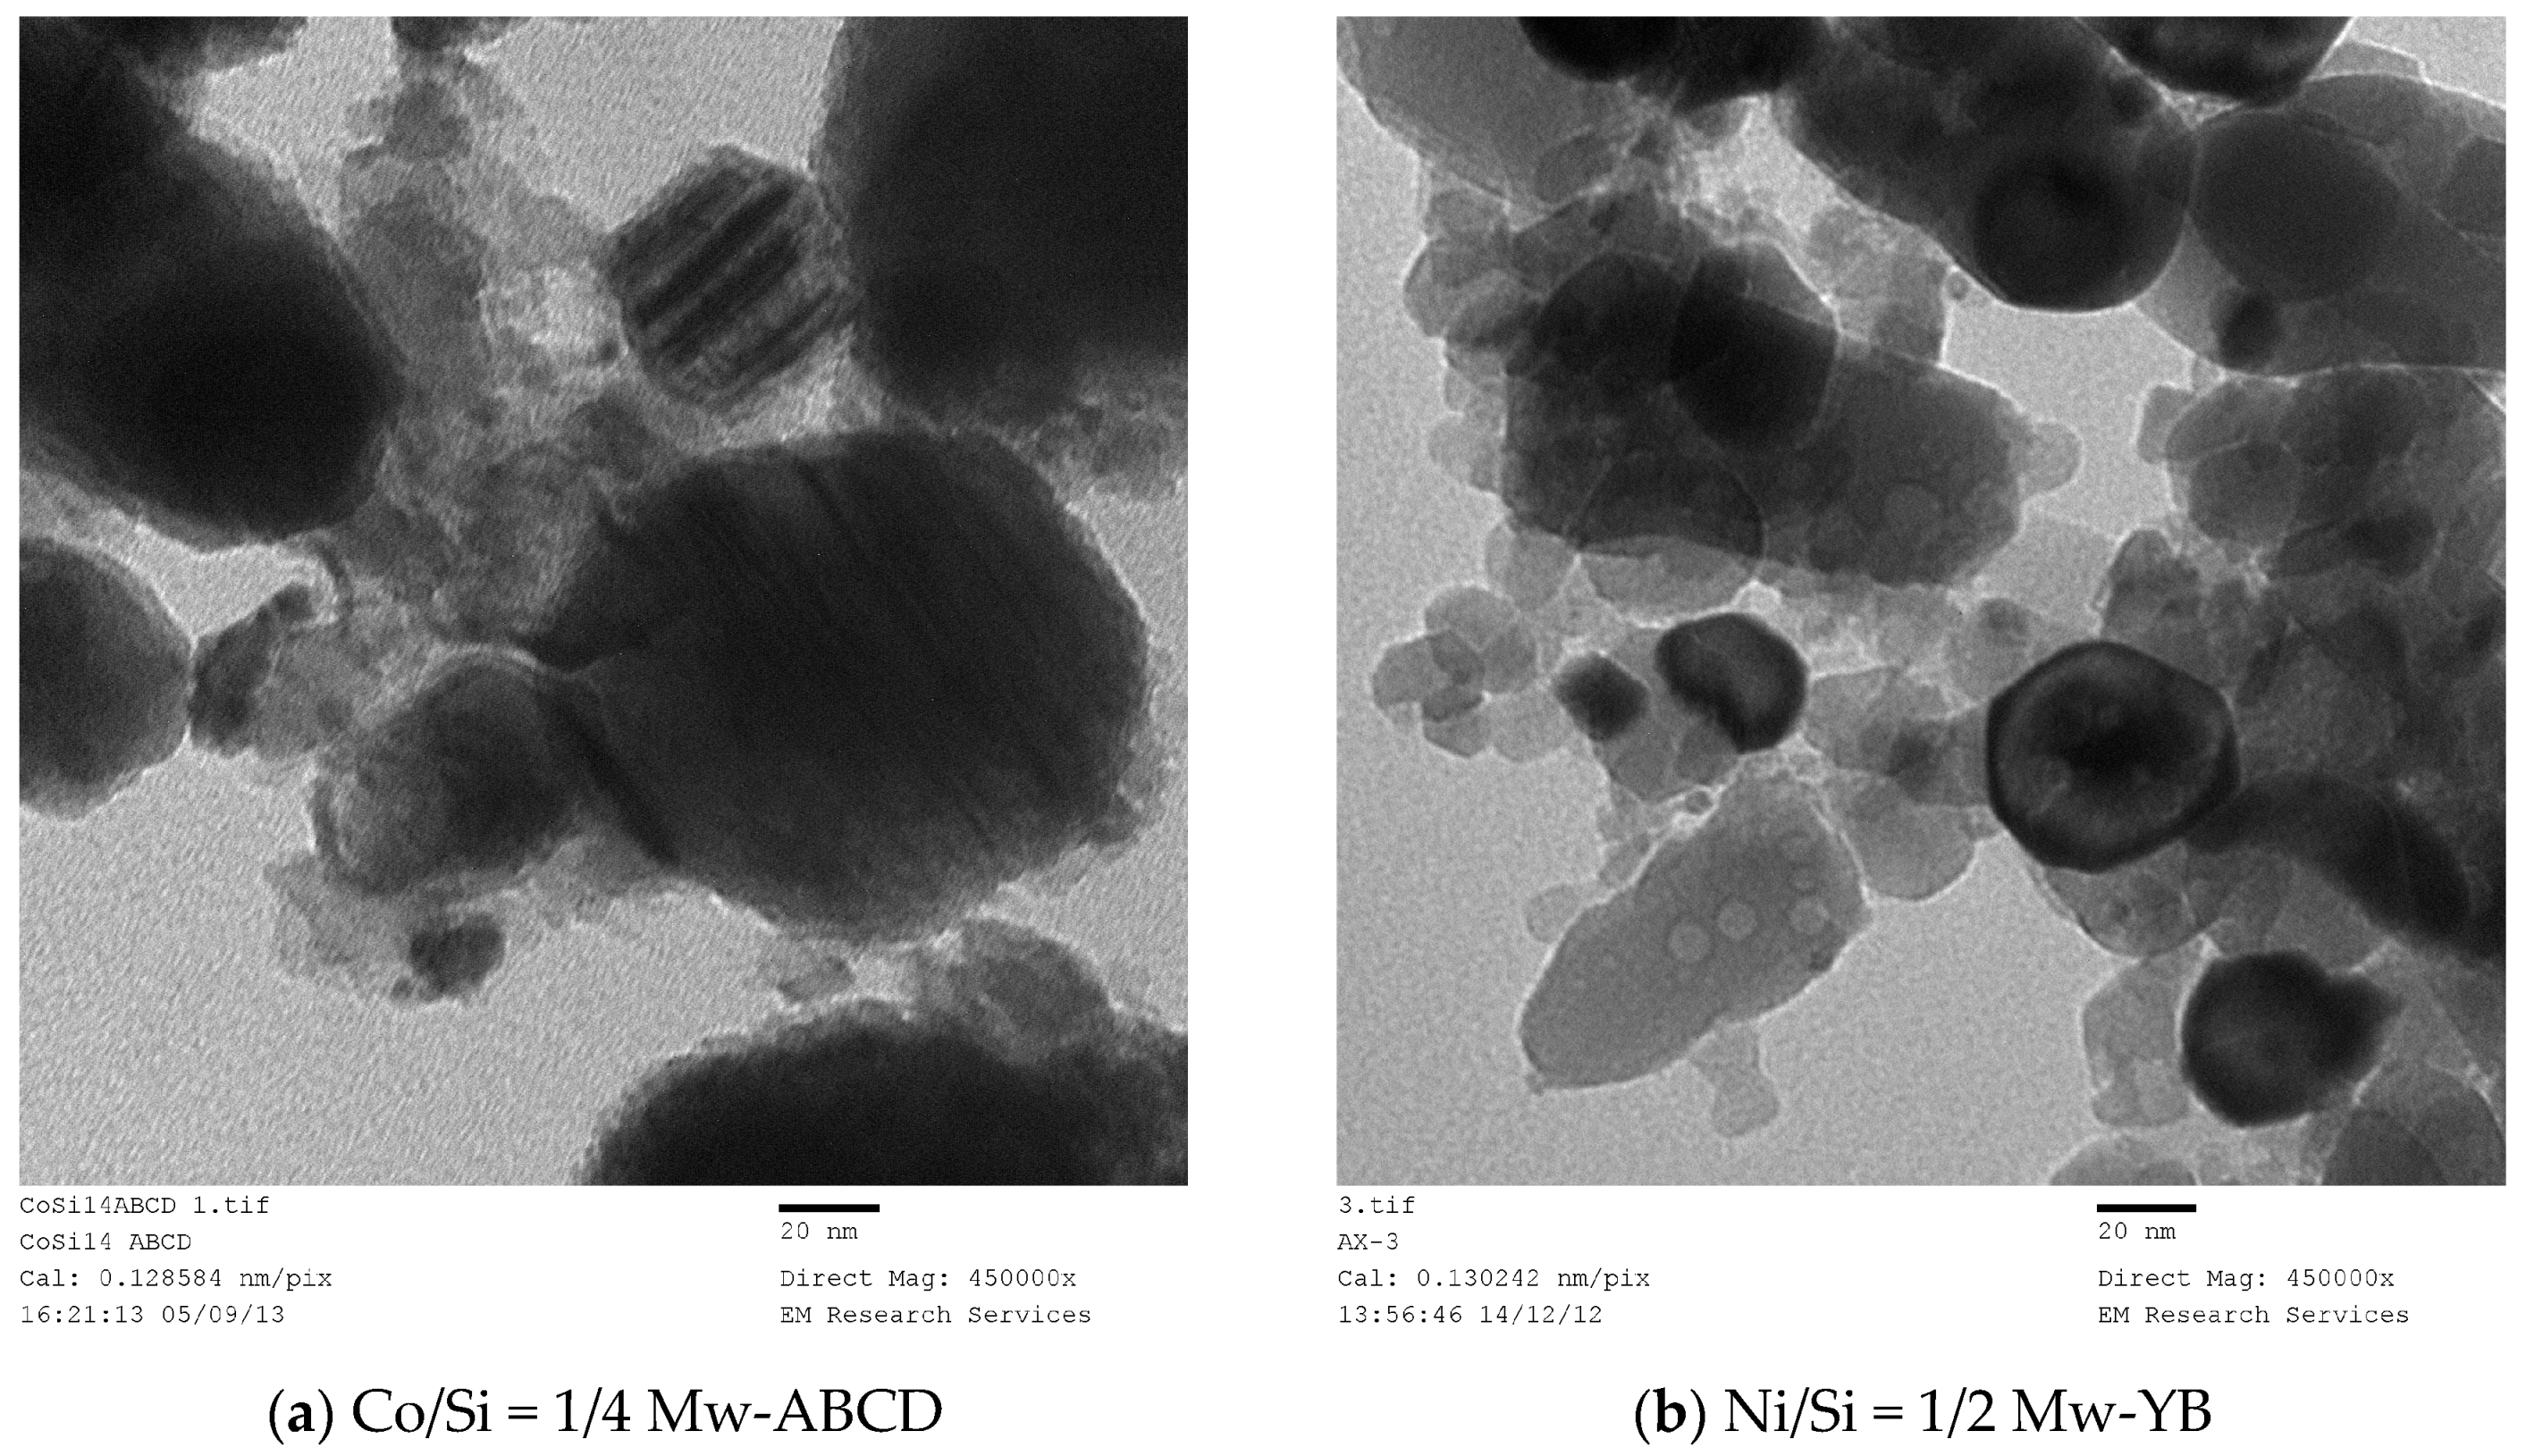
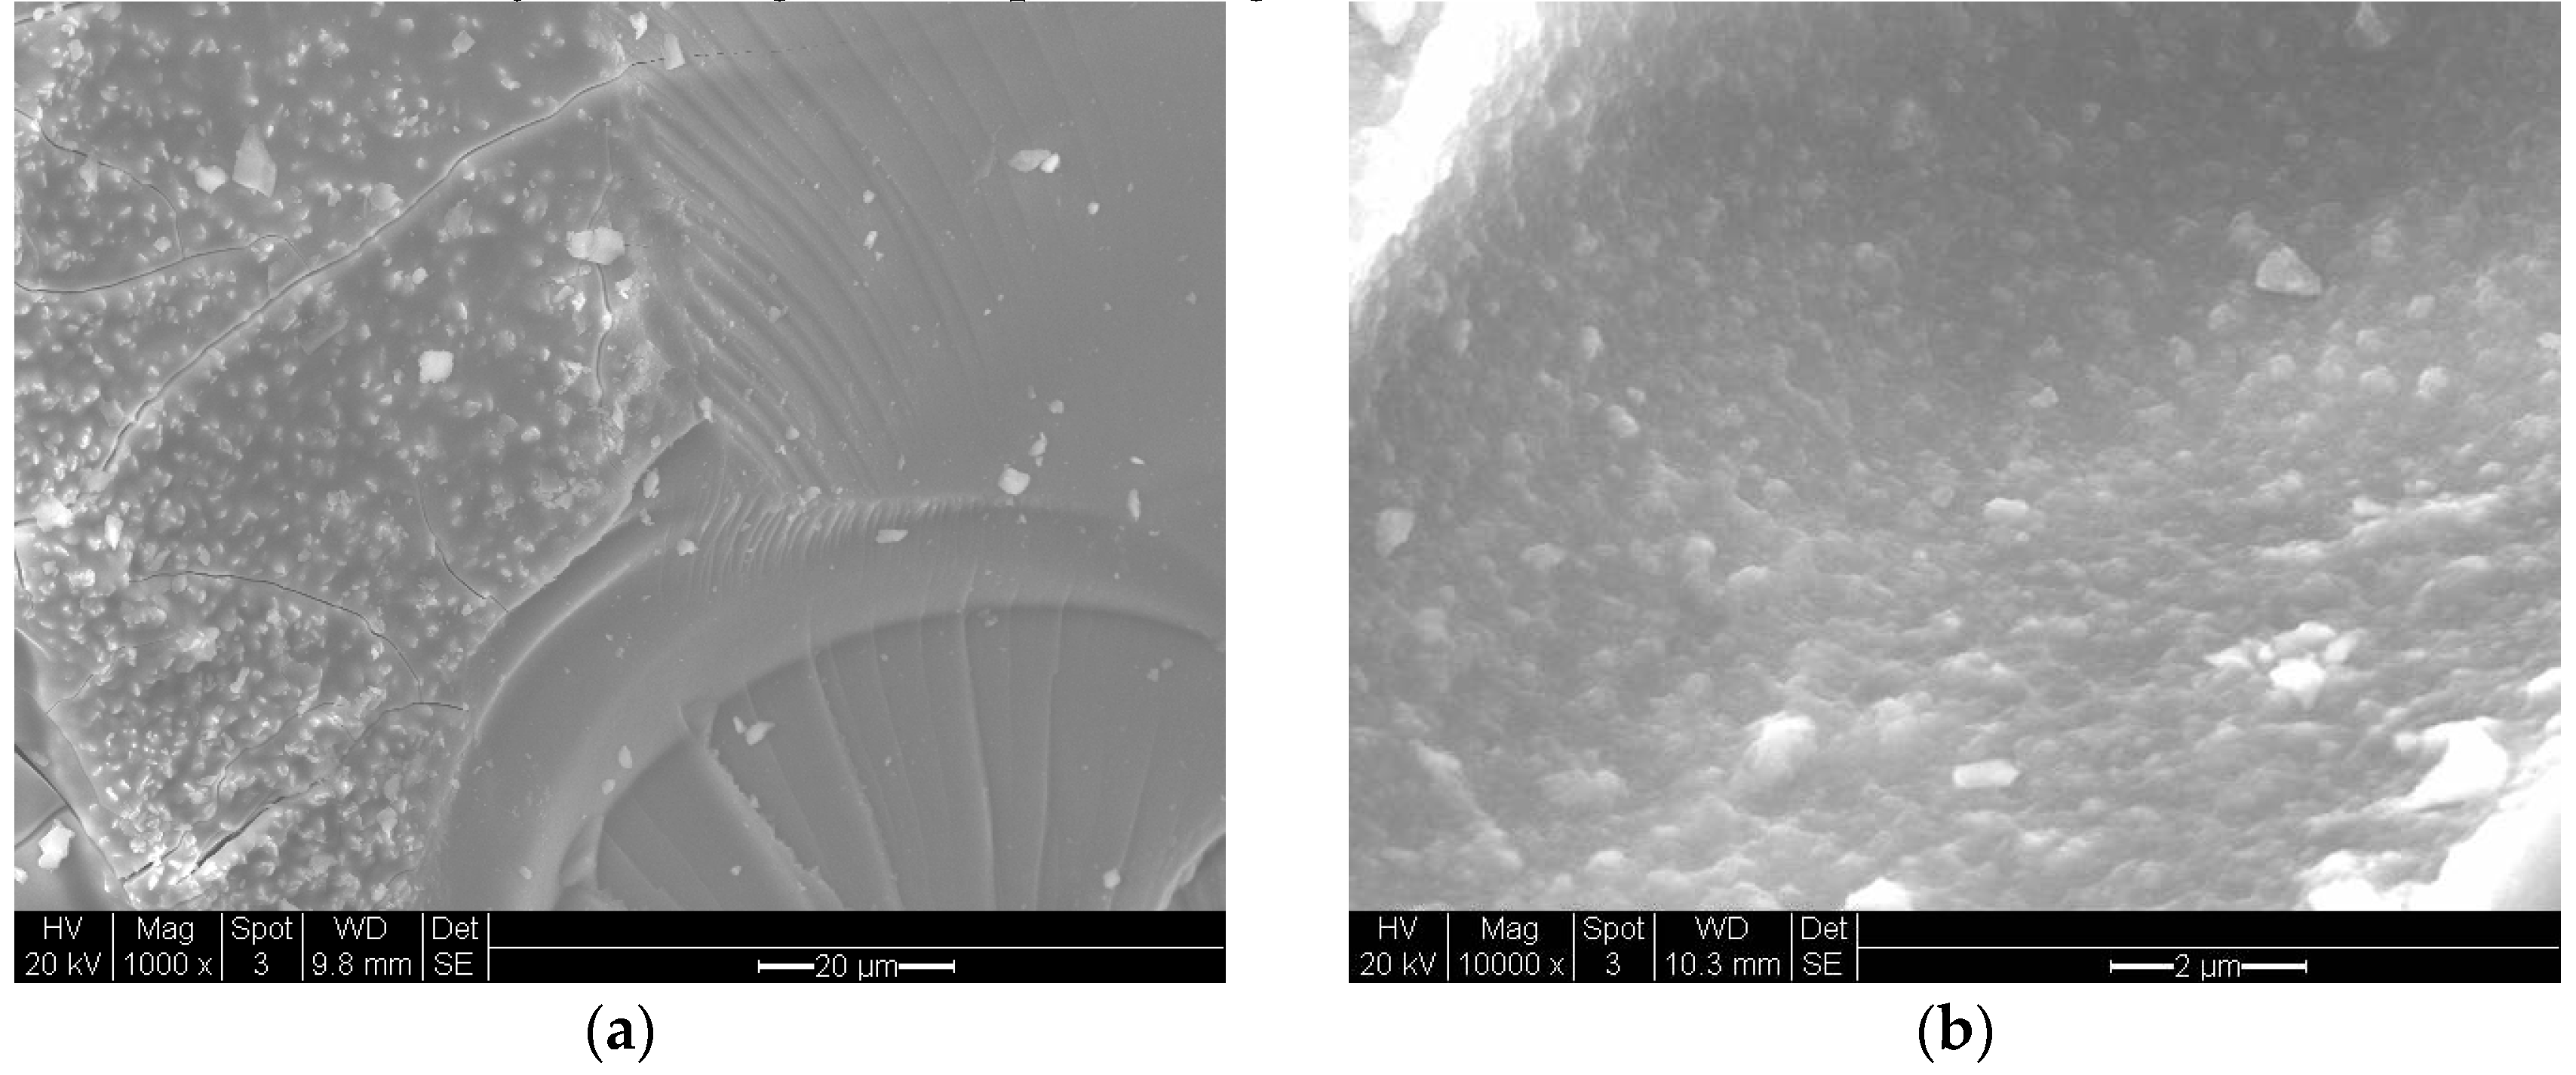
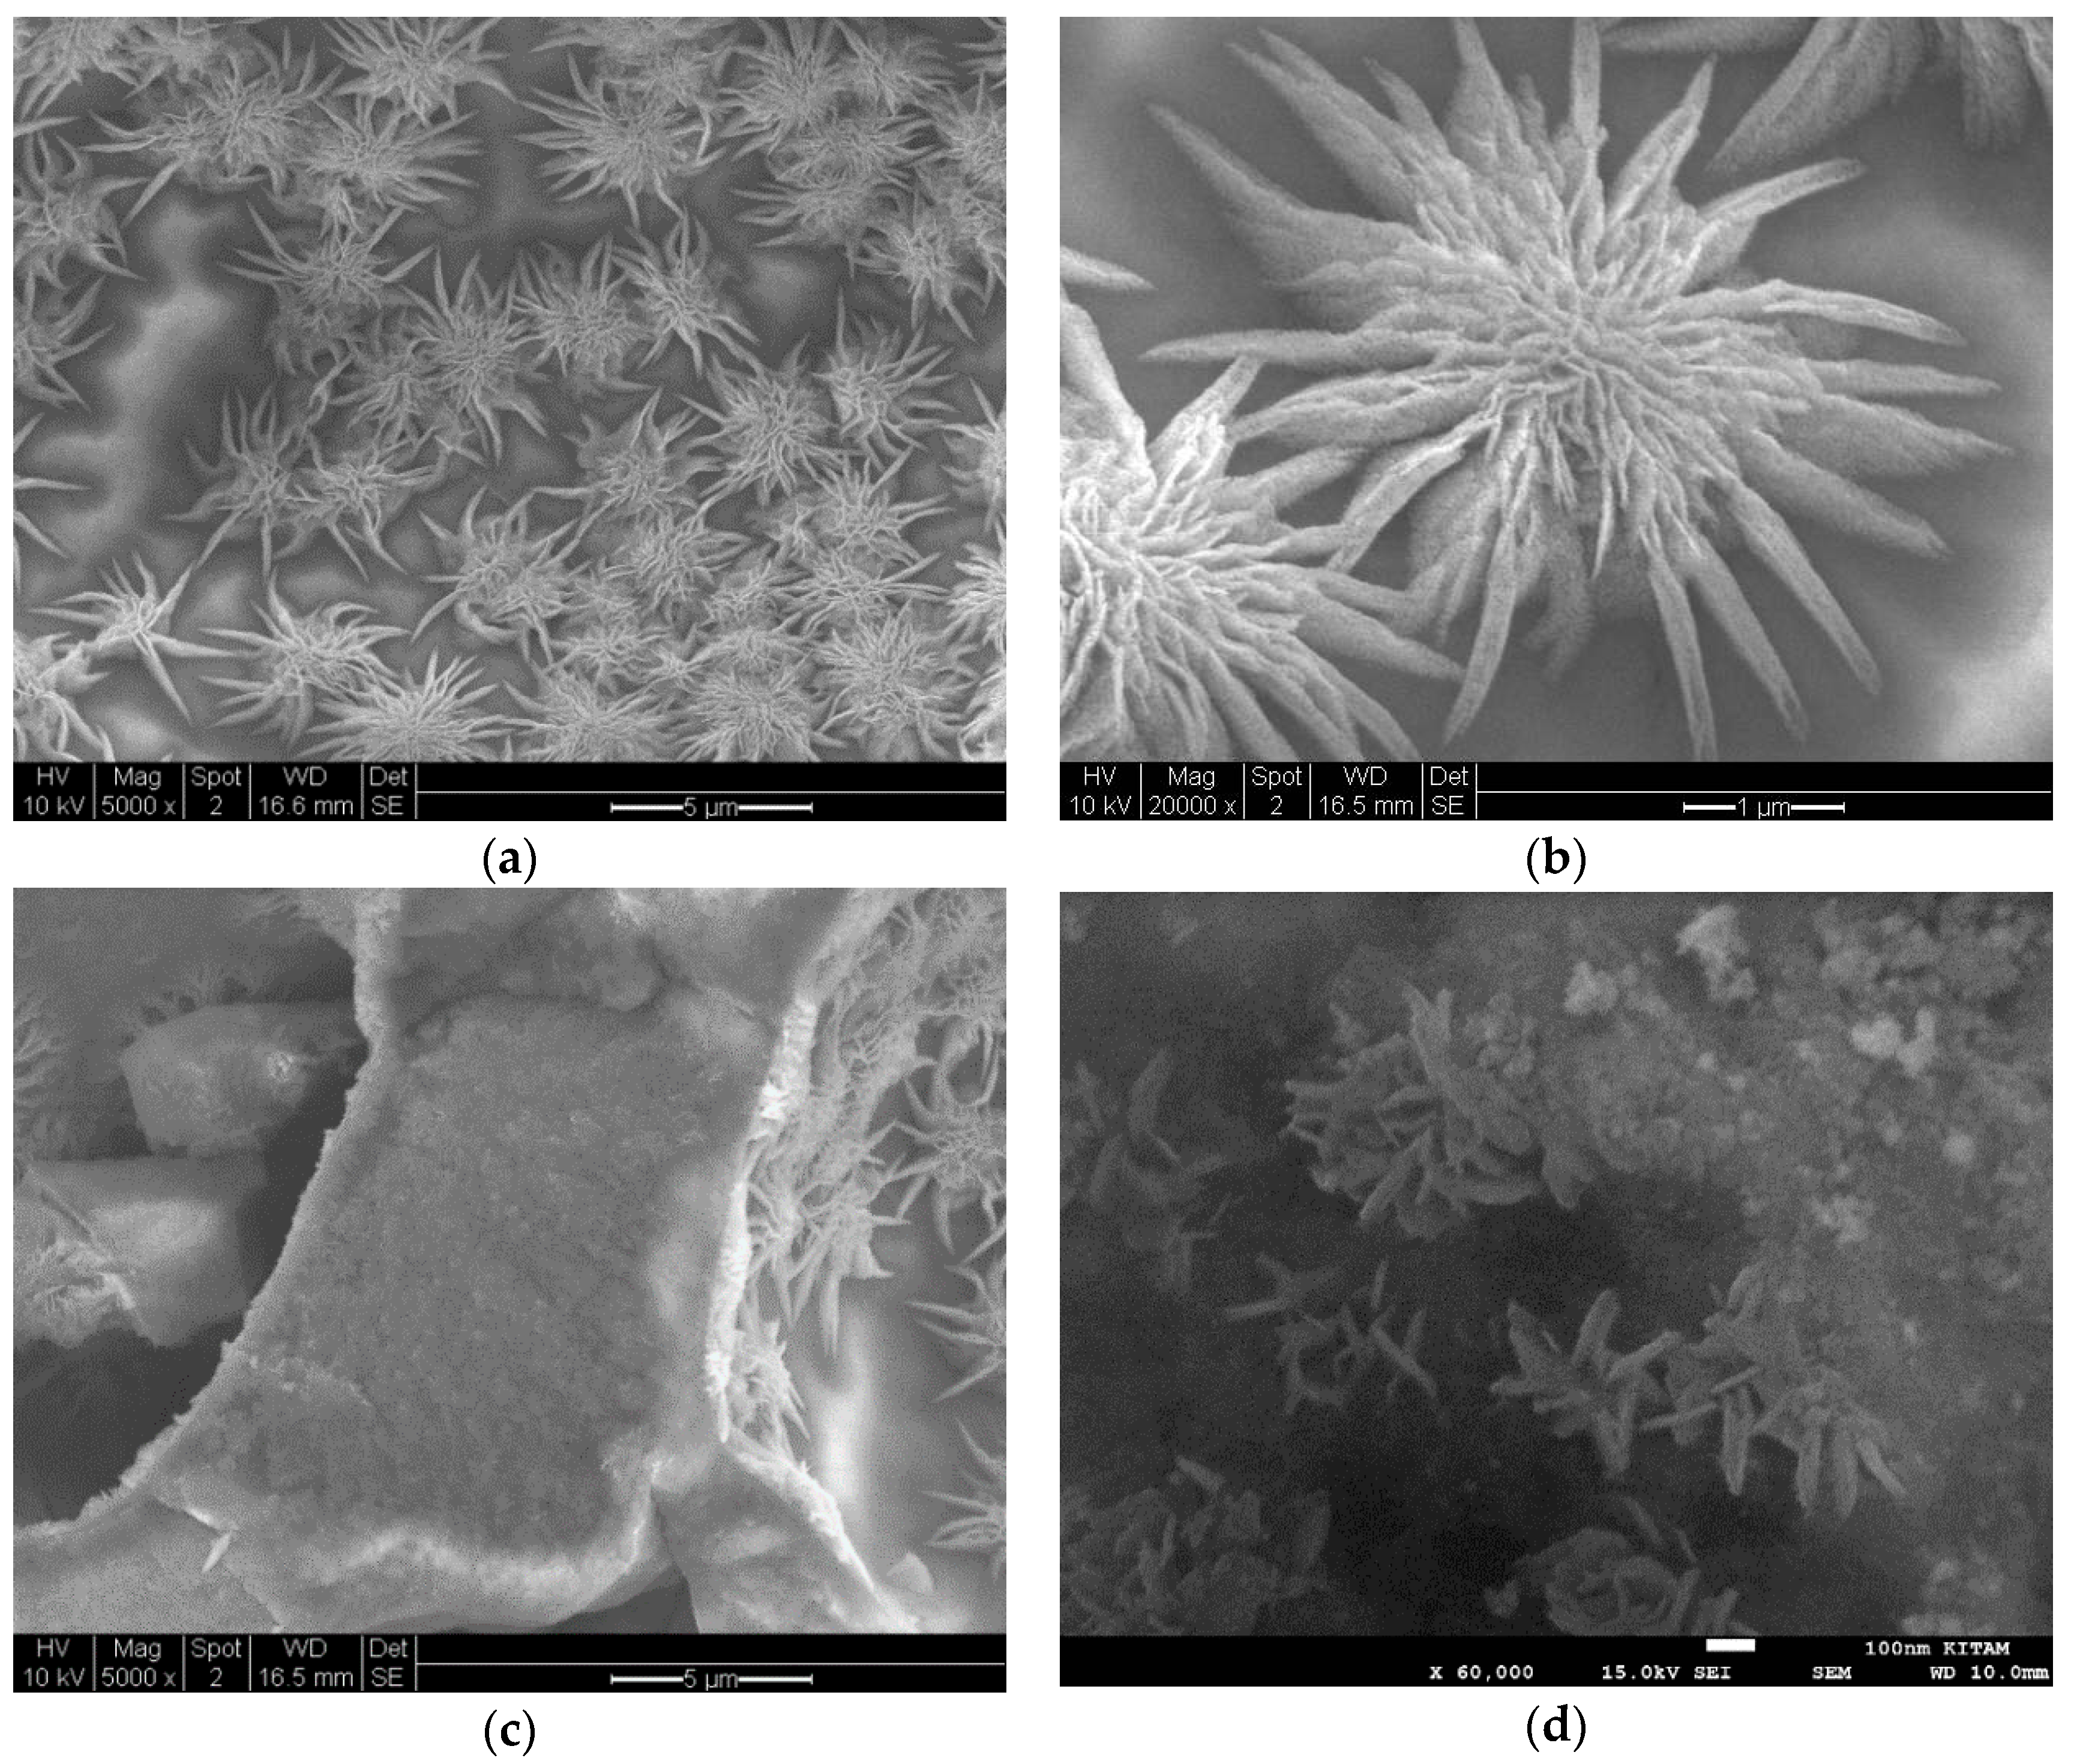
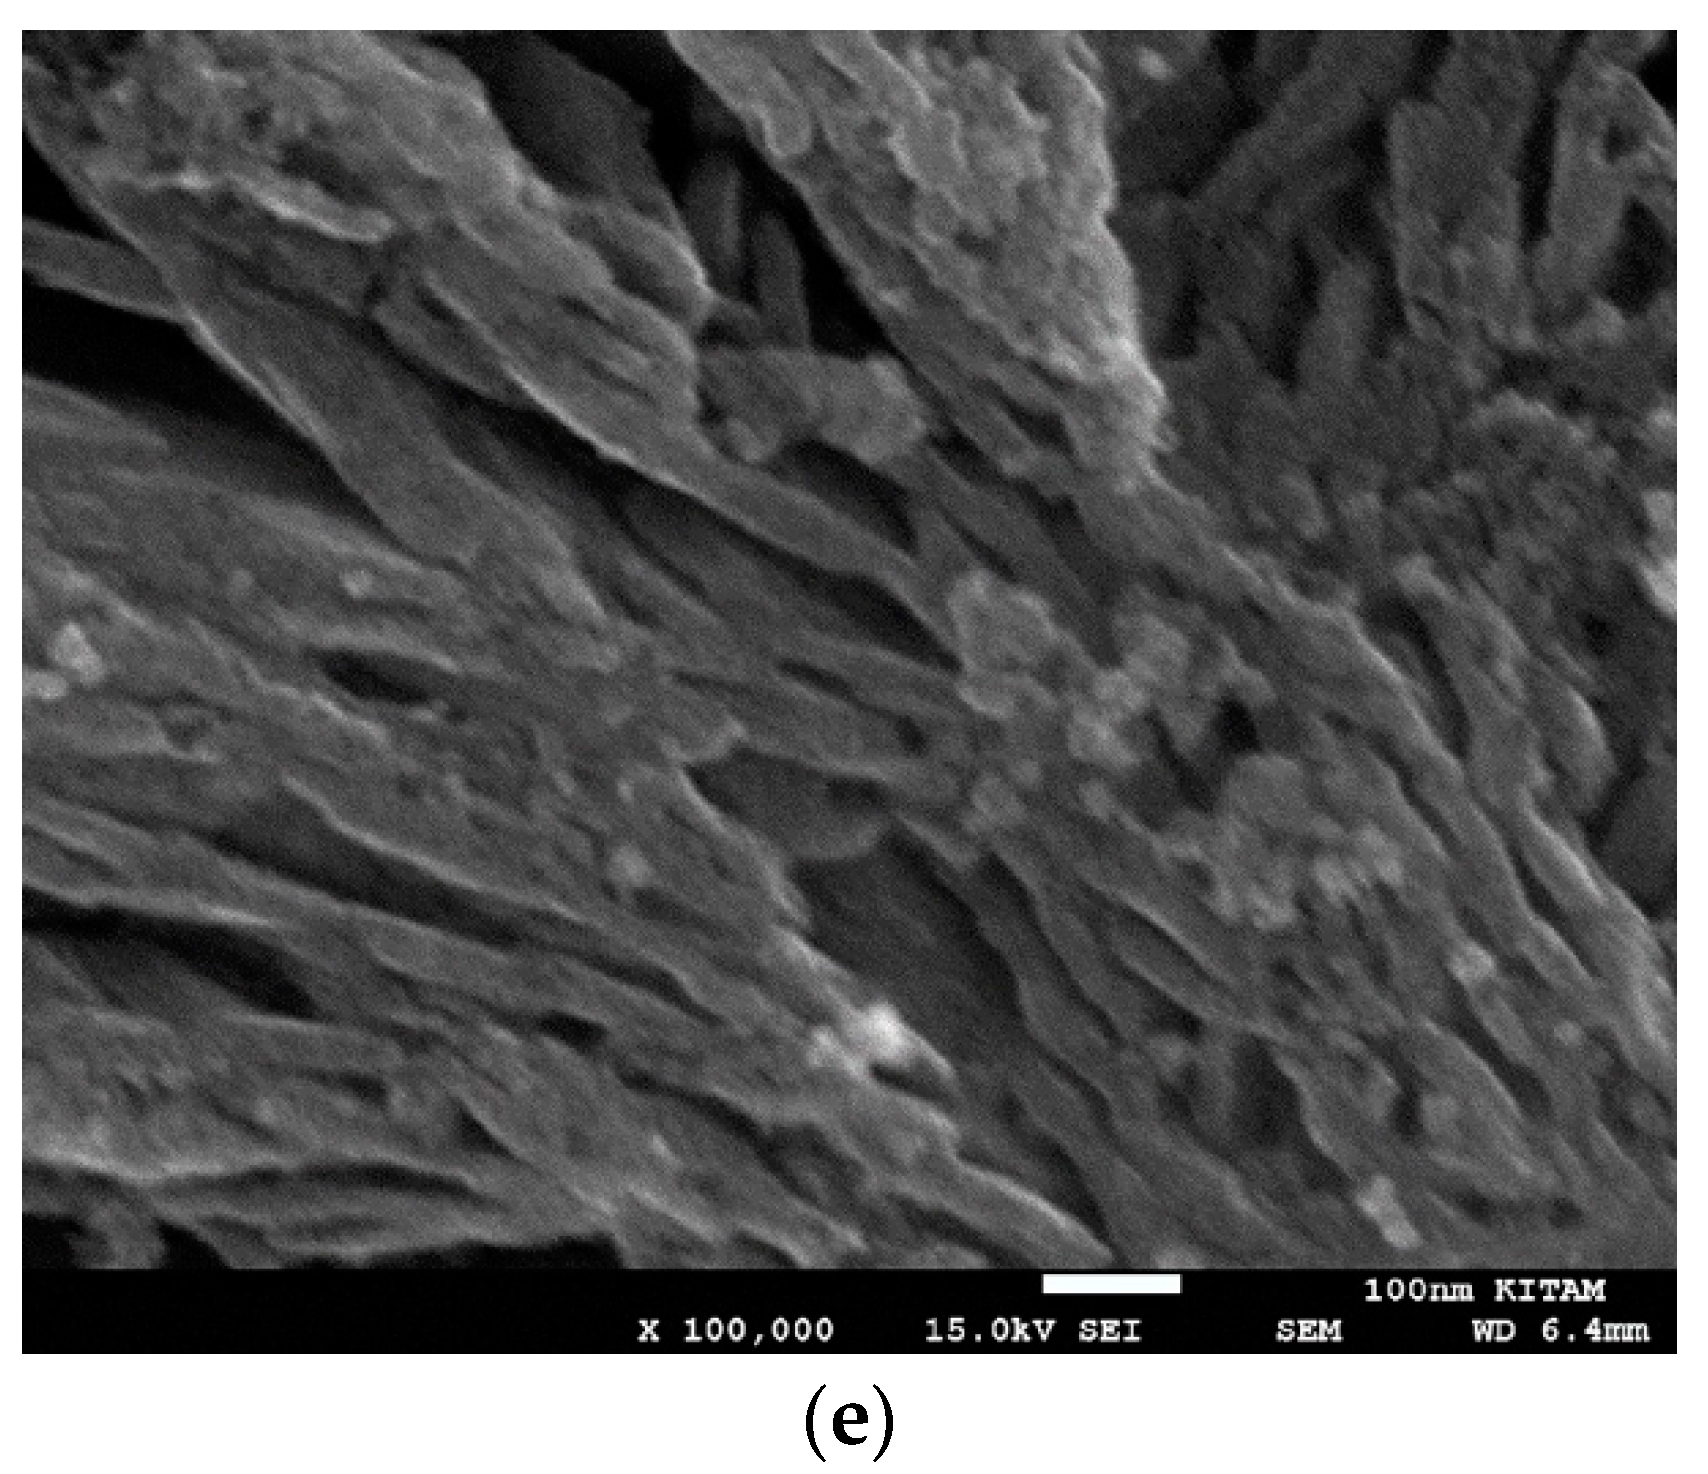
In order to observe the presence of the ribbon structure under SEM, it is however possible to obtain large planar structures grown from the self-associated ribbons. One such system was found to be Co/Cu/Si = 1/1/8 Mw-A system ([Co]/[Cu]/[Si] = 1/1/8 so that ([Co]+[Cu])/[Si] = 1/4). The high magnification SEM images of this sample after microwave irradiation are shown in
Figure 28. In this binary catalyst system, there is a separation into Co and Cu rich phases. In these flower-like structures, the atomic composition was Co/Cu/Si = 1/1.44/3.12 as determined by EDX analysis. These flower-like structures are formed from planes with thickness in the range of
ca. 50 nm–200 nm, although the large structures are clearly formed from thinner planes. The length of the large planes can be as high as 1 micron. These observations are shown in
Figure 28a–c. As seen in
Figure 28a,b, the planar structures appear to grow as they emerge from the walls of the catalyst wall which is dominantly silica rich (
Figure 28c,d). These flower-structures fade when the binary catalyst is heat treated at 600 °C as in fact shown in
Figure 18c.
The walls in the form of ribbons have a surface skin layer of silica with thickness
ca. 2 nm as seen from
Figure 22c,f and
Figure 23b. However, there is no evidence of the presence of the 7 nm silica particles anywhere in the TEM images of the silica systems investigated. In fact, these particles were conspicuously absent on the walls of the ellipsoidal bubbles or between the catalyst strips/planes forming the bar-code appearance in the ribbon structures. Spherical silica particles only appear occasionally (
Figure 24b), but their size is often below 7 nm. The absence of the original catalyst support particles and formation of planar bar-code structures with catalyst/silica separation as low as 0.6 nm should be explained in the mechanism of present catalyst preparation technique.
The apparent absence of silica particles in the catalyst structure can be explained if we consider that the primary silica particles revert back to the proto-silica particle state. The fumed silica is obtained through flame pyrolysis of silicon tetrachloride. After the generation of SiO
2 molecules, they form proto-particles which are subsequently enlarged (aggregated) to form the stable primary silica particles with size 4 nm or above. These particles can be further agglomerated for some applications. Particle size reduction in nano-silica can be considered to be similar in mechanism to de-lamination of glass which occurs due to the imposition of thermal stresses enhanced by a chemical environment including the presence of electrolytes [
49,
50,
51,
52].
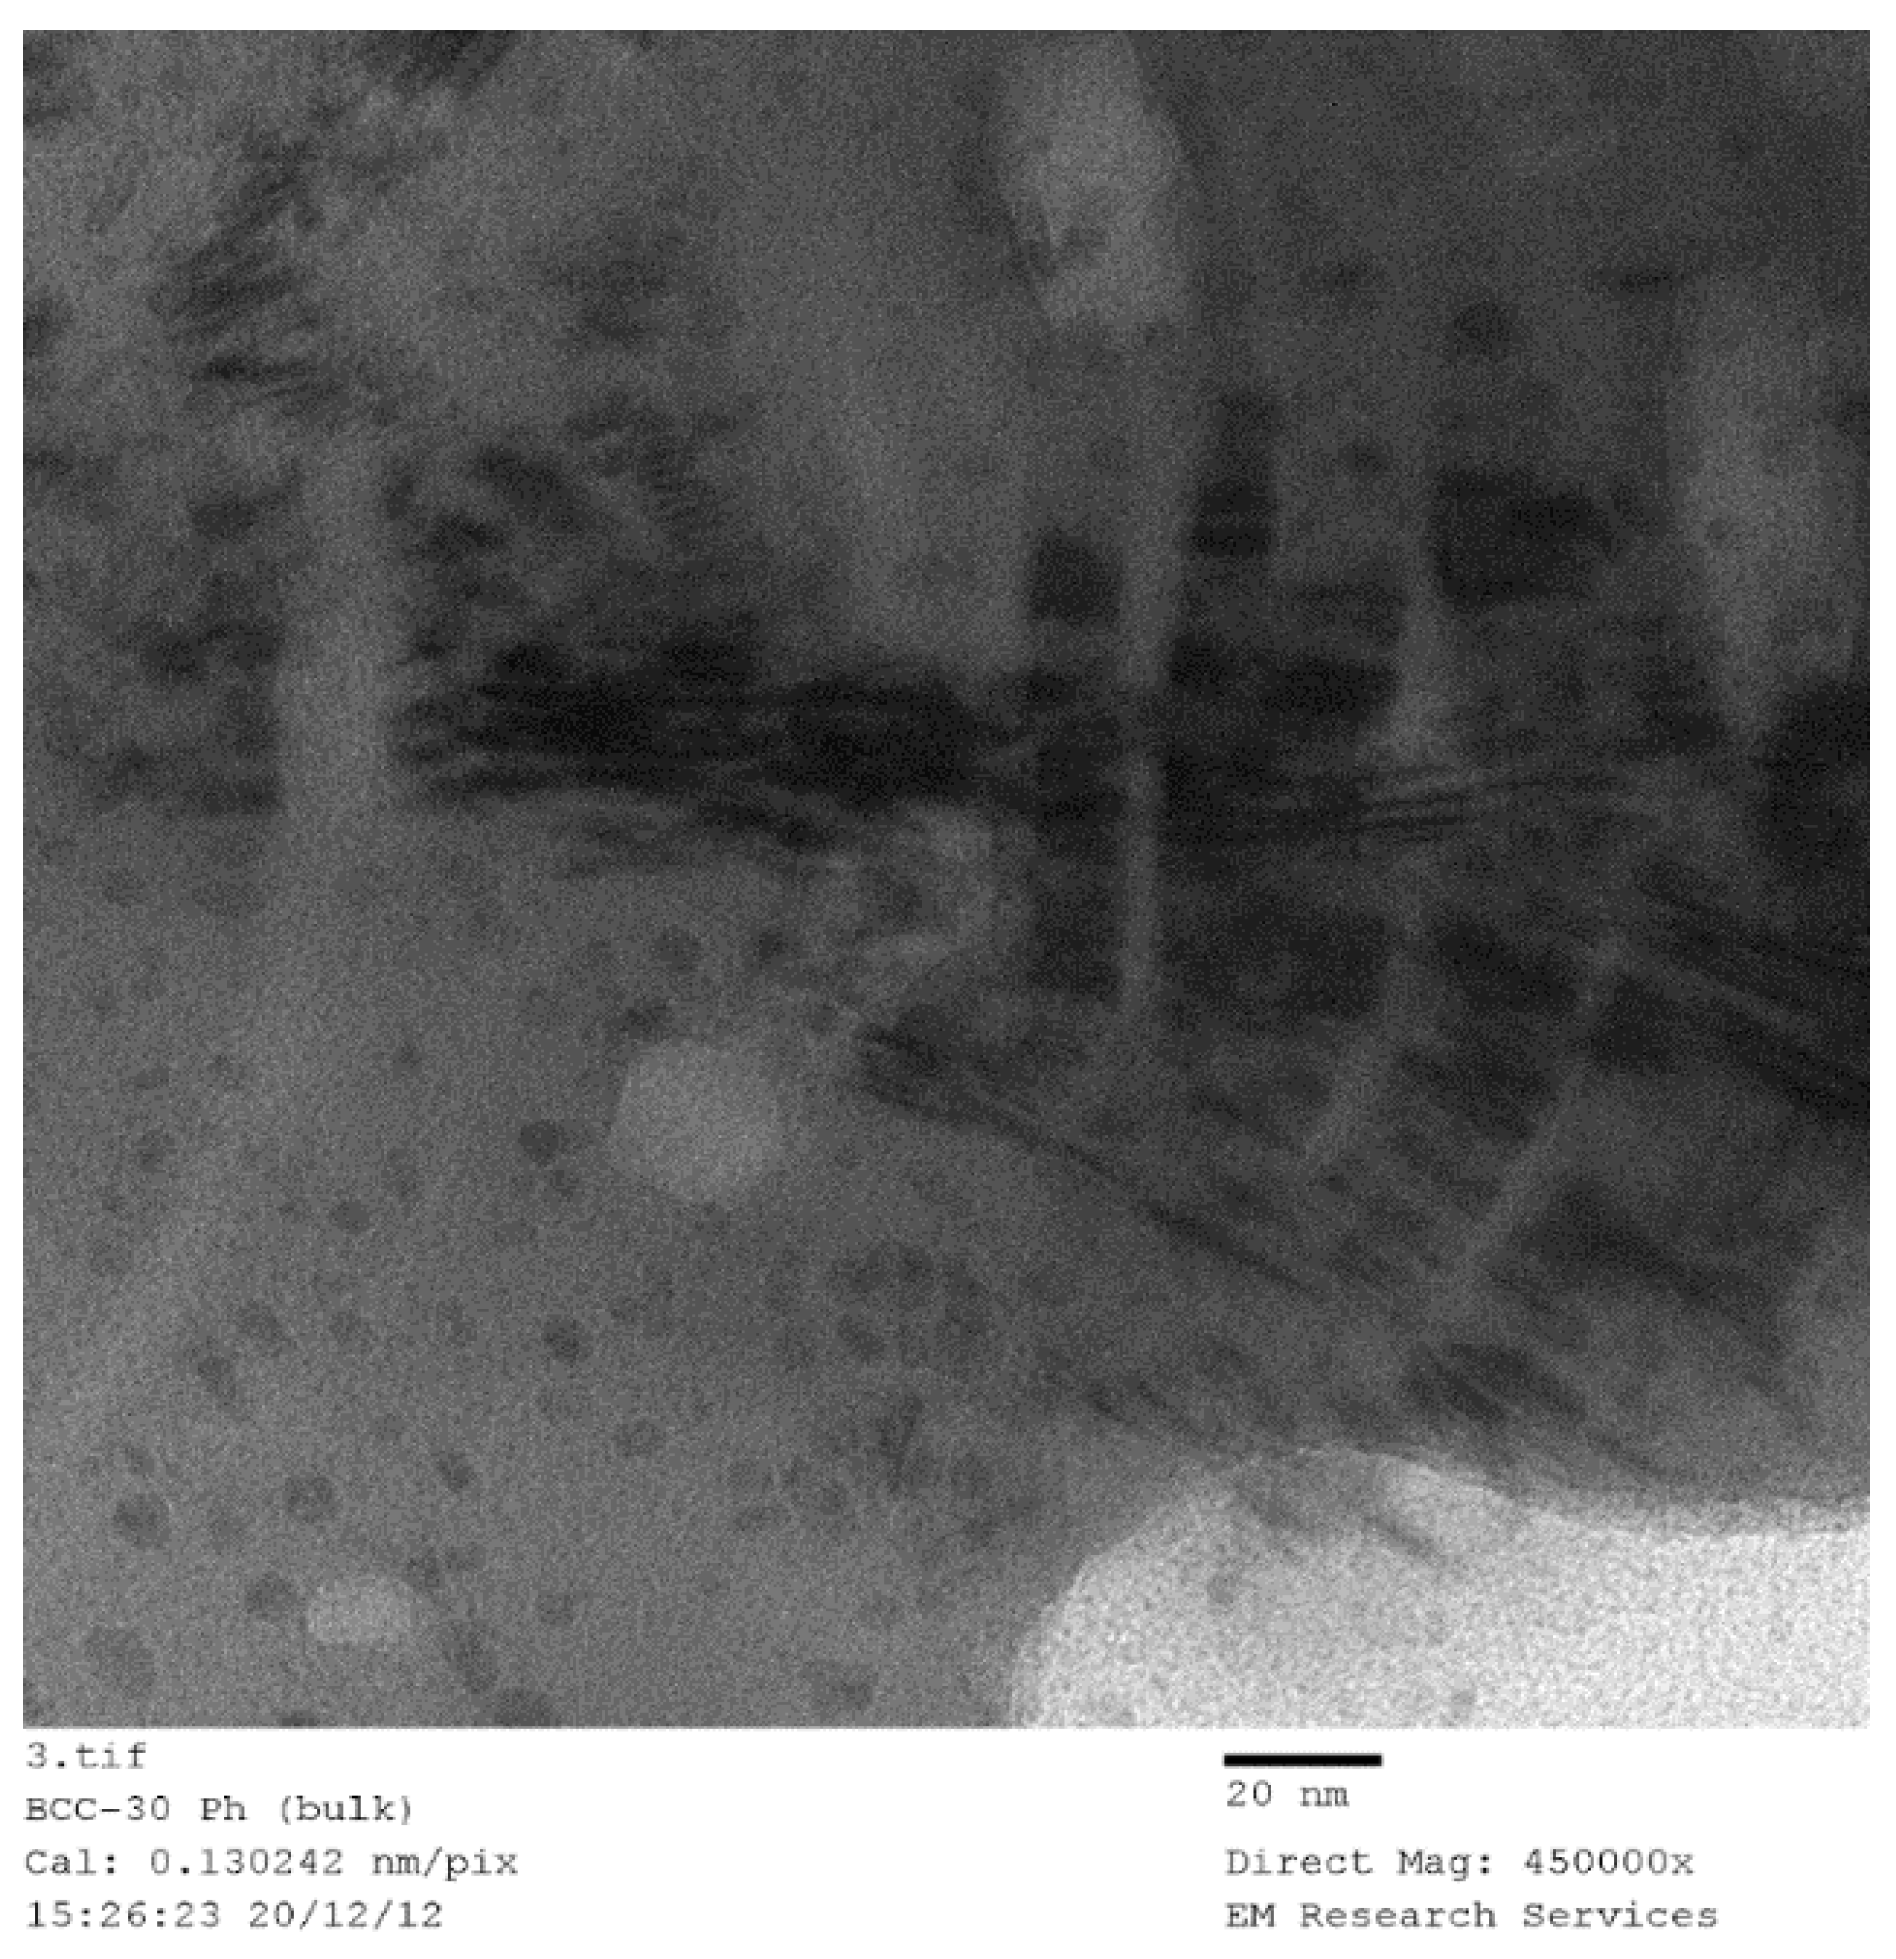
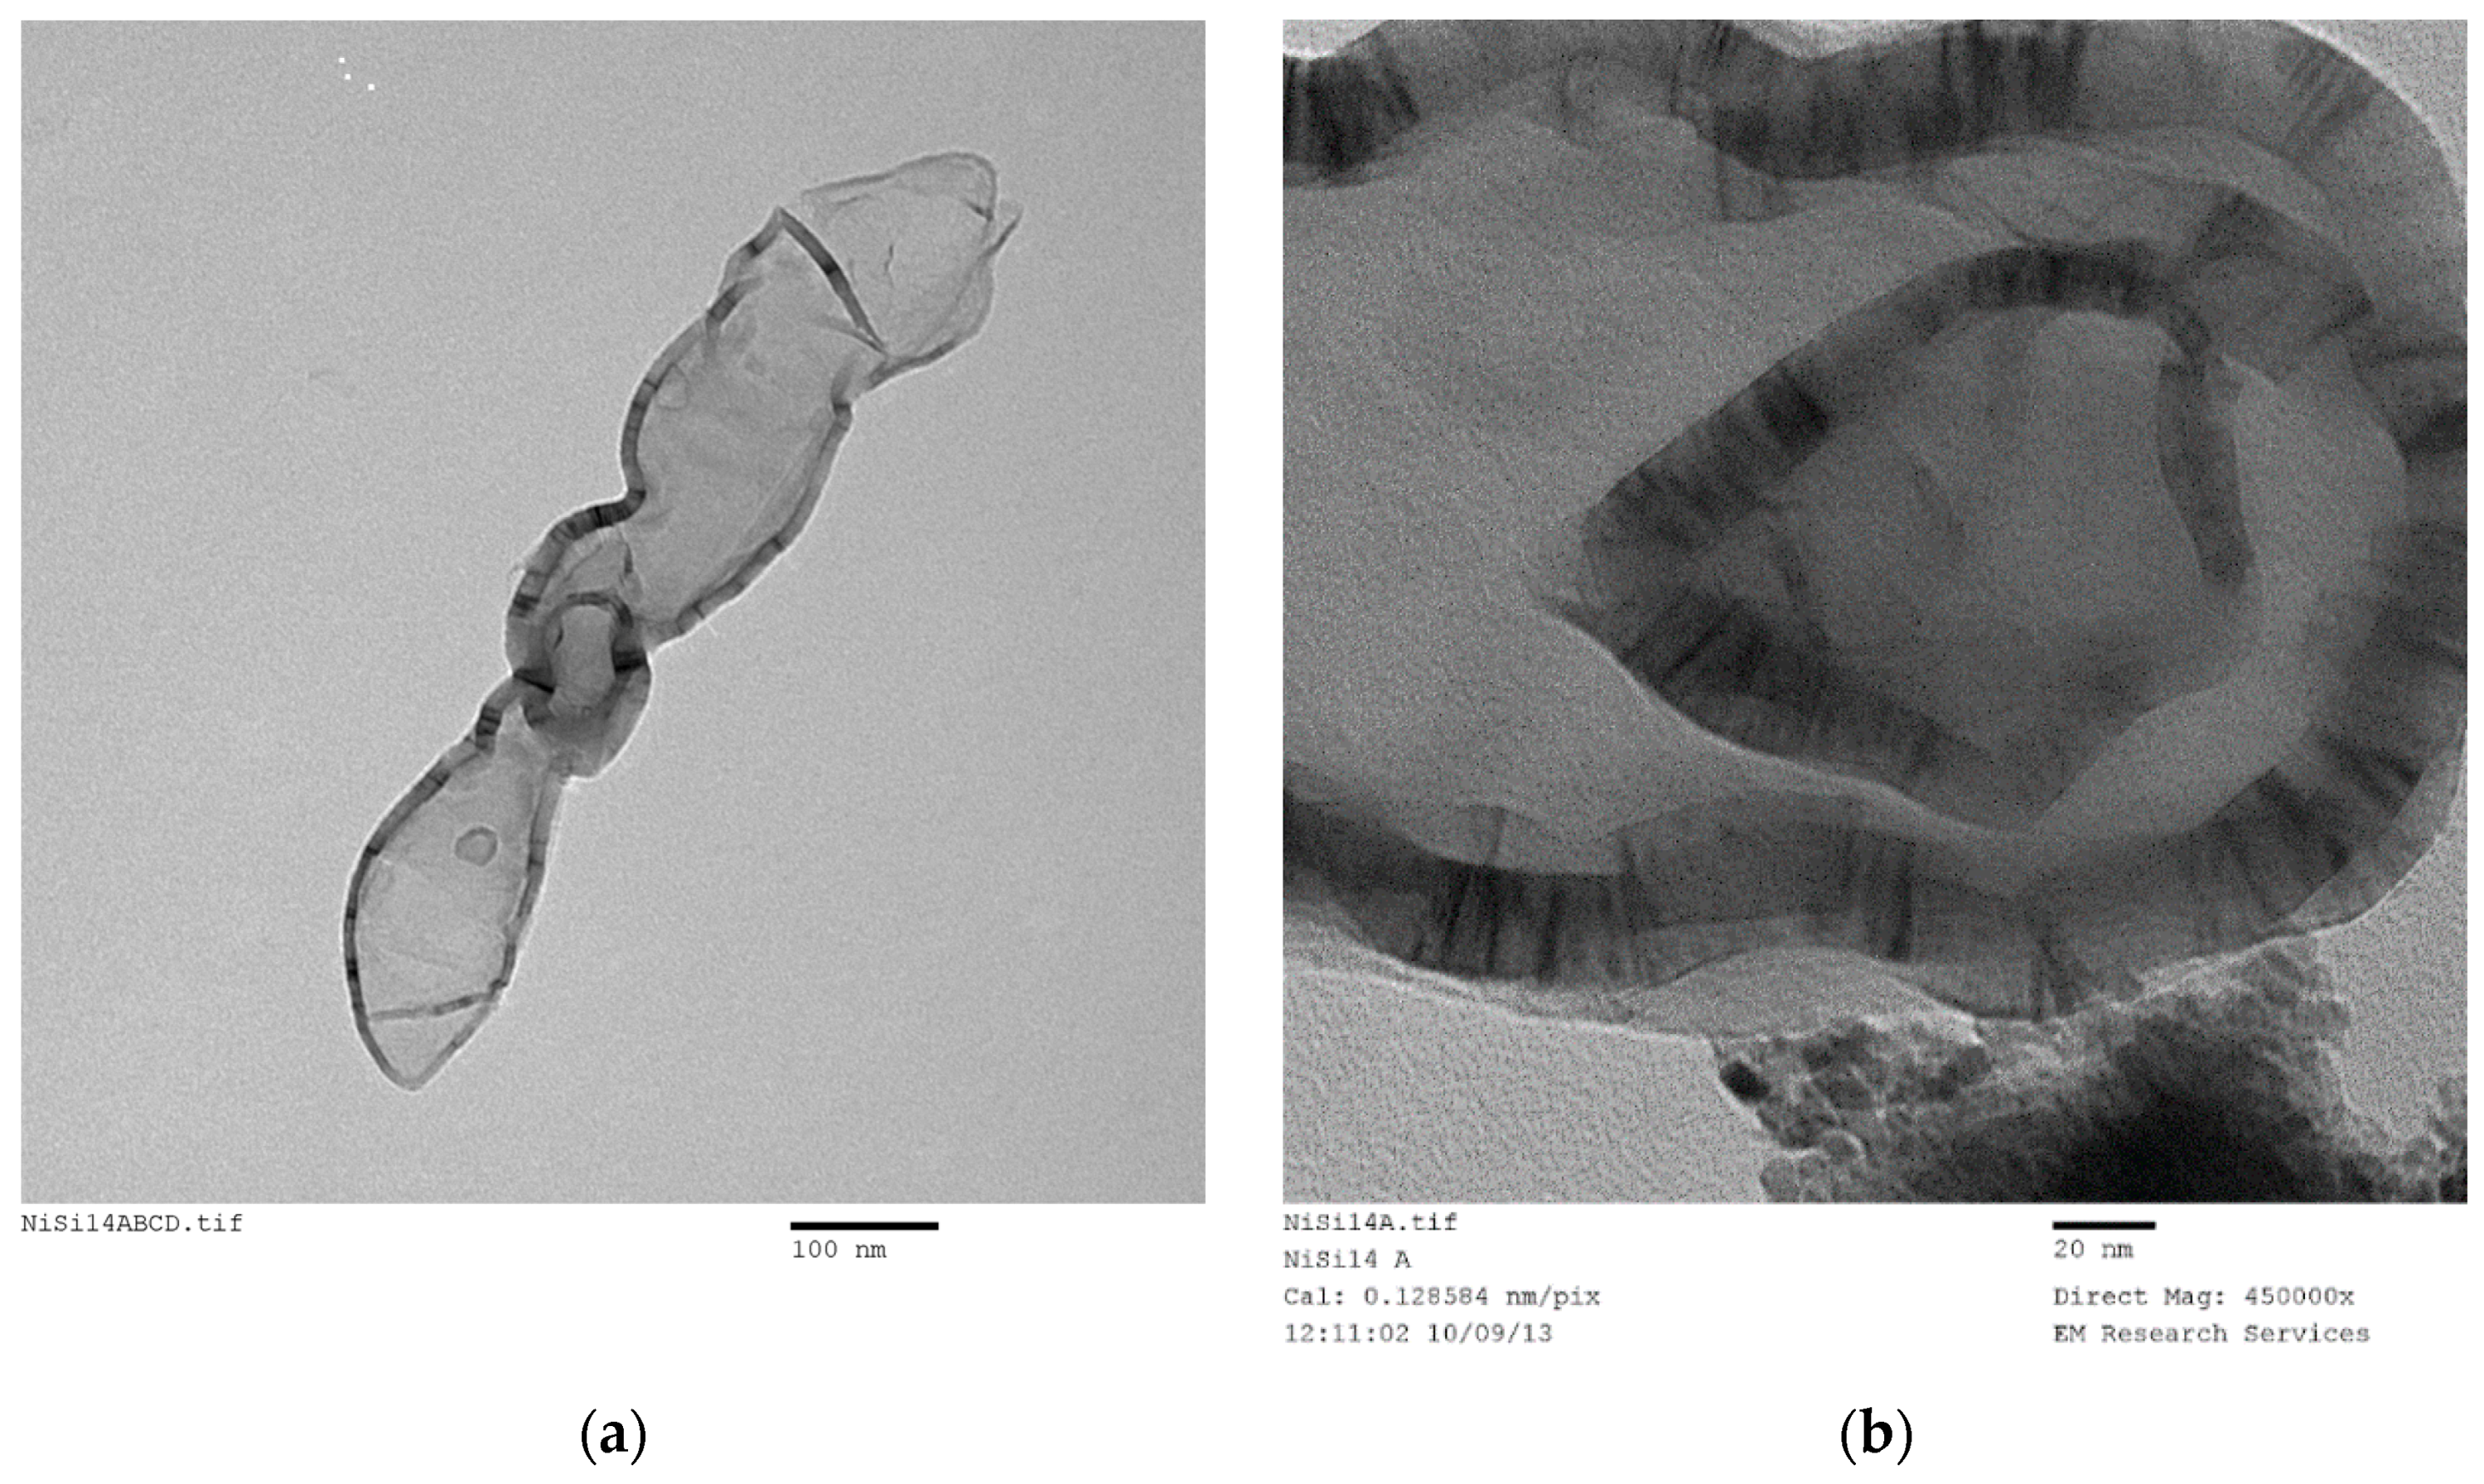
Figure 29 illustrates TEM image of Fe(NO
3)
3 in coated silica dispersion at a molar ratio of [Fe]/[Si] = 1/3 after 30 h of UV-radiation in the agricultural growth cabinet (see
Section 3.10). The liquid sample was taken before the formation of solid flakes of Fe
3O
4/SiO
2 as described in
Section 3.10.
Figure 29 illustrates three features;
Presence of some spherical particles with size ca. 7 nm (i.e., primary silica particles) which appear to be coated by iron
Larger elongated rectangular particles, and
Bar-code structures with varying size and metal-silica regions.
Figure 29 illustrates the possibility of nano-scale de-lamination which should probably be better described as molecular de-aggregation under radiation. Therefore, we can assume that the same process occurs during supported catalyst formation as a result of microwave, thermal or ultrasound radiation or indeed when these processing vectors are combined.
Following the formation of these basic ordered liquid crystal structures which in fact appear to have a similar structure to lyotropic (surfactant-water liquid crystal systems) lamellar self-assembly [
53,
54] as well as molecular liquid crystals in smectic phase [
55]. It is likely that this structure is formed at the air-liquid interface but remains intact once the interface structure returns back into the solution. This is also true for the lyotropic lamellar phase; once formed, these surfactant assemblies can remain stable for months even after dilution in water when they are expected to form micelles before the thermodynamic equilibrium is established [
53,
54]. It is likely that the smectic phase appearance of the ordered structures in
Figure 29 is due to the presence of proto-silica particles with silane coating and those without any silane coating.
This assumption is in agreement with the optical rheometry observations when a bubble is formed at the tip of a syringe and irradiated by light to measure the response of the bubble to the changes in its volume. In the presence of Fe(NO3)3, bubble response was a solid-like behavior indicating that the air/liquid interface has been stabilized with a network of silica.
During microwave or thermal or UV-radiation of the catalyst precursor liquid, the liquid films/bubbles are formed. These structures are stabilized by the formation of the bar-code structures at the air-liquid interface. However, during this process, water evaporates thus generating hollow bubbles. These bubbles form a highly porous structure when the evaporation is complete. Subsequently, the decomposition of catalyst precursor starts provided that the energy density is sufficient for a given catalyst system.
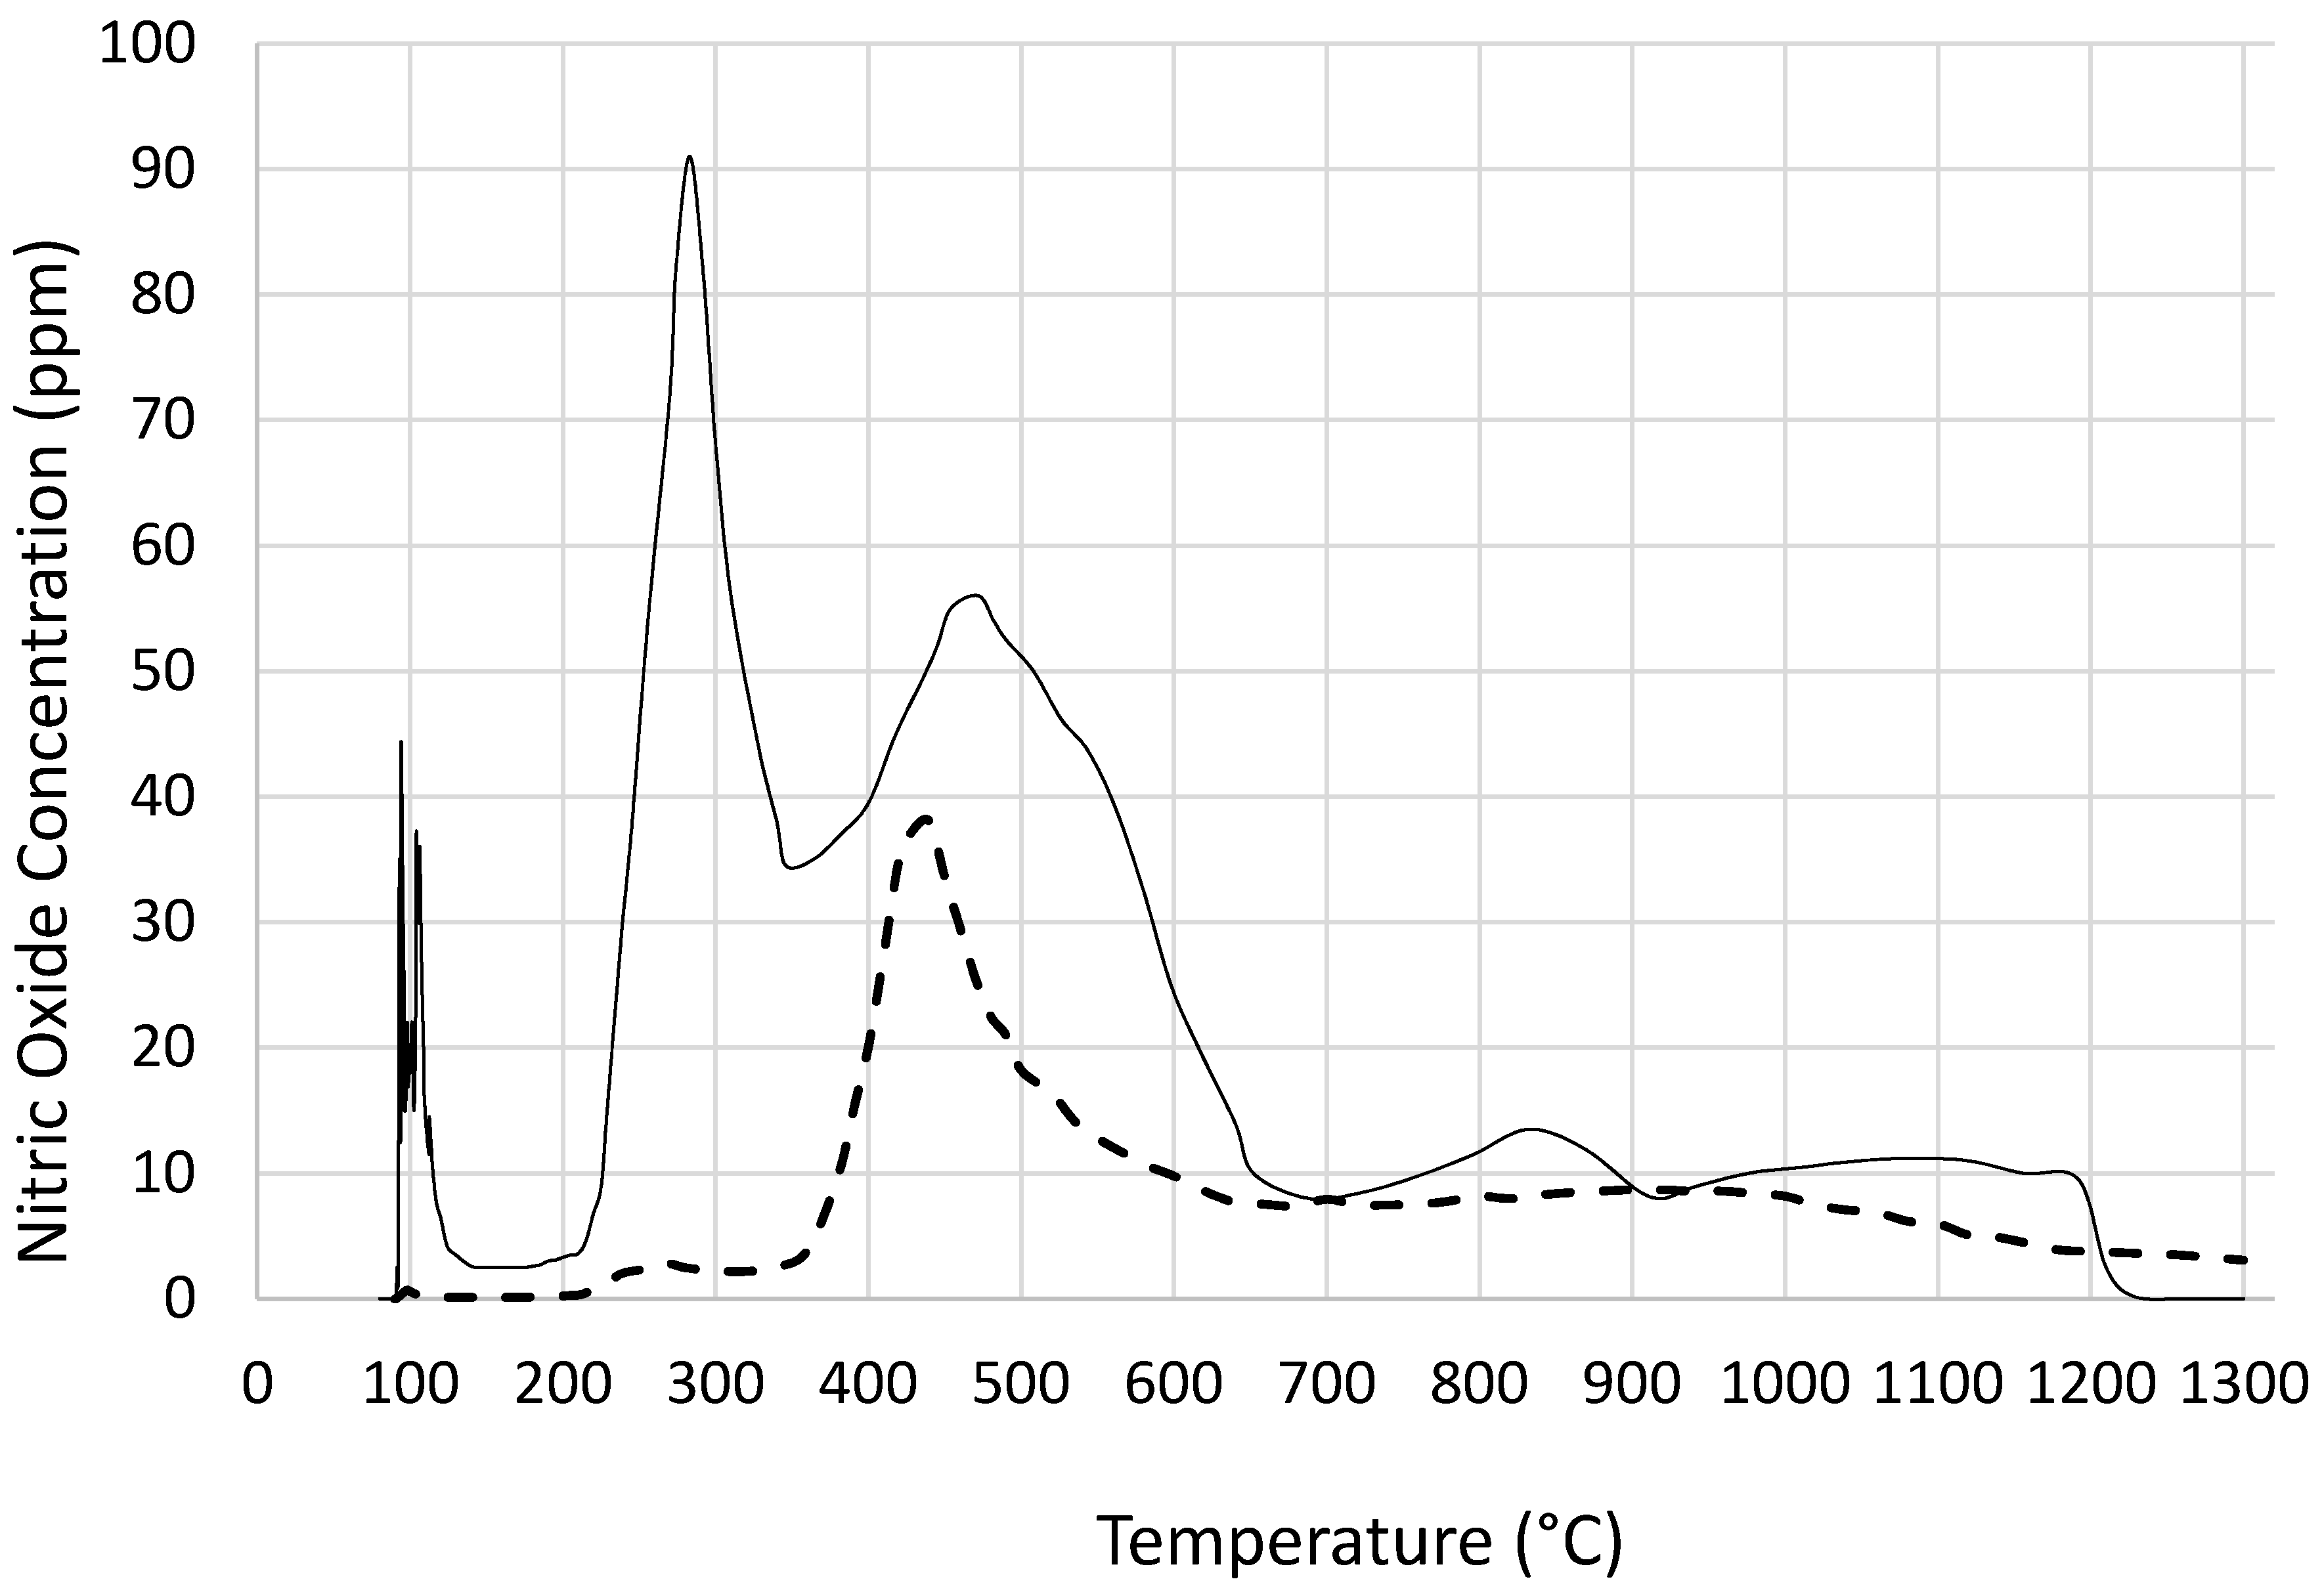
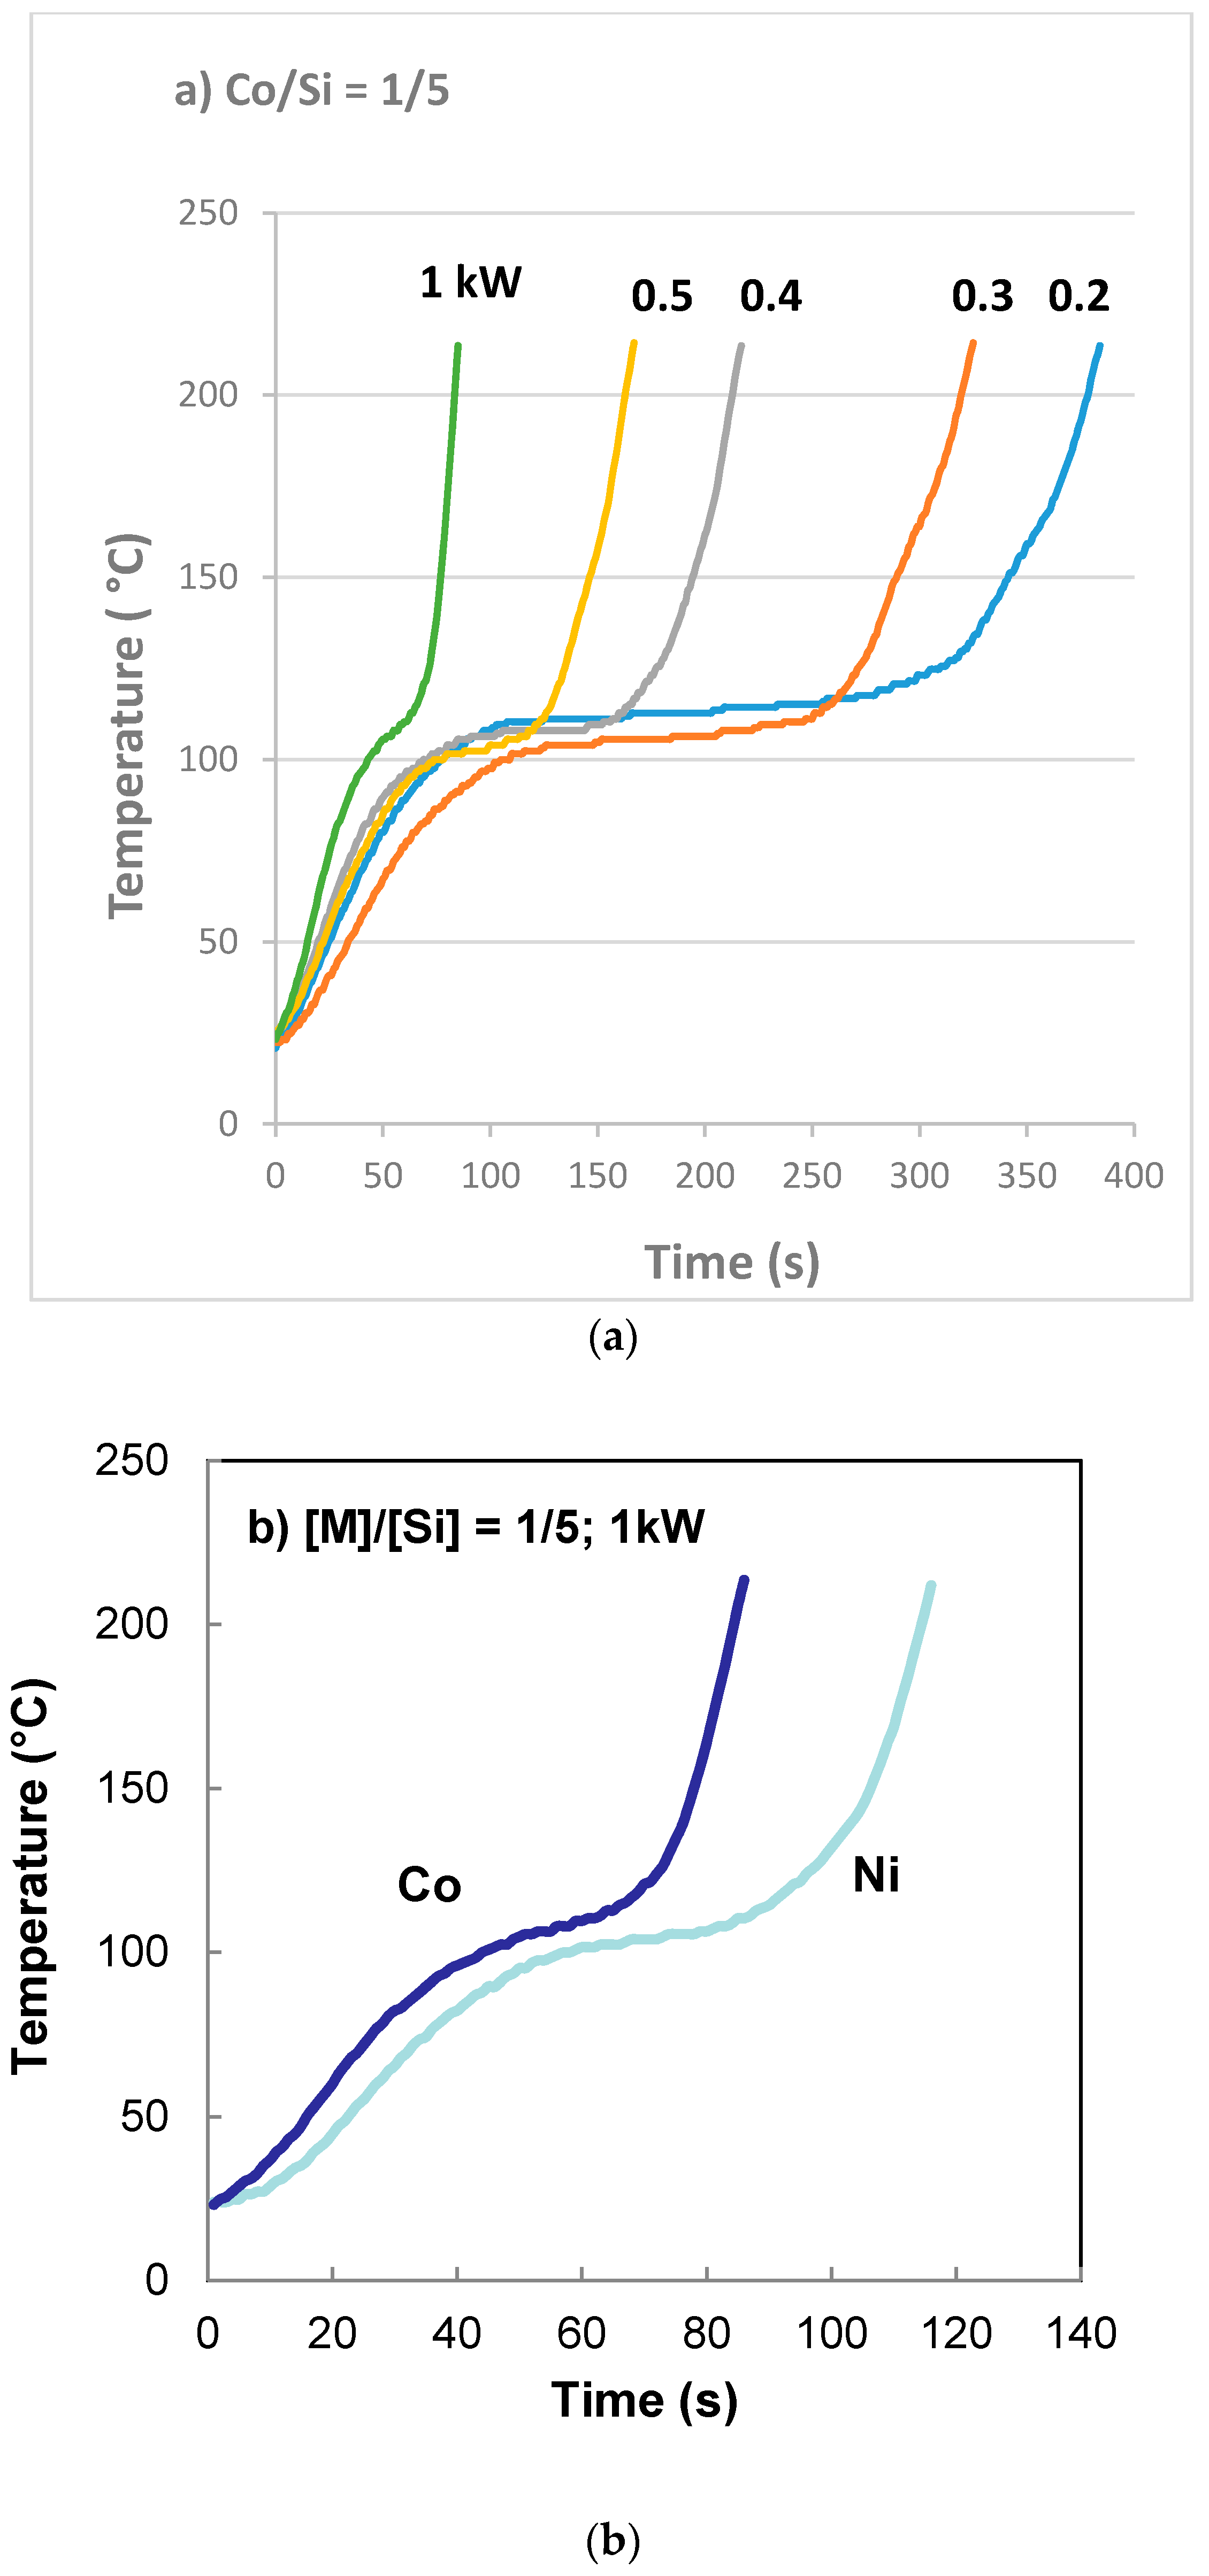
Essentially, this decomposition takes place within nano-scale reactors in the form of porous walls formed by the bar-code ribbons. As seen in
Figure 9, catalyst precursor salt decomposition in fact takes place at significantly lower temperatures (
ca. 140 °C) compared with the decomposition in the absence of coated silica. The temperature programmed pyrolysis of cobalt nitrate and support precursor dispersion (
Figure 3) also shows that the decomposition was detected at 90 °C whereas, cobalt nitrate without coated silica starts decomposition at
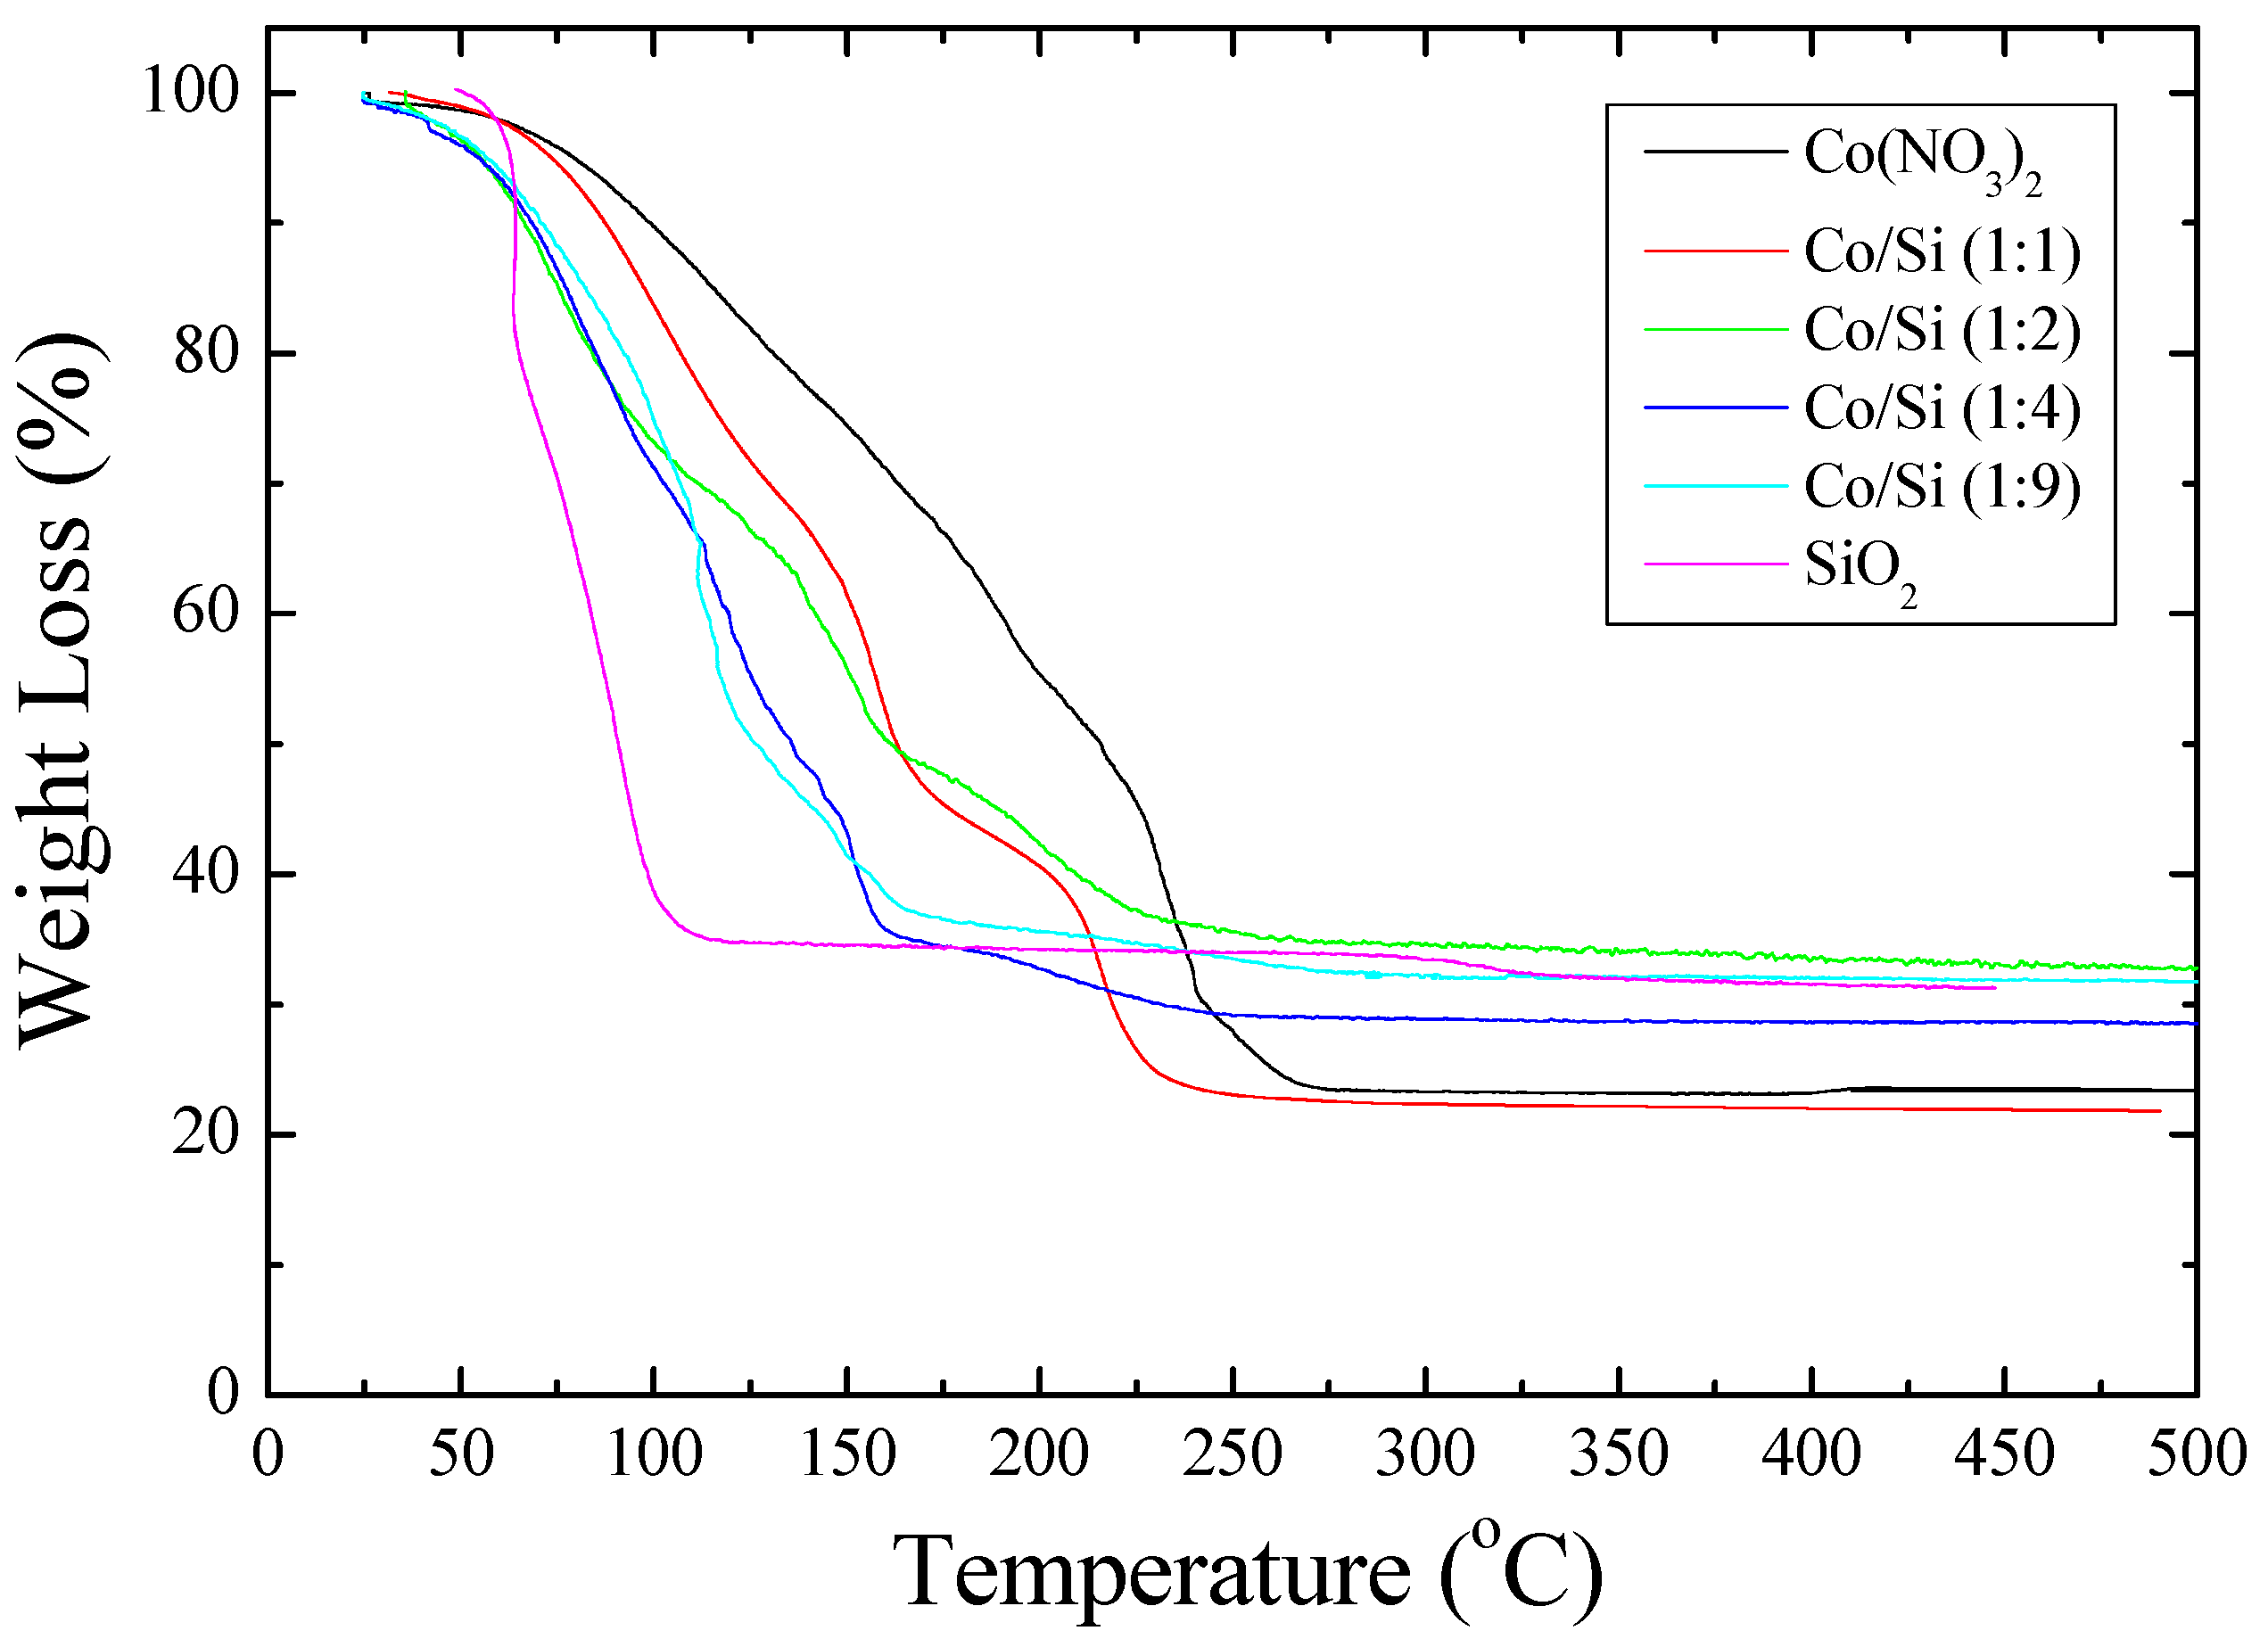
ca. 200 °C. Furthermore, the TGA study shown in
Figure 2 shows that when [Co]/[Si] ≤ 1/2, initially, the weight loss is faster than the weight loss from the cobalt nitrate solution.
Figure 2 further shows that the mechanism of decomposition is also different in the presence of coated silica as indicated by the weight loss steps in TGA. In the pyrolysis study (
Figure 3), nitric oxide evolution profiles of cobalt nitrate with or without coated silica show that not only NO evolution starts at a lower temperature but the amount of NO evolved is far in excess in the presence of coated silica. This can be understood in terms of reduced oxygen availability since the nitrate salt is essentially encapsulated by silica and hence decomposition results in more NO rather than NO
2.
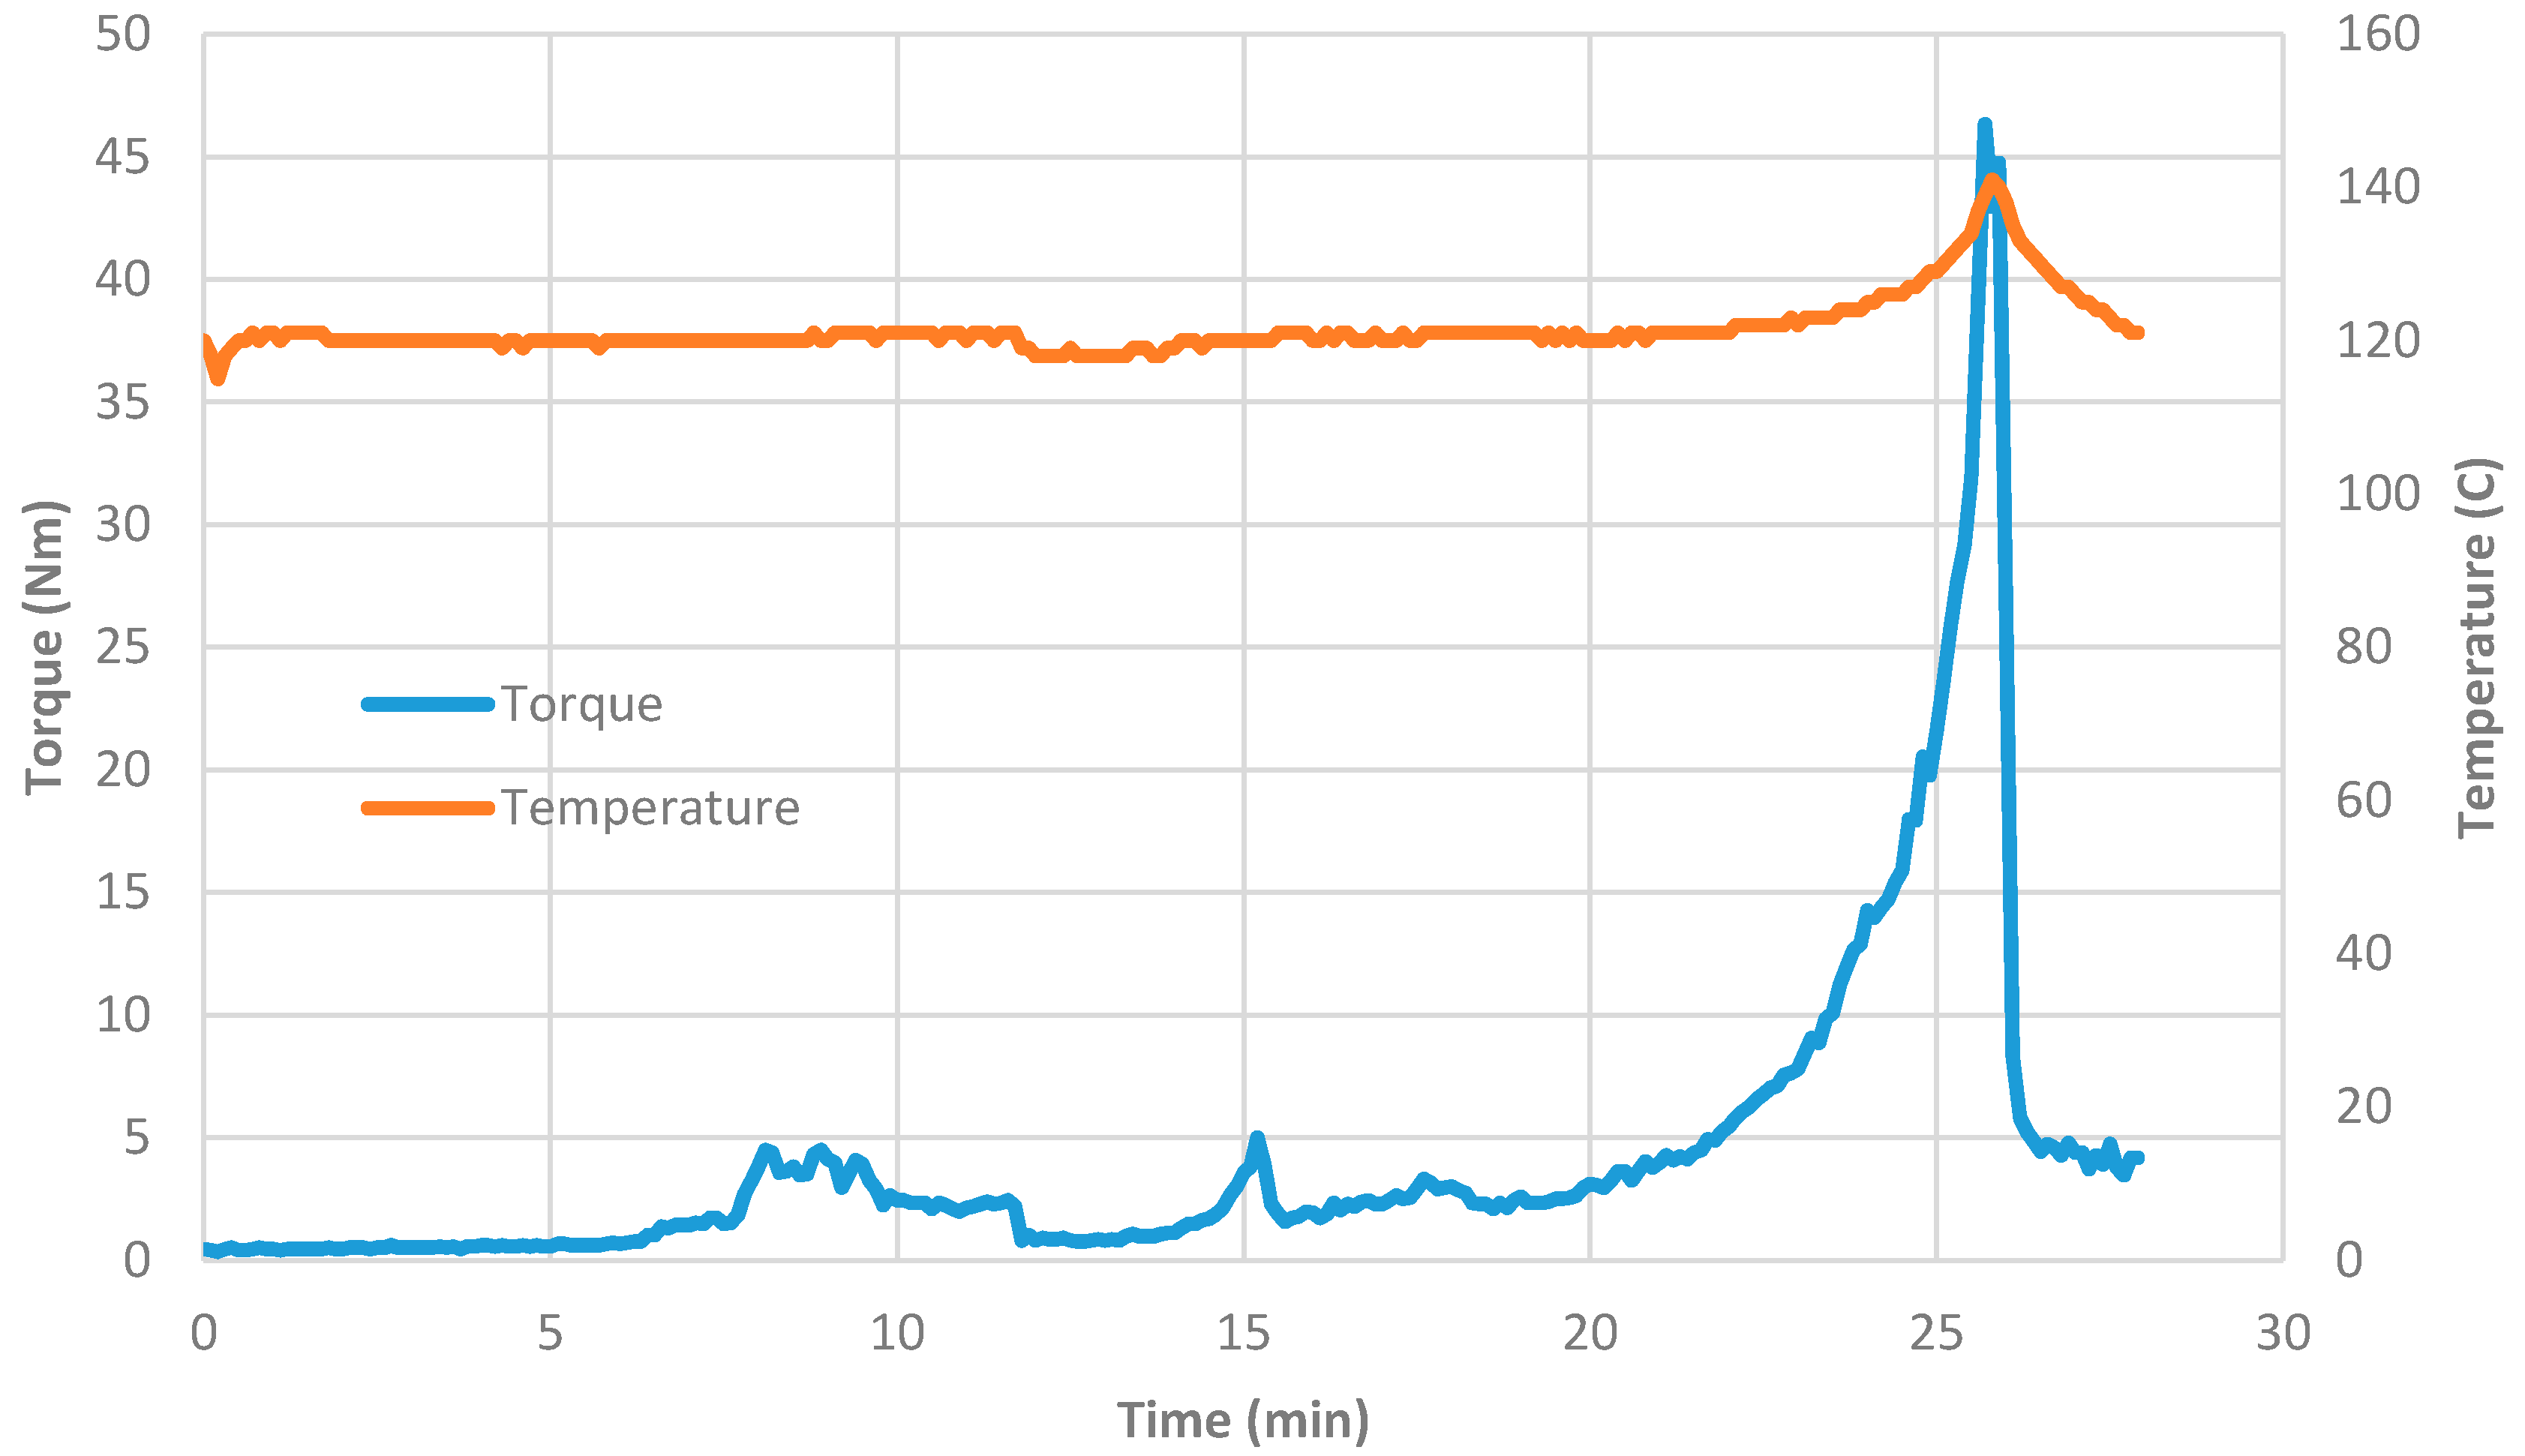
Table 3 summarizes the characteristics of the silica supported catalysts obtained without the film/bubble formation. In this case we used primarily the Haake high torque mixer which was supplemented by an agglomeration method and also by catalyst generation within the pores of nickel foam. In all cases, the resulting catalyst was dense and the catalyst size was large, at least 2–4 fold of corresponding catalysts obtained through film/bubble formation. However, when a film is formed between the rotor and stator of the Haake internal mixer, the decomposition of the catalyst precursor takes place locally (see
Figure 4). Therefore, the yield is very small. As seen from
Table 3, when film formation and decomposition occur, the resulting catalyst size is reduced compared with the catalyst obtained from the bulk of the mixture. Although this process is unlikely to be useful, it nevertheless shows the importance of film formation in obtaining small crystallite catalysts.


