Article

Electrocatalytic Activity and Durability of Pt-Decorated Non-Covalently Functionalized Graphitic Structures

1
Department of Chemical Engineering, Delft University of Technology, Julianalaan 136, 2628BL Delft, The Netherlands
2
Consiglio Nazionale delle Ricerche, Istituto di Tecnologie Avanzate per l’Energia “Nicola Giordano”, Salita S. Lucia sopra Contesse 5, 98126 Messina, Italy
*
Author to whom correspondence should be addressed.
Catalysts 2015, 5(3), 1622-1635; https://doi.org/10.3390/catal5031622
Submission received: 26 May 2015 / Revised: 7 September 2015 / Accepted: 11 September 2015 / Published: 21 September 2015
(This article belongs to the Special Issue Electrocatalysis in Fuel Cells)

Abstract

:
Carbon graphitic structures that differ in morphology, graphiticity and specific surface area were used as support for platinum for Oxygen Reduction Reaction (ORR) in low temperature fuel cells. Graphitic supports were first non-covalently functionalized with pyrene carboxylic acid (PCA) and, subsequently, platinum nanoparticles were nucleated on the surface following procedures found in previous studies. Non-covalent functionalization has been proven to be advantageous because it allows for a better control of particle size and monodispersity, it prevents particle agglomeration since particles are bonded to the surface, and it does not affect the chemical and physical resistance of the support. Synthesized electrocatalysts were characterized by electrochemical half-cell studies, in order to evaluate the Electrochemically Active Surface Area (ECSA), ORR activity, and durability to potential cycling and corrosion resistance.

Graphical Abstract

1. Introduction

Fuel cells operating at low temperature and employing polymer electrolyte membranes are very promising as sustainable power sources for portable, automotive and stationary applications because of their high efficiency and low CO2 emission [1,2,3]. However, for large scale distribution of these devices, it is necessary to reduce the cost and, at the same time, increase the durability of the catalyst. In fact, the latter is commonly based on platinum nanoparticles (NPs) supported on high surface area carbon [4,5,6,7]. The low durability of the conventional Pt-based electrode materials is due to several phenomena, such as sintering, corrosion and dissolution of catalyst metal particles, that take place especially in non-ideal conditions such as potential and temperature cycling and fuel starvation [8]. The major degradation mechanism has been identified in carbon corrosion at high potentials (>0.8 V vs. RHE). Carbon corrosion can cause, among others, loss of hydrophobicity leading to electrode flooding, catalyst detachment leading to loss of the Electrochemically Active Surface Area (ECSA), loss of porosity, with consequent mass transport problems [4,9]. Moreover, as clearly reported by Siroma et al. [10], the presence of platinum onto the carbon surface significantly increases the degradation of the latter. Recent studies have proven that graphitic materials such as carbon nanotubes (CNTs), nanofibers, etc. are significantly more resistant to carbon corrosion than the widely used carbon black due to the higher stability of the sp2-hybridized carbon [3,11,12,13,14,15,16,17,18].
Within the TU Delft group, we developed a novel carbon material that consists of networked carbon nanostructures (CNNs), currently produced by the TU Delft spin-off company CarbonX (formerly Minus9) [11,19]. CNNs are 3D hyper-branched carbon graphitic structures organized in a nano-scale pattern. They can be easily produced by Chemical Vapour Deposition (CVD) of ethene over transition metal catalyst, used as nucleation elements, and synthetized in bicontinuous microemulsions (BME) [20,21,22]. The carbonization of the surfactant, being the primary carbon source, leads to the formation of networked, sponge-like, carbon graphitic structures (CNNs), which show promising properties for application as fuel cell supports, such as high electrical conductivity, great oxidation resistance, high specific surface area, micro- and meso-porosity, surface defects increasing the material ability to disperse in solution [11,12,13,14,19]. Previous studies showed that CNNs are more durable supports for platinum catalysts in the ORR compared to commercial carbon supports, while the simplicity and versatility of the synthesis route allows a cheaper production than CNTs [12,13,14].
The relatively inert surface of graphitic carbon supports has been addressed as a drawback for the use of these materials because of lower interaction with the catalyst NPs and thus the weaker bonding [23]. Defects on the surface have a controversial effect: they are considered to be beneficial since they act as anchoring points for the platinum NPs, reducing migration and coalescence and thus loss of ECSA, whereas they can decrease the carbon resistance to corrosion by making it more prone to oxidation [24,25,26]. Introduction of defects on the surface can be done chemically or electrochemically, e.g., with acid treatment or potential cycling [27], leading to covalently functionalized surfaces, or physically, by absorption of small molecules containing functional groups [28], leading to non-covalently functionalized surfaces. In covalent functionalization, the graphitic surface is functionalized using an oxidative process, such as an acid or plasma treatment. Surface groups such as hydroxyl (-OH), carboxyl (-COOH) and carbonyl (-C=O) groups are created. These groups will act as anchor points for Pt NPs; however, they also represent defects in the graphitic structure and thus they might decrease CNNs chemical resistance. Non-covalent functionalization of graphitic surfaces is based on π-π stacking between the surface and a linking molecule. A linker molecule consists of a benzyl or pyrene group that attaches to the surface of the CNTs/CNNs and a thiol, amine or carboxylic acid group that anchors the Pt ion [28]. Recent work by Oh et al. [28] used a 1-pyrene carboxylic acid (1-PCA) as a linker molecule and the standard polyol method for Pt deposition. PCA turned out not to be poisonous for the surface of the Pt catalyst, and not only was no carbon corrosion measured (indirectly via produced CO2) [28], but also PCA seemed to protect the graphitic surface from degradation, inhibiting corrosion by indirect contact of the Pt catalyst with the carbon surface, particle migration and coalescence.
In the present study, we aim to compare electrocatalysts synthetized with the PCA functionalization combined with the polyol method over graphitic materials with different physical-chemical properties, using two batches of CNN supports produced in-house and a batch of commercial CNTs.

2. Results and Discussion

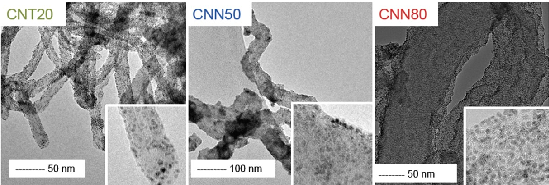
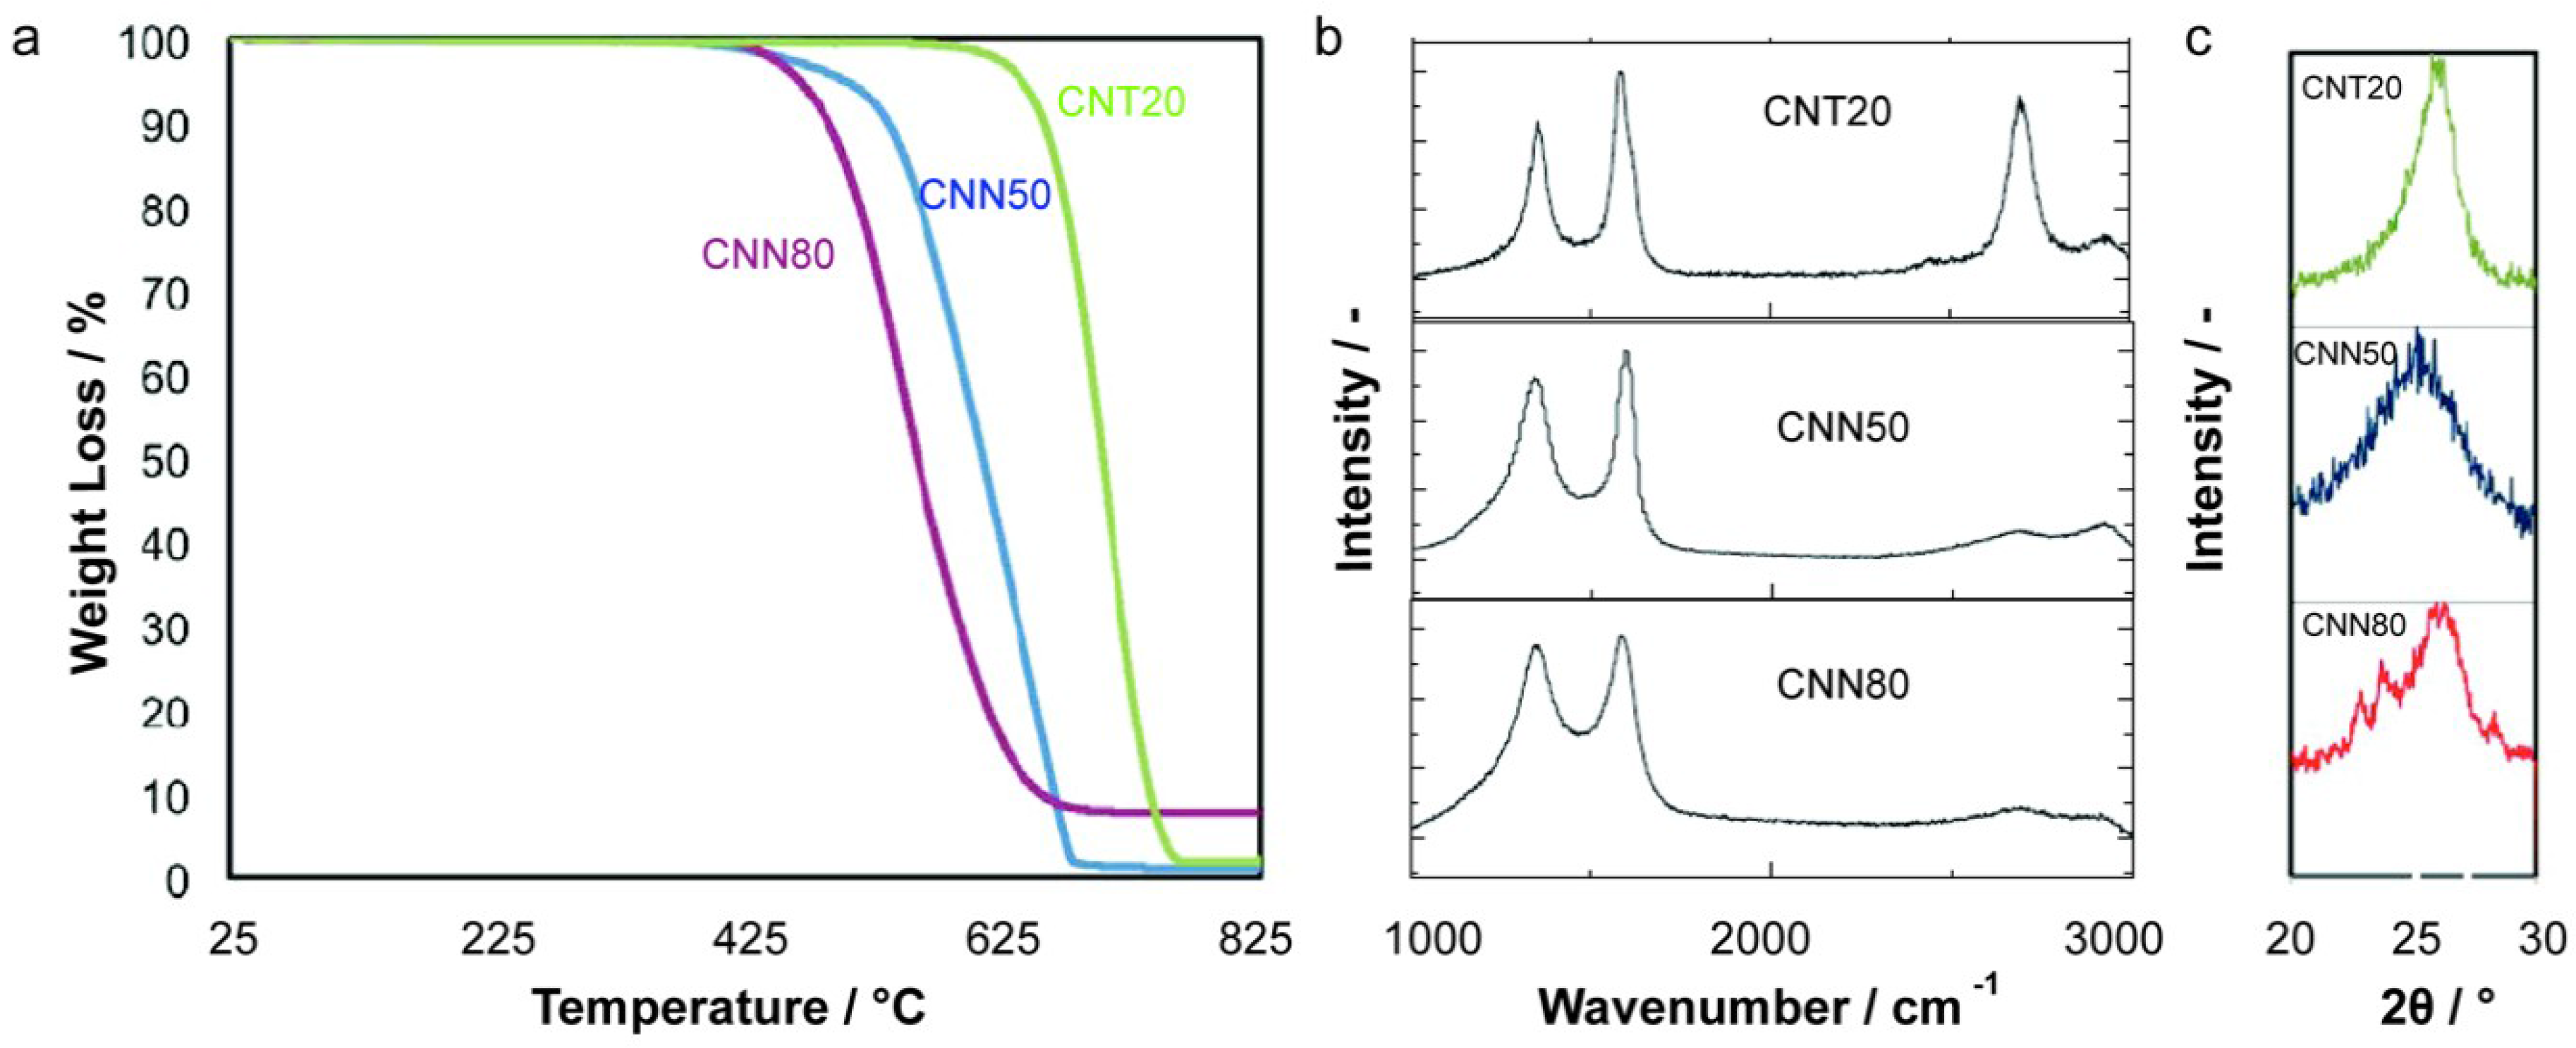
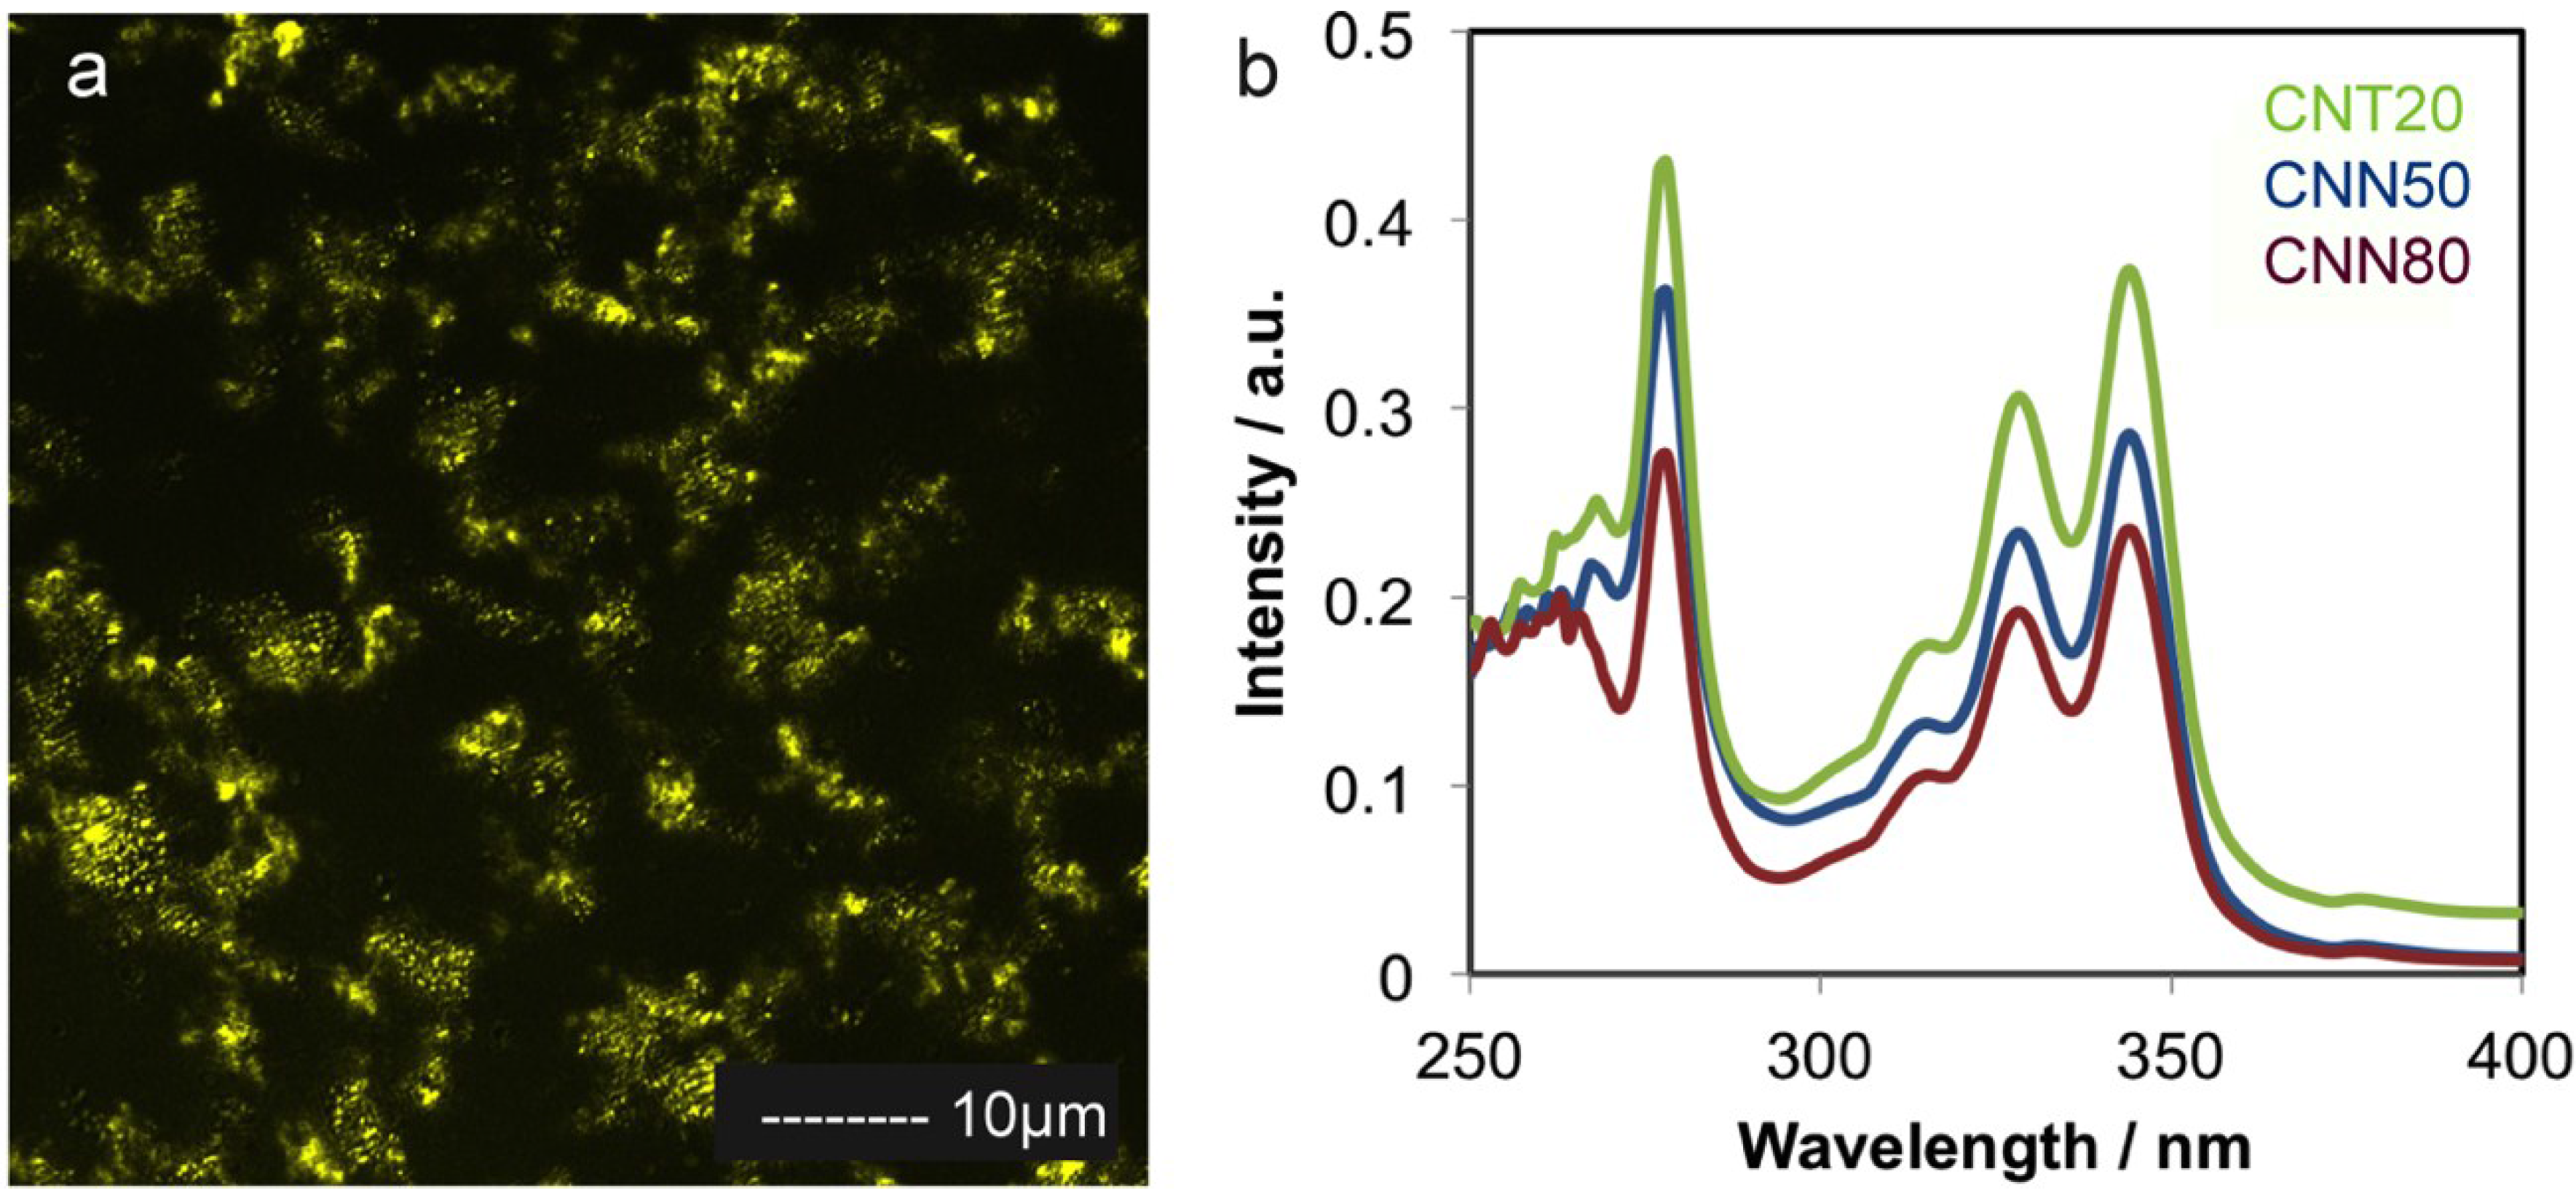
2.1. Carbon Support Synthesis, Functionalization and Characterization

A summary of the properties of different carbon supports is reported in Table 1. The batches of CNN used for this work exhibit a lower porosity (63 and 39 m2·g−1 for CNN50 and CNN80 respectively) than commercial CNTs (110 m2·g−1), Table 1. This can be easily explained by the ticker average diameter, 50 nm and 80 nm, respectively, for CNN50 and CNN80 compared to 20 nm for CNT20, Table 1. This limits the possibility to achieve high Pt loading without affecting the durability of the catalyst. However, recent studies demonstrated that lowering Pt loading improves catalyst utilization and performance [29]. Previous studies reveal that CNN material is mainly meso-porous (2–50 nm), which is beneficial for catalysis as it assures an optimal mass transport [14]. For CNTs, the porosity largely depends on the packing parameter that can strongly vary if the carbon surface is functionalized [14].
Table 1. Carbon supports’ physical-chemical properties.
SampleAverage Diameter/nmSpecific Surface Area/m2 g−1Tox/°CID/IGPCA/%
CNT20201107000.77.5
CNN5050636300.98.3
CNN80803961019
Figure 1a reports the weight loss of the samples as a function of temperature from TGA analysis in air. Table 1 reports the temperature of oxidation, 700 °C, 630 °C and 610 °C for CNT20, CNN50 and CNN80, respectively. All the samples show higher oxidation resistance compared to for example carbon black or Vulcan, the most widely used catalyst supports [4,9,14]. The difference in oxidation resistance can be attributed to the presence of defects. Defects can be detected and quantified with Raman Spectroscopy measurements, Figure 1b. Table 1 also reports the ID/IG values (ratio between the disordered and the graphitic carbon structure) estimated from the ratio between the intensity of the D band at circa 1350 cm−1 and G band at circa 1580 cm−1 [30]. Raman spectroscopy analysis showed a higher ID/IG for CNN80 and CNN50 than for CNT20, implying a higher content of defects in the graphitic structure for the CNN, Figure 1b. This is due to the oxygen and sulphur that has been integrated into the structure as a consequence of the precursor used and was confirmed by EDX in previous work [14]. The amount of defects increases with the average diameter of the carbon nanostructures, from 0.7 to 1. A similar trend can be observed from the broadness of the peak corresponding to graphitic crystalline structure in XRD measurements, Figure 1c. The broader the peak, the lower the level of order indicating smaller crystalline domains [15,16]. Part of these defects consists of quinone groups on the surface, which in previous studies were found to improve ORR or even to be the active catalyst for it [11,14].
Figure 1. (a) TGA traces of decomposition in air; (b) Raman spectrum and (c) XRD measurements for the graphitic carbon supports.
Catalysts 05 01622 g001
Carbon nanostructures were functionalized with PCA. PCA is a fluorescent molecule. The confocal microscopy image in Figure 2a shows that PCA is uniformly distributed on the surface of the graphitic carbon nanostructures. PCA concentration in ethanol was measured by UV-Vis spectroscopy.
Figure 2. (a) Confocal Microscopy image of CNN80 after functionalization; (b) UV-Vis spectra of PCA/ethanol collected after functionalization and filtration and diluted 100 times.
Catalysts 05 01622 g002
After functionalization and filtration of carbon nanostructures, the collected PCA in ethanol was diluted 100 times and measured by UV-Vis. A calibration curve was calculated before using Lambert-Beer law and monitoring the absorbance peak at 345 nm. Figure 2b shows that concentration was higher after functionalization of respectively CNT20, CNN50 and CNN80, indicating lower adsorption efficiency on the surface of the graphitic carbon supports. This might be due to the more defected carbon (see Table 1 and Figure 1b) into ethanol, that was also shown being beneficial for dispersion [11]. Additionally, PCA might more easily adhere on less-curved surfaces, better approximating a planar configuration. PCA interaction with a more curved surface as CNT20 might be less strong since optimal adhesion would require a strain in the molecule.

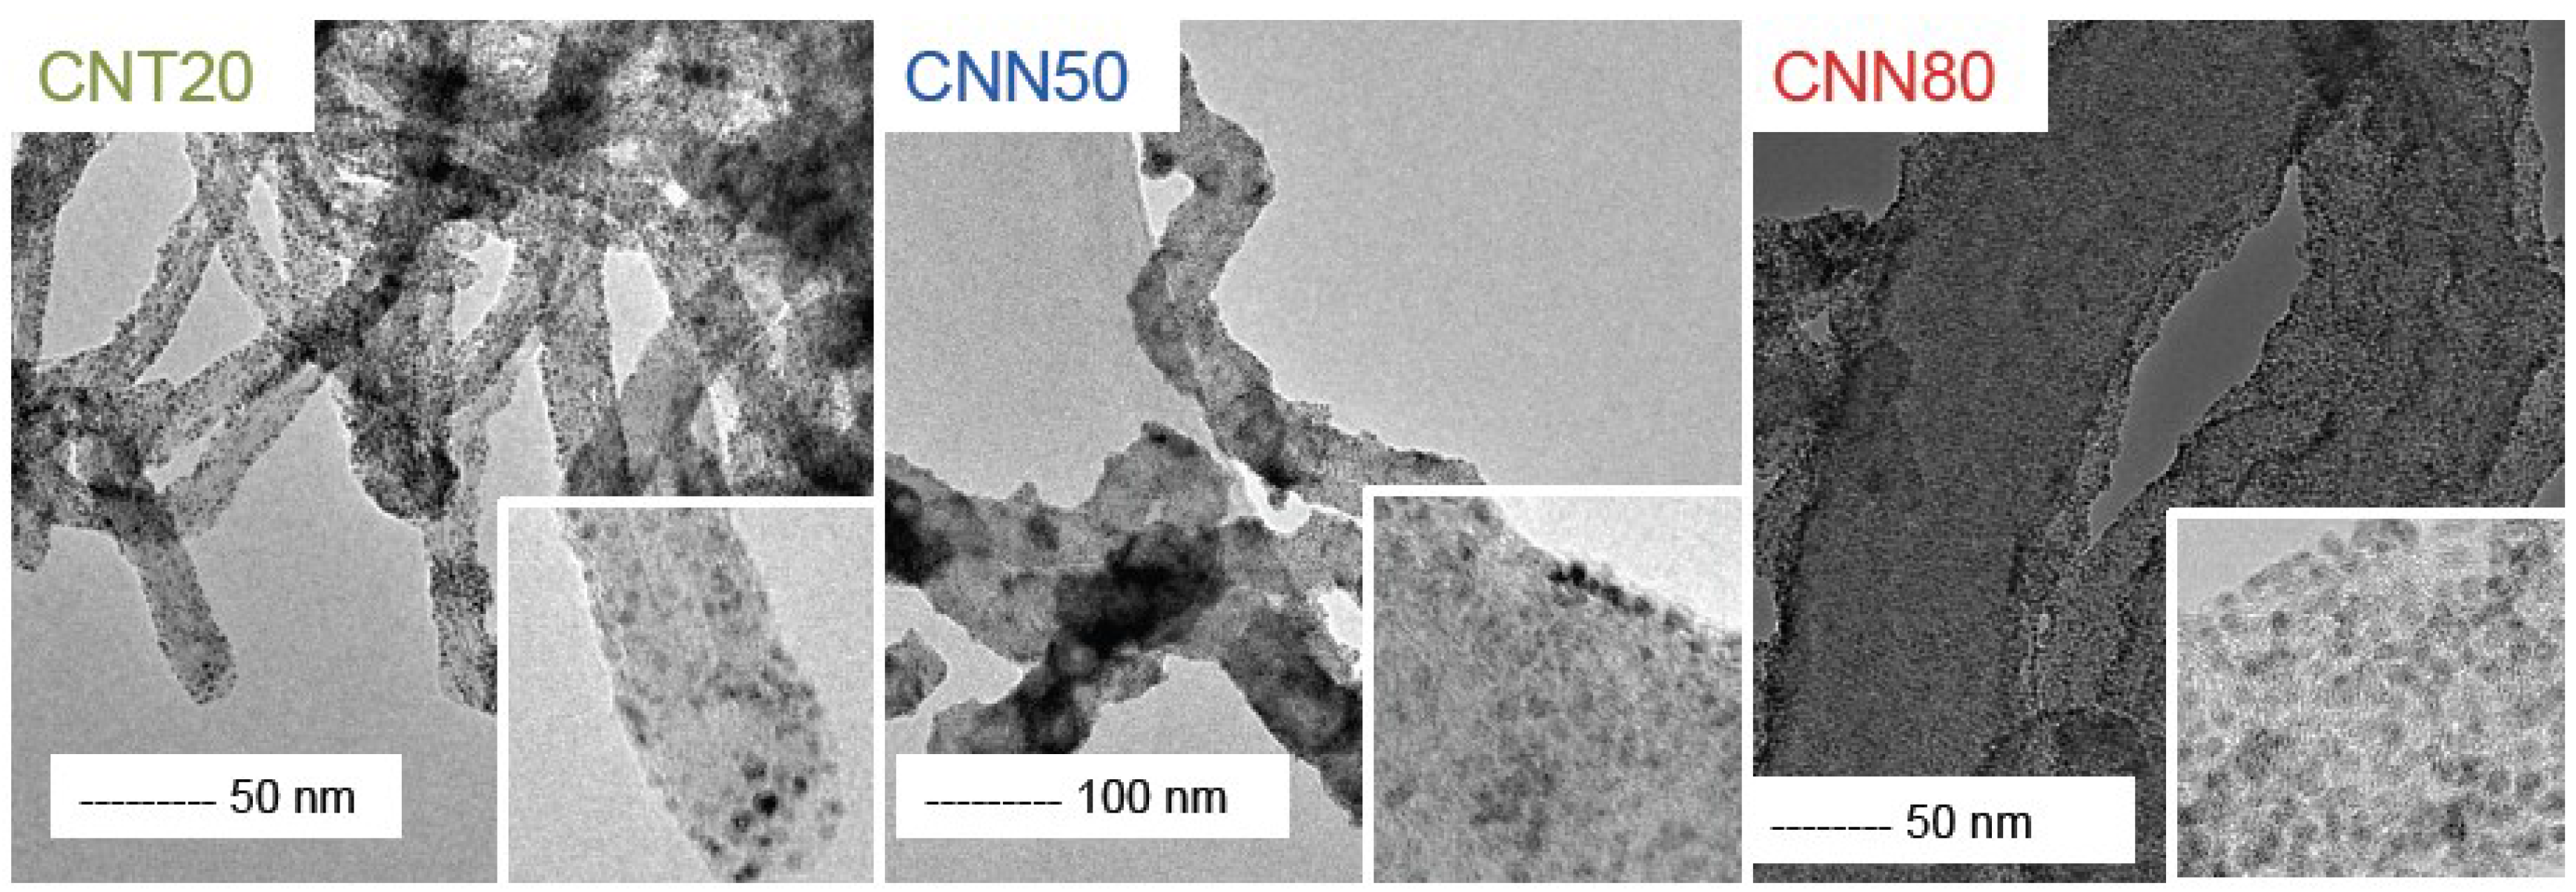
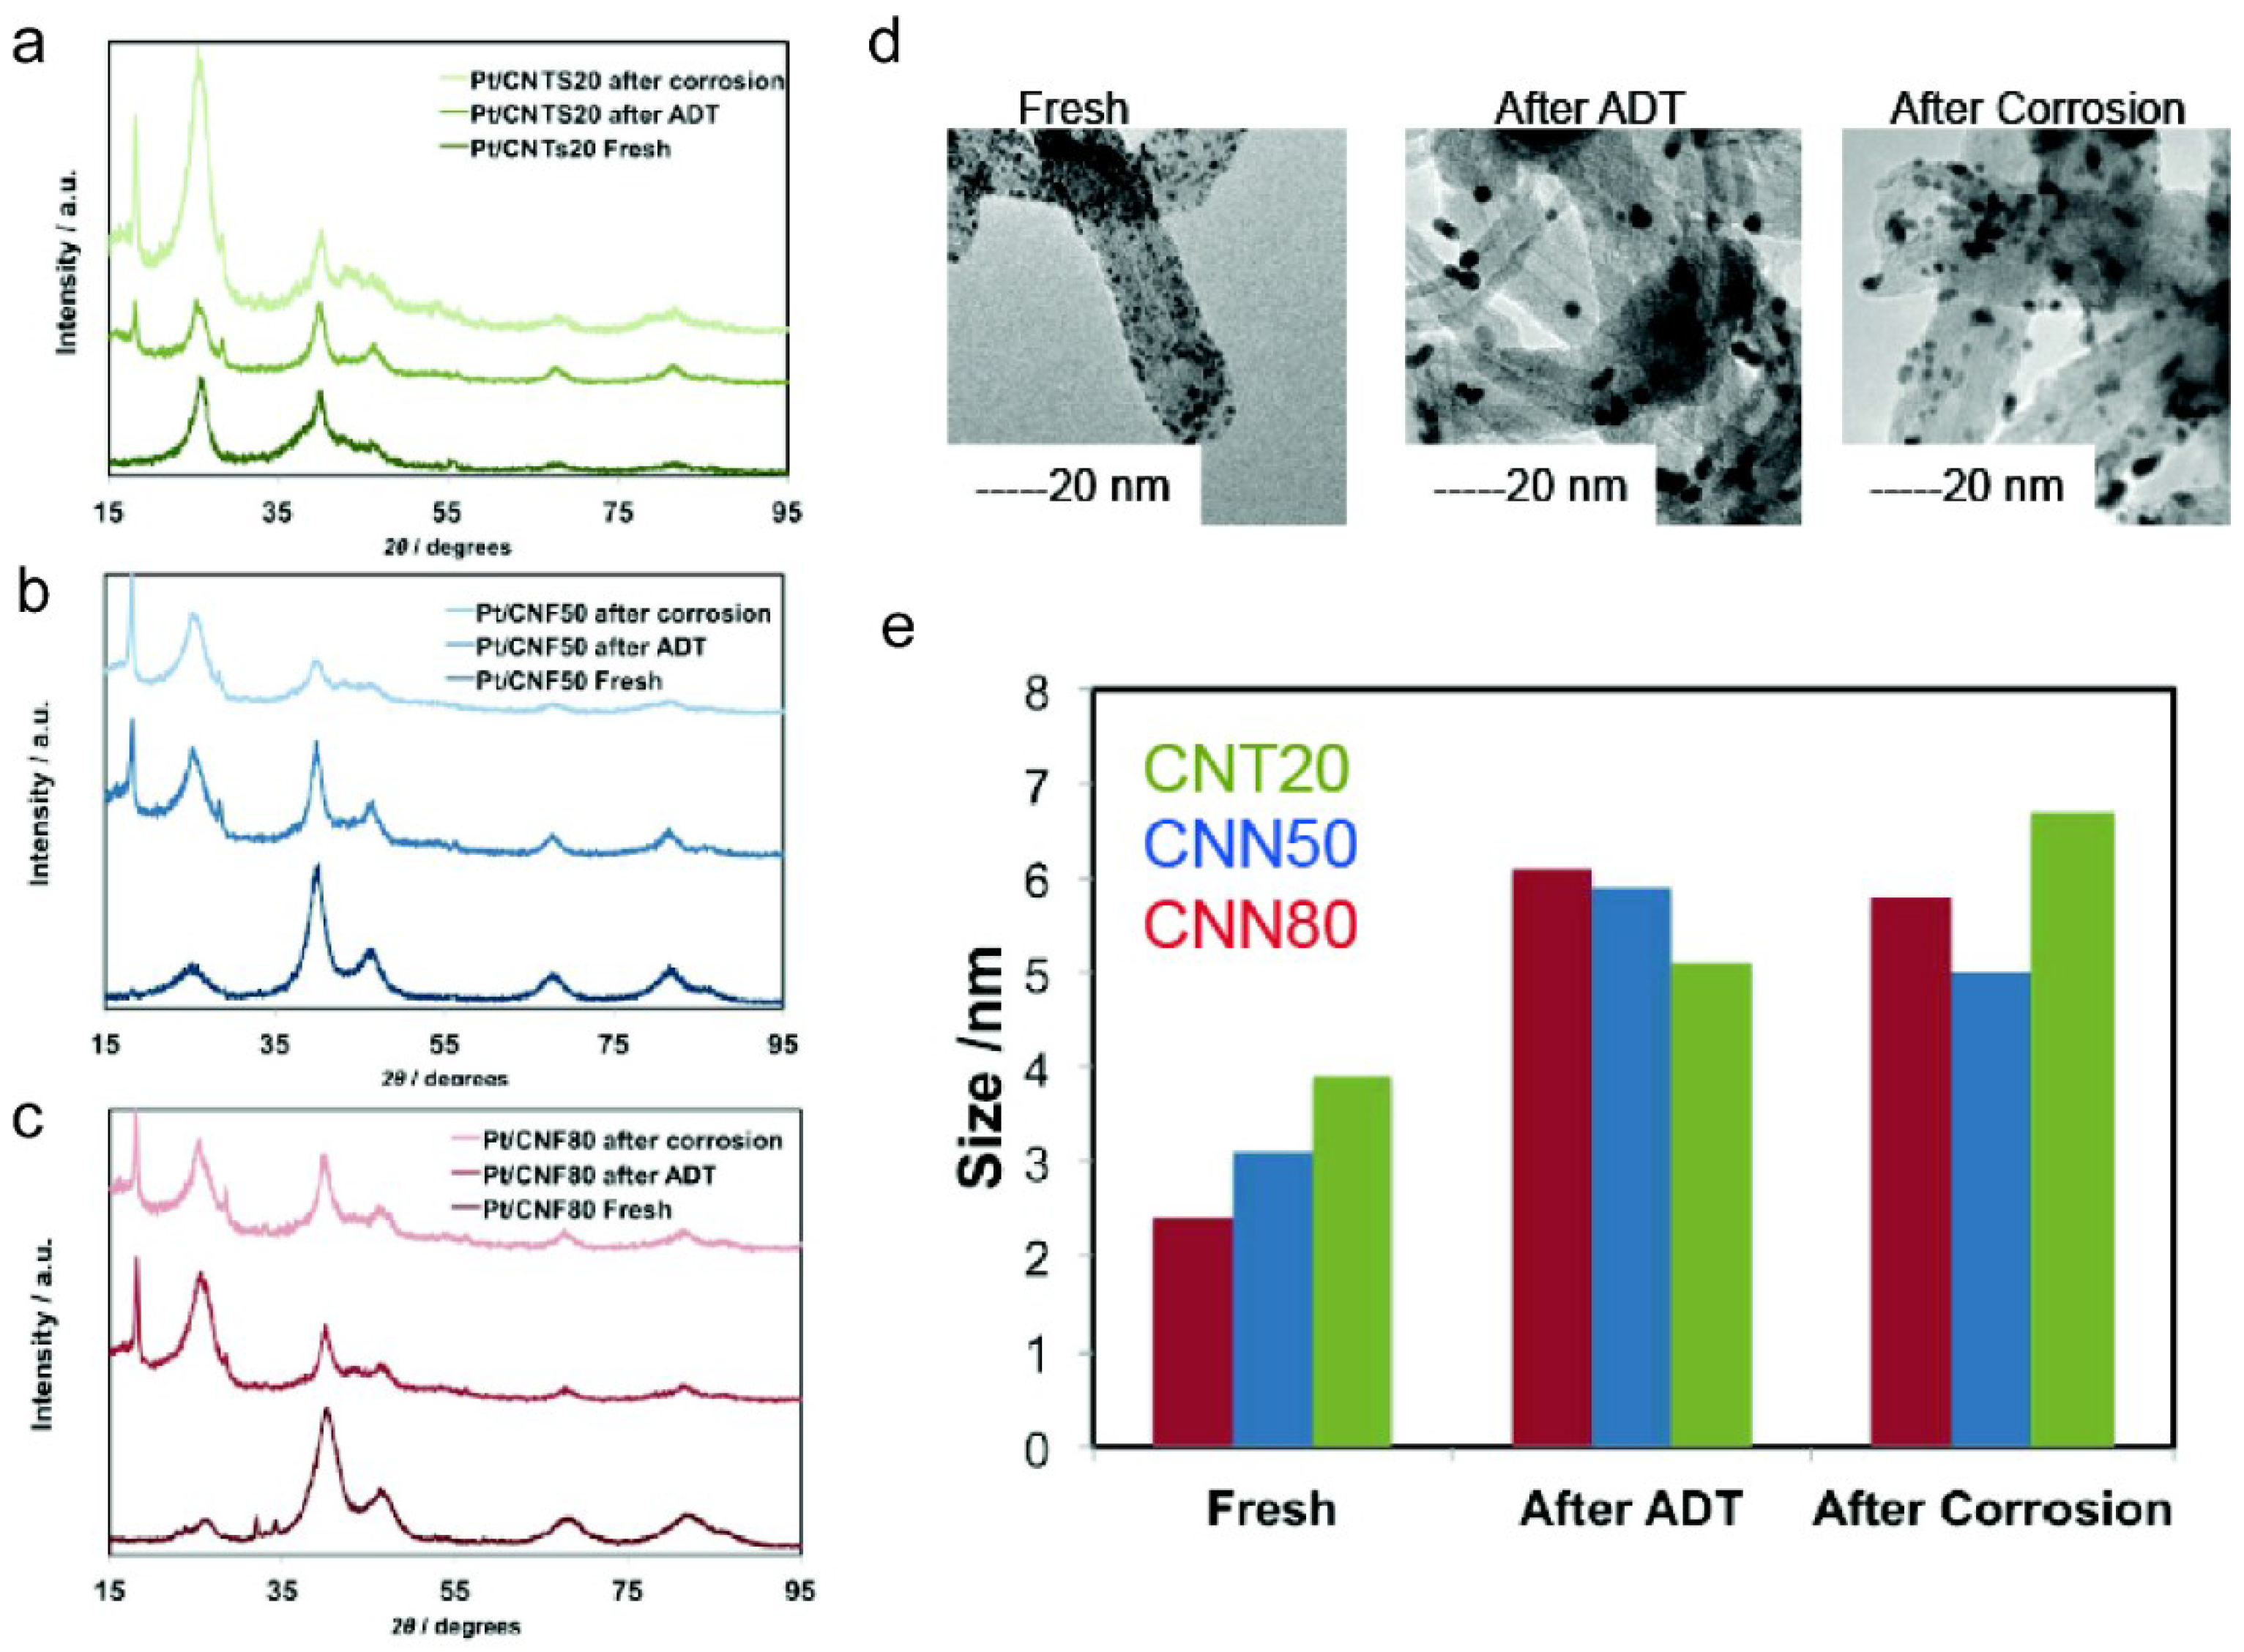
2.2. Platinum Deposition

The platinum loading was calculated from TGA and confirmed by EDX. For all the samples, the Pt loading result was lower than the target 15%, i.e., 7%, 9% and 11% for Pt-CNT20, Pt-CNN50 and Pt-CNN80 respectively (see Table 2). Interestingly, the Pt loading was proportional to the PCA loading, Table 1, 7.5%, 8.3% and 9% for CNT20, CNN50 and CNN80 respectively. The more functionalized the graphitic carbon support, the better the Pt NPs adsorption. In fact, carboxylic groups and defects in general can both act as nucleation points for Pt reduction and provide anchoring points for the formed NPs [12,14,28].
Table 2. Electrocatalyst physical chemical properties.
SamplePt Loading/%Particle Size TEM/nmParticle Size XRD/nm
CNT2072.3 ± 0.23.9
CNN5092.3 ± 0.23.1
CNN80112.3 ± 0.22.4
Figure 3 reports the TEM images for the synthetized electrocatalysts. In all the samples, the Pt NPs size calculated from the measurement of at least 200 particles was 2.3 ± 0.2 nm. However, NP size calculated from XRD patterns using the Scherrer equation for the peak corresponding to Pt (220), which is not affected by the interference of other peaks, differed from TEM measurements. Results are reported in Table 2. The NP size measured was higher for CNT20 and CNN50, respectively 3.9 nm and 3.1 nm, indicating the presence of larger NPs probably resulting from coalescence due to poor NP interactions with the support because of a lower amount of functional groups. These results are indeed consistent with different PCA loadings achieved on the supports. These larger NPs could not be visualized by TEM analysis.
Figure 3. TEM images of the synthetized electrocatalysts.
Catalysts 05 01622 g003

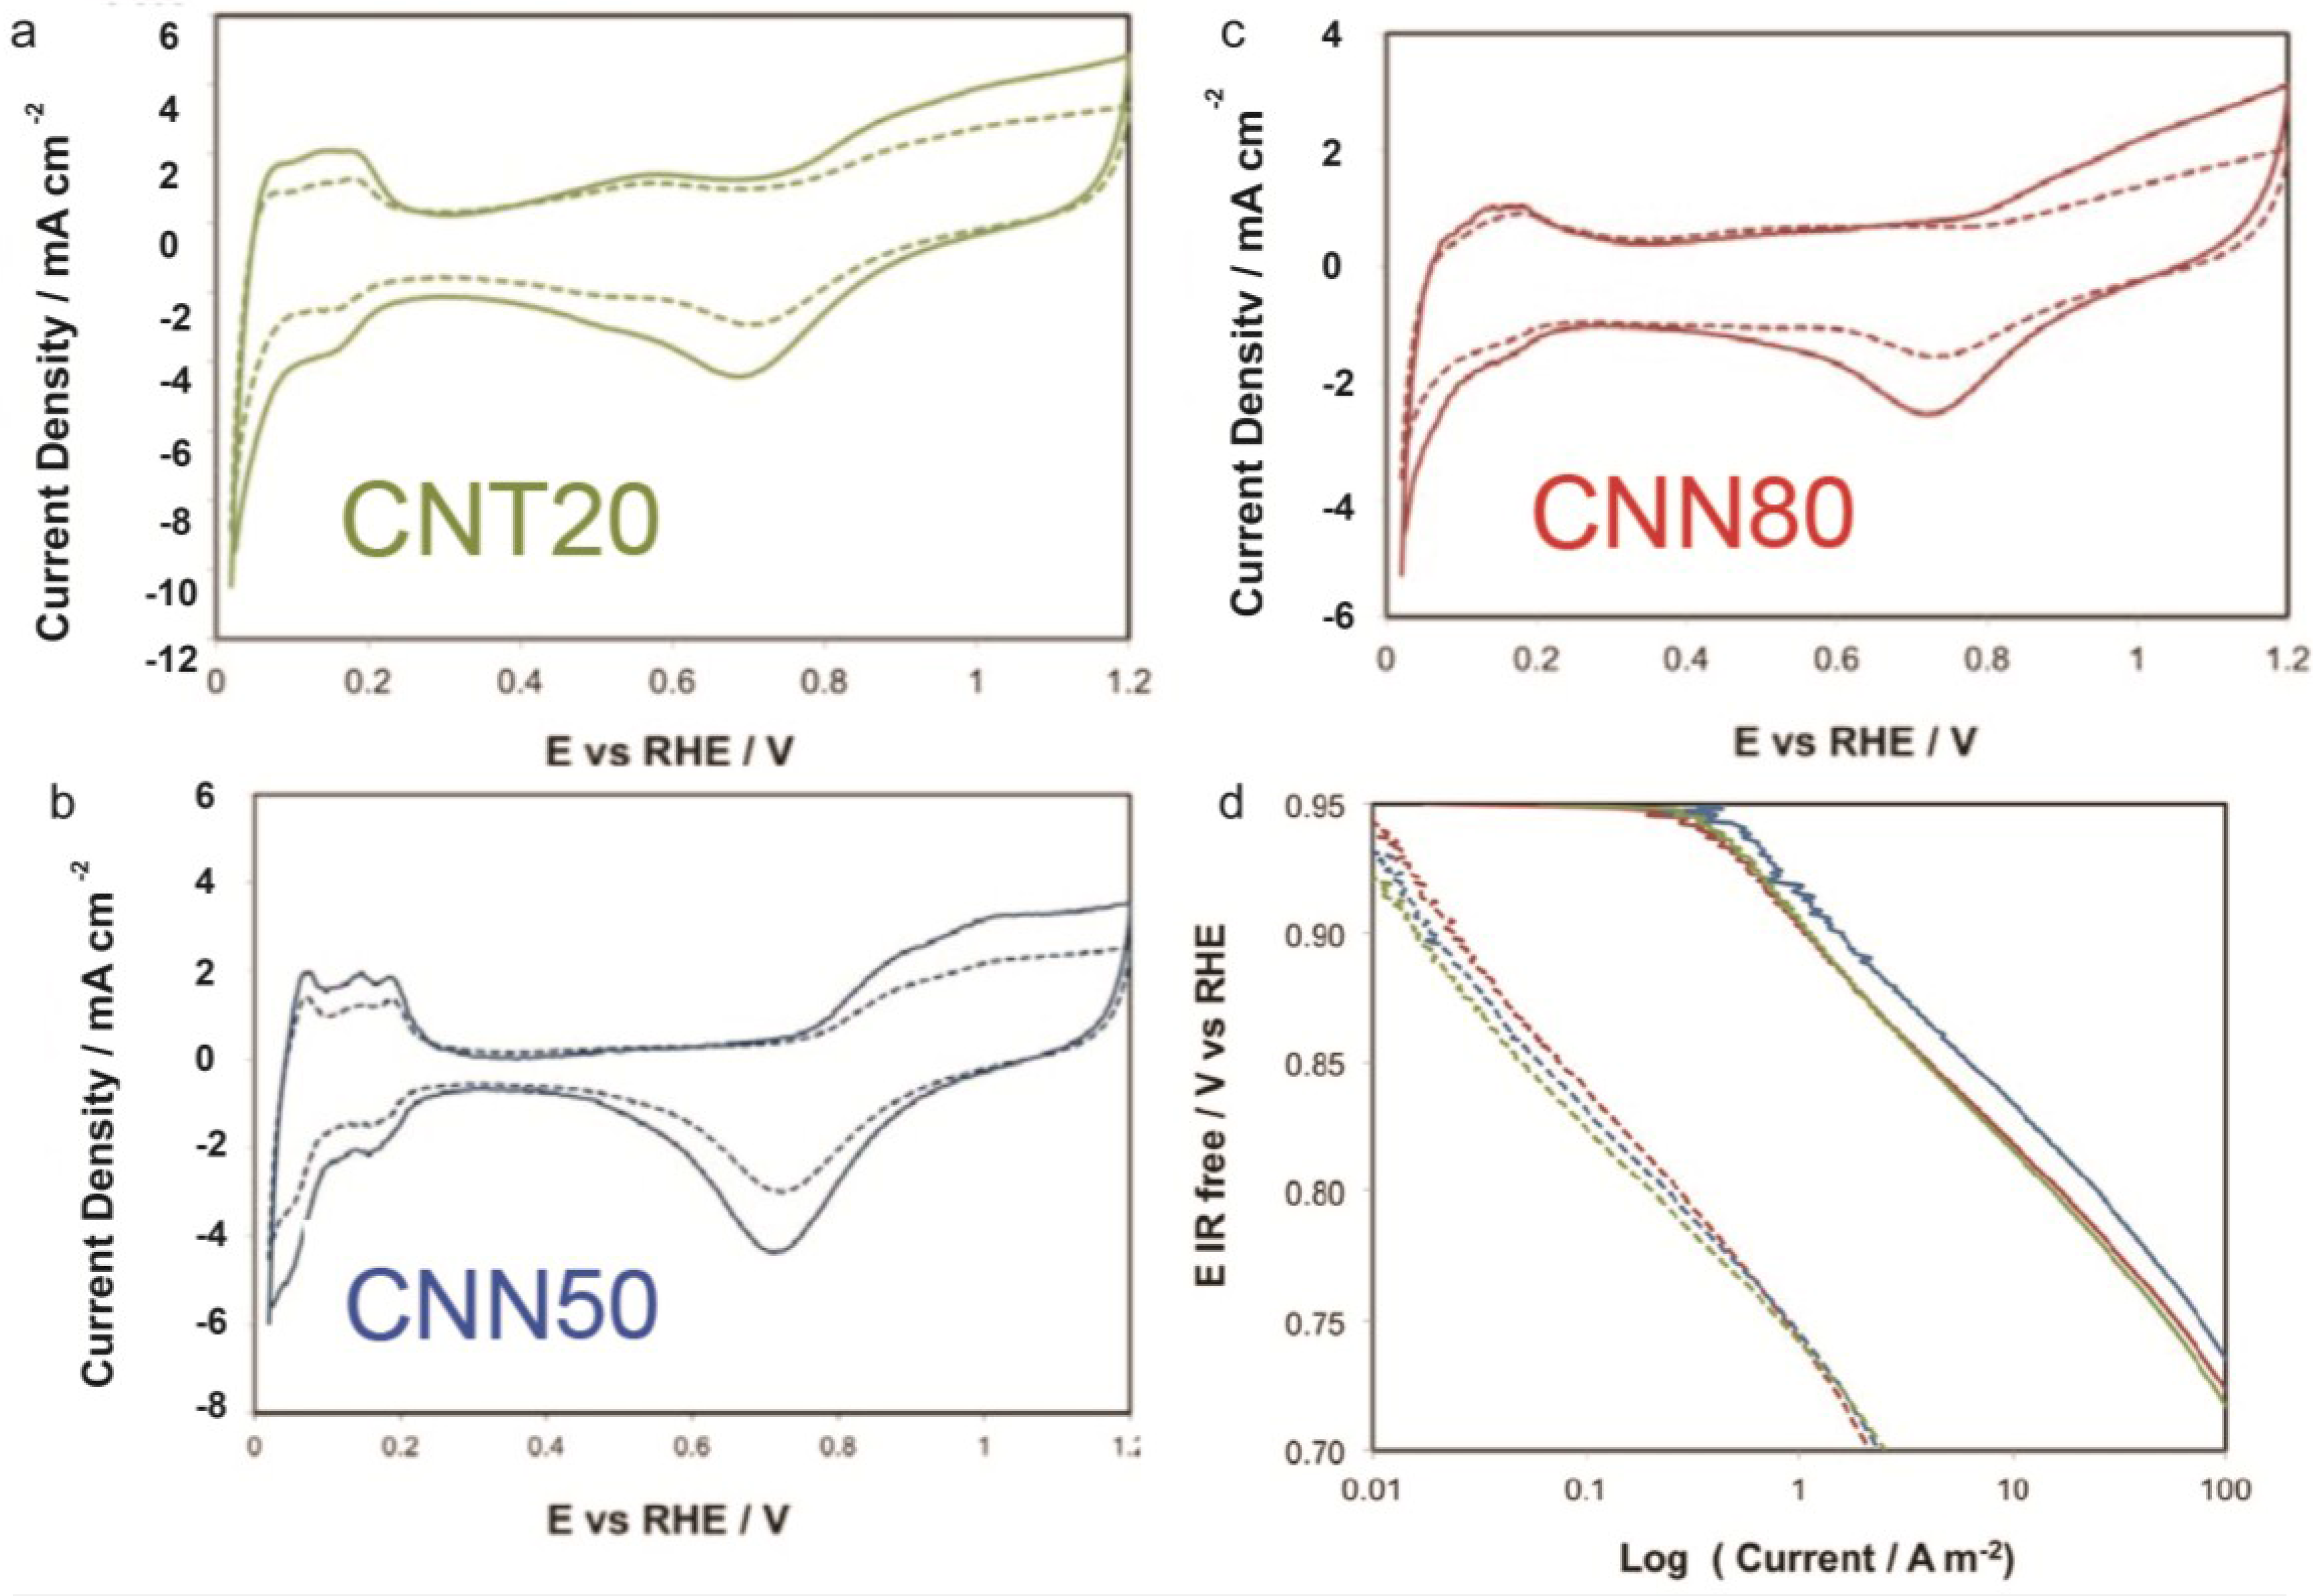
2.3. Electrochemical Characterization

2.3.1. ECSA and ORR Activity before and after ADT

An accelerated test procedure consisting of 1000 cycles at potentials between 0.6 and 1.2 V and a scan rate of 20 mV·s−1 in 0.5 M H2SO4 saturated with N2 was carried out to evaluate catalyst stability under potential cycling conditions. The cyclic voltammetry profiles for the different electrodes before and after the potential cycling procedure are reported in Figure 4a–c. It can be observed how the PtOx reduction peak shifts to higher potentials and decreases in intensity after the cycling process, which can be attributed to an increase of particle size with a consequent reduction of the electrochemically active surface area (ECSA) and increase of intrinsic catalytic activity for oxygen reduction. It is clear also from the hydrogen adsorption region that the ECSA decreases after the accelerated test, due to sintering or dissolution of Pt particles [31]. The resulting ECSA values before and after ADTs are reported in Table 3. The ECSA is consistent with the average particle size. Due to the smallest crystallite size and the highest functionalization degree, the Pt/CNN80 catalyst showed the highest ECSA among the considered samples both before and after the ADT (Table 3 and Figure 5). However, the loss of ECSA is quite high for all samples (more than 40%) but still comparable to or higher than the values reported for catalyst synthetized for similar studies as well as for many commercial catalysts [6,16,17,32]. In addition, the current density in the activation region (Figure 4d) decreases after the ADTs for all catalysts. The activity at the beginning of life is higher for CNN50 (due to the optimal particle size of 3 nm, which is a compromise between surface area and specific surface activity); whereas, after the ADT, the Pt/CNN80 shows the best behaviour probably due to the largest ECSA. Figure 5 shows the XRD patterns of the catalysts before and after the ADTs; also, the patterns after the carbon corrosion tests are reported for comparison. An increase of crystallite size was observed for all samples after both tests. This is also evident in the TEM images of Figure 6d (only images for Pt-CNT20 sample are reported as an example), in which a certain degree of sintering in comparison to the fresh catalyst is observed. This catalyst is also affected by the Ostwald ripening process, which leads to the dissolution and re-precipitation of Pt particles onto other Pt particles leading to big agglomerates. The results regarding the crystallite size determination before and after the AD and carbon corrosion tests are summarized in Figure 6e.
Figure 4. Cyclic Voltametry performed in 0.5 M H2SO4, N2 saturated, scan rate 20 mV·s−1, for (a) Pt-CNT20; (b) CNN50 and (c) CNN80. Before (line) and after ADT tests (dotted); (d) Tafel plots IR corrected. Dotted lines represent the measurements after ADT tests.
Catalysts 05 01622 g004
Figure 5. XRD measurements of electrocatalysts fresh, after ADT and after corrosion: (a) Pt/CNT20; (b) Pt/CNN50; (c) Pt/CNN80; (d) TEM images for Pt-CNT20 fresh, after ADT and after corrosion; (e) Pt particle size measured from XRD measurements for fresh, after ADT and after corrosion electrocatalysts.
Catalysts 05 01622 g005
Table 3. ECSA before and after ADT, particle size measured from XRD after ADT and corrosion test, DLC, DLC after over before corrosion, carbon corrosion parameters.
SampleECSA/m2 g−1ECSA after ADT/m2 g−1ECSA Loss with ADT/%Particle Size XRD after ADT/nm DLC0/F g−1DLCf/DLC0knParticle Size XRD after Corrosion/nm
CNT2044.222.4−495.1991.1130.970.886.7
CNN5052.130.2−425.9661.266.460.985
CNN8058.332.5−446.1771.3930.70.925.8
Figure 6. (a) Current density–time curves of carbon samples corrosion in double logarithmic scales, performed in half-cell at 1.4 V vs. RHE, fed with nitrogen and at room temperature; (b) Ratio of the double layer capacitance before and after and corrosion for the electrocatalysts.
Catalysts 05 01622 g006

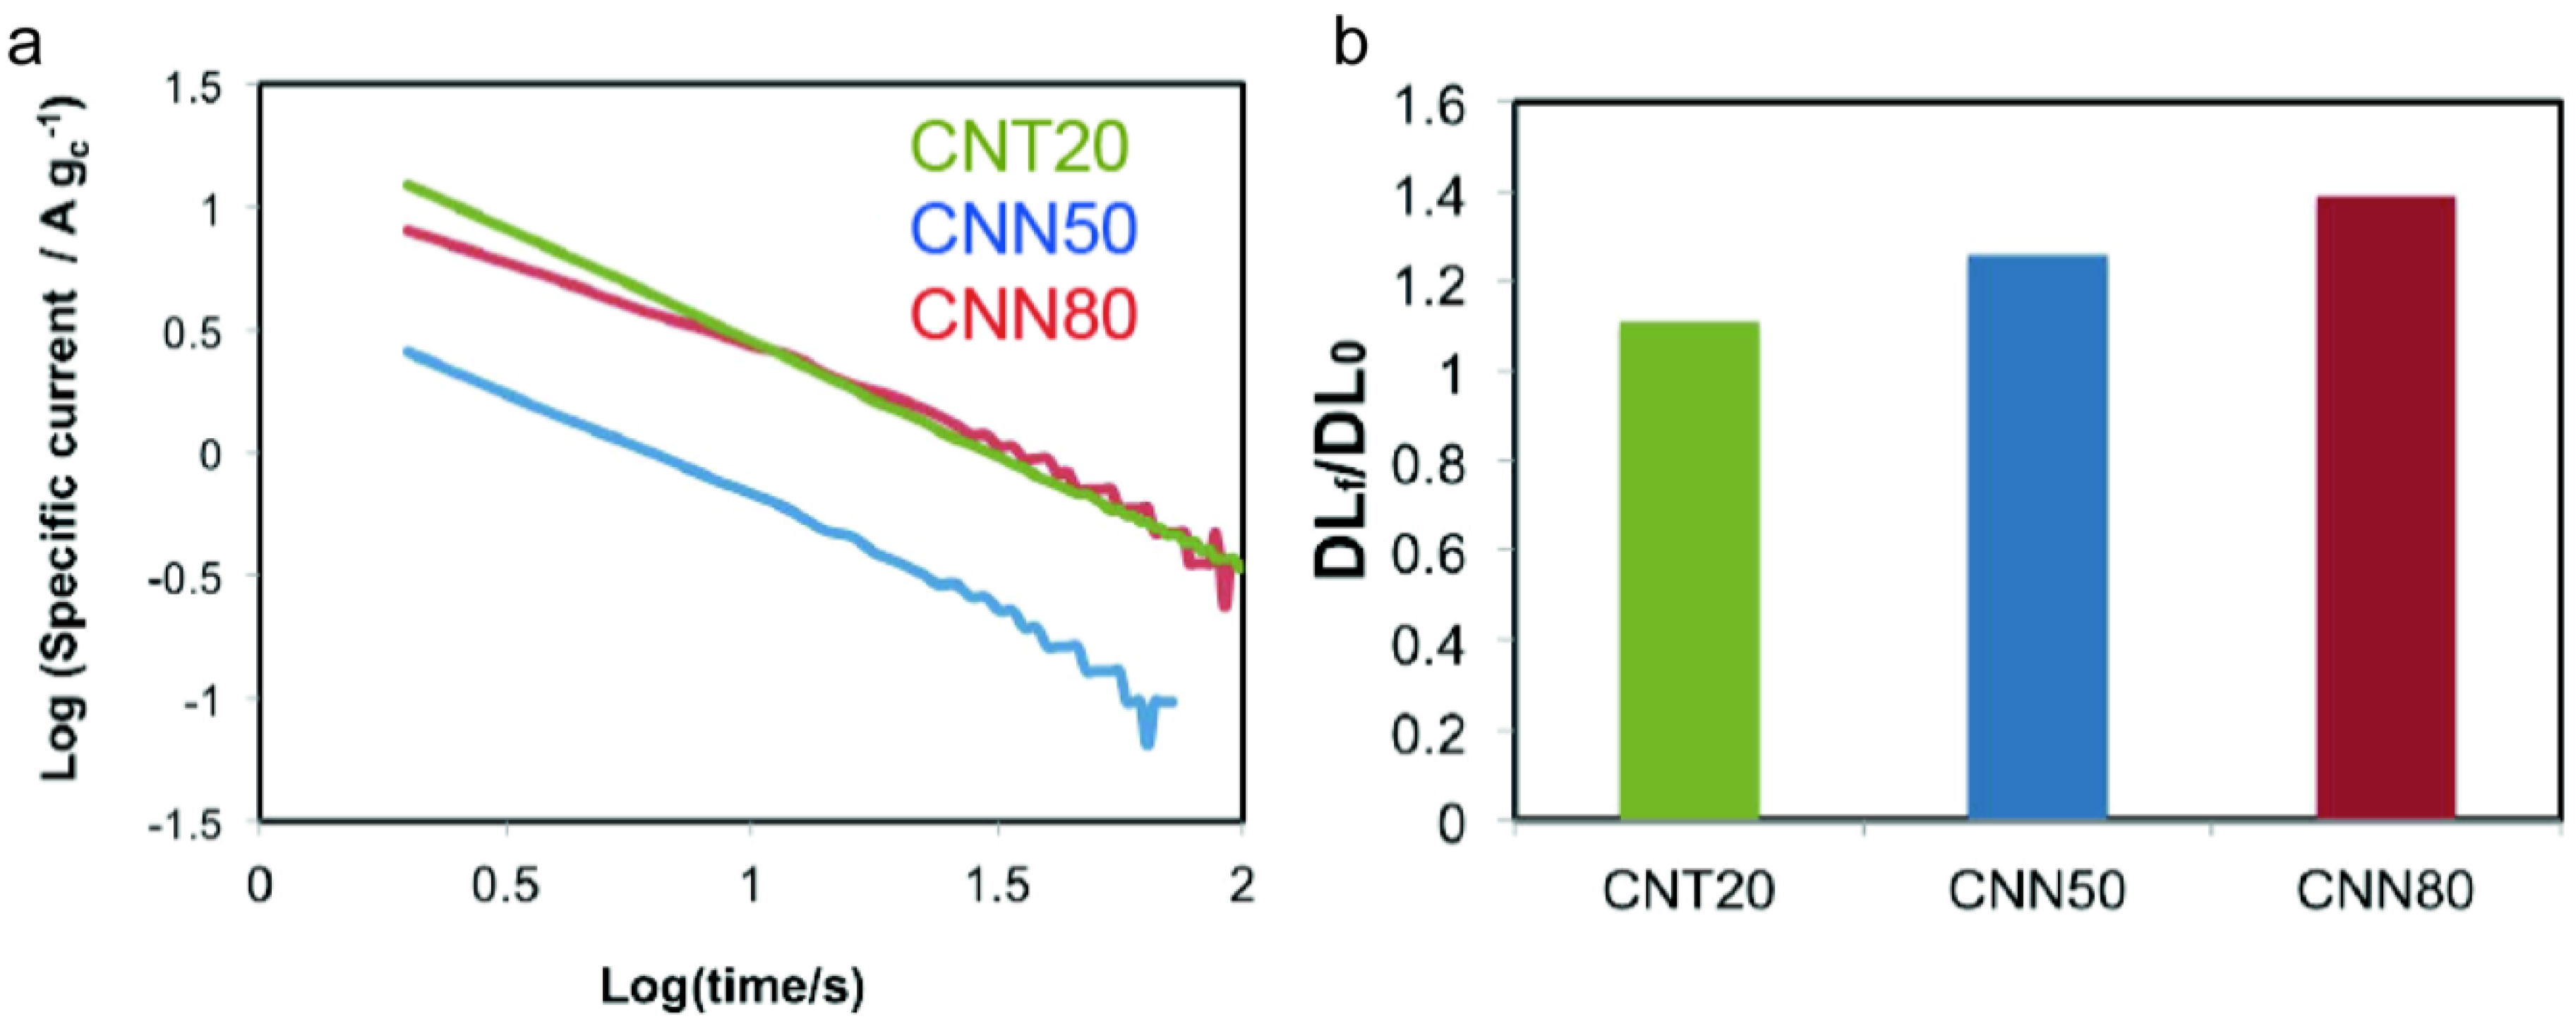
2.3.2. Corrosion Tests

Corrosion resistance was evaluated by electrochemical methods. Carbon corrosion experiments were conducted in a three-electrode cell by means of potential holding (1.4 V vs. RHE) for 60 min and measuring exchange current density as a function of time. Carbon corrosion takes place at potentials larger than 0.207 V vs. RHE according to the following reactions:
C + H2O↔COsurf + 2H+ + 2eE0 > 0.3 V versus RHE
COsurf + H2O↔CO2 + 2H+ + 2eE0 > 0.8 V versus RHE
Generally, the overall reaction is expressed as:
C + 2 H 2  CO 2 + 4 H + + 4 e   E 0 = 0.207  V vs RHE 
whose current-time, jt, behavior is generally described according to the following equation:
j = k t n
where k and n are the corrosion rate coefficient and the order of corrosion reaction respectively [16]. Figure 6a shows log j vs. log t curves from which the parameters, k and n, were extracted. The charge exchanged over 60 min and the extracted parameters k and n are summarized in Table 3.
From Figure 6a, one may observe that the corrosion rate for Pt/CNT20 is higher than Pt/CNN80. The lowest corrosion rate is achieved for Pt/CNN50. Generally, corrosion depends on the amount of defects present in the CNN samples and on the Pt-carbon contact surface area, since Pt is a strong catalyst for carbon corrosion. Previous studies show that corrosion in PEM electrodes, measured as CO2 evolution, is proportional to the Pt-carbon contact area [4]. Since the Pt loading does not vary significantly for the different samples, one would expect that the most defected carbon (CNN80) would be the less resistant to corrosion. The different behavior of our catalysts is probably related to the presence of PCA, which acts as a protection from carbon corrosion, preventing direct contact with Pt. Additionally, the platinum-support interaction plays an important role in improving the long-term stability, as much as 20% as reported in previous studies [33]. The amount of defects on the carbon surface might then have a controversial role: they result in a support more prone to corrosion but they favor PCA adhesion that acts as a protection. CNN50 might then have an optimum amount of defects.
After corrosion, the Double Layer Capacitance (DLC) increased due to an increased amount of defects on the surface and an increased roughening of the surface. The initial DLC, calculated at the net of GDL contributions and neglecting the contribution of Pt, and the ratio of DLC after and before corrosion are reported in Table 3 and Figure 6b, respectively, for the various samples. For CNT the corrosion is expected to take place according to Equations (1) and (2), leading to an increase of DLC due to the creation of more surface defects, but at the same time, the ratio DLCf/DLC0 does not increase so much due to a loss of carbon. For CNN, carbon loss plays a less significant role, since DLC increase is much more significant.

3. Experimental Section

3.1. Chemicals

Sodium bis(2-ethyhexyl) sulphosuccinate as surfactant, also known as Na-AOT (C20H37NaO7S, 99%), n-heptane (99.9%) as solvent, ethanol (99.5%), methanol (MeOH, 99.8%), sulphuric acid (97%–98%), chloroplatinic acid hexahydrate (≥99.9%), perchloric acid (70%),) sodium hydroxide (>97%), 1-pyrenecarboxylic acid (97%) were purchased from Sigma-Aldrich, Milan, Italy. Iron(II) acetate (FeAc, 97%) metal source was purchased from Strem Chemicals. Ethene, nitrogen, hydrogen and oxygen gases were supplied in cylinders by Siad with 99.999% purity. Multi-walled CNTs (NTX3) were purchased from Nanothinx S.A, Rio Patras, Greece, ethylene glycol (99.5%) and acetone (>99.8%) from Fluka, Milan, Italy, Nafion® solution in aliphatic alcohols (5%) was purchased from Sigma-Aldrich, Milan, Italy, Carbon Cloth coated with a gas diffusion layer was purchased from E-TEK (Boston, MA, USA). All aqueous solutions were prepared using ultrapure water obtained from a Millipore Milli-Q system with resistivity >18 MΩ·cm−1. All chemicals were used as received from suppliers.

3.2. Carbon Support Synthesis and Functionalization

3.2.1. Preparation of CNNs

Two batches of CNNs, labelled CNN50 and CNN80, were synthesized by catalytic CVD, as previously described [11,19].

3.2.2. PCA Functionalization of Graphitic Carbon Supports

Graphitic Carbon supports were non-covalently functionalized by 1-pyrenecarboxylic acid (PCA). The PCA-functionalized carbons were prepared by adding the raw carbons to concentrated ethanol containing PCA (1 mM). The mixture was ultrasonicated for 20 min and then refluxed for 3 h at 25 °C under vigorous stirring. PCA-functionalized Carbons were recovered by centrifugation and washed three times with ethanol. PCA concentration in ethanol at the end of functionalization was measured by UV-Vis in order to calculate the PCA deposited, having previously built a calibration curve with known concentrations.

3.2.3. Catalyst Deposition

Platinum NPs were prepared by a colloidal route described in previous works [34]. Briefly, H2PtCl6 and carbon support were mixed in ethylene glycol with a concentration of 0.5 mg·Pt mL−1 and 3.5 mg·mL−1 respectively. The pH was adjusted to 8–10 by addition of 1M NaOH solution. Subsequently, the temperature was increased to 125 °C and kept for 2 h, under N2 reflux and rigorous stirring. The pH was adjusted to 2 by addition of sulphuric acid, in order to enhance Pt/carbon support interactions as described in previous work [28,34], and was mixed for 12 h. Afterwards, the mixture was filtrated, washed, centrifuged and dried at 100 °C.

3.3. Supports and Electrocatalyst Characterization

UV-Vis spectra were recorded as a function of time with a UV-1800 spectrophotometer from Shimadzu Corporation, Kyoto, Japan. Water was used as a reference because of its stable absorption. Confocal Microscopy images were acquired using a liquid cell.
Transmission Electron Microscopy (TEM) was accomplished using a CM300UT-FEG electron microscope, Philips, Amsterdam, The Netherlands, with a point resolution of 0.17 nm, information limit of 0.1 nm, which was operated at 200 kV, in which images were acquired with a TVIPS CCD camera. For TEM-measurements, samples were prepared by immersing a Quantifoil R copper microgrid in a dispersion of powder consisting of electrocatalyst prepared in ethanol. Size distributions were obtained by measuring at least 200 NPs per sample. Elemental analysis by means of energy-dispersive X-ray spectroscopy (EDX) was carried out on all the samples. For textural characterization, an Autosorb-1c setup (Quantachrome Instruments, Boynton Beach, FL, USA) was used. All samples were outgassed at 350 °C for 17 h in vacuum. Nitrogen (N2) adsorption isotherms were obtained at 77 K. Specific surface area was obtained from the N2 isotherm using the Brunauer-Emmett-Teller (BET) method. Micropore volumes were calculated using the Dubinin Radushkevich equation. Raman spectroscopy was performed with a Raman imaging microscope, System 2000 from Renishaw Public Limited Company, Wotton-under-Edge, UK, operated with a 20 mW Argon ion laser of wavelength 514 nm. Samples were cast on a silicon wafer and measured over 60 s. TGA measurements were carried on a TGA7, Perkin Elmer, Waltham, MA, USA. The weight loss in air was measured when increasing the temperature from 25 °C to 900 °C, with a rate of 10 °C min−1. Raman spectroscopy was performed with a Raman imaging microscope, System 2000 from Renishaw Public Limited Company, operated with a 20 mW Argon ion laser of wavelength 514 nm. Samples were cast on a silicon wafer and measured over 60 s.
The catalysts were characterized by XRD using an X-pert 3710 X-ray diffractometer (Philips, Amsterdam, The Netherlands) with Cu Kα radiation operating at 40 kV and 30 mA. The peak profile of the (220) reflection in the face centered cubic structure of Pt catalysts was analyzed by using the Marquardt algorithm, and it was used to calculate the crystallite size by the Debye-Scherrer equation. Instrumental broadening was determined by using a standard Pt sample.

3.4. Electrochemical Characterization

Half-cell tests were carried out in a three electrode cell consisting of a gas diffusion electrode as a working electrode, a mercury-mercurous sulphate (Hg/Hg2SO4, sat.) as a reference electrode and a platinum grid as counter electrode. The gas diffusion electrode was prepared according to a procedure described in previous work [16]. Briefly, hydrophobic carbon cloth covered with a diffusion layer (LT 1200 W Elat, ETEK, Boston, MA, USA) was used as backing layer on which the catalytic layer was distributed with a blade. The catalytic layer was composed of 33 wt% Nafion and 67 wt. % catalyst. Electrocatalyst loading was 1.3 ± 0.3 mg·cm−2. The electrode area was 1.5 cm2 and 0.5 M H2SO4 solution was used as electrolyte. Gases (oxygen or nitrogen) were fed from the backside of the electrode in order to perform electrochemical test as described. An Autolab (Metrohm, Utrecht, The Netherlands) potentiostat/galvanostat was used to perform the measurements. ORR activities of the prepared catalysts were evaluated at room temperature by means of the linear sweep voltammetry at 10 mVs−1 between the Open Circuit Voltage (OCV) and 0.1 V versus a Reversible Hydrogen Electrode (RHE). Kinetic current, mass specific activity im and specific activity is were evaluated at 0.9 V. Ohmic resistance correction calculated with Impedance Spectroscopy (IS) was applied. ORR activities after degradation were evaluated in the same manner. Accelerated Durability Tests (ADTs) were carried out by scanning the potential between 0.6 and 1.2 V at a scan rate of 20 mV·s−1 in 0.5 M H2SO4 saturated with N2 by performing 1000 cycles [16]. Uncompensated resistance was obtained from high frequency impedance. Cyclic Voltammetry (CV) was carried out before and after ADT at room temperature, 25 °C, with a scan rate of 50 mV·s−1 in a potential window of 0.02–1.2 V vs. RHE. ORR activities before and after ADT were evaluated by means of Linear Sweep Voltammetry (LSV) at 10 mV·s −1 between the OCV and 0.1 V vs. RHE. Electrochemical carbon corrosion experiments were conducted in the half-cell system by means of potential holding (1.4 V vs. RHE).

4. Conclusions

We have successfully synthetized a Pt-catalyst supported on different graphitic supports, two synthetized in-house (CNN) and one commercial (CNT), previously non-covalently functionalized with PCA. Supports differ in geometry and thus specific surface area, content of defects and thus oxidation resistance. We have showed that Pt deposition over non-covalently functionalized graphitic structure is efficient and reliable. However, PCA functionalization efficiency depends on the number of defects that enhance the dispersion properties of the otherwise inert graphitic surfaces. The presence of defects then facilitates PCA adsorption and subsequently the Pt deposition. From accelerated durability tests and corrosion tests, catalyst durability seems to depend on a synergy between carbon support properties and deposition methods.

Acknowledgments

A.S., A.S.A. and V.B. acknowledge the financial support of the PRIN 2010–2011 project “Advanced nanocomposite membranes and innovative electrocatalysts for durable polymer electrolyte membrane fuel cells (NAMED-PEM)”. We thank Louw Florusse for TEM micrographs and Roman Latsuzbaia for discussion. We acknowledge financial support from the Advanced Dutch Energy Materials (ADEM) Program, the Ministry of Economic Affairs in the Netherlands in the framework of IOP-Self Healing Materials (SHM) Program, and the COST CM1101 Action.

Author Contributions

E.N., V.B. and G.J.M.K. conceived and designed the experiments; E.N. prepared and characterized the catalysts; A.S. performed the XRD analyses; E.N., V.B., A.S.A. and G.J.M.K. analyzed the data; E.N. wrote the paper; V.B., A.S.A. and G.J.M.K. revised the paper; all authors provided feedback during preparation of the manuscript.

Conflicts of Interest

The authors declare no conflict of interest.

References

  1. Dillon, R.; Srinivasan, S.; Aricò, A.S.; Antonucci, V. International activities in DMFC R&D: Status of technologies and potential applications. J. Power Sources 2004, 127, 112–126. [Google Scholar]
  2. Specchia, S.; Francia, C.; Spinelli, P. Polymer electrolyte membrane fuel cells. In Electrochemical Technologies for Energy Storage and Conversion; Wiley-VCH Verlag GmbH & Co. KGaA: Weinheim, Germany, 2011; pp. 601–670. [Google Scholar]
  3. Aricò, A.S.; Baglio, V.; Antonucci, V. Direct Methanol Fuel Cells; Nova Science Publishers: Hauppauge, NY, USA, 2010. [Google Scholar]
  4. De Bruijn, F.A.; Dam, V.A.T.; Janssen, G.J.M. Review: Durability and degradation issues of PEM fuel cell components. Fuel Cells 2008, 8, 3–22. [Google Scholar] [CrossRef]
  5. Zeng, J.; Francia, C.; Dumitrescu, M.A.; Videla, A.H.A.M.; Ijeri, V.S.; Specchia, S.; Spinelli, P. Electrochemical performance of Pt-based catalysts supported on different ordered mesoporous carbons (Pt/OMCs) for oxygen reduction reaction. Ind. Eng. Chem. Res. 2011, 51, 7500–7509. [Google Scholar] [CrossRef]
  6. Gasteiger, H.A.; Kocha, S.S.; Sompalli, B.; Wagner, F.T. Activity benchmarks and requirements for Pt, Pt-alloy, and non-Pt oxygen reduction catalysts for PEMFCs. Appl. Catal. B 2005, 56, 9–35. [Google Scholar] [CrossRef]
  7. Galvez, M.E.; Calvillo, L.; Alegre, C.; Sebastian, D.; Suelves, I.; Perez-Rodriguez, S.; Celorrio, V.; Pastor, E.; Pardo, J.I.; Moliner, R.; et al. Nanostructured carbon materials as supports in the preparation of direct methanol fuel cell electrocatalysts. Catalysts 2013, 3, 671–682. [Google Scholar] [CrossRef]
  8. Ferrandon, M.; Wang, X.; Kropf, A.J.; Myers, D.J.; Wu, G.; Johnston, C.M.; Zelenay, P. Stability of iron species in heat-treated polyaniline-iron-carbon polymer electrolyte fuel cell cathode catalysts. Electrochim. Acta 2013, 110, 282–291. [Google Scholar] [CrossRef]
  9. Borup, R.; Meyers, J.; Pivovar, B.; Kim, Y.S.; Mukundan, R.; Garland, N.; Myers, D.; Wilson, M.; Garzon, F.; Wood, D.; et al. Scientific aspects of polymer electrolyte fuel cell durability and degradation. Chem. Rev. 2007, 107, 3904–3951. [Google Scholar] [CrossRef] [PubMed]
  10. Siroma, Z.; Ishii, K.; Yasuda, K.; Miyazaki, Y.; Inaba, M.; Tasaka, A. Imaging of highly oriented pyrolytic graphite corrosion accelerated by Pt particles. Electrochem. Commun. 2005, 7, 1153–1156. [Google Scholar] [CrossRef]
  11. Negro, E.; Dieci, M.; Sordi, D.; Kowlgi, K.; Makkee, M.; Koper, G.J.M. High yield, controlled synthesis of graphitic networks from dense micro emulsions. Chem. Commun. 2014, 50, 11848–11851. [Google Scholar] [CrossRef] [PubMed]
  12. Negro, E.; Latsuzbaia, R.; Dieci, M.; Boshuizen, I.; Koper, G.J.M. Pt electrodeposited over carbon nano-networks grown on carbon paper as durable catalyst for PEM fuel cells. Appl. Catal. B 2015, 166–167, 155–165. [Google Scholar] [CrossRef]
  13. Negro, E.; Videla, A.H.A.M.; Baglio, V.; Aricò, A.S.; Specchia, S.; Koper, G.J.M. Fe-N supported on graphitic carbon nano-networks grown from cobalt as oxygen reduction catalysts for low-temperature fuel cells. Appl. Catal. B 2015, 166–167, 75–83. [Google Scholar] [CrossRef]
  14. Negro, E.; Vries, M.A.D.; Latsuzbaia, R.; Koper, G.J.M. Networked graphitic structures as durable catalyst support for PEM electrodes. Fuel Cells 2014, 14, 350–356. [Google Scholar] [CrossRef]
  15. Sebastián, D.; Lázaro, M.J.; Suelves, I.; Moliner, R.; Baglio, V.; Stassi, A.; Aricò, A.S. The influence of carbon nanofiber support properties on the oxygen reduction behavior in proton conducting electrolyte-based direct methanol fuel cells. Int. J. Hydrogen Energy 2012, 37, 6253–6260. [Google Scholar] [CrossRef]
  16. Sebastián, D.; Ruíz, A.G.; Suelves, I.; Moliner, R.; Lázaro, M.J.; Baglio, V.; Stassi, A.; Aricò, A.S. Enhanced oxygen reduction activity and durability of Pt catalysts supported on carbon nanofibers. Appl. Catal. B 2012, 115–116, 269–275. [Google Scholar] [CrossRef]
  17. Sebastián, D.; Suelves, I.; Moliner, R.; Lázaro, M.J.; Stassi, A.; Baglio, V.; Aricò, A.S. Optimizing the synthesis of carbon nanofiber based electrocatalysts for fuel cells. Appl. Catal. B 2013, 132–133, 22–27. [Google Scholar] [CrossRef]
  18. Carrera-Cerritos, R.; Baglio, V.; Aricò, A.S.; Ledesma-García, J.; Sgroi, M.F.; Pullini, D.; Pruna, A.J.; Mataix, D.B.; Fuentes-Ramírez, R.; Arriaga, L.G. Improved Pd electro-catalysis for oxygen reduction reaction in direct methanol fuel cell by reduced graphene oxide. Appl. Catal. B 2014, 144, 554–560. [Google Scholar] [CrossRef]
  19. Kowlgi, K.N.K.; Koper, G.J.M.; van Raalten, R.A.D. Carbon nanostructures and networks produced by chemical vapor deposition. US Patent 20130244023 A1, 19 September 2013. [Google Scholar]
  20. Kowlgi, K.; Lafont, U.; Rappolt, M.; Koper, G. Uniform metal nanoparticles produced at high yield in dense microemulsions. J. Colloid Interf. Sci. 2012, 372, 16–23. [Google Scholar] [CrossRef] [PubMed]
  21. Latsuzbaia, R.; Negro, E.; Koper, G. Bicontinuous microemulsions for high yield, wet synthesis of ultrafine nanoparticles: A general approach. Faraday Discuss. 2015, 181, 37–48. [Google Scholar] [CrossRef] [PubMed]
  22. Negro, E.; Latsuzbaia, R.; Koper, G.J.M. Bicontinuous microemulsions for high yield wet synthesis of ultrafine platinum nanoparticles: Effect of precursors and kinetics. Langmuir 2014, 30, 8300–8307. [Google Scholar] [CrossRef] [PubMed]
  23. Saha, M.S.; Kundu, A. Functionalizing carbon nanotubes for proton exchange membrane fuel cells electrode. J. Power Sources 2010, 195, 6255–6261. [Google Scholar] [CrossRef]
  24. Wu, H.; Wexler, D.; Wang, G.; Liu, H. Pt/C catalysts using different carbon supports for the cathode of PEM fuel cells. Adv. Sci. Lett. 2011, 4, 115–120. [Google Scholar] [CrossRef]
  25. Xu, C.; Chen, J.; Cui, Y.; Han, Q.; Choo, H.; Liaw, P.K.; Wu, D. Influence of the surface treatment on the deposition of platinum nanoparticles on the carbon nanotubes. Adv. Eng. Mater. 2006, 8, 73–77. [Google Scholar] [CrossRef]
  26. Xing, Y. Synthesis and electrochemical characterization of uniformly-dispersed high loading Pt nanoparticles on sonochemically-treated carbon nanotubes. J. Phys. Chem. B 2004, 108, 19255–19259. [Google Scholar] [CrossRef]
  27. Latsuzbaia, R.; Negro, E.; Koper, G.J.M. Environmentally friendly carbon-preserving recovery of noble metals from supported fuel cell catalysts. ChemSusChem 2015, 8, 1926–1934. [Google Scholar] [CrossRef] [PubMed]
  28. Oh, H.-S.; Kim, H. Efficient synthesis of Pt nanoparticles supported on hydrophobic graphitized carbon nanofibers for electrocatalysts using noncovalent functionalization. Adv. Funct. Mater. 2011, 21, 3954–3960. [Google Scholar] [CrossRef]
  29. Esmaeilifar, A.; Rowshanzamir, S.; Eikani, M.H.; Ghazanfari, E. Synthesis methods of low-Pt-loading electrocatalysts for proton exchange membrane fuel cell systems. Energy 2010, 35, 3941–3957. [Google Scholar] [CrossRef]
  30. Zou, J.; Zeng, X.; Xiong, X.; Tang, H.; Li, L.; Liu, Q.; Li, Z. Preparation of vapor grown carbon fibers by microwave pyrolysis chemical vapor deposition. Carbon 2007, 45, 828–832. [Google Scholar] [CrossRef]
  31. Stassi, A.; Modica, E.; Antonucci, V.; Aricò, A.S. A half cell study of performance and degradation of oxygen reduction catalysts for application in low temperature fuel cells. Fuel Cells 2009, 9, 201–208. [Google Scholar] [CrossRef]
  32. Curnick, O.J.; Mendes, P.M.; Pollet, B.G. Enhanced durability of a Pt/C electrocatalyst derived from nafion-stabilised colloidal platinum nanoparticles. Electrochem. Commun. 2010, 12, 1017–1020. [Google Scholar] [CrossRef]
  33. Stamatin, S.N.; Borghei, M.; Dhiman, R.; Andersen, S.M.; Ruiz, V.; Kauppinen, E.; Skou, E.M. Activity and stability studies of platinized multi-walled carbon nanotubes as fuel cell electrocatalysts. Appl. Catal. B 2015, 162, 289–299. [Google Scholar] [CrossRef] [Green Version]
  34. Oh, H.-S.; Oh, J.-G.; Kim, H. Modification of polyol process for synthesis of highly platinum loaded platinum-carbon catalysts for fuel cells. J. Power Sources 2008, 183, 600–603. [Google Scholar] [CrossRef]

