
Heterogeneous Catalyst Deactivation and Regeneration: A Review


Abstract
:1. Introduction
2. Mechanisms of Deactivation

| Mechanism | Type | Brief definition/description |
|---|---|---|
| Poisoning | Chemical | Strong chemisorption of species on catalytic sites which block sites for catalytic reaction |
| Fouling | Mechanical | Physical deposition of species from fluid phase onto the catalytic surface and in catalyst pores |
| Thermal degradation and sintering | Thermal Thermal/chemical | Thermally induced loss of catalytic surface area, support area, and active phase-support reactions |
| Vapor formation | Chemical | Reaction of gas with catalyst phase to produce volatile compound |
| Vapor–solid and solid–solid reactions | Chemical | Reaction of vapor, support, or promoter with catalytic phase to produce inactive phase |
| Attrition/crushing | Mechanical | Loss of catalytic material due to abrasion; loss of internal surface area due to mechanical-induced crushing of the catalyst particle |
2.1. Poisoning
| Chemical type | Examples | Type of interaction with metals |
|---|---|---|
| Groups VA and VIA | N, P, As, Sb, O, S, Se, Te | Through s and p orbitals; shielded structures are less toxic |
| Group VIIA | F, Cl, Br, I | Through s and p orbitals; formation of volatile halides |
| Toxic heavy metals and ions | As, Pb, Hg, Bi, Sn, Cd, Cu, Fe | Occupy d orbitals; may form alloys |
| Molecules that adsorb with multiple bonds | CO, NO, HCN, benzene, acetylene, other unsaturated hydrocarbons | Chemisorption through multiple bonds and back bonding |
| Catalyst | Reaction | Poisons |
|---|---|---|
| Silica–alumina, zeolites | Cracking | Organic bases, hydrocarbons, heavy metals |
| Nickel, platinum, palladium | Hydrogenation/dehydrogenation | Compounds of S, P, As, Zn, Hg, halides, Pb, NH3, C2H2 |
| Nickel | Steam reforming of methane, naphtha | H2S, As |
| Iron, ruthenium | Ammonia synthesis | O2, H2O, CO, S, C2H2, H2O |
| Cobalt, iron | Fischer–Tropsch synthesis | H2S, COS, As, NH3, metal carbonyls |
| Noble metals on zeolites | Hydrocracking | NH3, S, Se, Te, P |
| Silver | Ethylene oxidation to ethylene oxide | C2H2 |
| Vanadium oxide | Oxidation/selective catalytic reduction | As/Fe, K, Na from fly ash |
| Platinum, palladium | Oxidation of CO and hydrocarbons | Pb, P, Zn, SO2, Fe |
| Parameter | Definition |
|---|---|
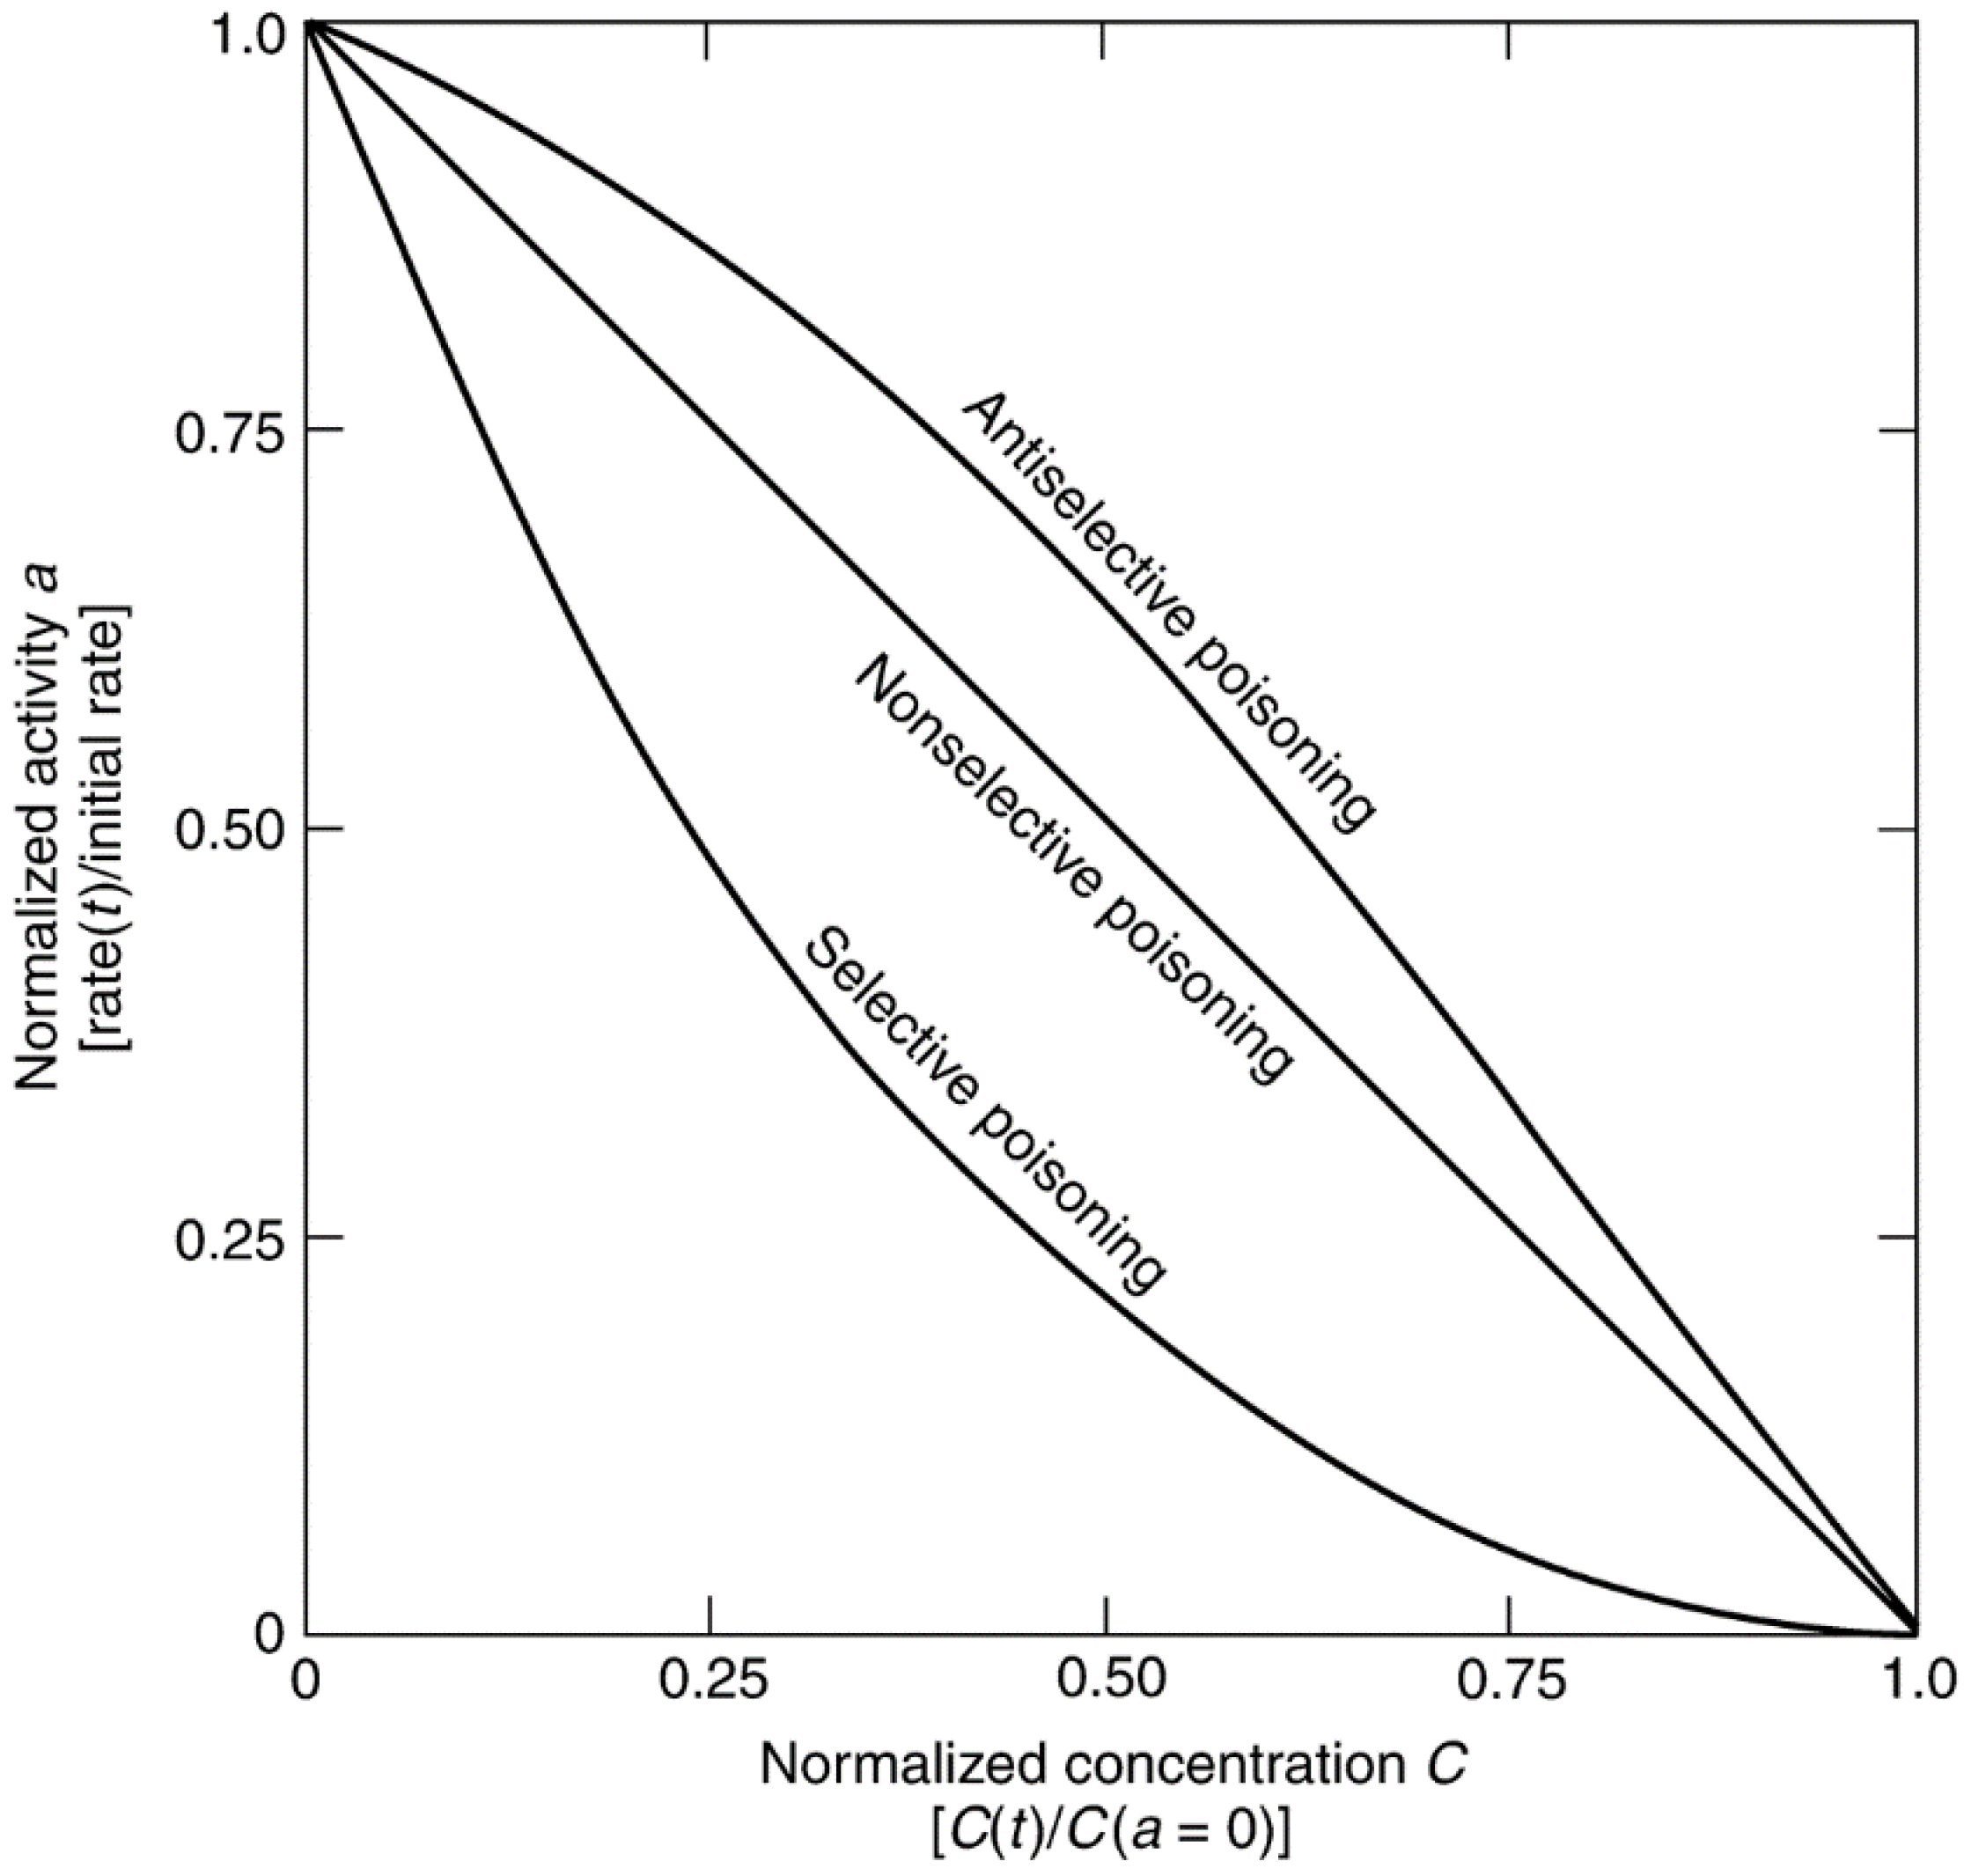
| Activity (a) | Reaction rate at time t relative to that at t = 0 |
| Susceptibility (σ) | Negative slope of the activity versus poison concentration curve [σ = (a − 1)/C (t)]. Measure of a catalyst’s sensitivity to a given poison |
| Toxicity | Susceptibility of a given catalyst for a poison relative to that for another poison |
| Resistance | Inverse of the deactivation rate. Property that determines how rapidly a catalyst deactivates |
| Tolerance (a(Csat)) | Activity of the catalyst at saturation coverage (some catalysts may have negligible activity at saturation coverage) |

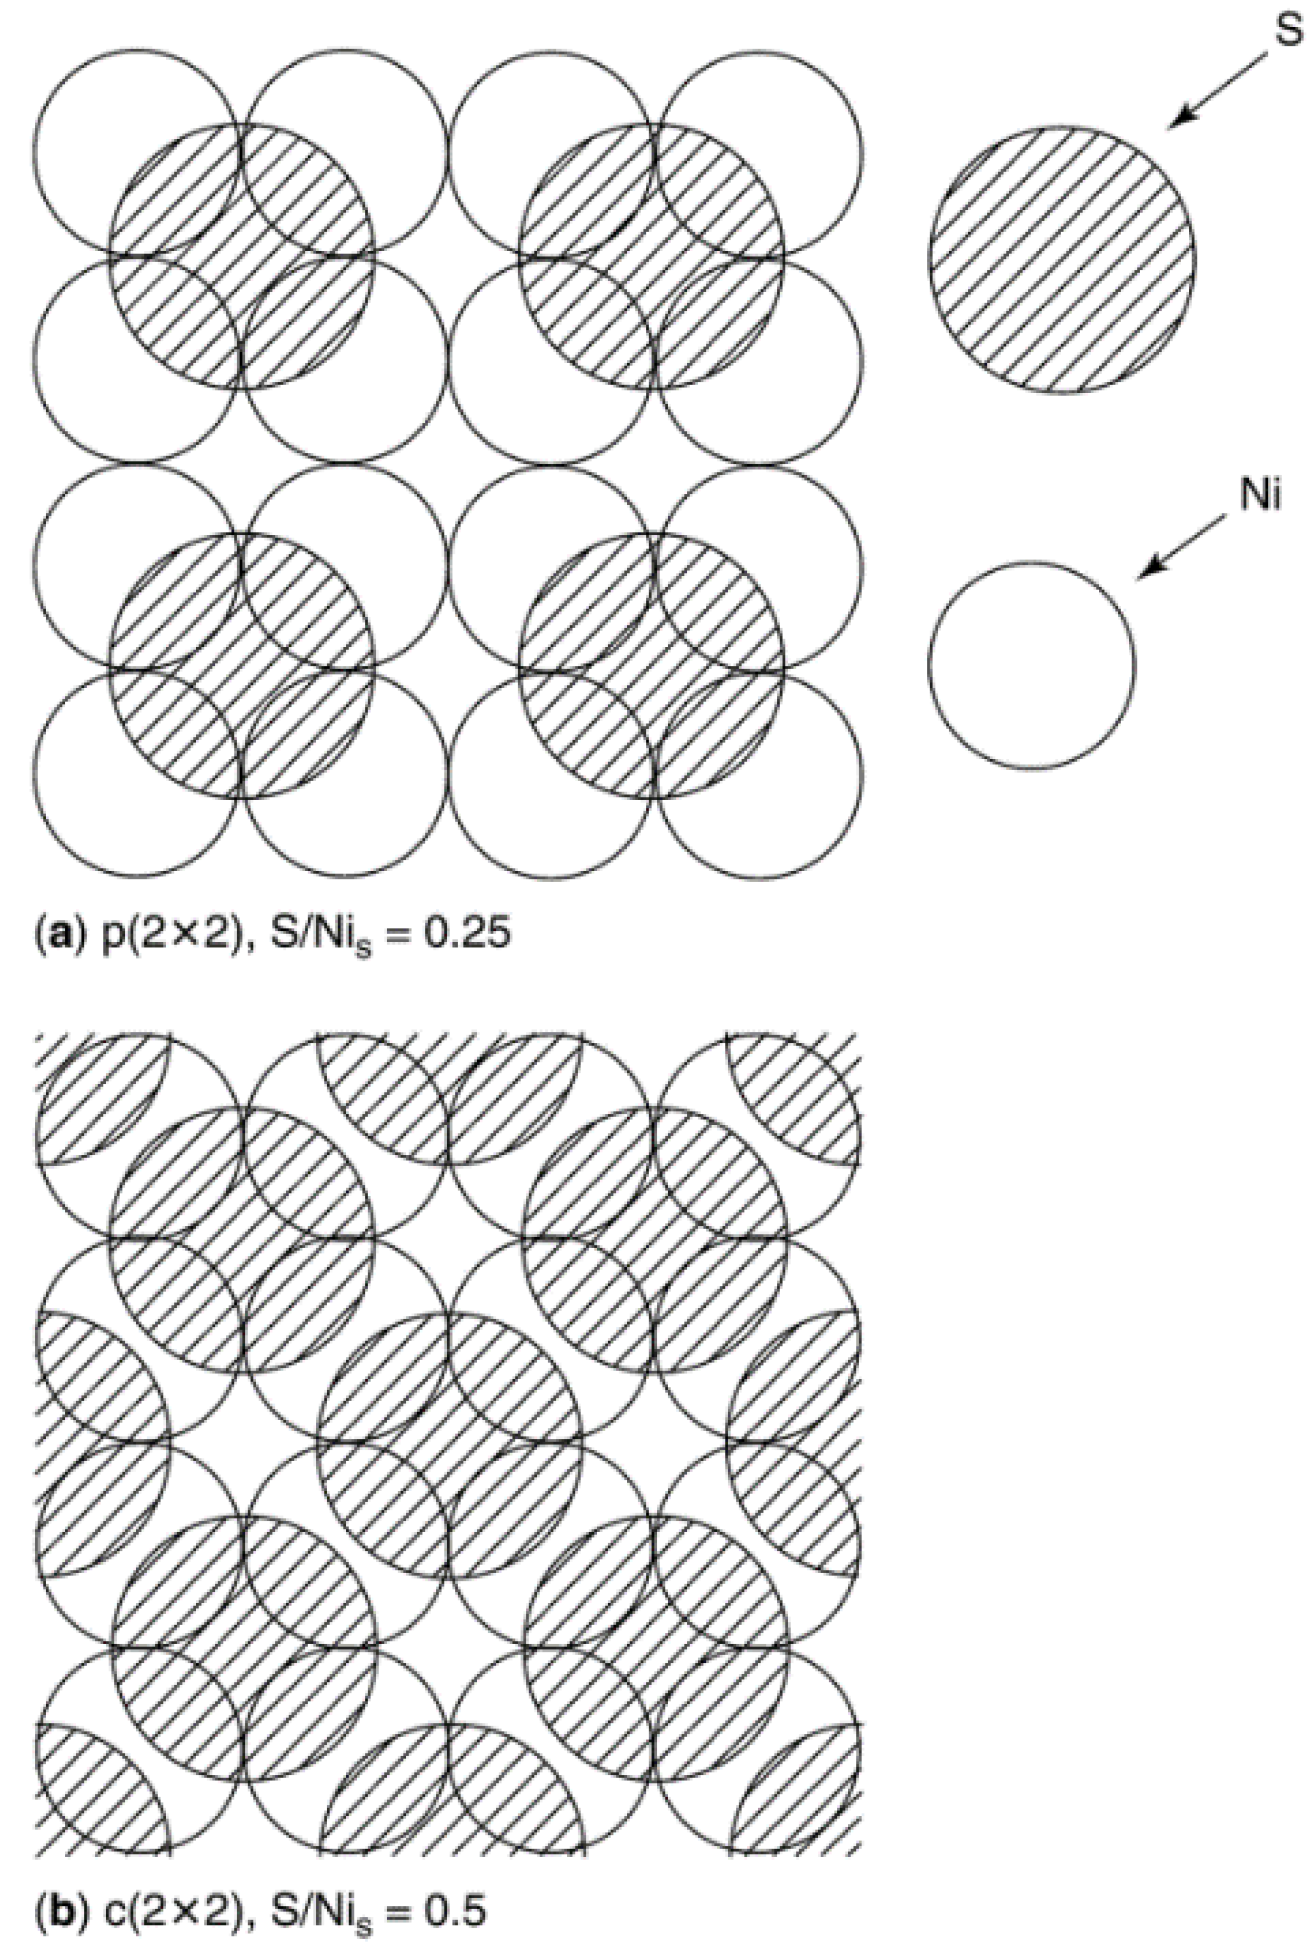
| Crystal face | Sulfur conc. at saturation, ng·S/cm2 | Number of S atoms/cm2 (×1015) | Number of Ni atoms/cm2 (×1015) | S atoms per surface Ni atom |
|---|---|---|---|---|
| (111) | 47 ± 1 | 0.86 | 1.8 | 0.48 |
| (100) | 43 ± 1 | 0.80 | 1.6 | 0.50 |
| (110) | 44.5 ± 1 | 0.82 | 1.1 | 0.74 |
| (210) | 42 ± 1 | 0.78 | 0.72 | 1.09 |
| Polycrystalline | 44.5 ± 1 | 0.82 | — | — |

2.2. Fouling, Coking, and Carbon Deposition
2.2.1. Fouling
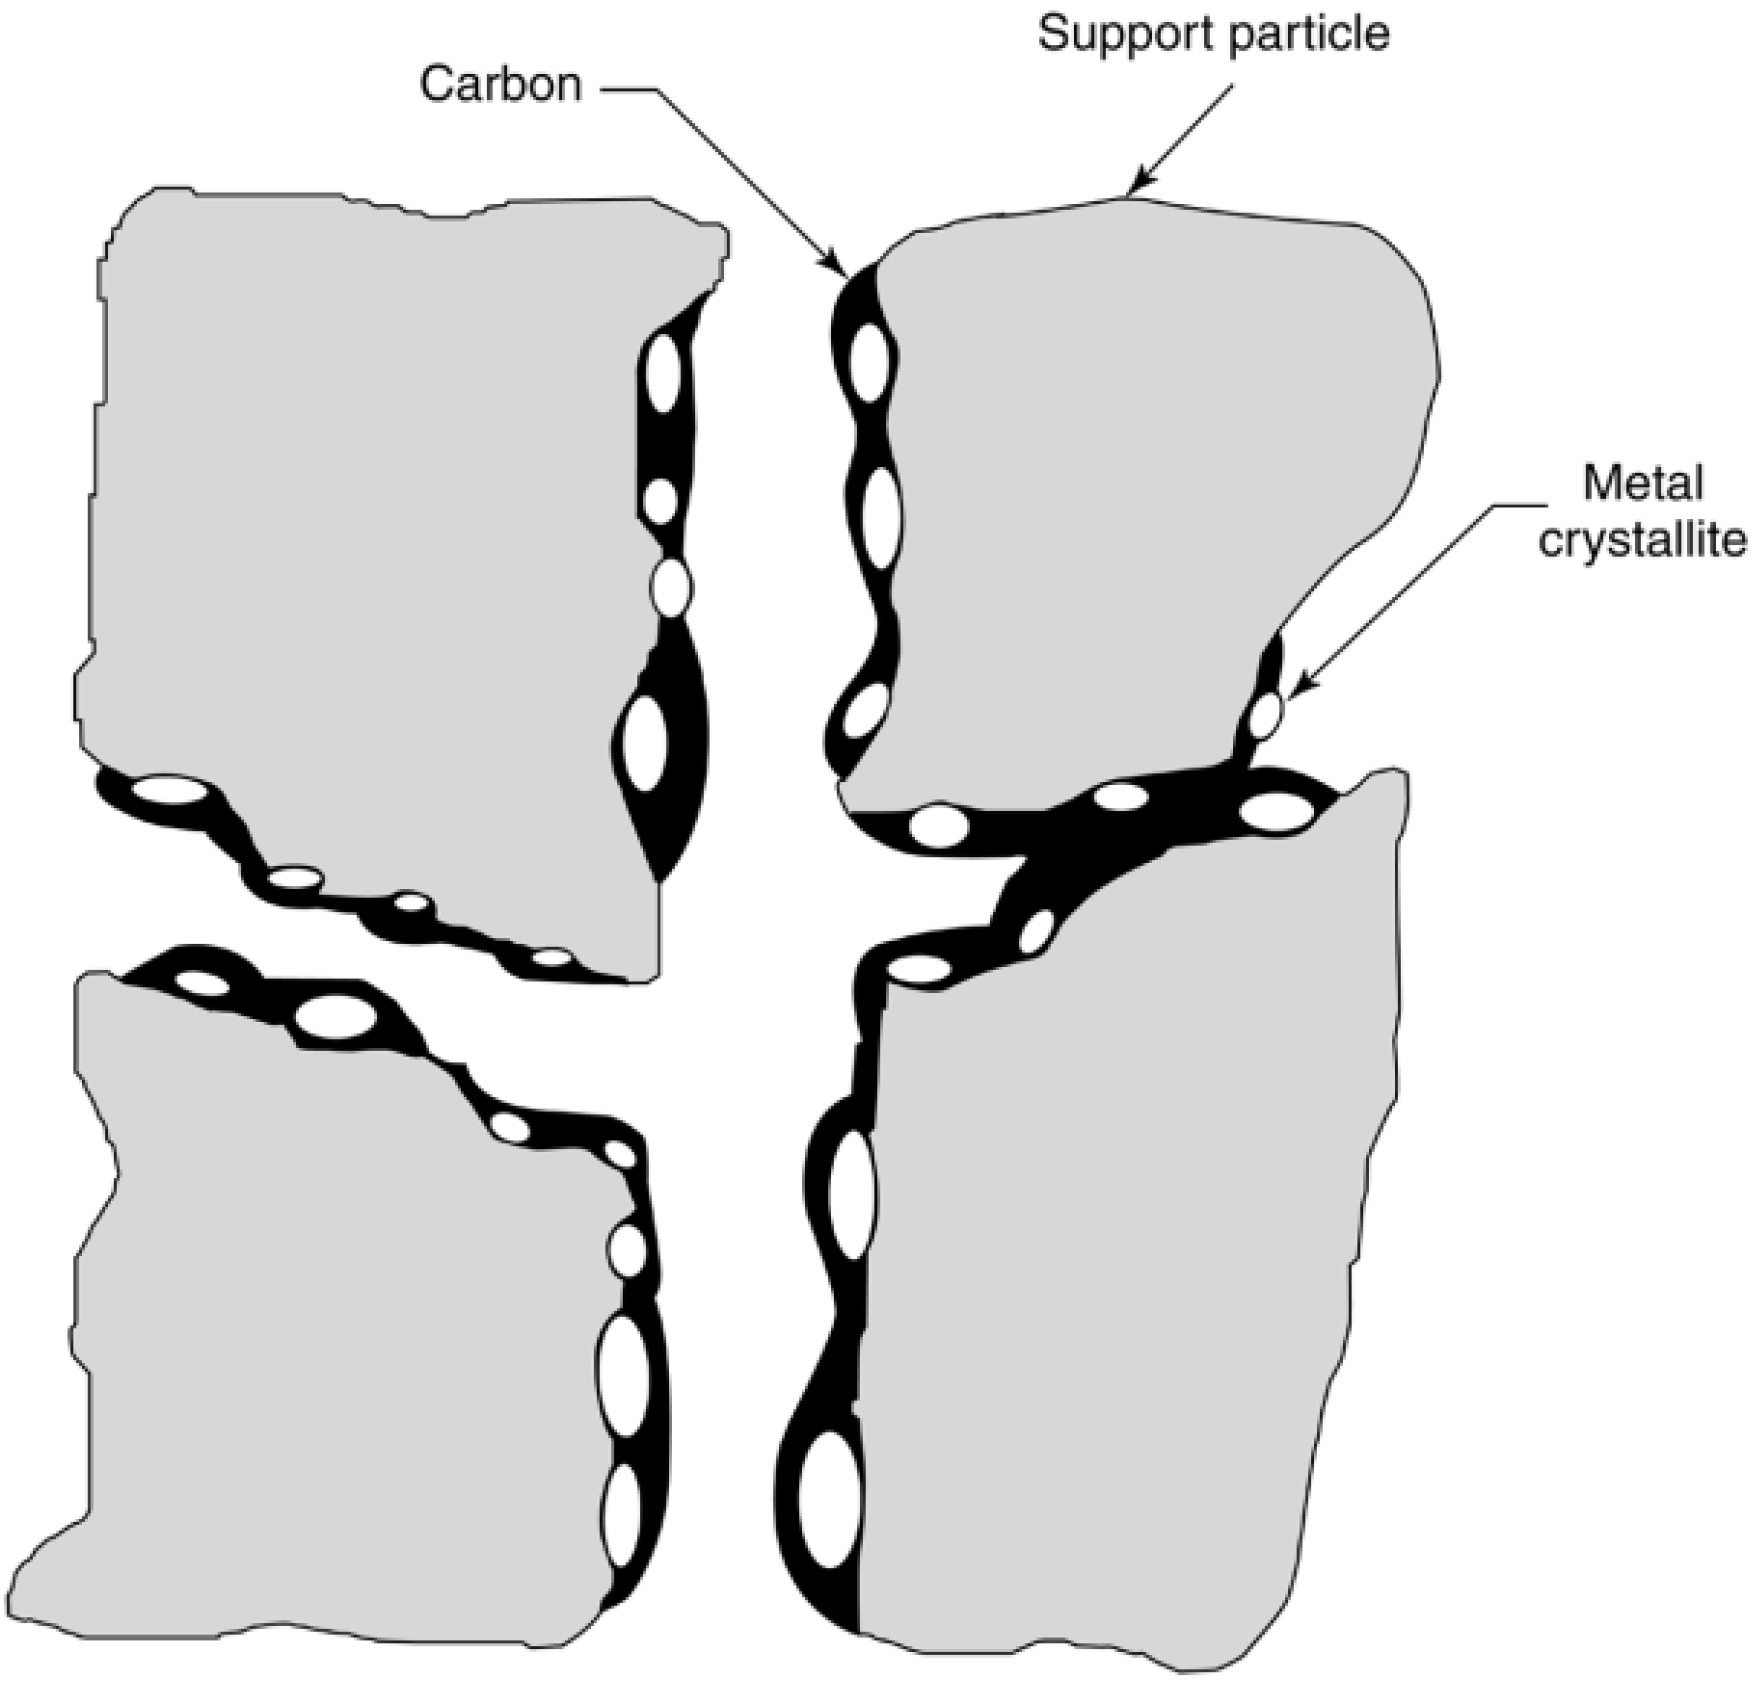
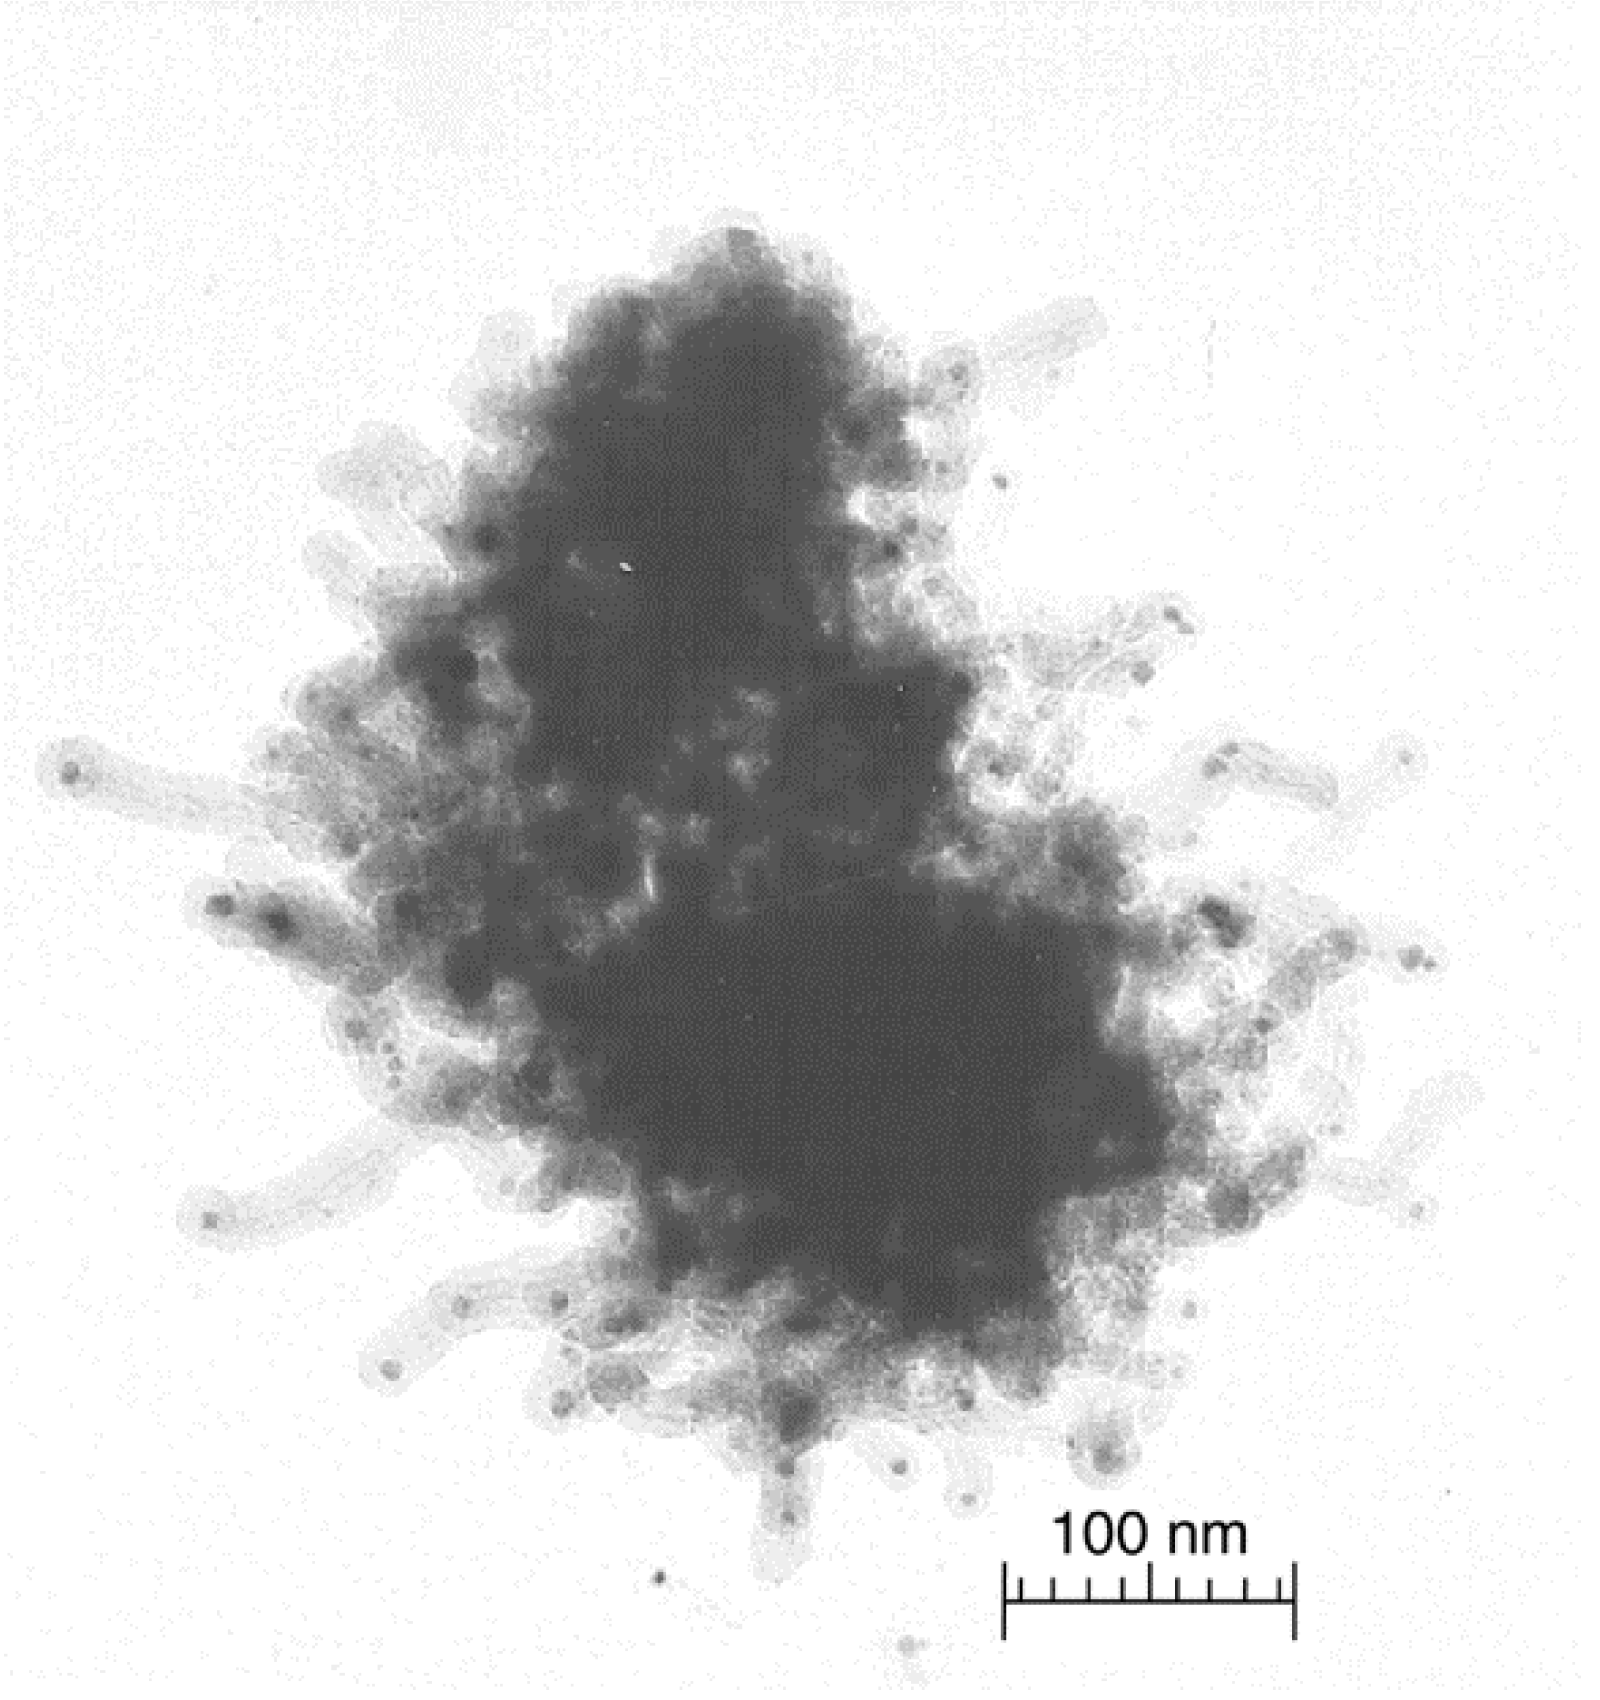
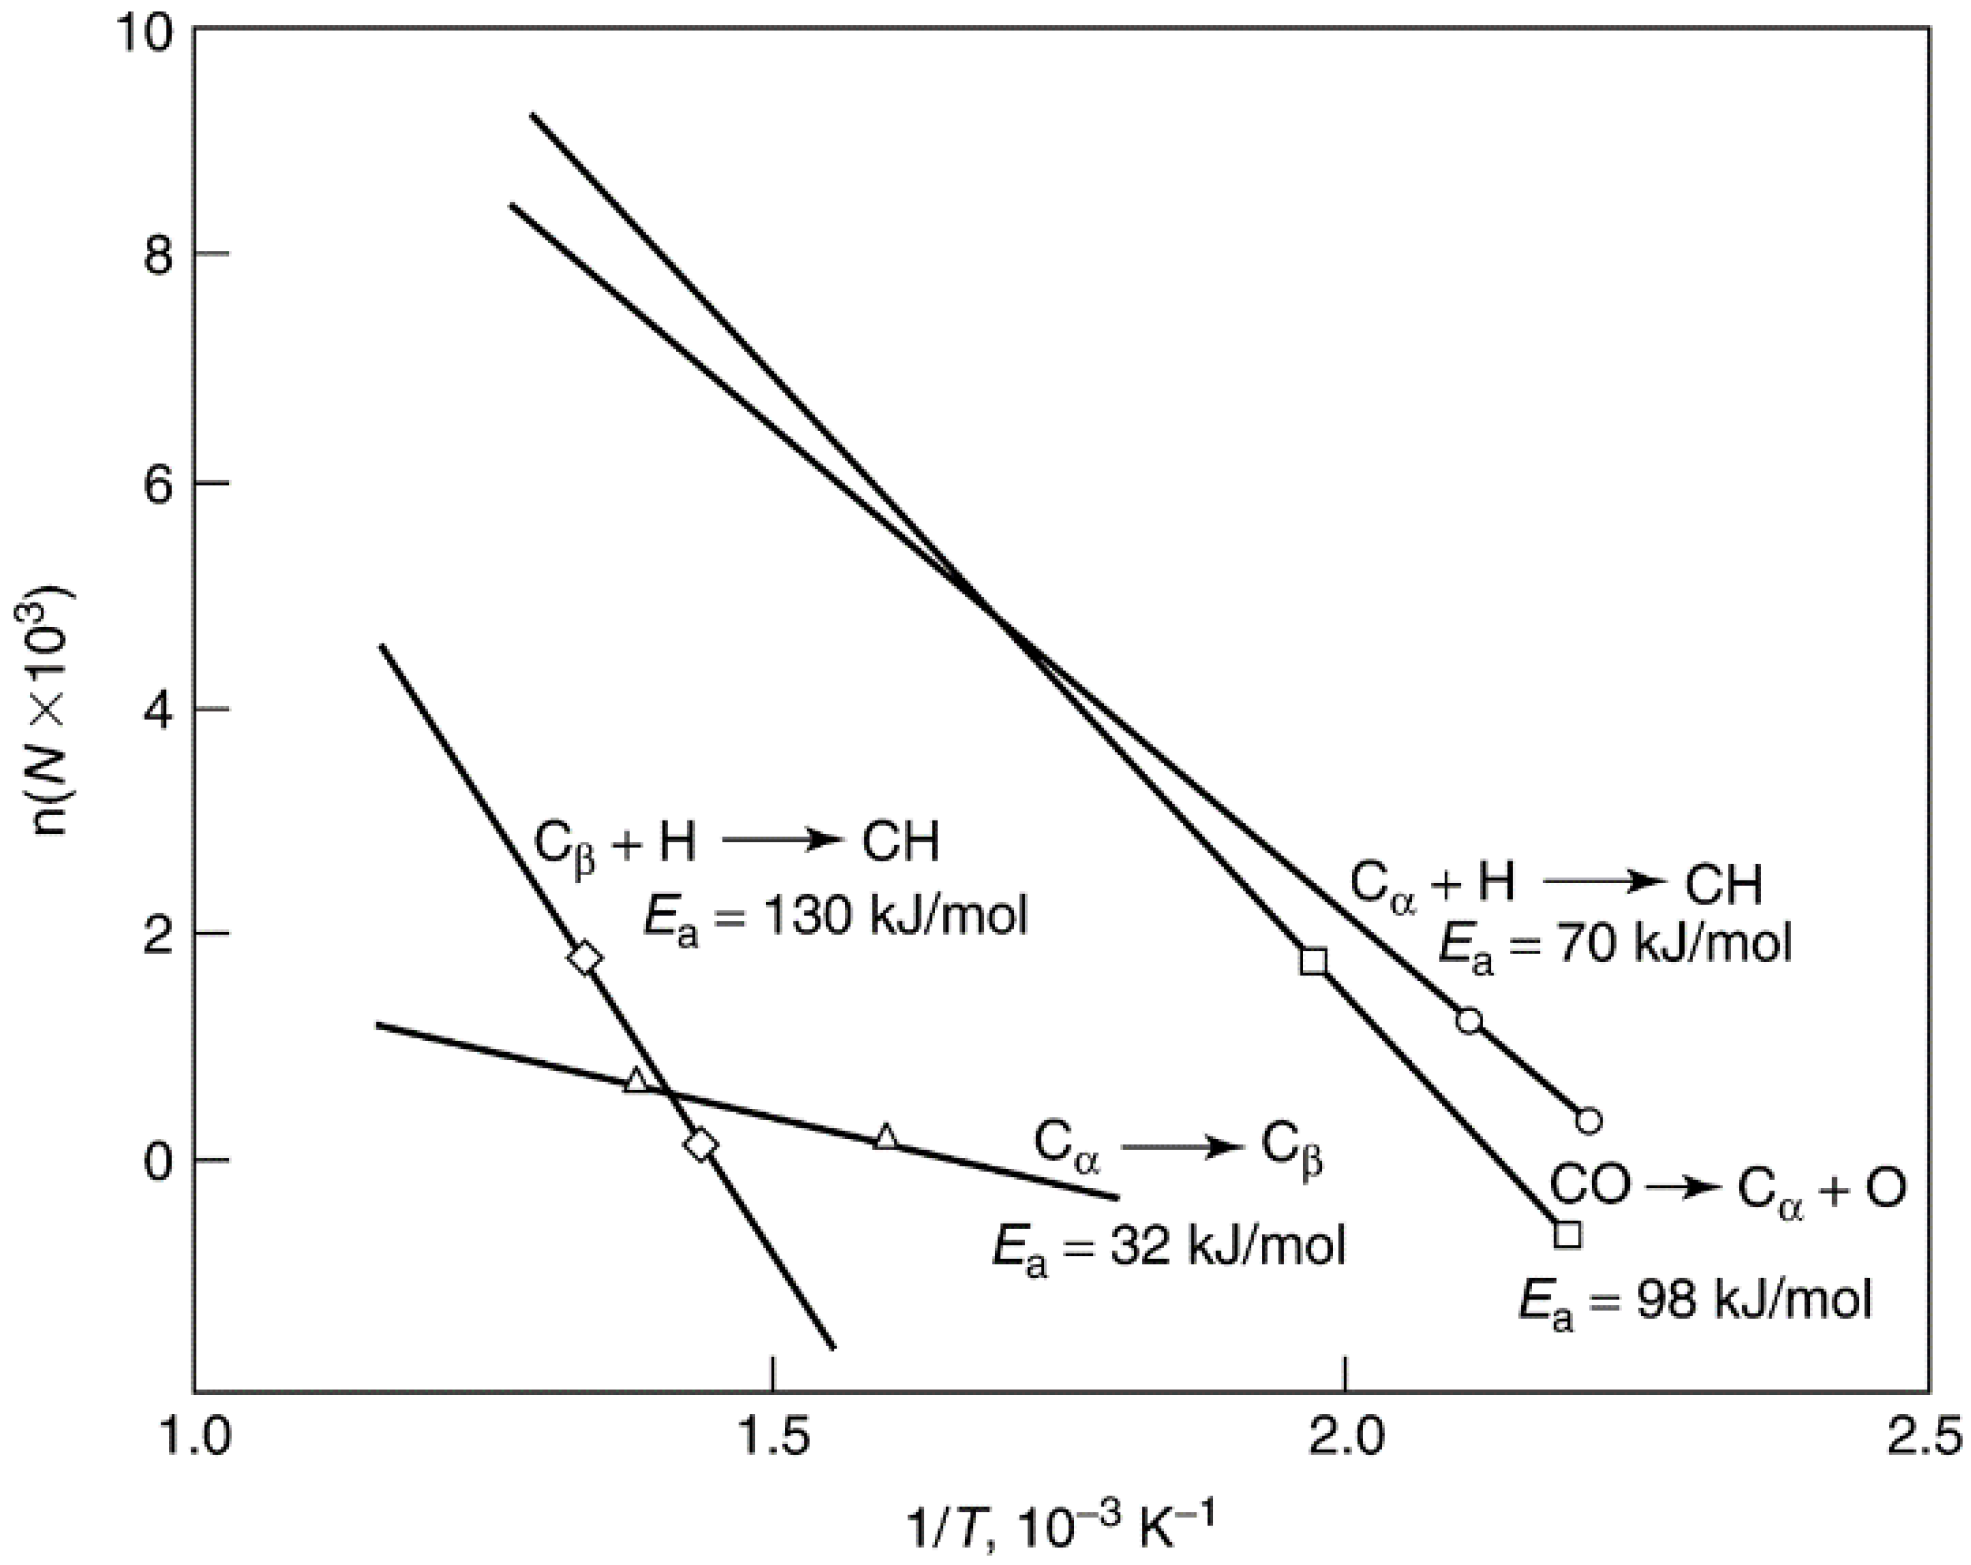
2.2.2. Carbon and Coke Formation on Supported Metal Catalysts


| Structural type | Designation | Temp. formed, °C | Peak temp. for reaction with H2, °C |
|---|---|---|---|
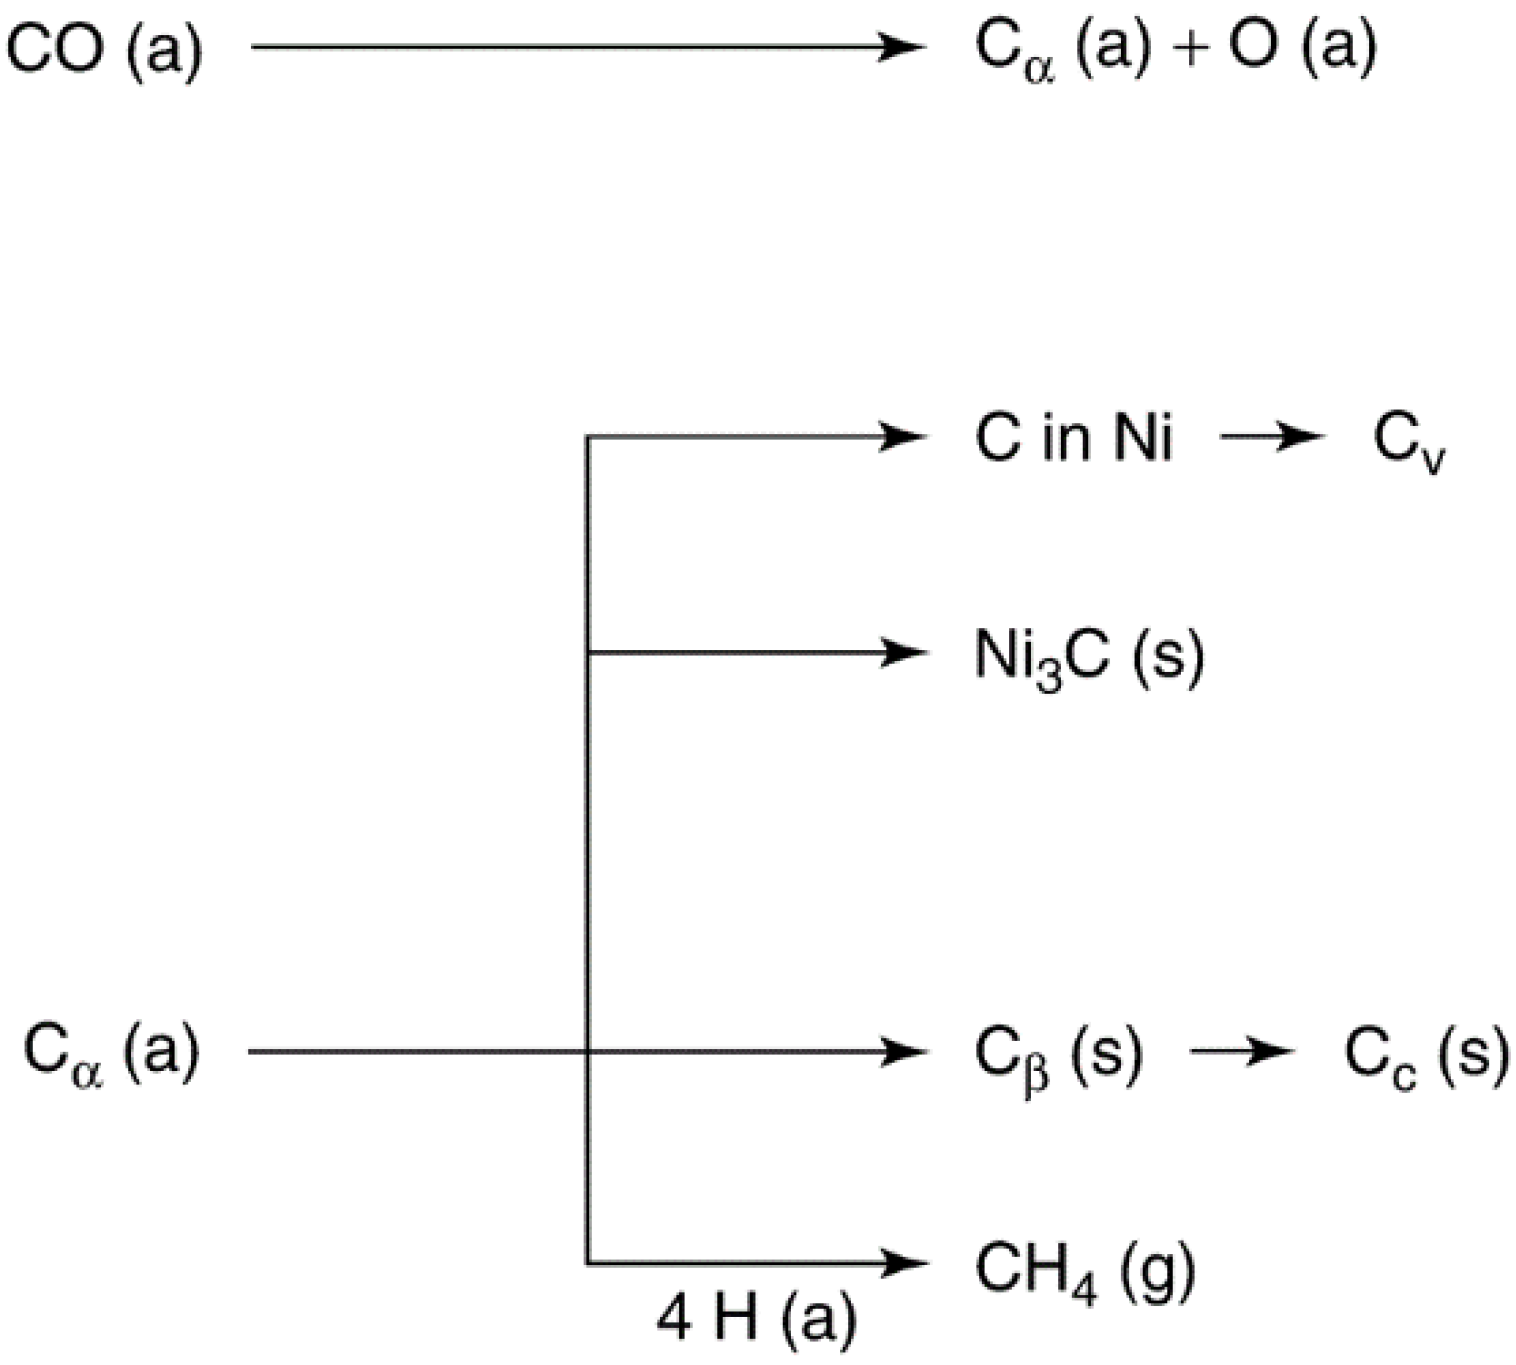
| 1. Adsorbed, atomic (surface carbide) | Cα | 200–400 | 200 |
| 2. Polymeric, amorphous films or filaments | Cβ | 250–500 | 400 |
| 3. Vermicular filaments, fibers, and/or whiskers | Cv | 300–1000 | 400–600 |
| 4. Nickel carbide (bulk) | Cγ | 150–250 | 275 |
| 5. Graphitic (crystalline) platelets or films | Cc | 500–550 | 550–850 |
| Attribute | Encapsulating film | Whisker-like | Pyrolytic carbon |
|---|---|---|---|
| Formation | Slow polymerization of CnHm radicals on Ni surface, into encapsulating film | Diffusion of C through Ni crystal, nucleation and whisker growth with Ni crystal at top | Thermal cracking of hydrocarbon; deposition of C precursors on catalyst |
| Effects | Progressive deactivation | No deactivation of Ni surface. Breakdown of catalyst and increasing ΔP | Encapsulation of catalyst particle; deactivation and increasing ΔP |
| Temp. range, °C | <500 | >450 | >600 |
| Critical parameters | Low temperature, low H2O/CnHm, low H2/CnHm, aromatic feed | High temperature, low H2O/CnHm, no enhanced H2O adsorption, low activity, aromatic feed | High temperature, high void fraction, low H2O/CnHm, high pressure, acidic catalyst |
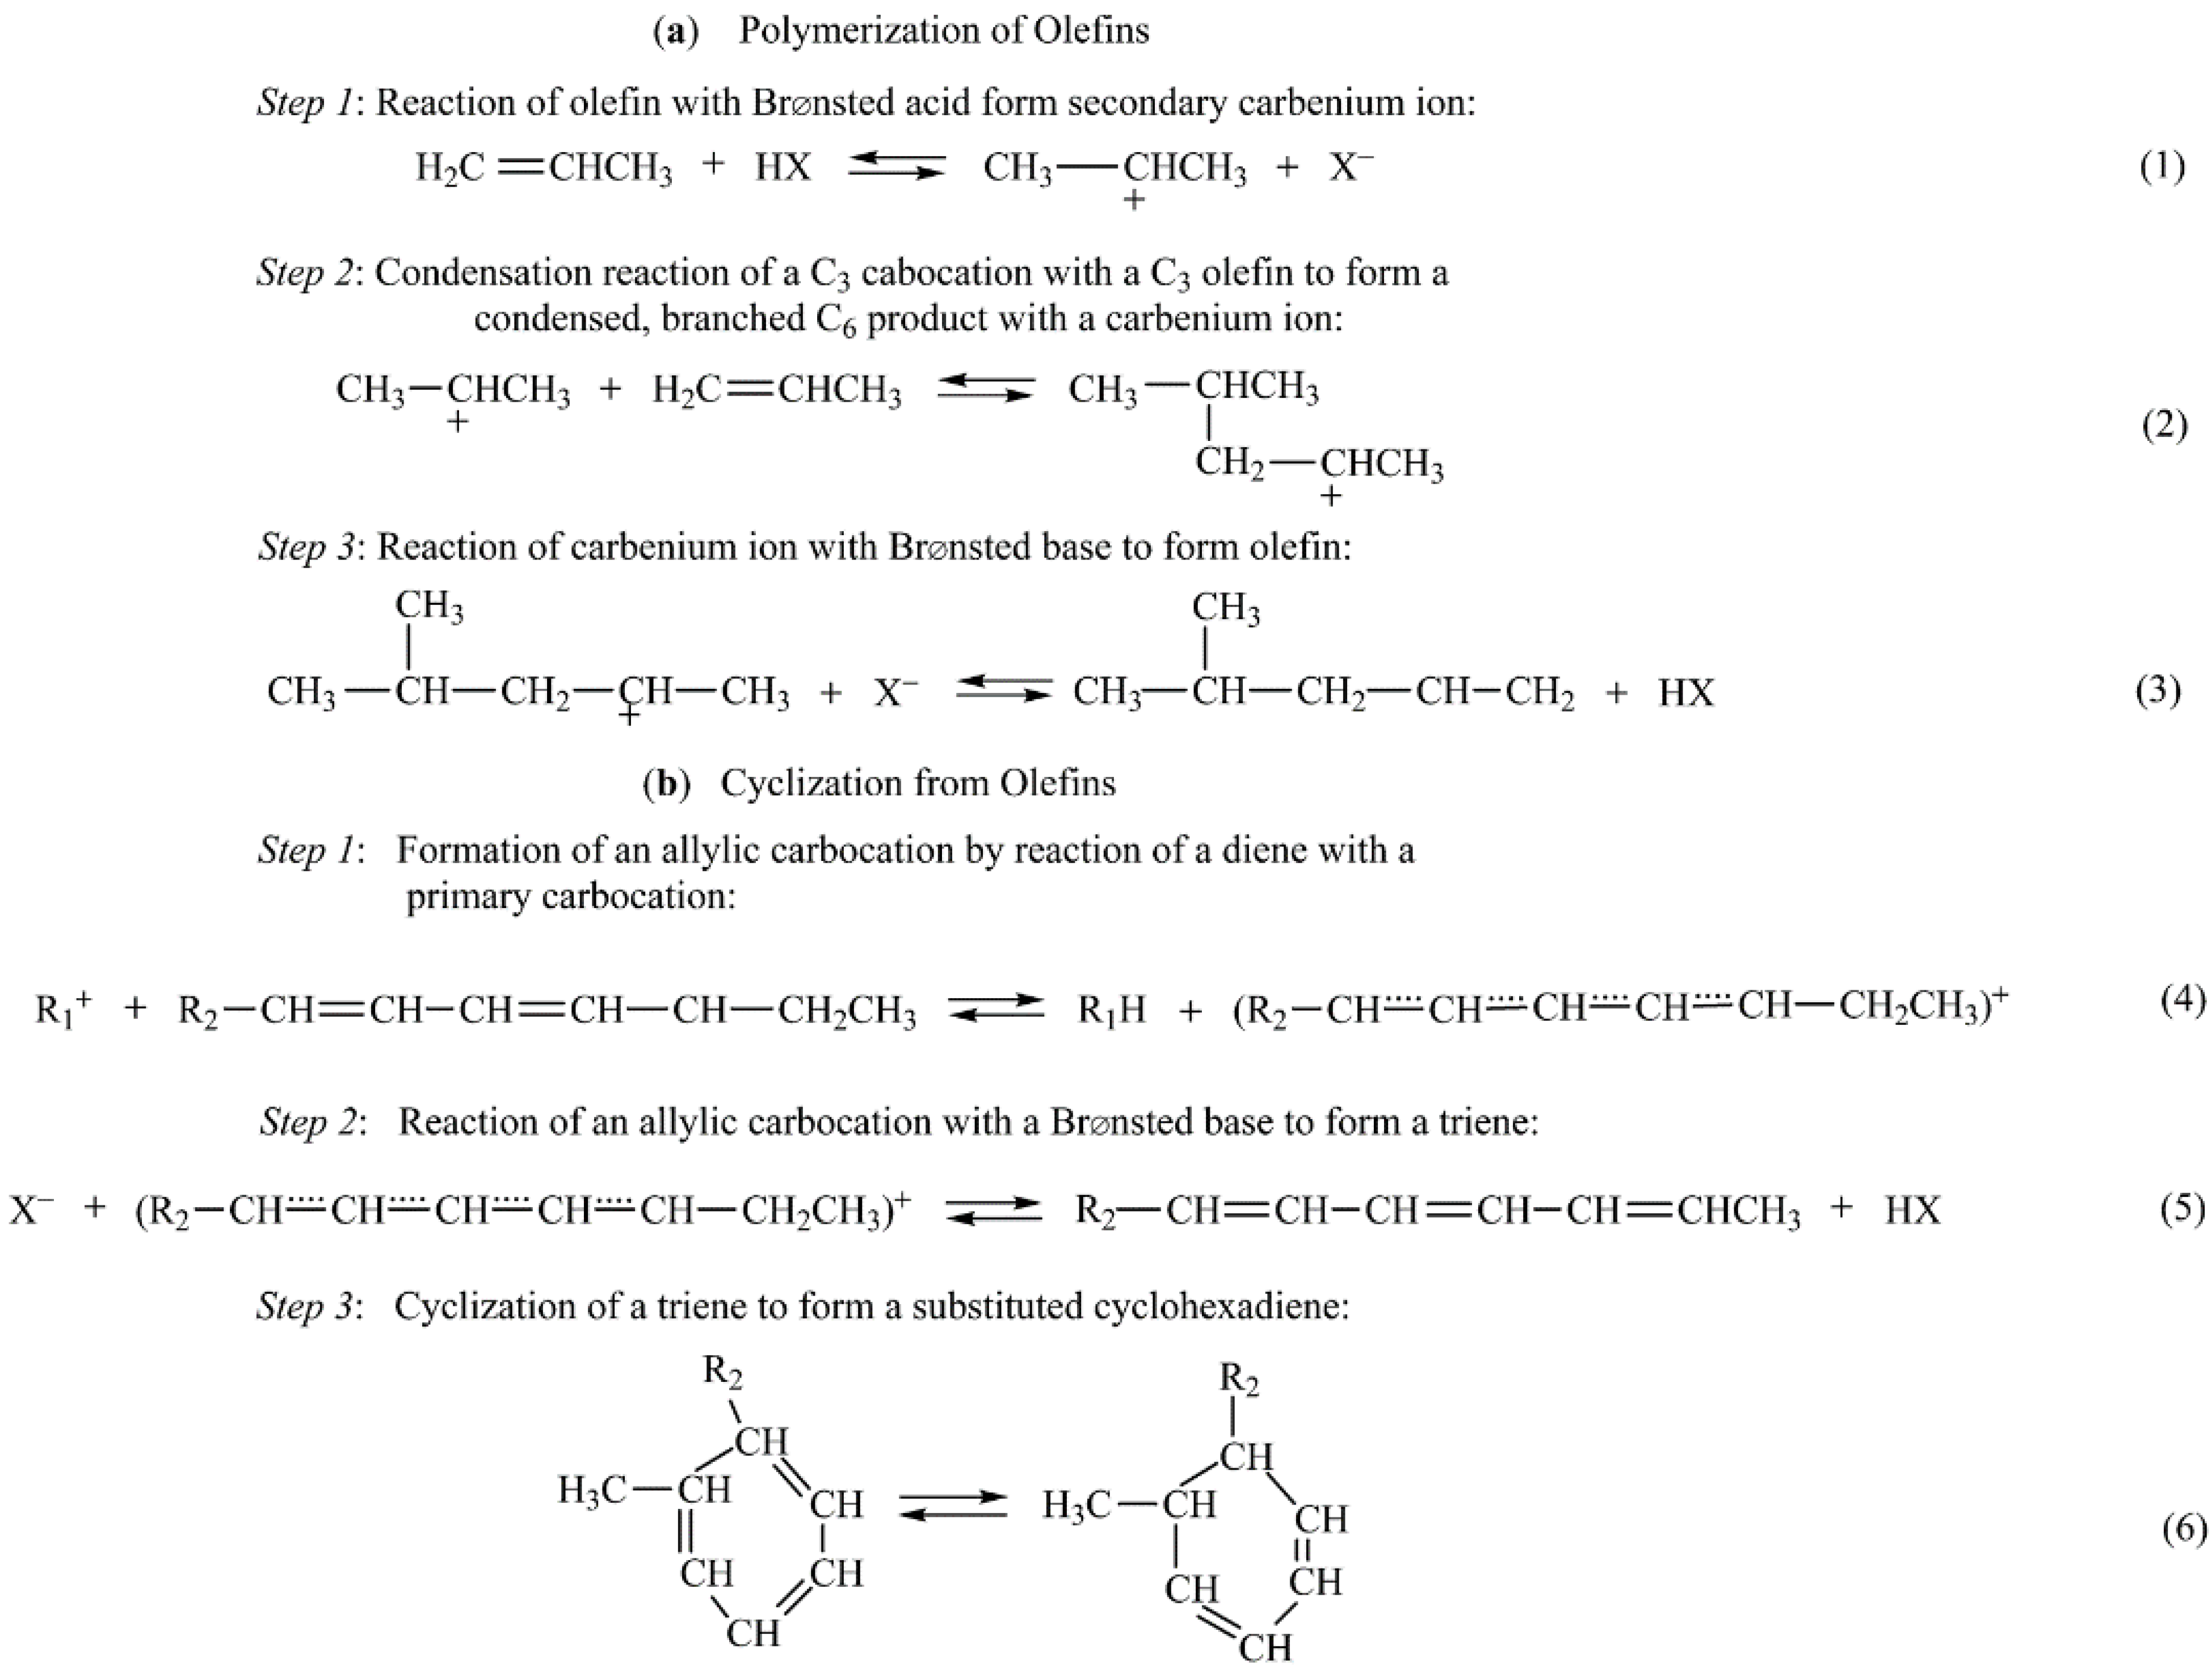
2.2.3. Coke Formation on Metal Oxide and Sulfide Catalysts
- (1)
- Type I deposits are reversibly adsorbed normal aromatics deposited during the first part of the cycle at low temperature.
- (2)
- Type II deposits are reversibly adsorbed asphaltenes deposited early in the coking process.
- (3)
- Type III deposits result from condensation of aromatic concentrates into clusters and then crystals that constitute a “mesophase.” This crystalline phase is formed after long reaction times at high temperature. This hardened coke causes severe deactivation of the catalyst [84].
- (1)
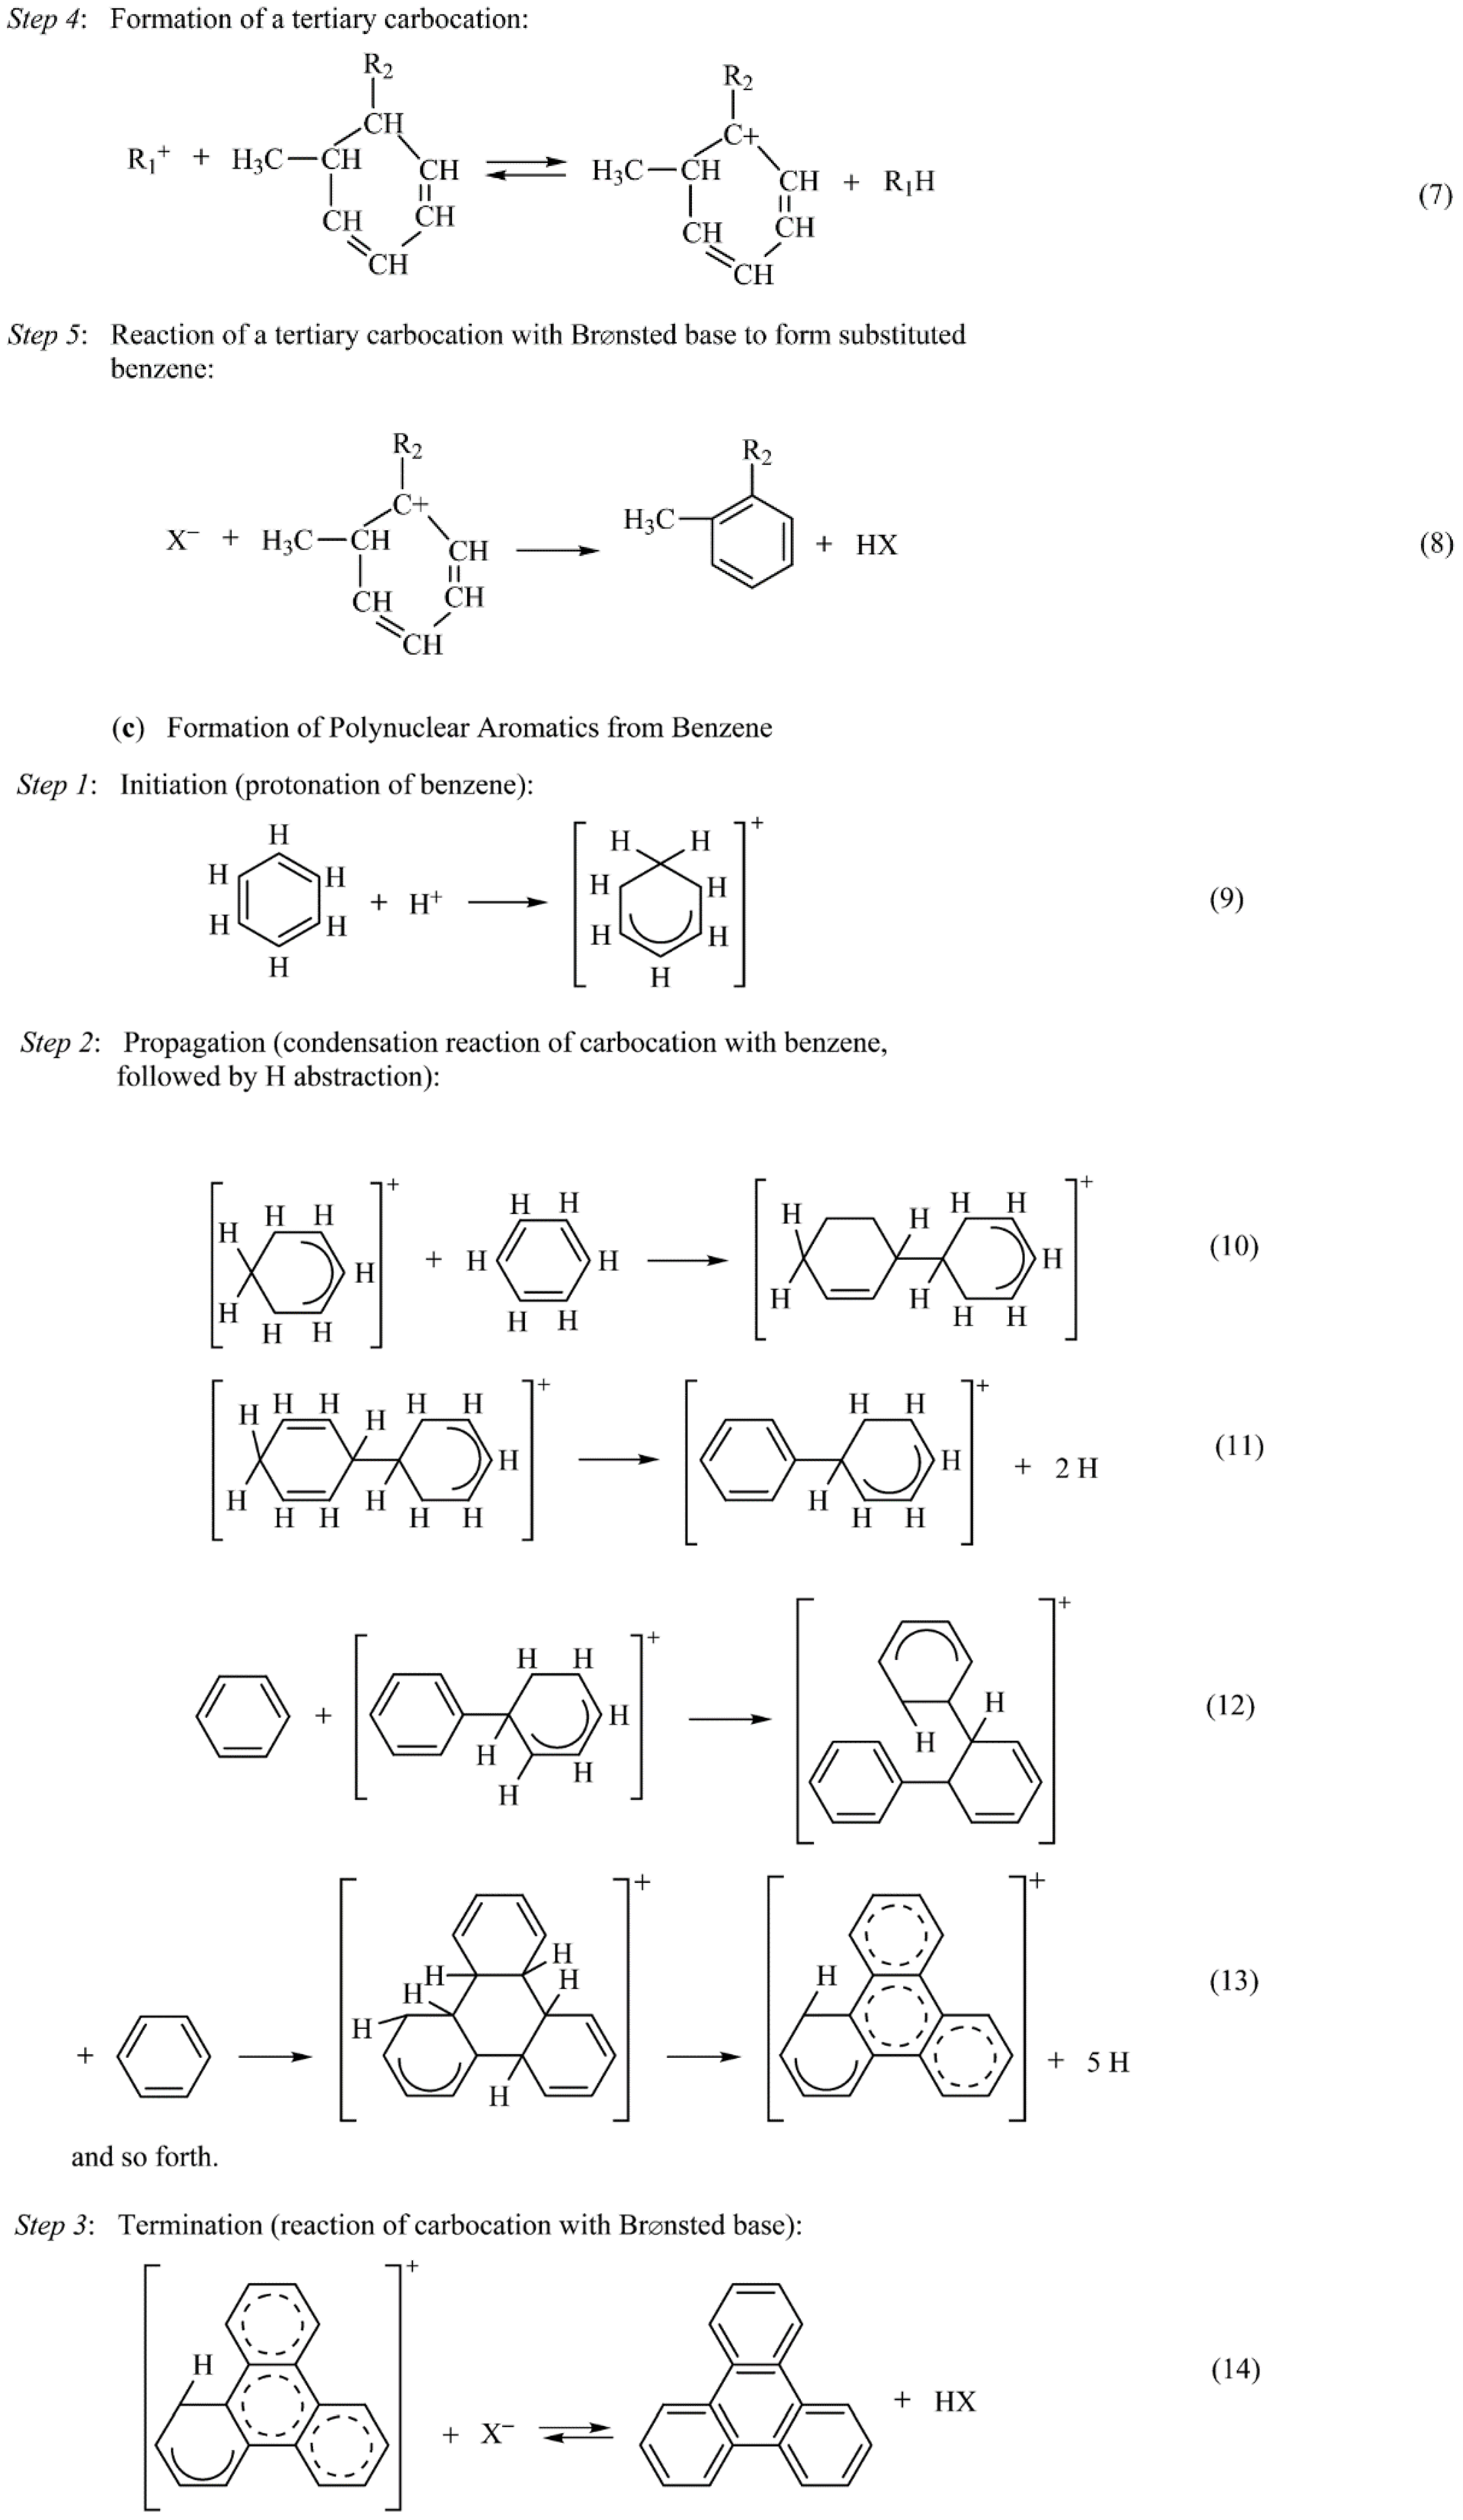
- Coke is probably mainly formed by rapid transformation of toluenic C7 carbenium ions with lesser contributions from reactions of cyclopentadiene, C3–C6 olefins, and aromatics.
- (2)
- Soluble coke consists of polynuclear aromatic clusters containing three to seven five- and six-membered rings having a typical compositions of C30H40 to C40H44 and having dimensions of 0.9 × 1.1 nm to 1.1 × 1.5 nm, i.e., sizes that would cause them to be trapped in the supercages of Y-zeolite.
- (3)
- At short contact times, coking is relatively slow and deactivation is mainly due to acid-site poisoning, while at long contact times, coking is much faster because of the high concentrations of coke precursors; under these latter conditions coke is preferentially deposited at the outer pore openings of zeolite crystallites and deactivation is dominated by pore-mouth blockage.
2.3. Thermal Degradation and Sintering
2.3.1. Background
2.3.2. Factors Affecting Metal Particle Growth and Redispersion in Supported Metals
| Variable | Effect |
|---|---|
| Temperature | Sintering rates are exponentially dependent on T; Eact varies from 30 to 150 kJ/mol. Eact decreases with increasing metal loading; it increases in the following order with atmosphere: NO < O2 < H2 < N2 |
| Atmosphere | Sintering rates are much higher for noble metals in O2 than in H2 and higher for noble and base metals in H2 relative to N2. Sintering rate decreases for supported Pt in atmospheres in the following order: NO > O2 > H2 > N2 |
| Metal | Observed order of decreasing thermal stability in H2 is Ru > Ir Rh > Pt; thermal stability in O2 is a function of (1) volatility of metal oxide and (2) strength of metal oxide–support interaction |
| Support | Metal–support interactions are weak (bond strengths of 5–15 kJ/mol); with a few exceptions, thermal stability for a given metal decreases with support in the following order: Al2O3 > SiO2 > carbon |
| Promoters | Some additives decrease atom mobility, e.g., C, O, CaO, BaO, CeO2, GeO2; others increase atom mobility, e.g., Pb, Bi, Cl, F, or S. Oxides of Ba, Ca, or Sr are “trapping agents” that decrease sintering rate |
| Pore size | Sintering rates are lower for porous versus nonporous supports; they decrease as crystallite diameters approach those of the pores |
| Compound | Tmp, K | TTamman, K | THüttig, K |
|---|---|---|---|
| Ag | 1233 | 617 | 370 |
| Au | 1336 | 668 | 401 |
| Co | 1753 | 877 | 526 |
| Cu | 1356 | 678 | 407 |
| CuO | 1599 | 800 | 480 |
| Cu2O | 1508 | 754 | 452 |
| CuCl2 | 893 | 447 | 268 |
| Cu2Cl2 | 703 | 352 | 211 |
| Fe | 1808 | 904 | 542 |
| Mo | 2883 | 1442 | 865 |
| MoO3 | 1068 | 534 | 320 |
| MoS2 | 1458 | 729 | 437 |
| Ni | 1725 | 863 | 518 |
| NiO | 2228 | 1114 | 668 |
| NiCl2 | 1281 | 641 | 384 |
| Ni(CO)4 | 254 | 127 | 76 |
| Rh | 2258 | 1129 | 677 |
| Rh2O3 | 1373 | 687 | 412 |
| Ru | 2723 | 1362 | 817 |
| Pd | 1828 | 914 | 548 |
| PdO | 1023 | 512 | 307 |
| Pt | 2028 | 1014 | 608 |
| PtO | 823 | 412 | 247 |
| PtO2 | 723 | 362 | 217 |
| PtCl2 | 854 | 427 | 256 |
| PtCl4 | 643 | 322 | 193 |
| Zn | 693 | 347 | 208 |
| ZnO | 2248 | 1124 | 674 |
| Catalyst | Atm. | D0 b | ks c (400 °C) | ks (650 °C) | ks (700 °C) | ks (750 °C) | Eact, d kJ/mol | Ref. |
|---|---|---|---|---|---|---|---|---|
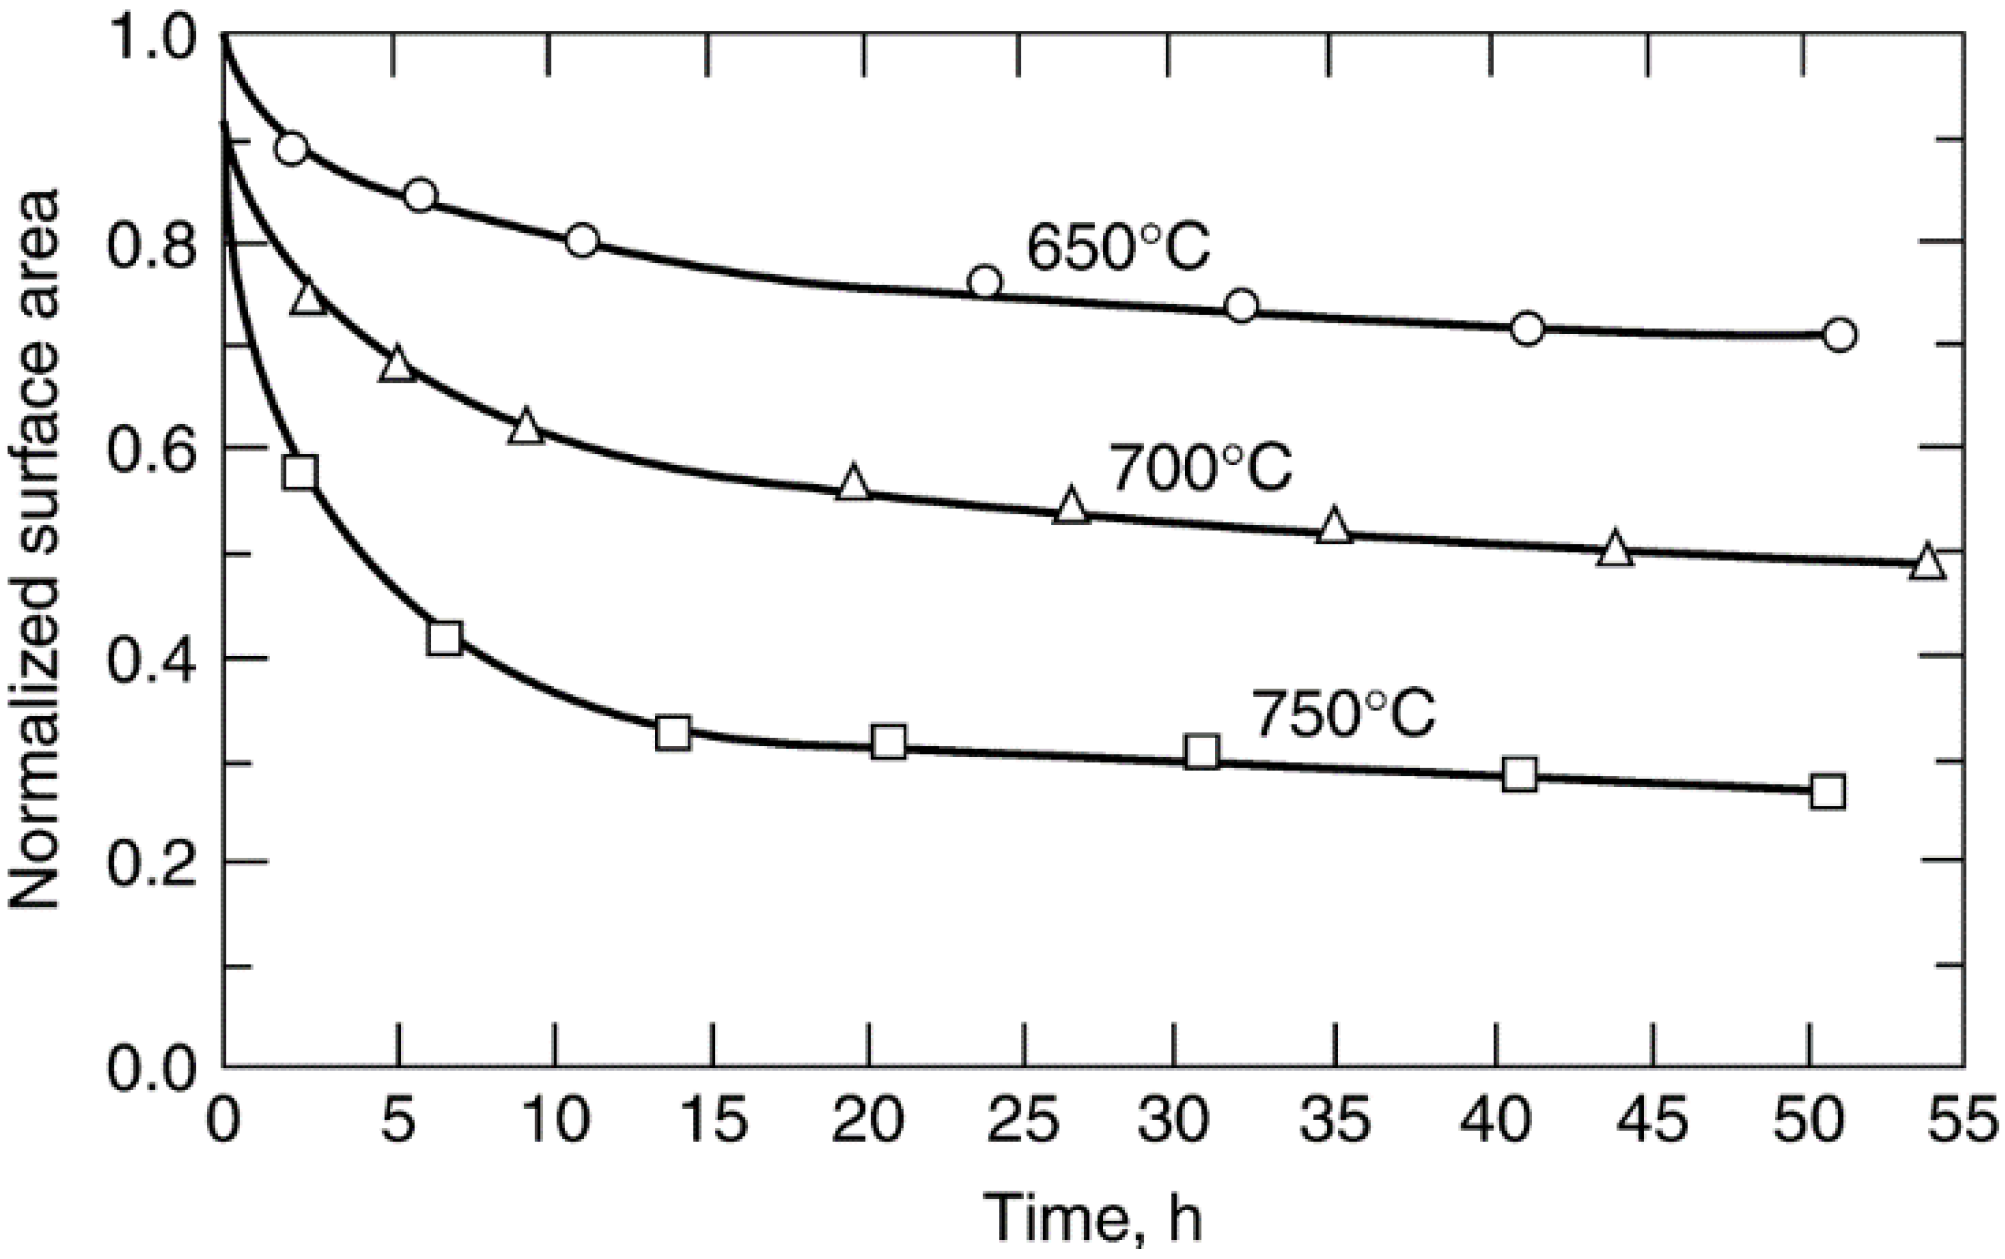
| 0.6% Pt/γ-Al2O3 | H2 | ~0.85 | 0.007 | 0.310 | 0.530 | 1.32 | 79 | [113] |
| 5% Pt/γ-Al2O3 | H2 | 0.10 | 0.420 | 0.76 | 0.84 | 0.97 | 13 | [114] |
| 15% Ni/γ-Al2O3 | H2 | 0.16 | 0.004 | 0.083 | 0.13 | 0.27 | 66 | [108] |
| 0.6% Pt/γ-Al2O3 | Air | ~0.85 | 0.024 | 0.29 | 0.41 | 0.75 | 52 | [113] |
| 5% Pt/γ-Al2O3 | Air | 0.10 | 0.014 | 1.46 | 2.79 | 8.51 | 97 | [114] |
| 1.8% Ag/η-Al2O3 | Air | 0.36 | 0.69 | - | - | - | - | [115] |
2.3.3. Sintering of Catalyst Carriers
2.3.4. Effects of Sintering on Catalyst Activity
2.4. Gas/Vapor–Solid and Solid-State Reactions
2.4.1. Gas/Vapor–Solid Reactions
2.4.1.1. Reactions of Gas/Vapor with Solid to Produce Inactive Phases
| Catalytic process | Gas/vapor composition | Catalytic solid | Deactivating chemical reaction | Ref. |
|---|---|---|---|---|
| Auto emissions control | N2, O2, HCs, CO, NO, H2O, SO2 | Pt–Rh/Al2O3 | 2 Rh2O3 + γ-Al2O3→RhAl2O4 + 0.5 O2 | [120,121] |
| Ammonia synthesis and regeneration | H2, N2 | Fe/K/Al2O3 | Fe→FeO at >50 ppm O2 | [8] |
| Traces O2, H2O | Fe→FeO at >0.16 ppm H2O/H2 | |||
| Catalytic cracking | HCs, H2, H2O | La-Y-zeolite | H2O induced Al migration from zeolite framework causing zeolite destruction | [8] |
| CO oxidation, gas turbine exhaust | N2, O2, 400 ppm CO, 100–400 ppm SO2 | Pt/Al2O3 | 2 SO3 + γ-Al2O3→Al2(SO4)3 which blocks catalyst pores | [8] |
| Diesel HC/soot emissions control | N2, O2, HCs (gas and liquid), CO, NO, H2O, soot, SO2 | Pt/Al2O3 and β-zeolite; oxides of CaCuFeVK on TiO2 | Formation of Al2(SO4)3 or sulfates of Ca, Cu, Fe, or V, which block catalysts pores and lower activity for oxidation; Al2O3 stabilized by BaO | [122,123,124] |
| Fischer–Tropsch | CO, H2, H2O, CO2, HCs | Fe/K/Cu/SiO2 | Fe5C2→Fe3O4 due to oxidation at high XCO by product H2O, CO2 | [125] |
| Fischer–Tropsch | CO, H2, H2O, HCs | Co/SiO2 | Co + SiO2→CoO·SiO2 and collapse of SiO2 by product H2O | [126] |
| Selective catalytic reduction (SCR), stationary | N2, O2, NO, PM a, H2O, SO2 | V2O5/WO3/TiO2 | Formation of Al2(SO4)3 if Al2O3 is used | [127] |
| Steam reforming and regeneration in H2O | CH4, H2O, CO, H2, CO2 | Ni/Al2O3 | Ni + Al2O3→NiAl2O4 | [8] |
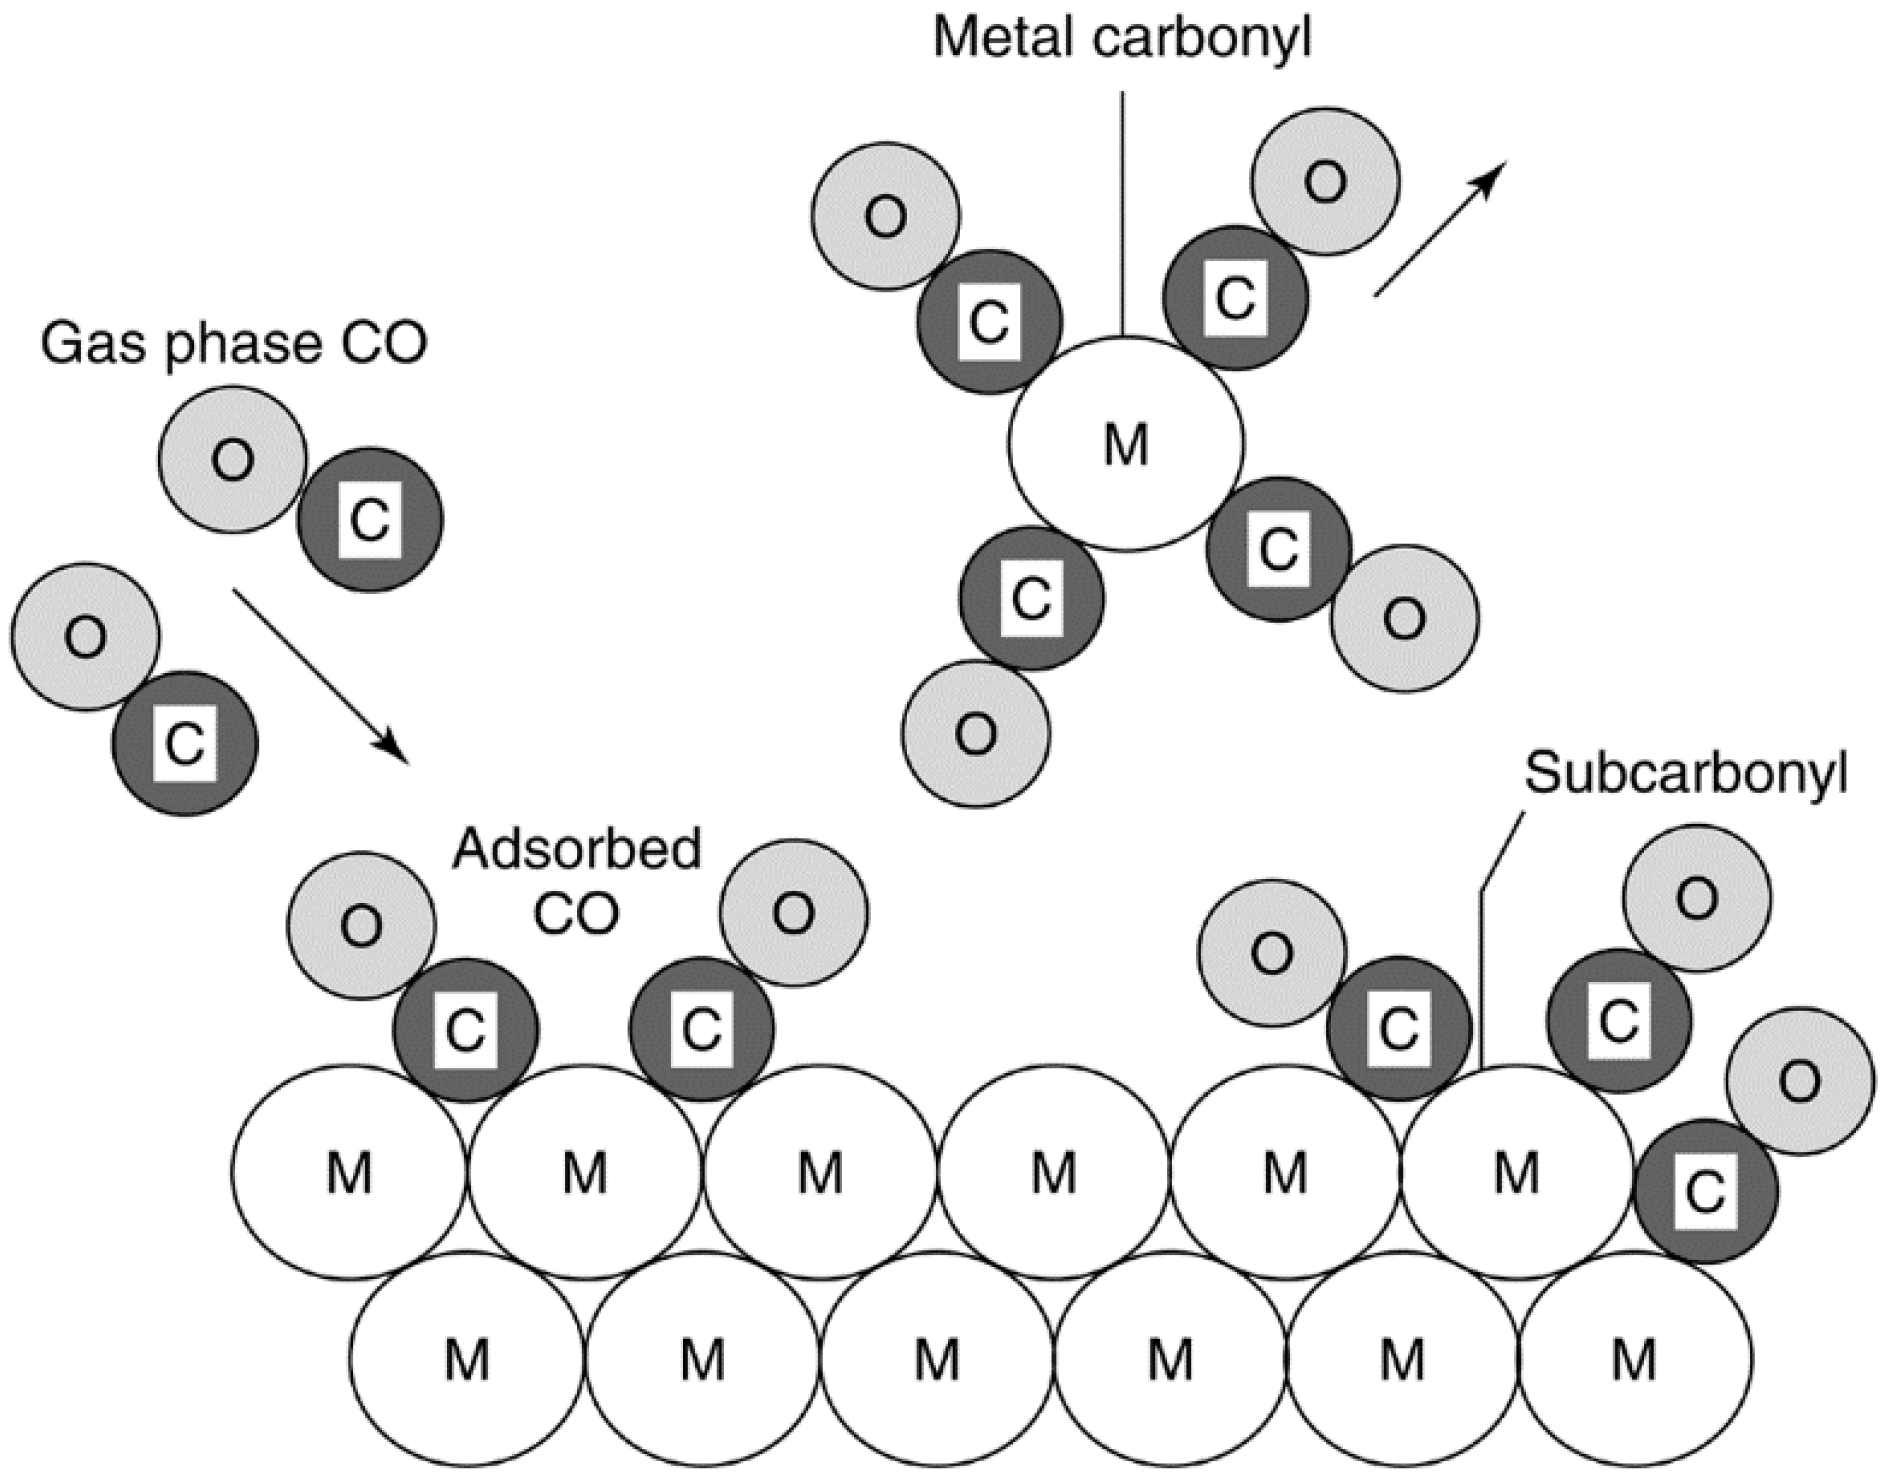
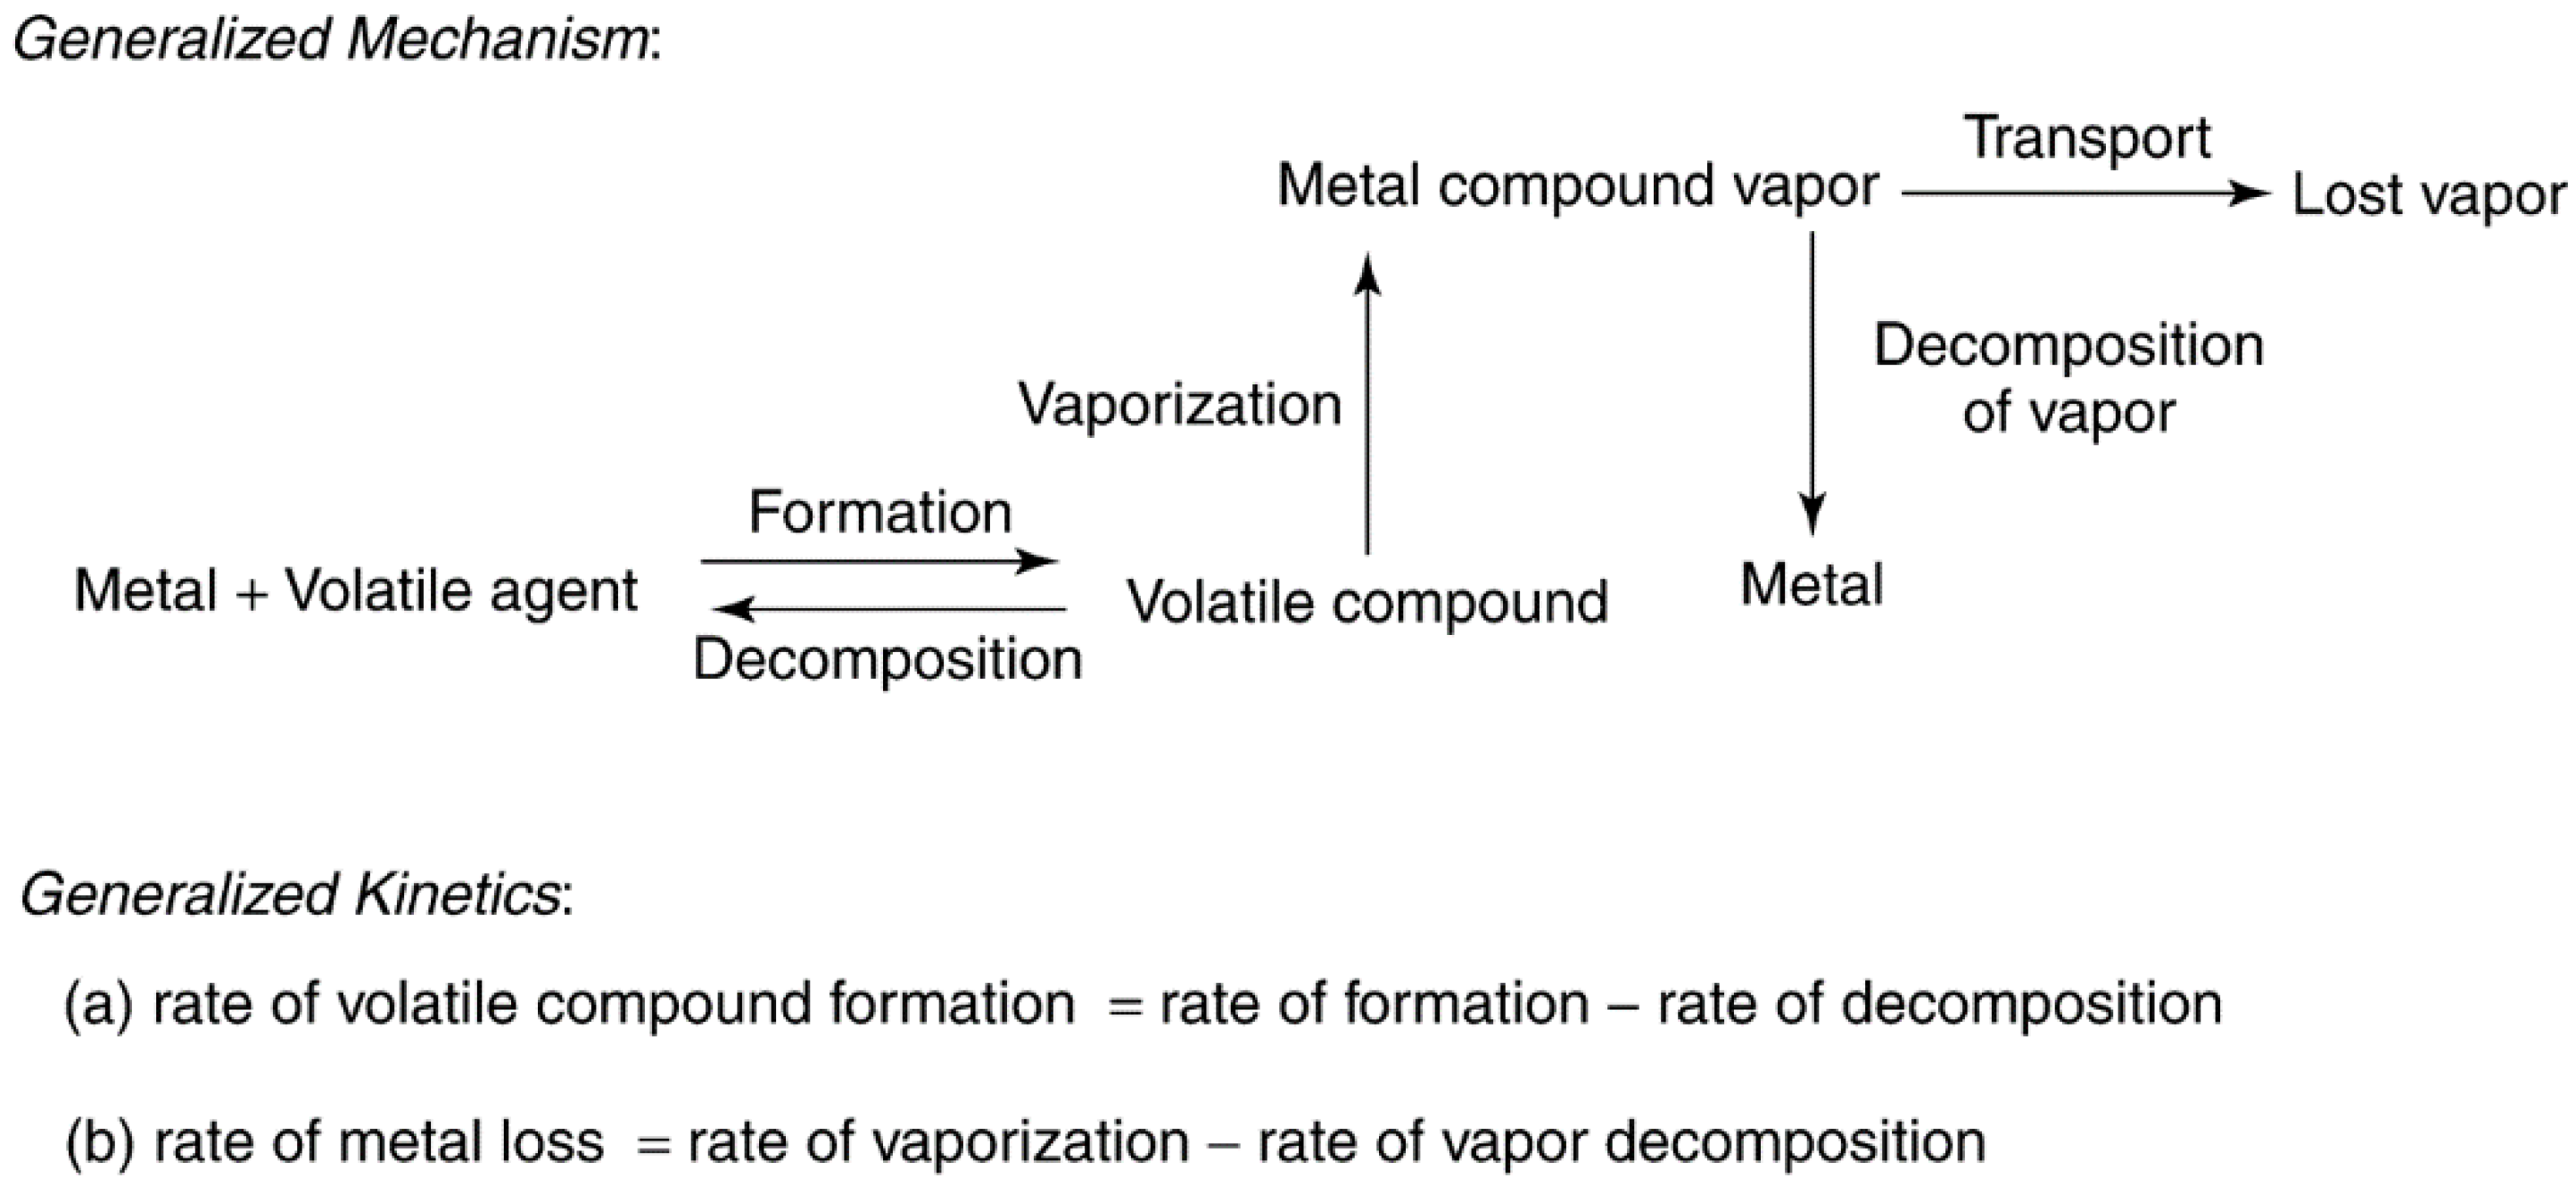
2.4.1.2. Reactions of Gas/Vapor with Solid to Produce Volatile Compounds
| Gaseous environment | Compound type | Example of compound |
|---|---|---|
| CO, NO | Carbonyls and nitrosyl carbonyls | Ni(CO)4, Fe(CO)5 (0–300 °C) a |
| O2 | Oxides | RuO3 (25 °C), PbO (>850 °C), PtO2 (>700 °C) |
| H2S | Sulfides | MoS2 (>550 °C) |
| Halogens | Halides | PdBr2, PtCl4, PtF6, CuCl2, Cu2Cl2 |
| Catalytic process | Catalytic solid | Vapor formed | Comments on deactivation process | Ref. |
|---|---|---|---|---|
| Automotive converter | Pd–Ru/Al2O3 | RuO4 | 50% loss of Ru during 100-h test in reducing automotive exhaust | [131] |
| Methanation of CO | Ni/Al2O3 | Ni(CO)4 | PCO > 20 kPa and T < 425 °C due to Ni(CO)4 formation, diffusion and decomposition on the support as large crystallites | [133] |
| CO chemi-sorption | Ni catalysts | Ni(CO)4 | PCO > 0.4 kPa and T > 0 °C due to Ni(CO)4 formation; catalyzed by sulfur compounds | [134] |
| Fischer–Tropsch synthesis (FTS) | Ru/NaY zeolite, Ru/Al2O3, Ru/TiO2 | Ru(CO)5, Ru3(CO)12 | Loss of Ru during FTS (H2/CO = 1, 200–250 °C, 1 atm) on Ru/NaY zeolite and Ru/Al2O3; up to 40% loss while flowing CO at 175–275 °C over Ru/Al2O3 for 24 h. Rate of Ru loss less on titania-supported Ru and for catalysts containing large metal crystallites (3 nm) relative to small metal crystallites (1.3 nm). Surface carbon lowers loss | [136,137] |
| Ammonia oxidation | Pt–Rh gauze | PtO2 | Loss: 0.05–0.3 g Pt/ton HNO3; recovered with Pd gauze; loss of Pt leads to surface enrichment with inactive Rh | [8,142] |
| HCN synthesis | Pt–Rh gauze | PtO2 | Extensive restructuring and loss of mechanical strength | [8,143] |
| Methanol synthesis | CuZnO | CuCl2, Cu2Cl2 | Mobile copper chloride phase leads to sintering at reaction temperature (225 °C) | [109] |
| Diesel soot oxidation | Oxides of K, Cu, Mo, and trace Cl | CuCl2, Cu2Cl2 | Mobile copper chloride improves catalyst–soot contact; catalyst evaporation observed | [109] |
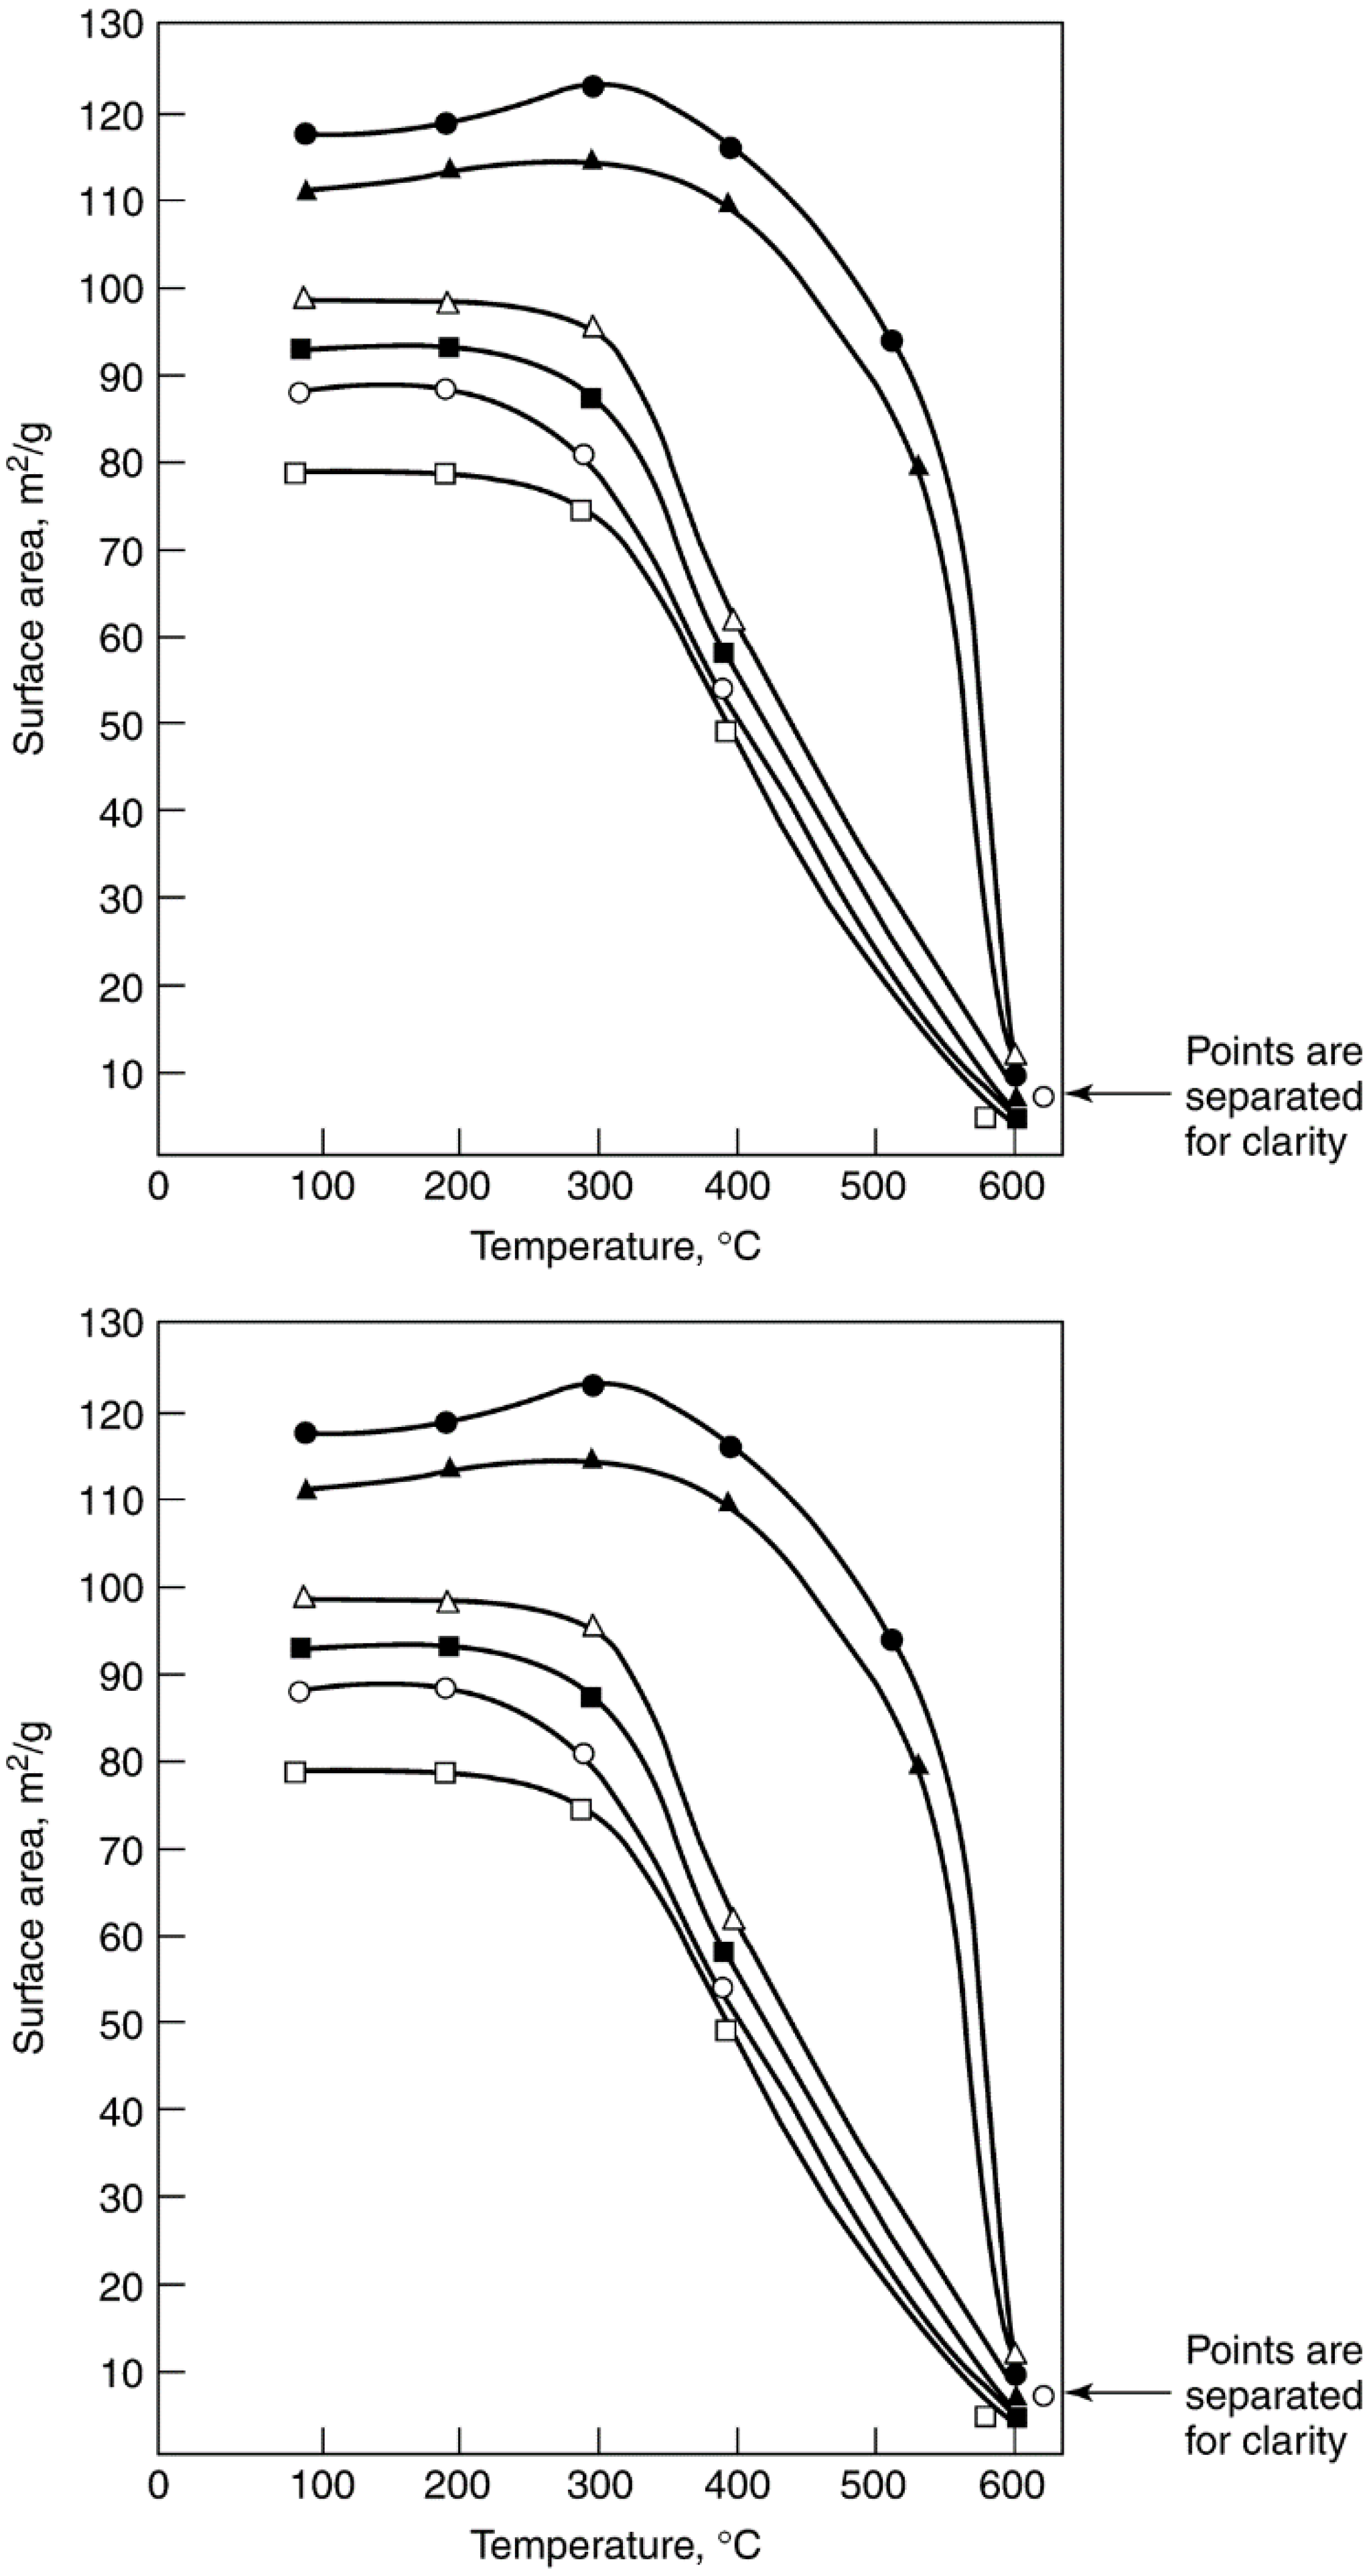
- (1)
- At low temperatures and partial pressures of the volatilization agent (VA), the overall rate of the process is limited by the rate of volatile compound formation.
- (2)
- At intermediate temperatures and partial pressures of the VA, the rate of formation of the volatile compound exceeds the rate of decomposition. Thus, the rate of vaporization is high, the vapor is stable, and metal loss is high.
- (3)
- At high temperatures and partial pressures of the VA, the rate of formation equals the rate of decomposition, i.e., equilibrium is achieved. However, the volatile compound may be too unstable to form or may decompose before there is an opportunity to be transported from the system. From the previous work, it is also evident that besides temperature and gas phase composition, catalyst properties (crystallite size and support) can play an important role in determining the rate of metal loss.
2.4.2. Solid-State Reactions
| Catalytic process | Catalytic solid | Deactivating chemical reaction | Ref. | |
|---|---|---|---|---|
| Ammonia synthesis | Fe/K/Al2O3 | Formation of KAlO2 at catalyst surface | [159] | |
| Catalytic combustion | PdO/Al2O3, PdO/ZrO2 | PdO→Pd at T > 800 °C | [152] | |
| Catalytic combustion | Co/K on MgO, CeO2, or La2O3 | Formation of CoO–MgO solid soln., LaCoO3, or K2O film on CeO2 | [160] | |
| Dehydrogenation of ethyl benzene to styrene | Fe2O3/Cr2O3/K2O | K migration to center of pellet caused by thermal gradient | [8] | |
| Fischer–Tropsch | Fe/K, Fe/K/CuO | Transformation of active carbides to inactive carbides | [157,158] | |
| Oxidation of SO2 to SO3 | V2O5/K2O/Na2O/ | Formation of inactive V(IV) compounds at T < 420–430 °C | [155] | |
| Partial oxidation of benzene to maleic anhydride | V2O5–MoO3 | Decreased selectivity due to loss of MoO3 and formation of inactive vanadium compounds | [149] | |
| Partial oxidation of methanol to formaldehyde | Fe2(MoO4)3 plus MoO3 | Structural reorganization to β-FeMoO4; reduction of MoO3 | [150,156] | |
| Partial oxidation of propene to acrolein | Fe2(MoO4)3 | Reductive transformation of Mo18O52 to Mo4O11 | [153,156] | |
| Partial oxidation of isobutene to methacrolein | Fe2(MoO4)3 | Reduction to FeMoO4 and MoO3–x | [151,154] | |


2.4.3. Reactions of Gas/Vapor with Solid to Restructure the Surface by Chemical Assisted Sintering

2.5. Mechanical Failure of Catalysts
2.5.1. Forms and Mechanisms of Failure
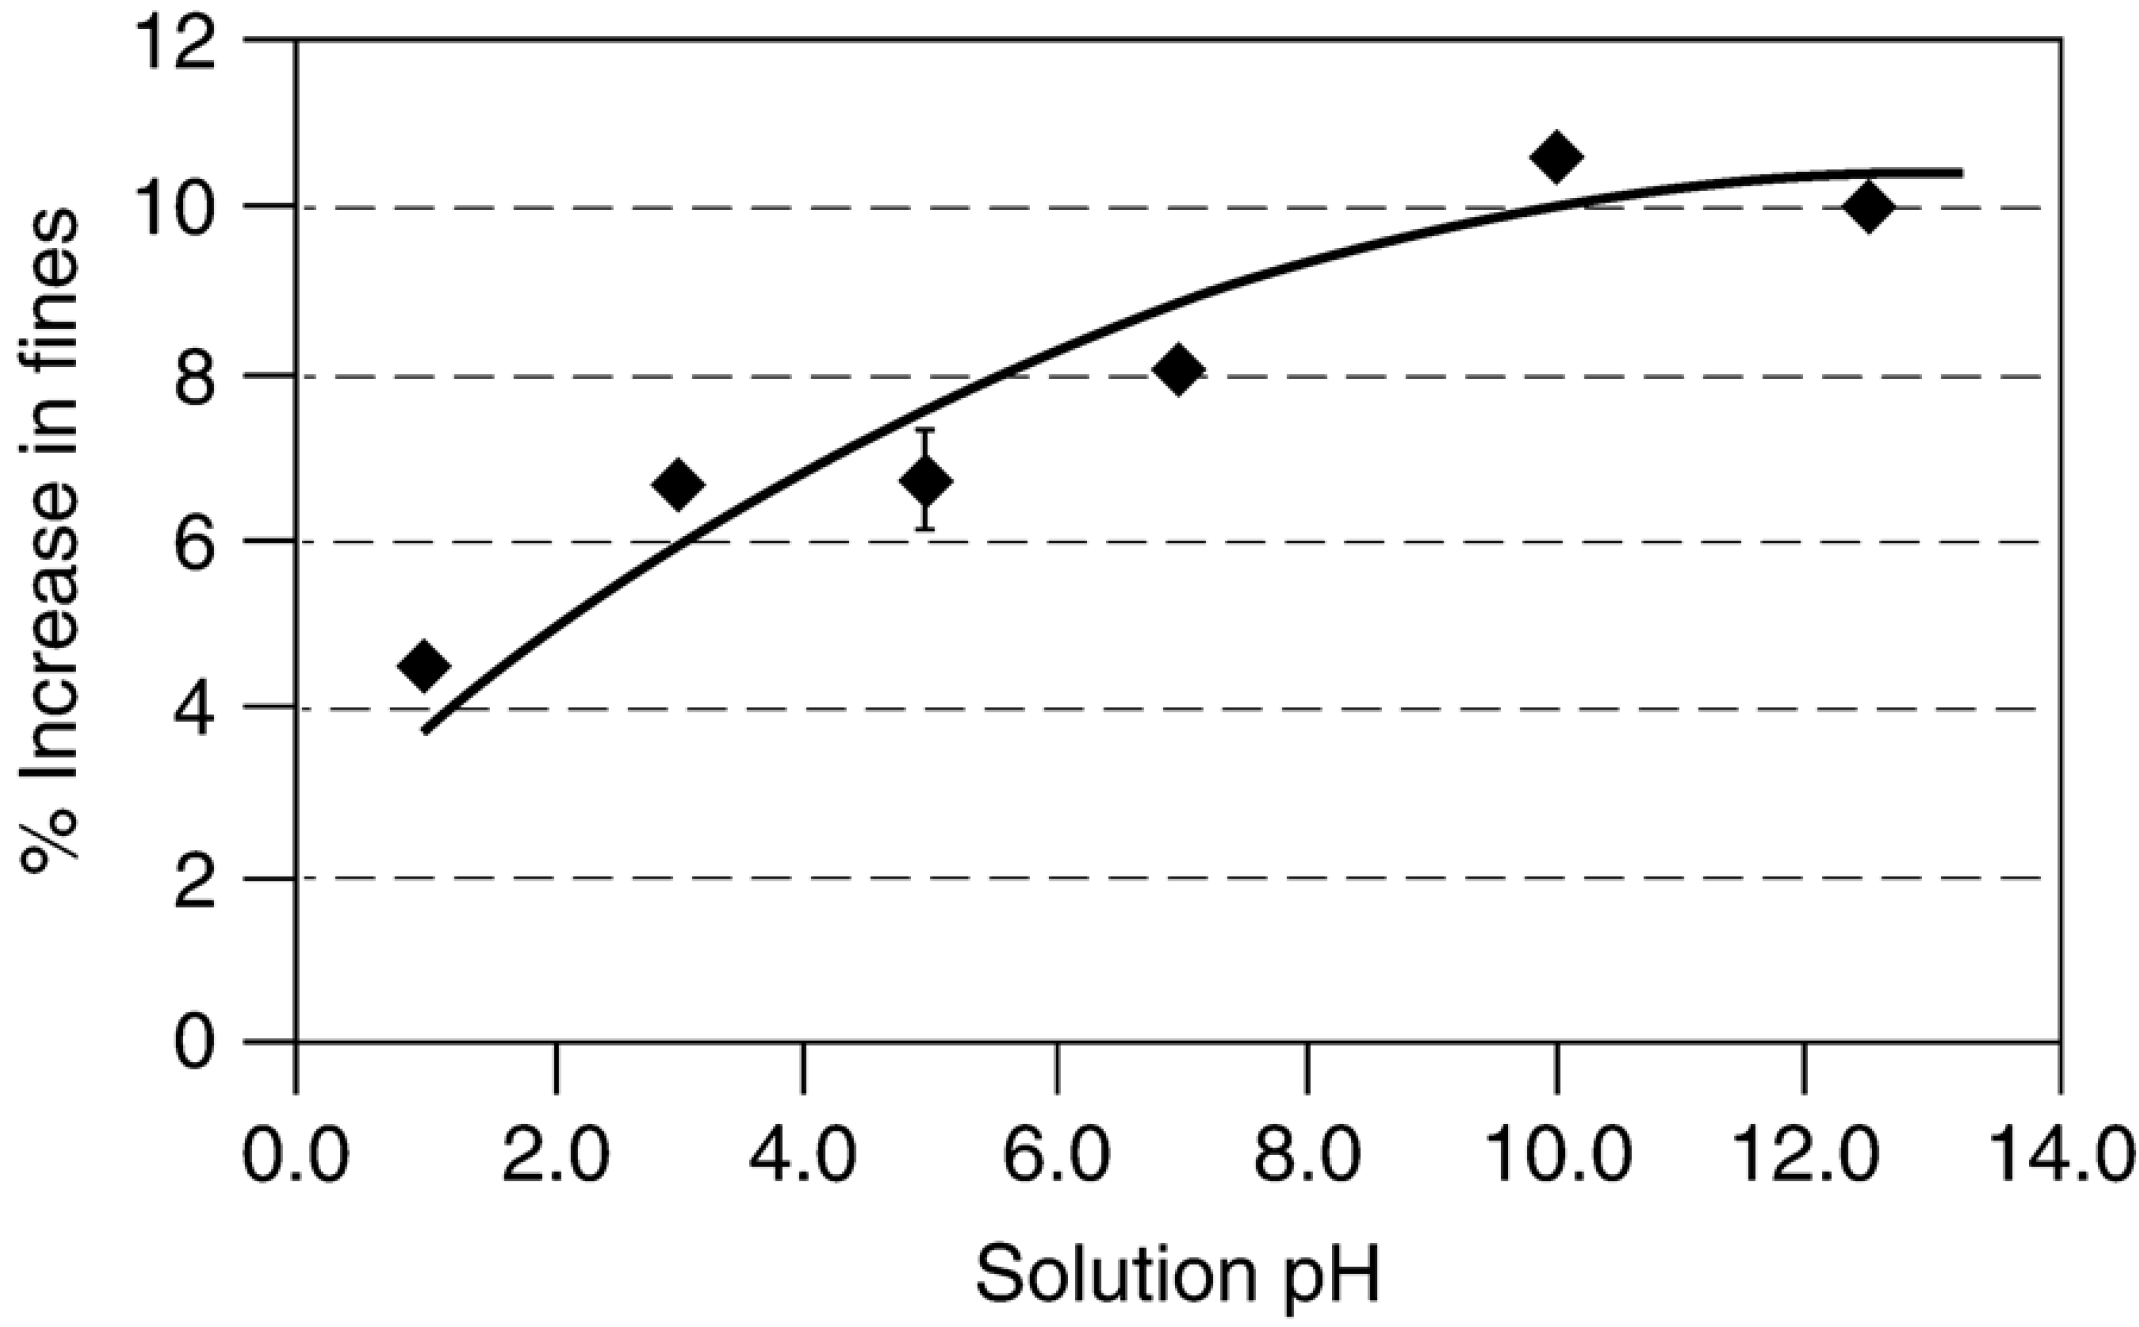
2.5.2. Role of Physical and Chemical Properties of Ceramic Agglomerates in Determining Strength and Attrition Resistance
2.5.2.1. Factors Affecting the Magnitude of Stress Required for Agglomerate Breakage and the Mechanisms by Which It Occurs
2.5.2.2. Fracture Toughness of Ceramic Agglomerates
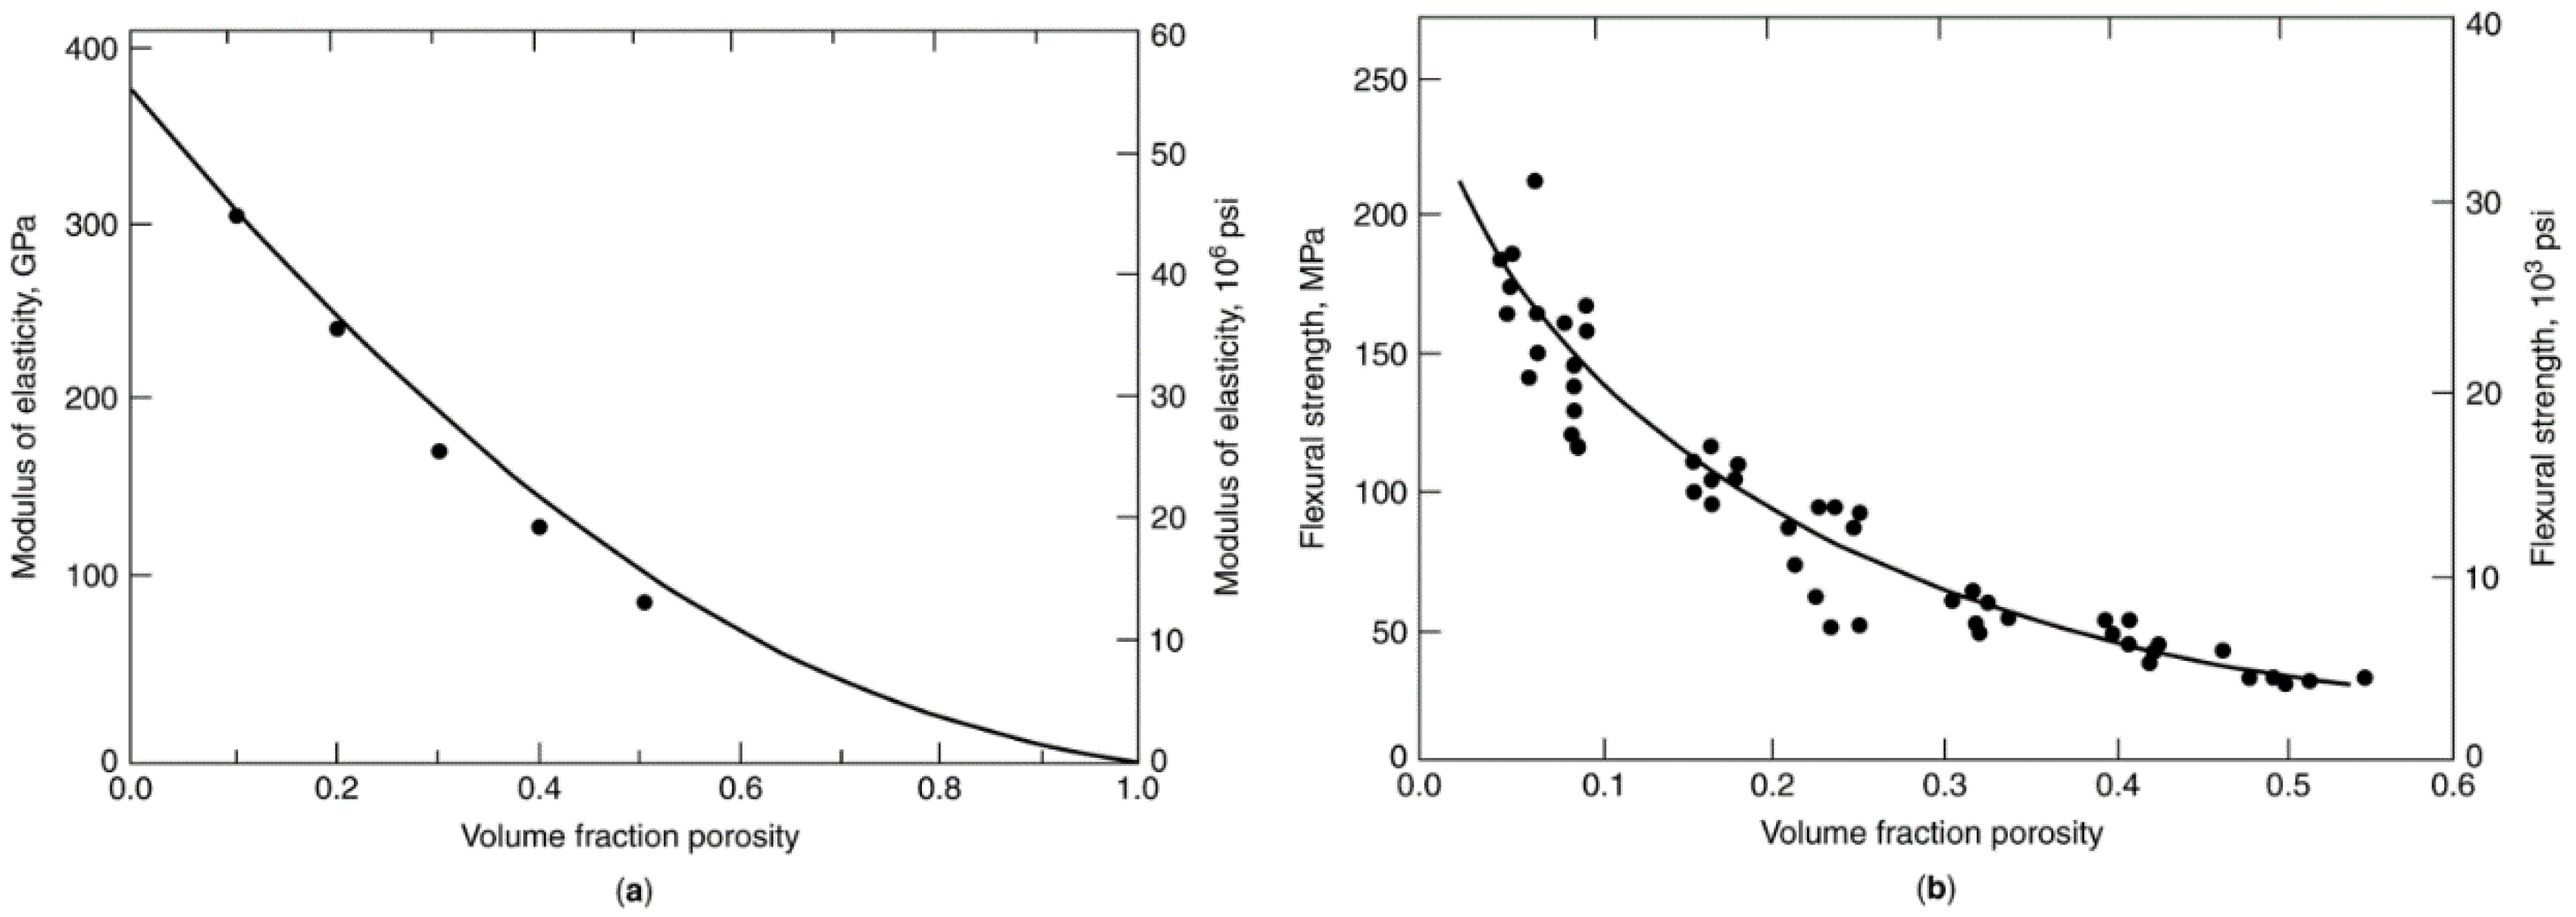
2.5.2.3. Effects of Porosity on Ceramic Agglomerate Strength

2.5.2.4. Compressive Strengths of Ceramic Materials
2.5.3. Tensile Strengths and Attrition Resistance of Catalyst Supports and Catalysts
2.5.3.1. Tensile Strength Data for Catalyst Support Agglomerates
| Catalyst support or ceramic | Preparation/pretreatment/properties | Strength, MPa | Attrition index, wt%/h | Ref. | ||
|---|---|---|---|---|---|---|
| High surface area catalyst supports | ||||||
| γ-Al2O3, 1.2–4.25-mm spheres | Sol–gel granulation/dried 10 h at 40 °C, calcined 3 h at 450 °C/389 m2/g, dpore = 3.5 nm | 11.6 ± 1.9 | 0.033 | [167] | ||
| γ-Al2O3, 4.25-mm spheres | Alcoa LD-350 | 0.7 | 0.177 | [167] | ||
| γ-Al2O3, 100 μm | VISTA-B-965-500C | 6.2 ± 1.3 | - | [163] | ||
| TiO2 (anatase), 30 μm | Thermal hydrolysis/dried 110 °C, calcined 2 h at 500 °C/ 92 m2/g, <10-nm primary crystallites | 28a | - | [168] | ||
| TiO2 (anatase), 90 μm | Basic precipitation/dried 110 °C, calcined 2 h at 500 °C/81 m2/g, 10–14-nm primary crystallites | 15a | - | [168] | ||
| TiO2 (75% anatase, 25% rutile) | Degussa P25, fumed/4-mm extrudates/48 m2/g, Vpore = 0.34 cm3/g, dpore = 21 nm | 0.9 | - | [169] | ||
| TiO2 (anatase) | Rhone-Poulenc DT51, ppt./4 mm extrudates/92 m2/g, Vpore = 0.40 cm3/g, dpore = 8, 65 nm | 0.9 | - | [169] | ||
| Low surface area ceramics | ||||||
| Al2O3 | Spray dried with organic binder; plastic deformation observed | 2.3 | - | [170] | ||
2.5.3.2. Effects of Preparation and Pretreatment on Catalyst Agglomerate Strength
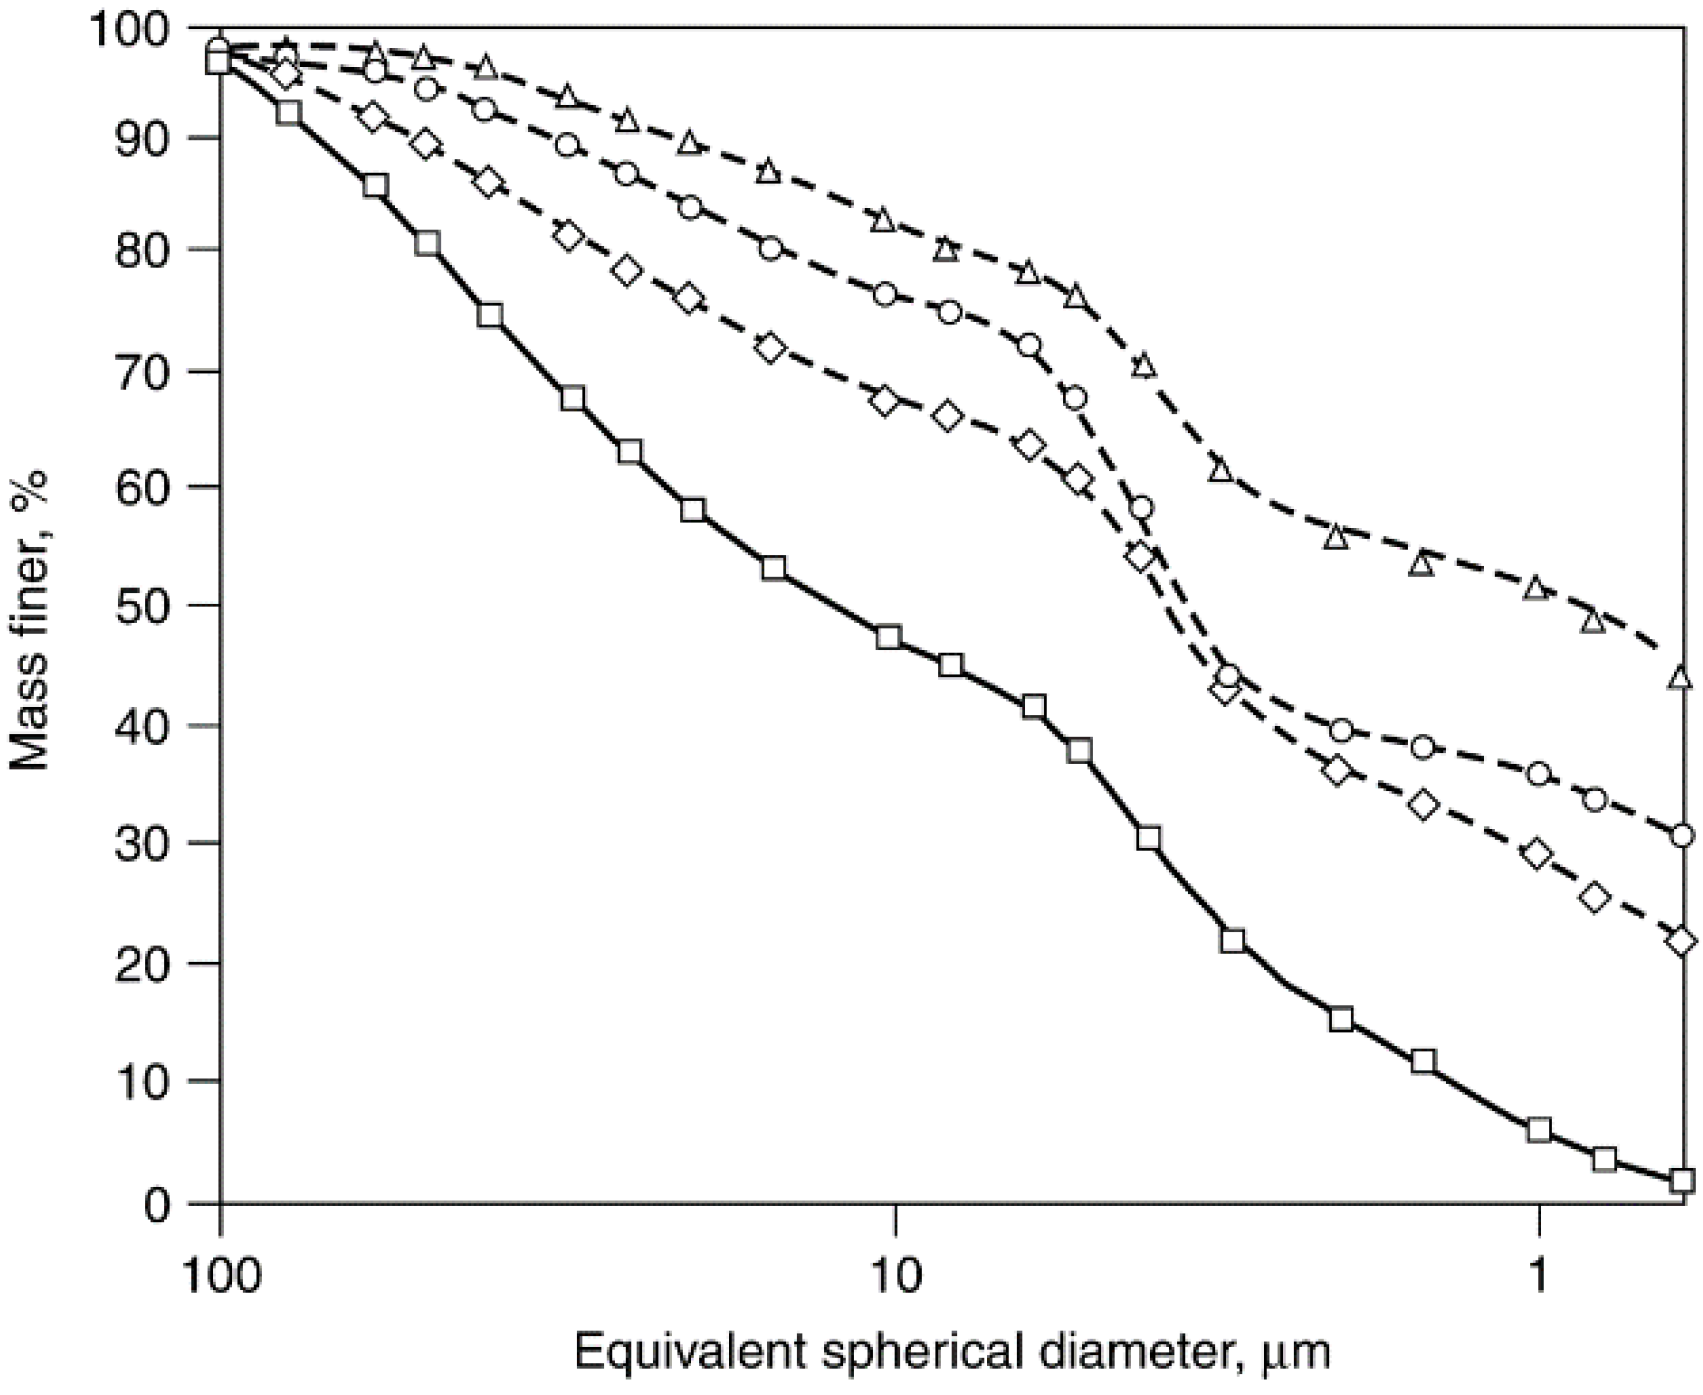
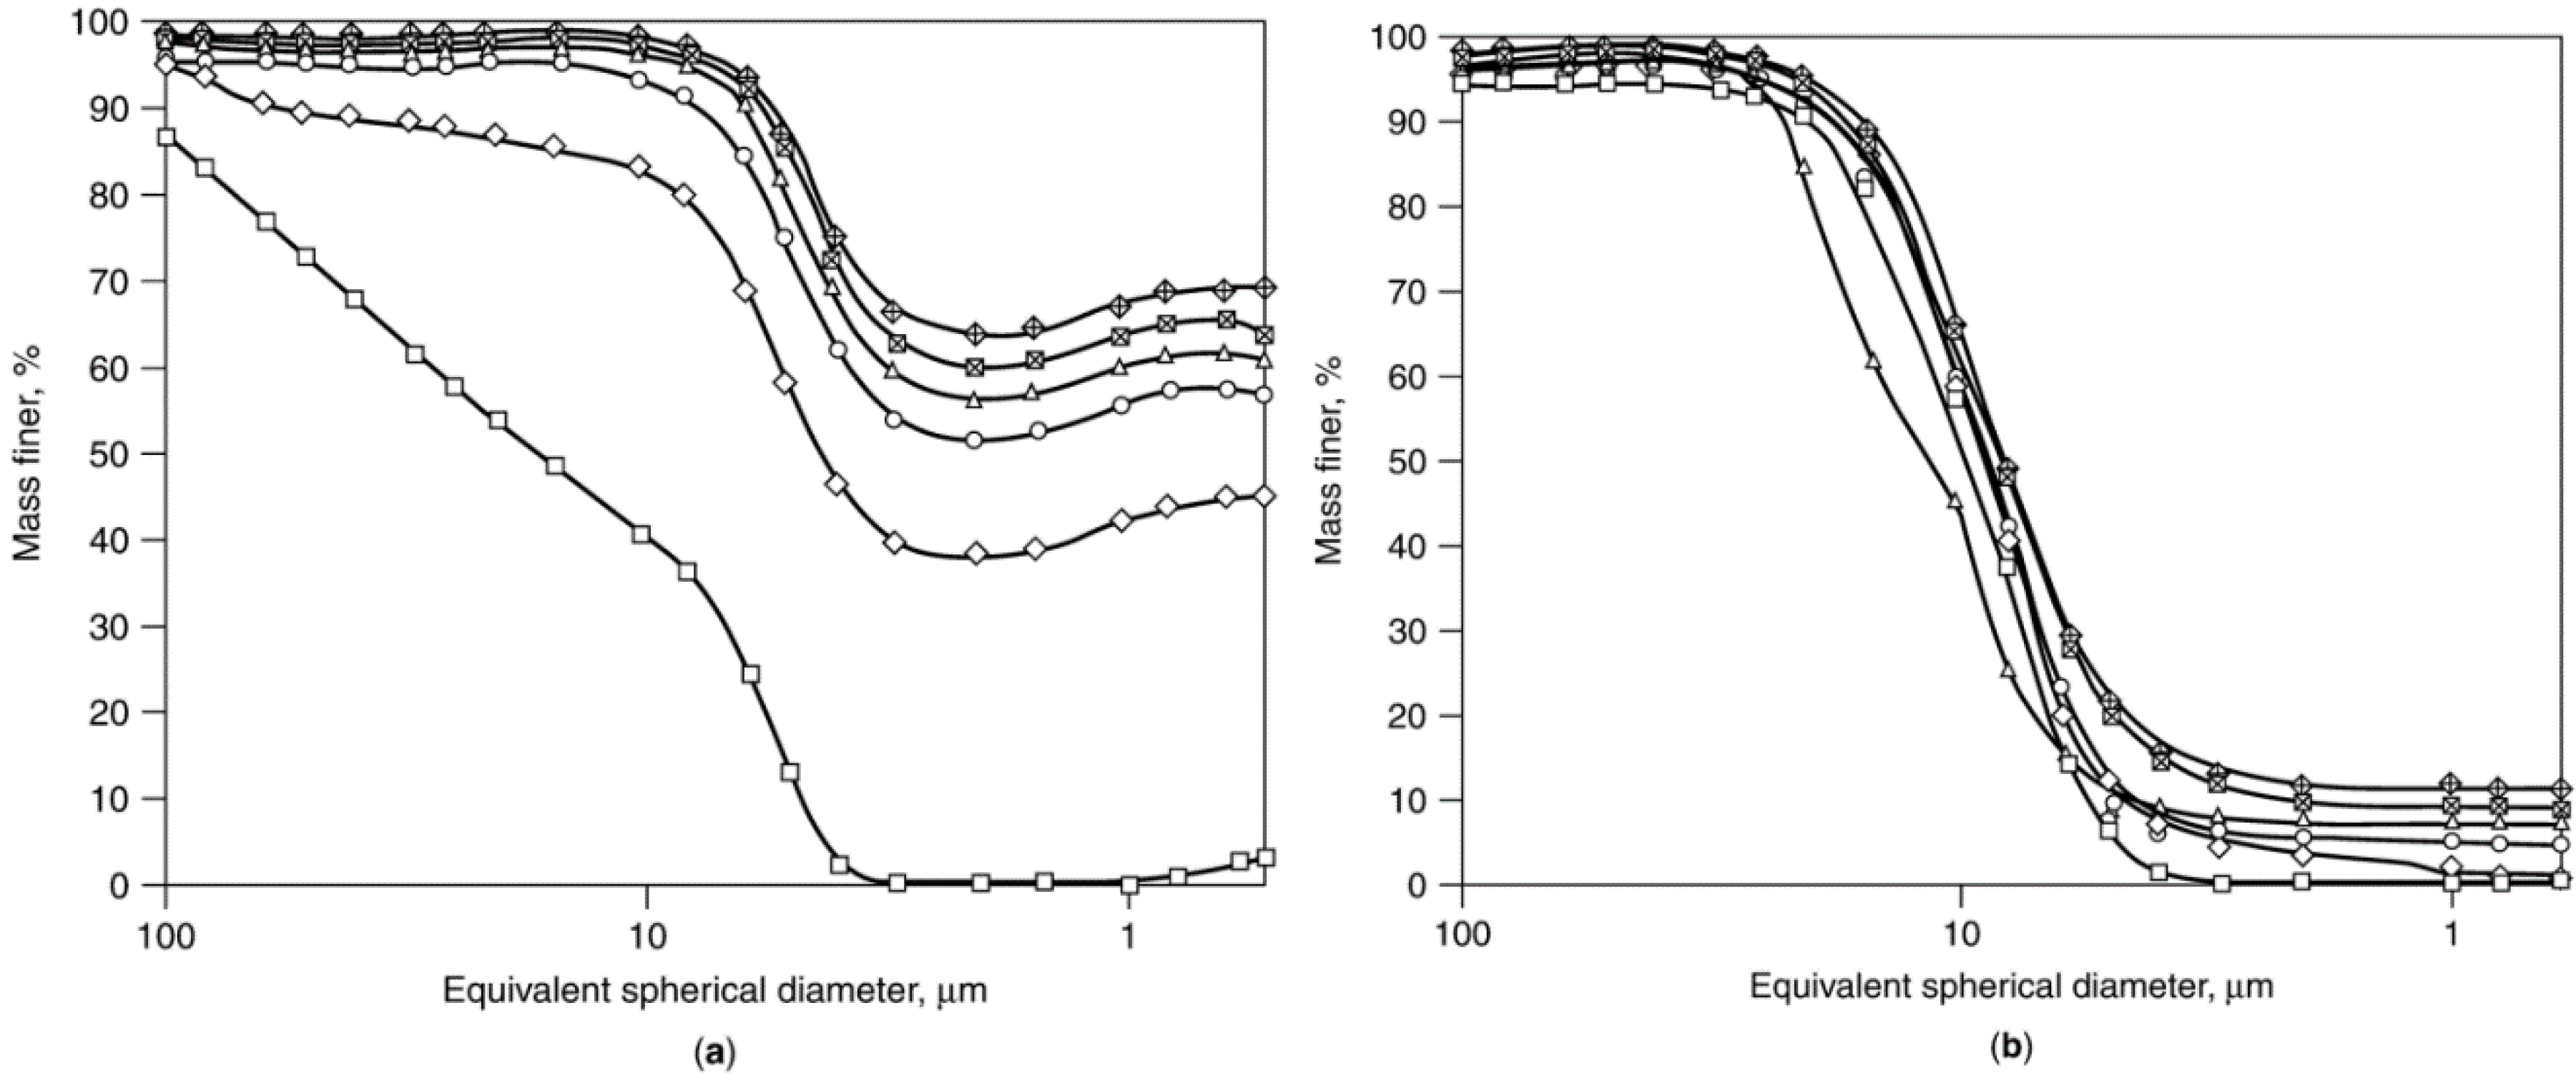
2.5.4. Attrition of Catalyst Agglomerates: Mechanisms, Studies, and Test Methods


 Co/SiO2 fresh.
Co/SiO2 fresh.
Co/SiO2 fresh.
2.5.5. Implications of Mechanistic Knowledge of Attrition for Catalyst Design
2.6. Summary of Deactivation Mechanisms for Solid Catalysts
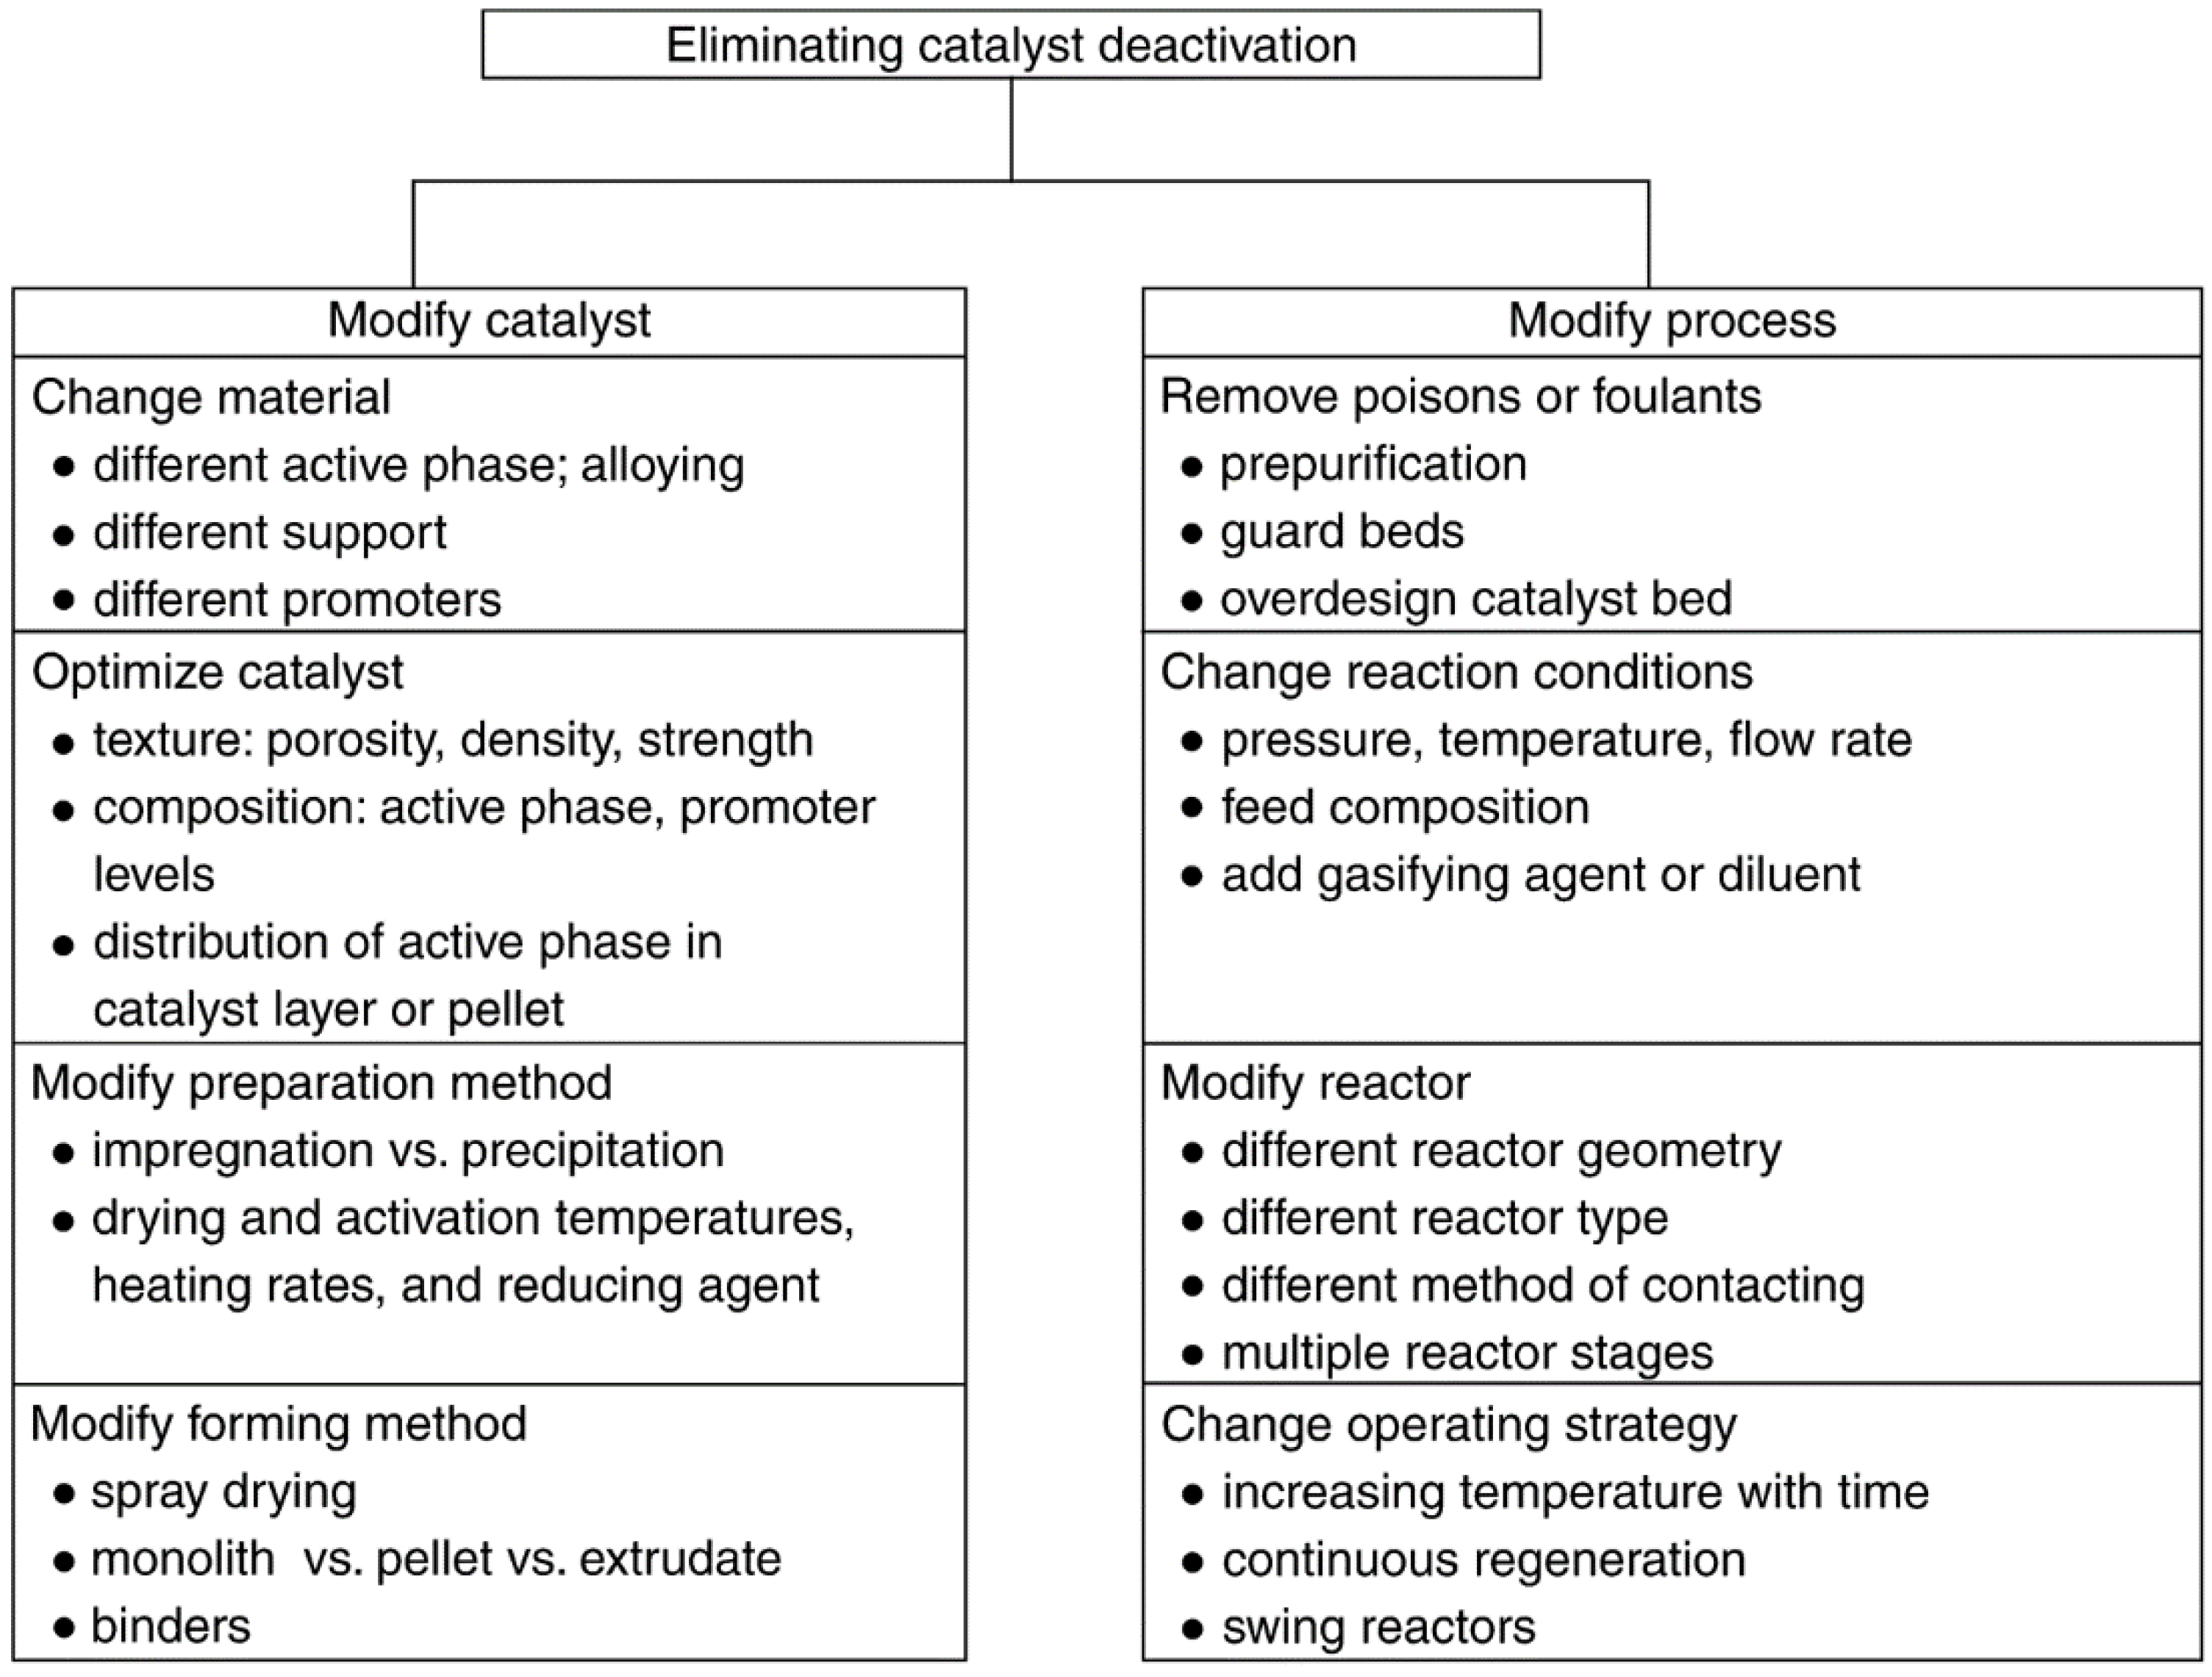
3. Prevention of Catalyst Decay
| Effects on reaction rate | |||||
|---|---|---|---|---|---|
| Deactivation mechanism | Decrease in number of active sites | Decrease in intrinisic activity (kintr) | Decrease in effectiveness factor (η) | Deactivation process | |
| Fast or slow a | Reversible | ||||
| Chemical degradation | × | × | × b,c | Varies | No |
| Fouling | × | × | - | Fast | Yes |
| Mechanical degradation | × | - | - | Varies | No |
| Poisoning | × | × | - | Slow | Usually |
| Thermal degradation/Sintering | × | × b,d | × b,e | Slow | Sometimes |
| Vaporization/leaching | × | × b,f | - | Fast | Sometimes |
3.1. General Principles of Prevention
| Reaction | Operating conditions | Catalyst | Typical life (years) | Process affecting life of catalyst charge | Catalyst property affected |
|---|---|---|---|---|---|
| Ammonia synthesis N2 + 3 H2→2 NH3 | 450–470 °C 200–300 atm | Fe with promoters (K2O) and stabilizer (Al2O3) | 10–15 | Slow sintering | Activity |
| Methanation (ammonia and hydrogen plants) CO/CO2 + H2→CH4 + H2O | 250–350 °C 30 atm | Supported nickel | 5–10 | Slow poisoning by S, As, K2CO3 from plant upsets | Activity and pore blockage |
| Acetylene hydrogenation (“front end”) C2H2 + H2→C2H4 | 30–150 °C 20–30 atm | Supported palladium | 5–10 | Slow sintering | Activity/selectivity and temperature |
| Sulfuric acid manufacturing 2 SO2 + O2→2 SO3 | 420–600 °C 1 atm | Vanadium and potassium sulfates on silica | 5–10 | Inactive compound formation; pellet fracture; plugging by dust | Activity, pressure drop, and mass transfer |
| Methanol synthesis CO + 2 H2→CH3OH | 200–300 °C 50–100 atm | Copper on zinc and aluminum oxides | 2–5 | Slow sintering; poisoning by S, Cl, and carbonyls | Activity |
| Low temperature water gas shift CO + H2O→CO2 + H2 | 200–250 °C 10–30 atm | Copper on zinc and aluminum oxides | 2–4 | Slow poisoning and accelerated sintering by poisons | Activity |
| Hydrocarbon hydrodesulfurization R2S + 2 H2→H2S + R2 | 300–400 °C 30 atm | Cobalt and molybdenum sulfides on aluminum oxide | 1–10 | Slow coking, poisoning by metal deposits in residuum | Activity, mass transfer, and pressure drop |
| High temperature water gas shift CO + H2O→H2 + CO2 | 350–500 °C 20–30 atm | Fe3O4 and chromia | 1–4 | Slow sintering, pellet breakage due to steam | Activity and pressure drop |
| Steam reforming, natural gas CH4 + H2O→CO + 3 H2 | 500–850 °C 30 atm | Nickel on calcium aluminate or α-alumina | 1–3 | Sintering, sulfur-poisoning, carbon formation, and pellet breakage due to plant upsets | Activity and pressure drop |
| Ethylene partial oxidation 2 C2H4 + O2→2 C2H4O | 200–270 °C 10–20 atm | Silver on α-alumina with alkali metal promoters | 1–3 | Slow sintering, poisoning by Cl, S | Activity and selectivity |
| Butane oxidation to maleic anhydride C4H10 + 3.5 O2→C4H2O3 + 4 H2O | 400–520 °C 1–3 atm | Vanadium phosphorus oxide with transition metal additives | 1–2 | Loss of P; attrition or pellet breakage; S, Cl poisoning | Activity and selectivity |
| Reduction of aldehydes to alcohols RCHO + H2→RCH2OH | 220–270 °C 100–300 atm | Copper on zinc oxide | 0.5–1 | Slow sintering, pellet breakage (depends on feedstock) | Activity or pressure drop |
| Ammonia oxidation 2 NH3 + 5/2 O2→2 NO + 3 H2O | 800–900 °C 1–10 atm | Pt–Rh alloy gauze | 0.1–0.5 | Surface roughness, loss of platinum | Selectivity, fouling by Fe |
| Oxychlorination of ethylene to ethylene dichloride 2 C2H4 + 4 HCl + O2 →2 C2H4Cl2 + 2 H2O | 230–270 °C 1–10 atm | Copper chlorides on alumina (fluidized bed) | 0.2–0.5 | Loss by attrition and other causes resulting from plant upsets | Fluidized state and activity |
| Catalytic hydrocarbon reforming | 460–525 °C 8–50 atm | Platinum alloys on treated alumina | 0.01–0.5 | Coking, frequent regeneration | Activity and mass transfer |
| Catalytic cracking of oils | 500–560 °C 2–3 atm | Synthetic zeolites (fluidized bed) | 0.000002 | Very rapid coking, continuous regeneration | Activity and mass transfer |

| Basic mechanism | Problem | Cause | Methods of minimization |
|---|---|---|---|
| Chemical degradation | Oxidation of metal catalysts to inactive oxides | Oxidation of metal by contaminant O2 or reactant/product water |
|
| Transformation of active phase to stable, inactive phase | Solid-state reaction of active phase with support or promoters |
| |
| Overreduction of active oxide phases |
| ||
| Fouling by coke or carbon | Loss of catalytic surface sites due to formation of carbon or coke films | Free radical reactions in gas phase |
|
| Free radical reactions at reactor walls |
| ||
| Formation and growth on metal surfaces |
| ||
| Fouling by coke or carbon (cont.) | Loss of catalytic surface sites due to formation of carbon or coke films | Formation and growth on metal oxides, sulfides |
|
| Loss of catalyst effectiveness; plugging of pores; destruction of catalyst | Formation of gas phase coke, vermicular carbons, and liquid or solid cokes in massive quantities |
| |
| Hot spots in pellet or bed |
| ||
| Mechanical failure | Crushing of granules, pellets, or monoliths in a fixed bed | Brittle fracture due to a mechanical load |
|
| Attrition and/or erosion in fixed or moving beds | Abrasion of catalyst coatings or particles due to mechanical, thermal, or chemical stresses |
| |
| Poisoning | Loss of catalytic surface sites | Blockage of sites by strong adsorption of impurity |
|
| Thermal degradation, sintering | Loss of metal area | Metal particle or subparticle migration at high temperatures |
|
| Loss of support area | Crystallization and/or structural modification or collapse | Same as for avoiding loss of metal area |
| Deactivation mechanism Process/Reaction Catalyst | Problem/cause | Method(s) of minimization | Ref. | ||
|---|---|---|---|---|---|
| Chemical degradation | |||||
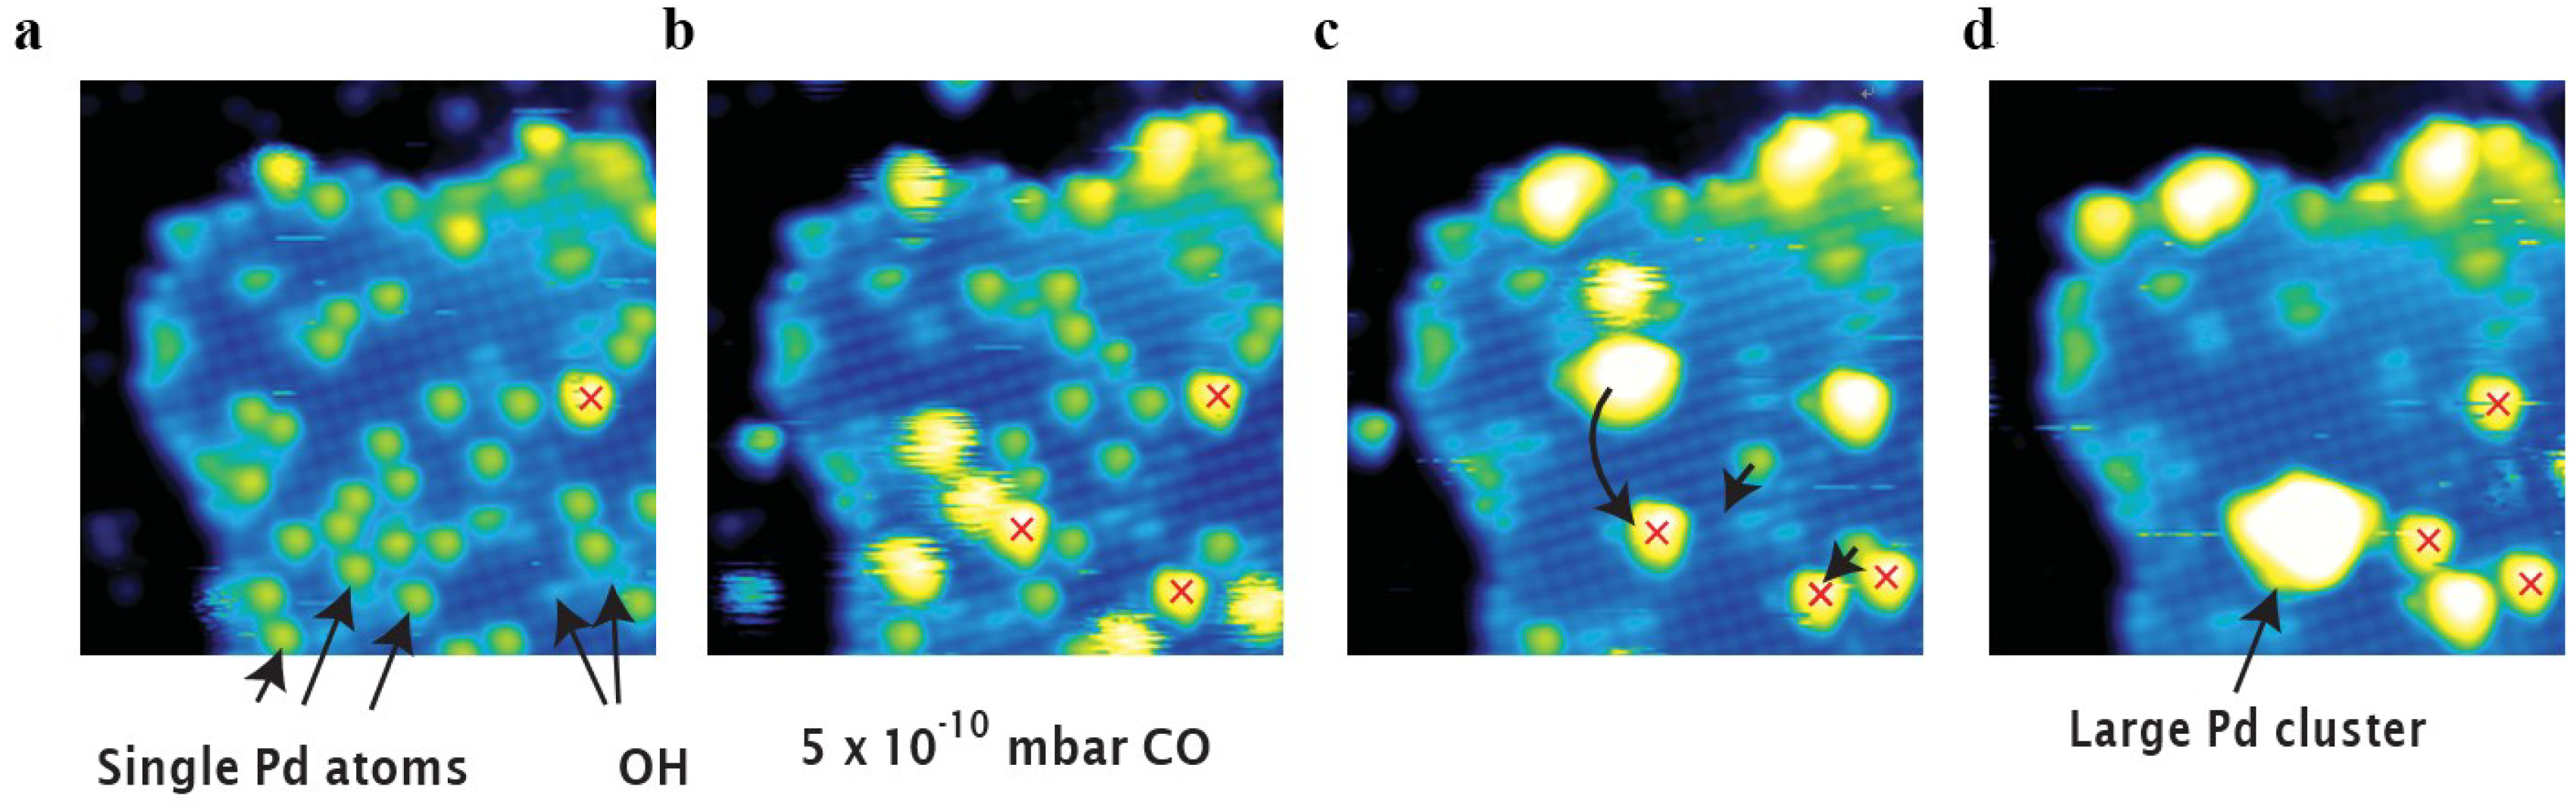
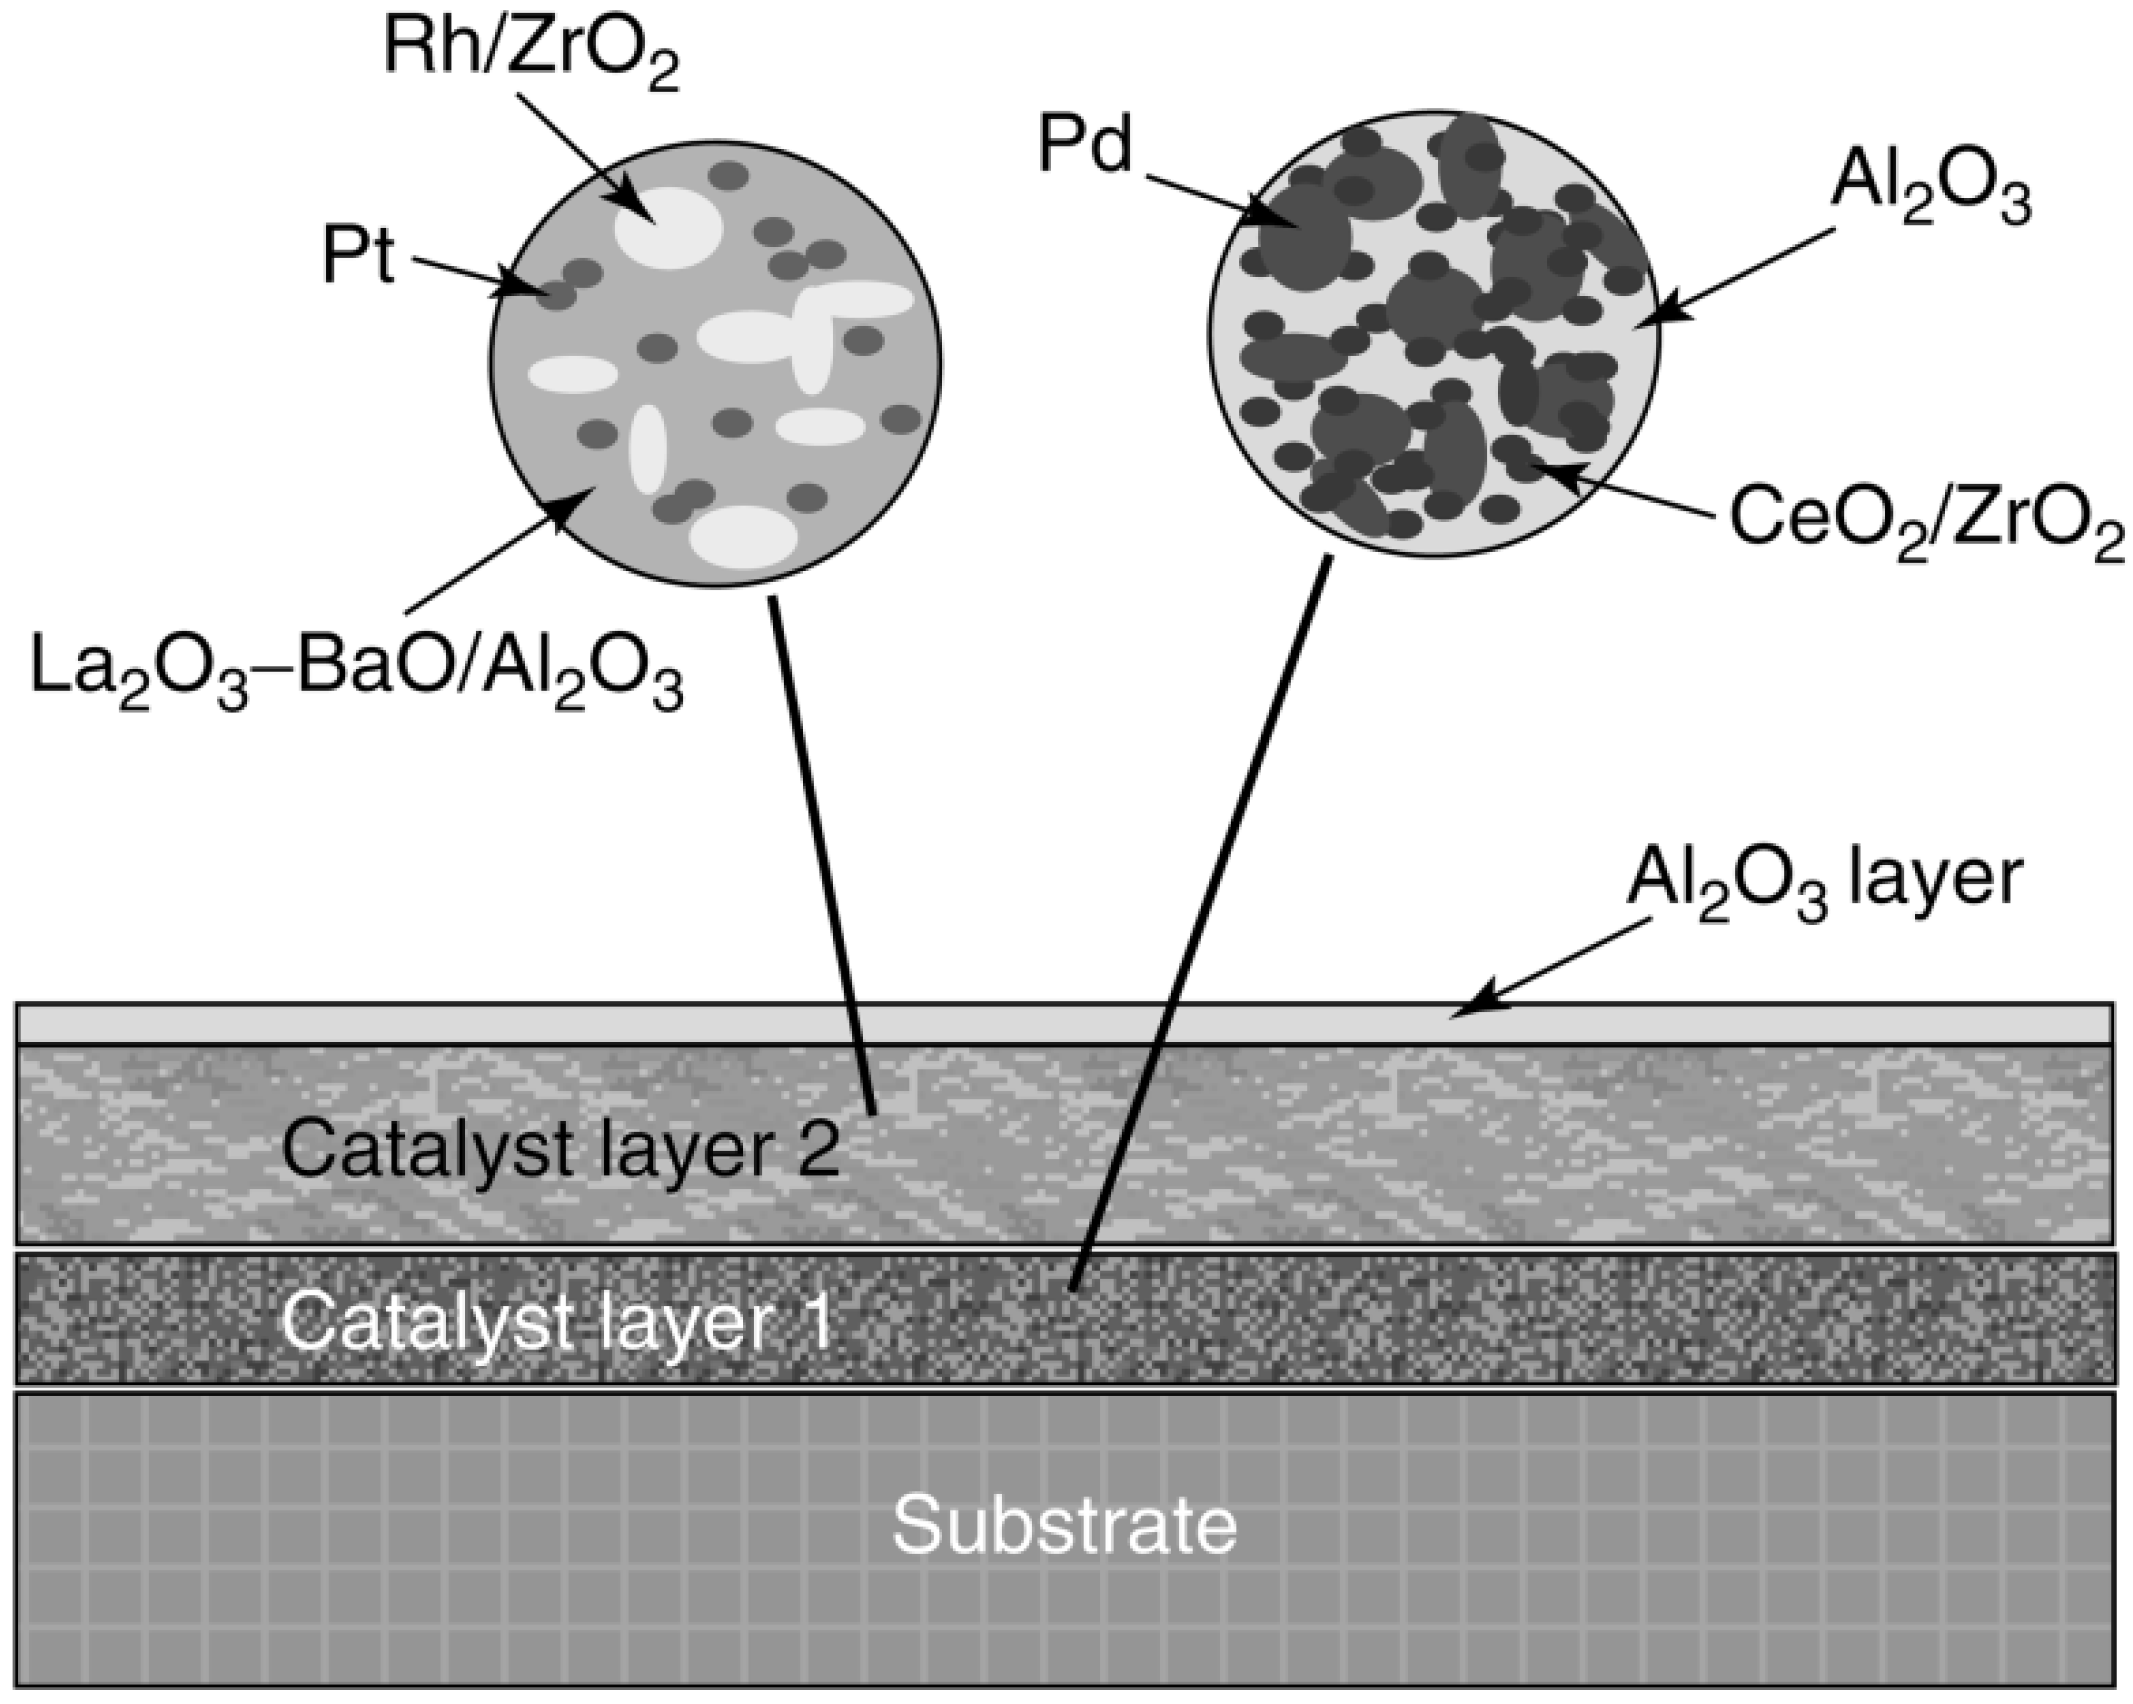
| Auto emissions control Pt– or Pd–Rh/Al2O3 | In three-way catalyst, Rh is very active for NO reduction, but it forms a solid solution with Al2O3 that has no activity and alloys with Pt or Pd that reduce its activity | Place Rh in a separate catalyst layer from Pt or Pd to prevent alloying; support Rh on ZrO2, which is a noninteracting support for Rh. In general, multilayer strategies (up to 6 layers) are used to prevent undesirable interactions between different components of the catalyst | [183,184,185] | ||
| Fischer–Tropsch synthesis Co supported on Al2O3, SiO2, TiO2, and Fe/Cu/K/SiO2 | Oxidation of active Co metal crystallites to inactive Co oxides, aluminates, and silicates and of active iron carbides to inactive Fe3O4 or Fe3C in the presence of high pressure steam at high conversion |
| [8,126,186,187] | ||
| Partial oxidation of isobutene to methacrolein Fe2(MoO4)3, Mo12BixCeyOz | Overreduction of the catalyst during reaction leads to activity decrease |
| [154,156,188] | ||
| Steam reforming and steam-oxygen conversion of propane Pd/Al2O3 | In the absence of steam, PdO is reduced to less active, less thermally stable Pd metal | Adding steam to the reactants inhibits oxidation of propane at lower reaction temperatures while preventing reduction of PdO at higher temperatures (up to 700–900 °C) | [189] | ||
| Fouling by coke, carbon | |||||
| Alkene oligomerization Zeolites, esp. ZSM-5, –22, –23, beta-zeolite, ferrierite | Catalyst fouling by condensation of heavy oligomers to coke |
| [190,191,192] | ||
| Alkylation of isoparaffins on solid catalystsSulfated zirconia, USY a, Nafion | Rapid catalyst deactivation due to coke formation; unacceptable product quality, and thermal degradation of catalyst during regeneration |
| [193,194] | ||
| Catalytic reforming of naphtha Pt/Al2O3 promoted with Re, Sn, Ge, or Ir | Poisoning and fouling by coke produced by condensation of aromatics and olefins |
| [8,195,196,197,198] | ||
| Dehydrogenation of propane and butane Cr2O3/Al2O3, Cr2O3/ZrO2, FeO/K/MgO, Pt/Al2O3, Pt–Sn/Al2O3, Pt–Sn/KL-zeolite | Catalyst activity is low owing to equilibrium limitations and buildup of product H2; rapid loss of activity occurs owing to coke formation |
| [8,199,200,201,202,203] | ||
| Hydrocracking of heavy naphthaCoMo, NiW, MoW on Al2O3 or SiO2–Al2O3; Pt or Pd on Y-zeolite, mordenite or ZSM-5 | Loss of activity due to poisoning of sites and blocking of small zeolite pores by coke |
| [8,198,204] | ||
| Methane reforming CO2/Co/SiO2, Pt/SiO2, Pt/ZrO2, MgO-supported noble metals, NiO·MgO solid solution | High rates of carbon formation, which rapidly deactivate catalyst |
| [205,206,207,208] | ||
| Methanol to olefins or gasoline Silica–alumina, Y-zeolite, ZSM-5, other zeolites, and aluminophosphate molecular sieves | Severe coking and deactivation of silica–alumina and Y-zeolite catalysts observed during high conversions of MeOH; also substantial coking of ZSM-5, other zeolites, and alumino-phosphate molecular sieves |
| [209,210,211,212,213,214,215,216,217,218,219,220,221,222,223,224,225,226,227,228,229,230,231,232,233,234,235,236] | ||
| Steam reforming of light hydrocarbons or naphtha Ni on MgO, MgAl2O4 or CaAl2O4 promoted with S, Cu, or Au | High rates of carbon and coke formation, which rapidly deactivate catalyst |
| [8,60,70,71] | ||
| Poisoning | |||||
| Auto emissions control Pt–Rh/Al2O3 or Pd/Al2O3 | Poisoning of noble metal catalyst by P and S compounds and large hydrocarbons from lube oil | Optimize pore structure of alumina, deposit noble metals in layers below the support surface, or provide a diffusion barrier coating of zeolite or alumina; these measures prevent access of large poison molecules to catalyst layer | [18,212] | ||
| Fischer–Tropsch synthesis Co/Al2O3 | 100 ppb of HCN and NH3 poisons cobalt slurry catalyst within 4 days | Remove HCN and NH3 to less than 50 ppb total by (1) catalytic hydrolysis of HCN to NH3, followed by scrubbing with water or (2) guard bed containing acidic solid absorbent | [213] | ||
| Fluidized catalytic cracking (FCC) USY or REO-Y b in silica matrix |
|
| [8,198] | ||
| Poisoning | |||||
| Hydrotreating of gas oil; deep HDS Al2O3- supported CoMo, noble metals | Noble metal hydrogenation and high-activity HDS catalysts are poisoned by H2S |
| [198] | ||
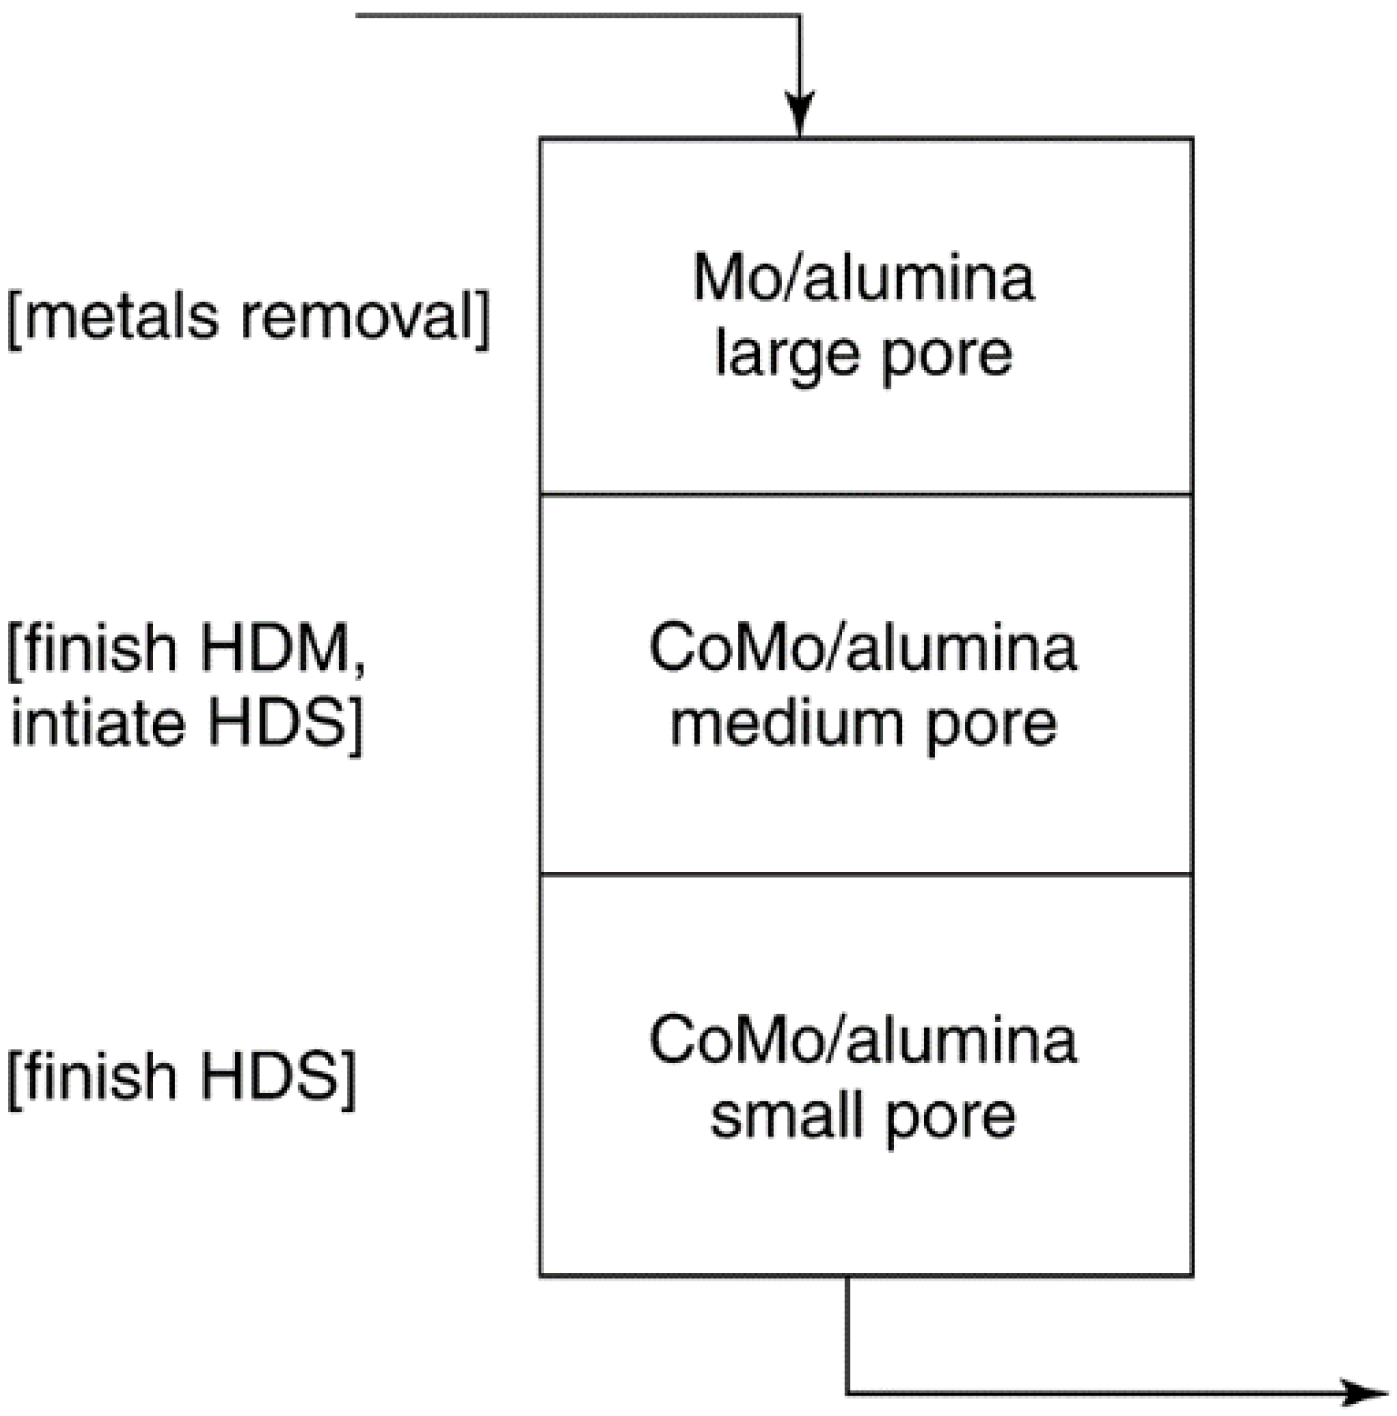
| Hydrotreating of residuum Al2O3- supported Mo and CoMo | Pore-mouth poisoning and blockage by Ni, V, and Fe sulfides present in feed as organometallics |
| [8,214] | ||
| Thermal degradation | |||||
| Auto emissions control PdO/δ- or θ-Al2O3 doped with BaO, La2O3, Pr2O3, CeO2, and ZrO2 | In close-couple, fast-warm-up converters, exhaust temperatures reach 1000–1100 °C; conventional Pt–Rh/γ-Al2O3 catalysts sinter rapidly under these conditions; CeO2 used as oxygen storage material also sinters rapidly |
| [8,215,216,217,218,219,220,221,222] | ||
| Catalytic combustion of methane and LNG PdO/La2O3, Pr2O3, CeO2, and ZrO2 | Reaction temperatures ranging up to 1400 °C cause rapid sintering of most catalytic materials. Conversion above 800 °C of PdO to Pd metal is followed by rapid sintering of Pd and loss of activity |
| [8,224,225,226,227] | ||
| Dehydrogenation of butene to butadiene Cr2O3/Al2O3, Pt–Sn/Al2O3 | Permanent loss of catalytic activity by sintering at high reaction temperatures (550–650 °C) | Optimize the operation of staged catalytic reactors (cycle time between regenerations, temperature, and composition of the feed as variables) while placing a limit on the upper temperature | [8,228] | ||
| Fischer–Tropsch synthesis Co/Al2O3, Co/SiO2, Co/TiO2 | Sintering in hot spots and loss of hydrocarbon selectivity at higher reaction temperatures due to highly exothermic reaction |
| [186,229] | ||
| Fluid catalytic cracking (FCC) USY, REO-Y | Dealumination and destruction of zeolite crystallinity and loss of surface area/pore volume during high-temperature (650–760 °C, 3 atm) regeneration in steam/air |
| [8,198] | ||
| Methane steam reforming Ni on MgAl2O4 or CaAl2O4 | Sintering of Ni and support during high-temperature reaction (800–1000 °C) in high-pressure steam (20 atm) |
| [8,70] | ||
| Mechanical degradation | |||||
| Partial oxidation of n-butane to maleic anhydride VPO | Attrition in fluidized-bed process | Imbed catalyst particles in a strong, amorphous matrix of zirconium hydrogen phosphate | [182] | ||
| Fischer–Tropsch synthesis in a bubble-column slurry reactor Co/Al2O3, Co/SiO2, Co/TiO2 | Attrition in bubble column slurry reactor |
| [230,231,232,233,234,235] | ||
3.2. Prevention of Chemical Degradation (by Vapor–Solid and Solid–Solid Reactions)
3.3. Prevention of Fouling by Coke and Carbon

3.4. Prevention of Poisoning

3.5. Prevention of Sintering
3.6. Prevention of Mechanical Degradation

4. Regeneration of Deactivated Catalysts
| Deactivation mechanism Process/Reaction Catalyst | Problem/cause | Method(s) of regeneration/phenomena studied/conclusions | Ref. |
|---|---|---|---|
| Deactivation by coke, carbon | |||
| Alkene aromatization oligomerization Zeolites, esp. ZSM-5, -22, -23, beta-zeolite, ferrierite | Catalyst fouling by condensation of heavy oligomers to coke |
| [258,259] |
| Alkylation of isoparaffins on solid catalysts Sulfated zirconia, USY a, Nafion, silicalite, ZSM-5 | Rapid catalyst deactivation due to coke formation; unacceptable product quality, and thermal degradation of catalyst during regeneration |
| [260,261,262,263] |
| Catalytic reforming of naphtha Pt/Al2O3 promoted with Re, Sn, Ge, or Ir | Poisoning and fouling by coke produced by condensation of aromatics and olefins |
| [264,265,266,267,268,269] |
| Dehydrogenation of propane and butane Cr2O3/Al2O3, Cr2O3/ZrO2, FeO/K/MgO, Pt/Al2O3, Pt–Sn/Al2O3, Pt–Sn/KL-zeolite | Catalyst activity is low due to equilibrium limitations and build-up of product H2; rapid loss of activity occurs due to coke formation |
| [270,271] |
| Fischer–Tropsch synthesis Co/Al2O3 | Loss of activity due to blocking of sites by carbon overlayers and heavy hydrocarbons |
| [272–274] |
| Fluid catalytic cracking (FCC) of heavy hydrocarbons USY or REO-Y b in silica matrix | Rapid loss of activity due to poisoning of acid sites and blocking of small zeolite pores by coke |
| [275,276] |
| Hydrocracking of heavy naphtha CoMo, NiW, MoW on Al2O3 or SiO2–Al2O3; Pt or Pd on Y-zeolite, mordenite, or ZSM-5 | Loss of activity due to poisoning of acid sites and blocking of small zeolite pores by coke |
| [277,278] |
| Hydrotreating of gas oil Al2O3-supported Mo and CoMo, NiMo, NiCoMo, MoW, NiW | Loss of activity due to formation of types I, II, and III coke on metal sulfide and alumina surfaces and in pores |
| [279,280,294,295,296,297] |
| Methanol to olefins or gasoline Silica– alumina, Y-zeolite, ZSM-5, other zeolites, and aluminophosphate molecular sieves | Severe coking and deactivation of silica–alumina and Y-zeolite catalysts observed during high conversions of MeOH; also substantial coking of ZSM-5, other zeolites, and aluminophosphate molecular sieves |
| [281,282] |
| Poisoning | |||
| FCC of residuum USY or REO-Y in silica matrix |
|
| [281,282,298,299,300,301] |
| Hydrogenation or dechlorination Ni/SiO2, Pd/Al2O3 | Poisoning of metal sites by arsenic, sulfur, and other poisons |
| [285,286] |
| Hydrotreating of residuum Al2O3-supported Mo and CoMo | Pore-mouth poisoning and blockage by Ni, V, and Fe sulfides present in feed as organometallics |
| [287,288] |
| Thermal degradation | |||
| Catalytic reforming of naphtha Pt/Al2O3 promoted with Re, Sn, Ge, or Ir; Pt/KL-zeolite | Sintering of Pt causing formation of large metal crystallites and loss of active surface area |
| [266,269,289,290] |
| Hydrocracking of heavy naphtha CoMo, NiW, MoW on Al2O3 or SiO2–Al2O3; Pt or Pd on Y-zeolite, mordenite, or ZSM-5 | Sintering of noble metal causing formation of large metal crystallites and loss of active surface area | Redispersion of noble metals on molecular sieves including silica-aluminates, ALPOS, SAPOS | [291] |
| Hydrotreating of gas oil and residuum Al2O3-supported Mo and CoMo | Sintering of Mo and Co sulfides causing formation of large sulfide crystals and loss of active surface area |
| [292,293] |
4.1. Regeneration of Catalyst Deactivated by Coke or Carbon
4.2. Regeneration of Poisoned Catalysts
4.3. Detailed Case Study on Regeneration of Selective Catalytic Reduction (SCR) Catalysts
4.3.1. Introduction to SCR: Key to Abatement of NOx from Coal Utility Boilers
- (1)
- the 1990 ARP and OTC mandates, requiring states to reduce NOx emissions by 80%;
- (2)
- the 1995 OTC-Phase 1 requiring Reasonably Available Control Technology (RACT);
- (3)
- the 1998 NOx SIP Call setting up a regional cap-and-trade program for 20 eastern states based on an equivalent NOx emission rate of 0.15 lb/106-Btu; and
- (4)
4.3.2. Selective Catalytic Reduction of NOx
4.3.2.1. Reaction Chemistry and Preferred Catalysts
4.3.2.2. SCR Process Options
- (1)
- the high dust unit (HDU) involving placement of the SCR unit after the economizer and prior to the air heater, particulate collector, and SO2 scrubber; and
- (2)
- the tail end unit (TEU) involving placement of the SCR unit following the SO2 scrubber.
- (1)
- deactivation of the catalyst due to erosion, fouling, and poisoning by fly ash thereby limiting its useful life to about 3–4 years;
- (2)
- large monolith channel design to limit plugging by fly ash, but which also limits the amount of active catalyst per reactor volume; and
- (3)
- requirement for a low activity catalyst to limit oxidation of SO2 to SO3 and the attendant formation of ammonium sulfates which foul and corrode downstream heat exchangers.
4.3.3. Catalyst Deactivation, Rejuvenation, and Regeneration
4.3.3.1. Catalyst Deactivation
- (1)
- fouling/masking of (deposition of solids on) catalyst surfaces, pores, and channels by fly ash components (e.g., sulfates and phosphates of Ca, K, and Na) or ammonium bisulfate;
- (2)
- chemical poisoning of active sites by elements present in upstream lubricants or originating in the fuel such as As, Se, and P and alkali and alkaline earth metals;
- (3)
- hydrothermal sintering of the titania, especially as a result of high-temperature excursions; and
- (4)
- abrasion or erosion by fly ash.

4.3.3.2. Plant Operating Strategy to Maximize Catalyst Life

4.3.3.3. Catalyst Rejuvenation and Regeneration
4.3.3.4. Methods of Renewing Catalysts
4.3.3.5. Rejuvenation or Regeneration?
- (1)
- the plant’s dispatch economics, including transportation costs;
- (2)
- length of catalyst service;
- (3)
- costs of removing and replacing the catalyst;
- (4)
- the impact of the fuels combusted, i.e., coal, oil, or gas; and
- (5)
- the location of the catalyst in the plant, i.e., HDU or TGU.
4.3.3.5.1. Rejuvenation
4.3.3.5.2. Regeneration
4.3.3.6. A Comprehensive Approach to Catalyst Management
- (1)
- strategies for extending catalyst life and reusability and planning for catalyst removal/rotation to coincide with power plant outages;
- (2)
- catalyst inspection and testing before and following regeneration with replacement of badly damaged catalyst which is unregenerable;
- (3)
- off-site regeneration using a series of robust washing and chemical treatments to remove channel blockages, deactivated catalyst metals, and poisons, followed by chemical treatments to restore active catalytic materials; and
- (4)
- gentle drying/calcination in air to high temperatures to produce catalytically active oxides.
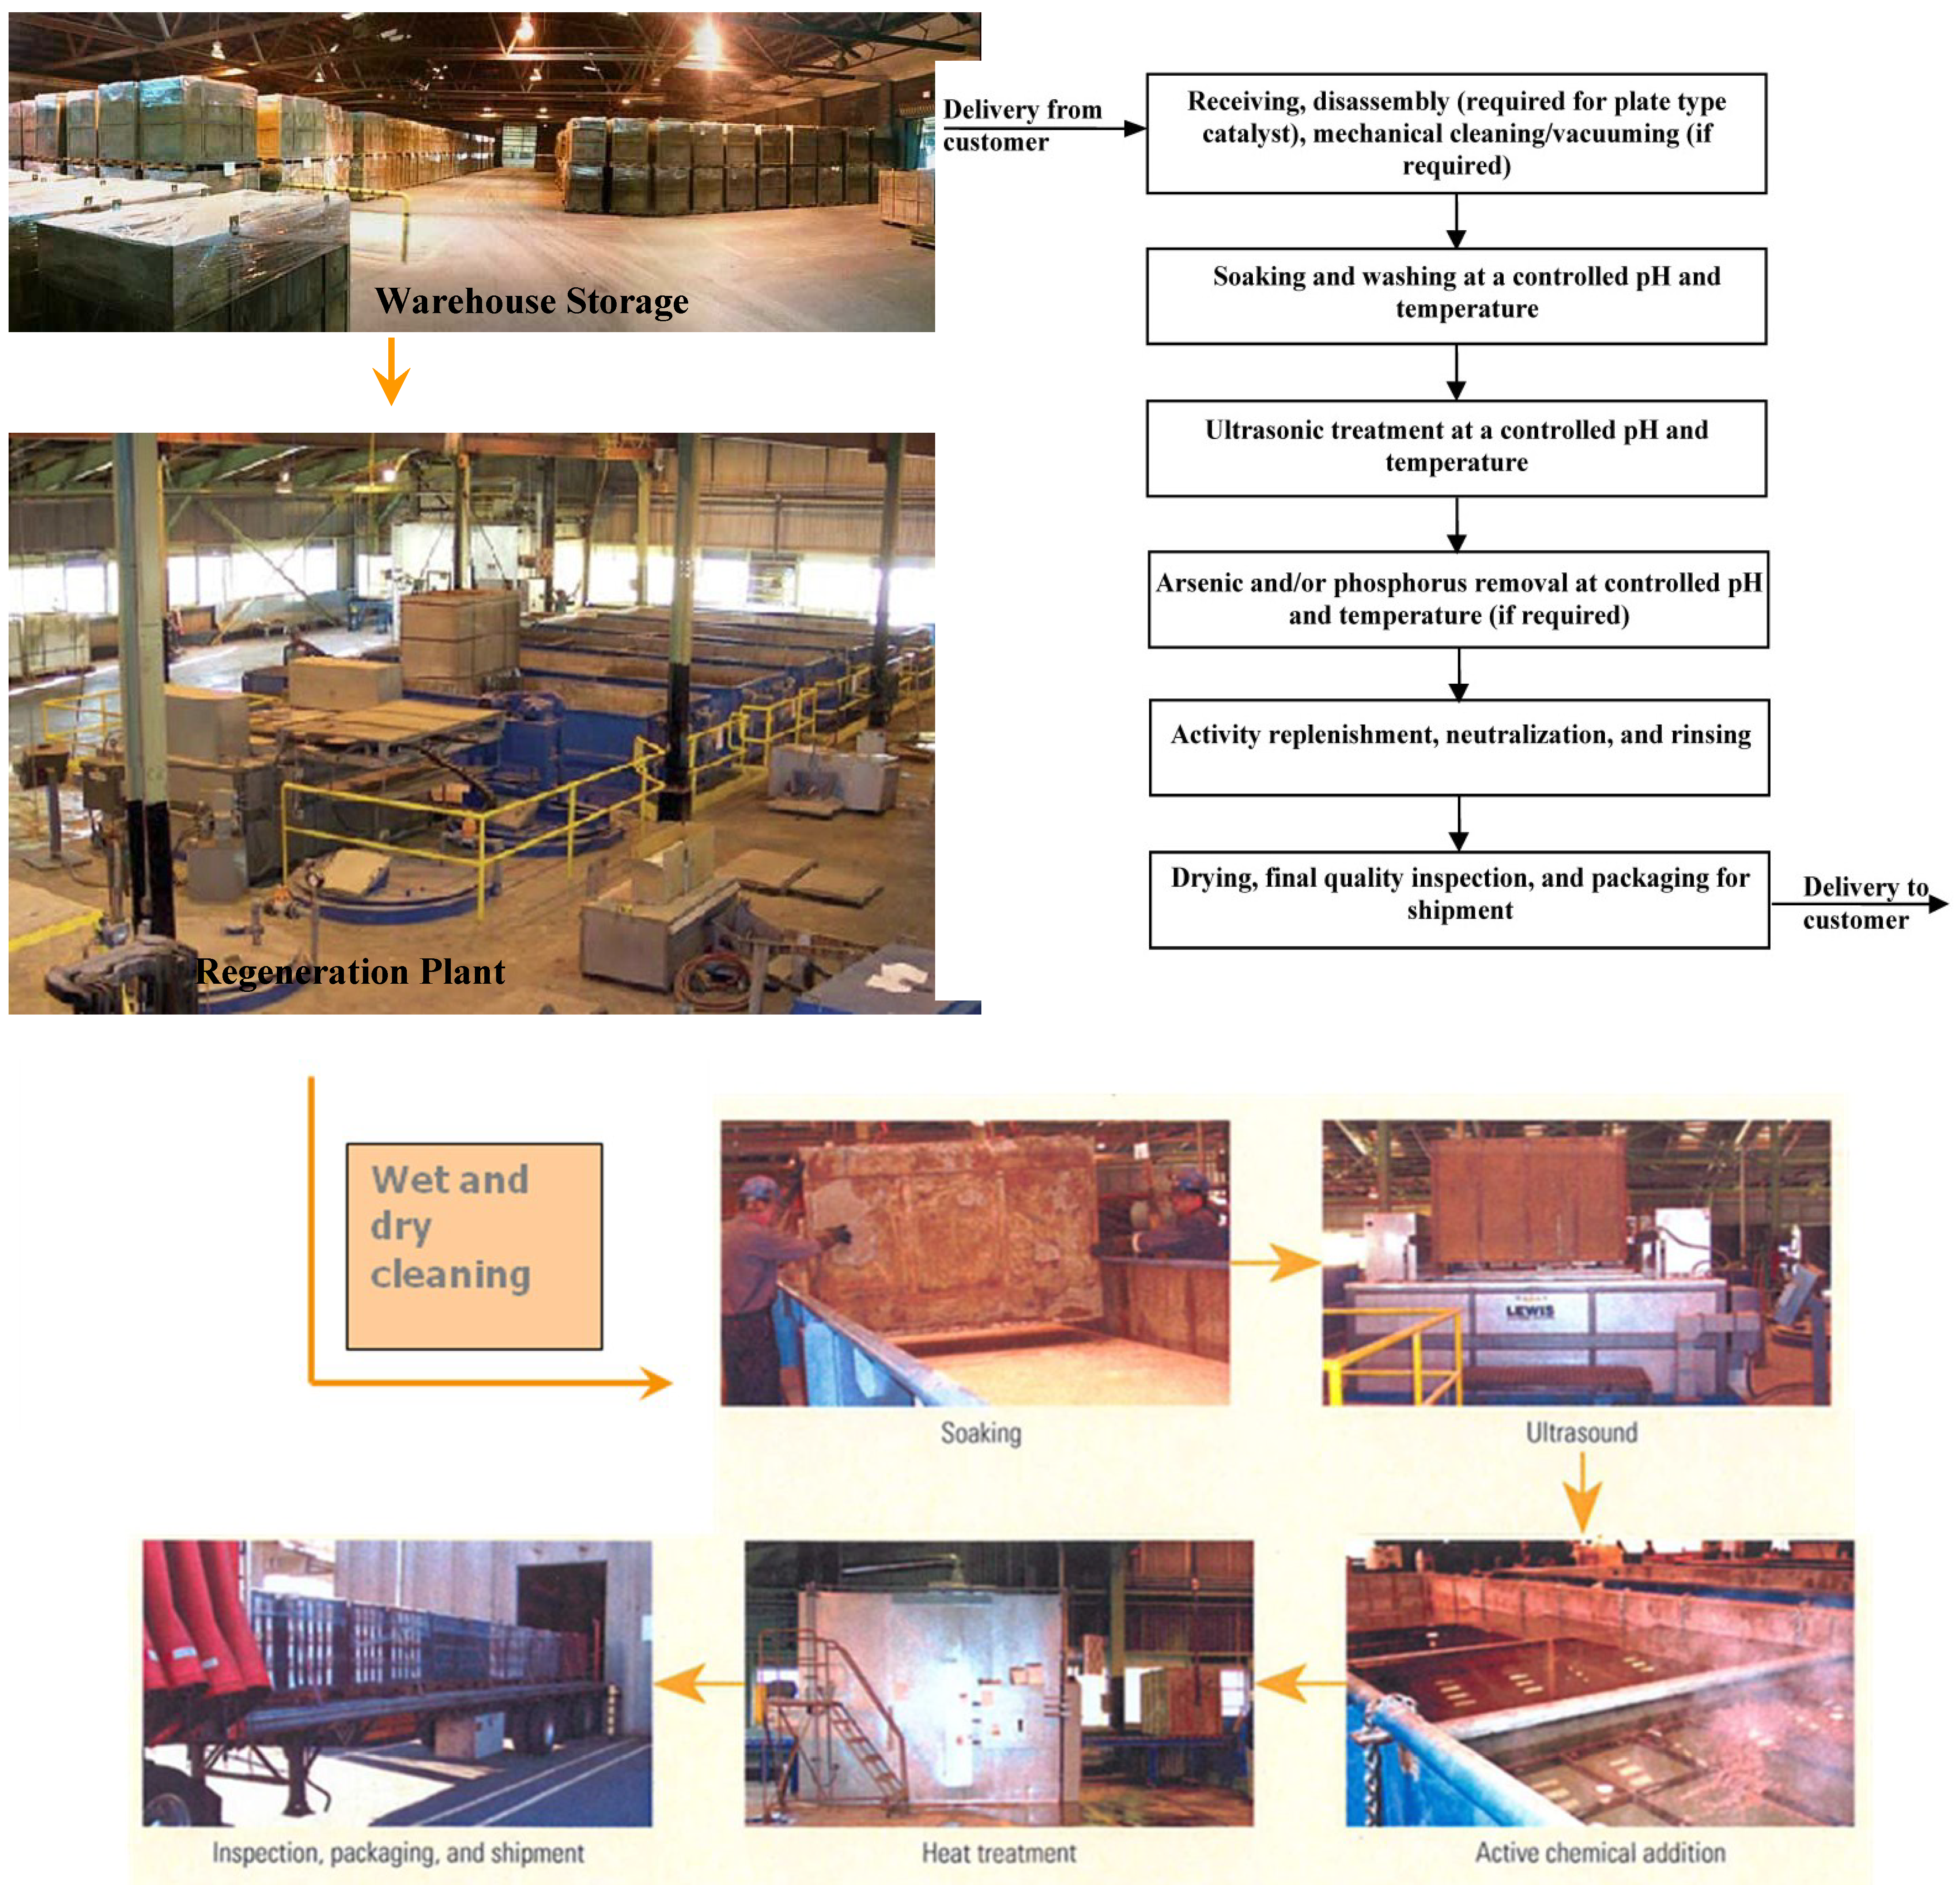
4.3.3.7. Common Regeneration Practices
- (1)
- pressurized wet and dry treatments to remove channel blockages and outer dust layers;
- (2)
- washing of catalyst units in tanks containing agitated water augmented with surfactants, dispersants, ion-exchange materials, emulsifiers, acid, base, and/or acoustic radiation to remove the outer CaSO4 coating, alkali metal salts deposited in the catalyst pores, and deactivated (e.g., As-poisoned) catalyst;
- (3)
- rinsing repeatedly in deionized water and repeating ultrasonic treatments between or in concert with chemical treatments, with a final rinse to finish removal of any catalyst or fouling residue;
- (4)
- reimpregnation of the clean support with salts of the active catalytic materials (V, Mo, and W); and
- (5)
- drying (calcining) at low heating rates to decompose the salts of the active catalytic materials to active metal oxides of V, Mo, and W.
4.3.3.8. Regeneration Process Profile: SCR-Tech Regeneration Process
| Catalyst Handling Step | New | Regenerated |
|---|---|---|
| Removal from SCR system | Comparable | Comparable |
| Transport out | Comparable | Comparable |
| Purchase price | $758,000–$975,000 | $455,000–$585,000 |
| Shipping | Comparable | Comparable |
| Installation | Comparable | Comparable |
| Net savings from regeneration | $303,000–$390,000 pls disposal cost | |
| Disposal cost | $20,000–$500,000 | 0 |
4.3.4. SCR Catalyst Case Study Summary Observations and Conclusions
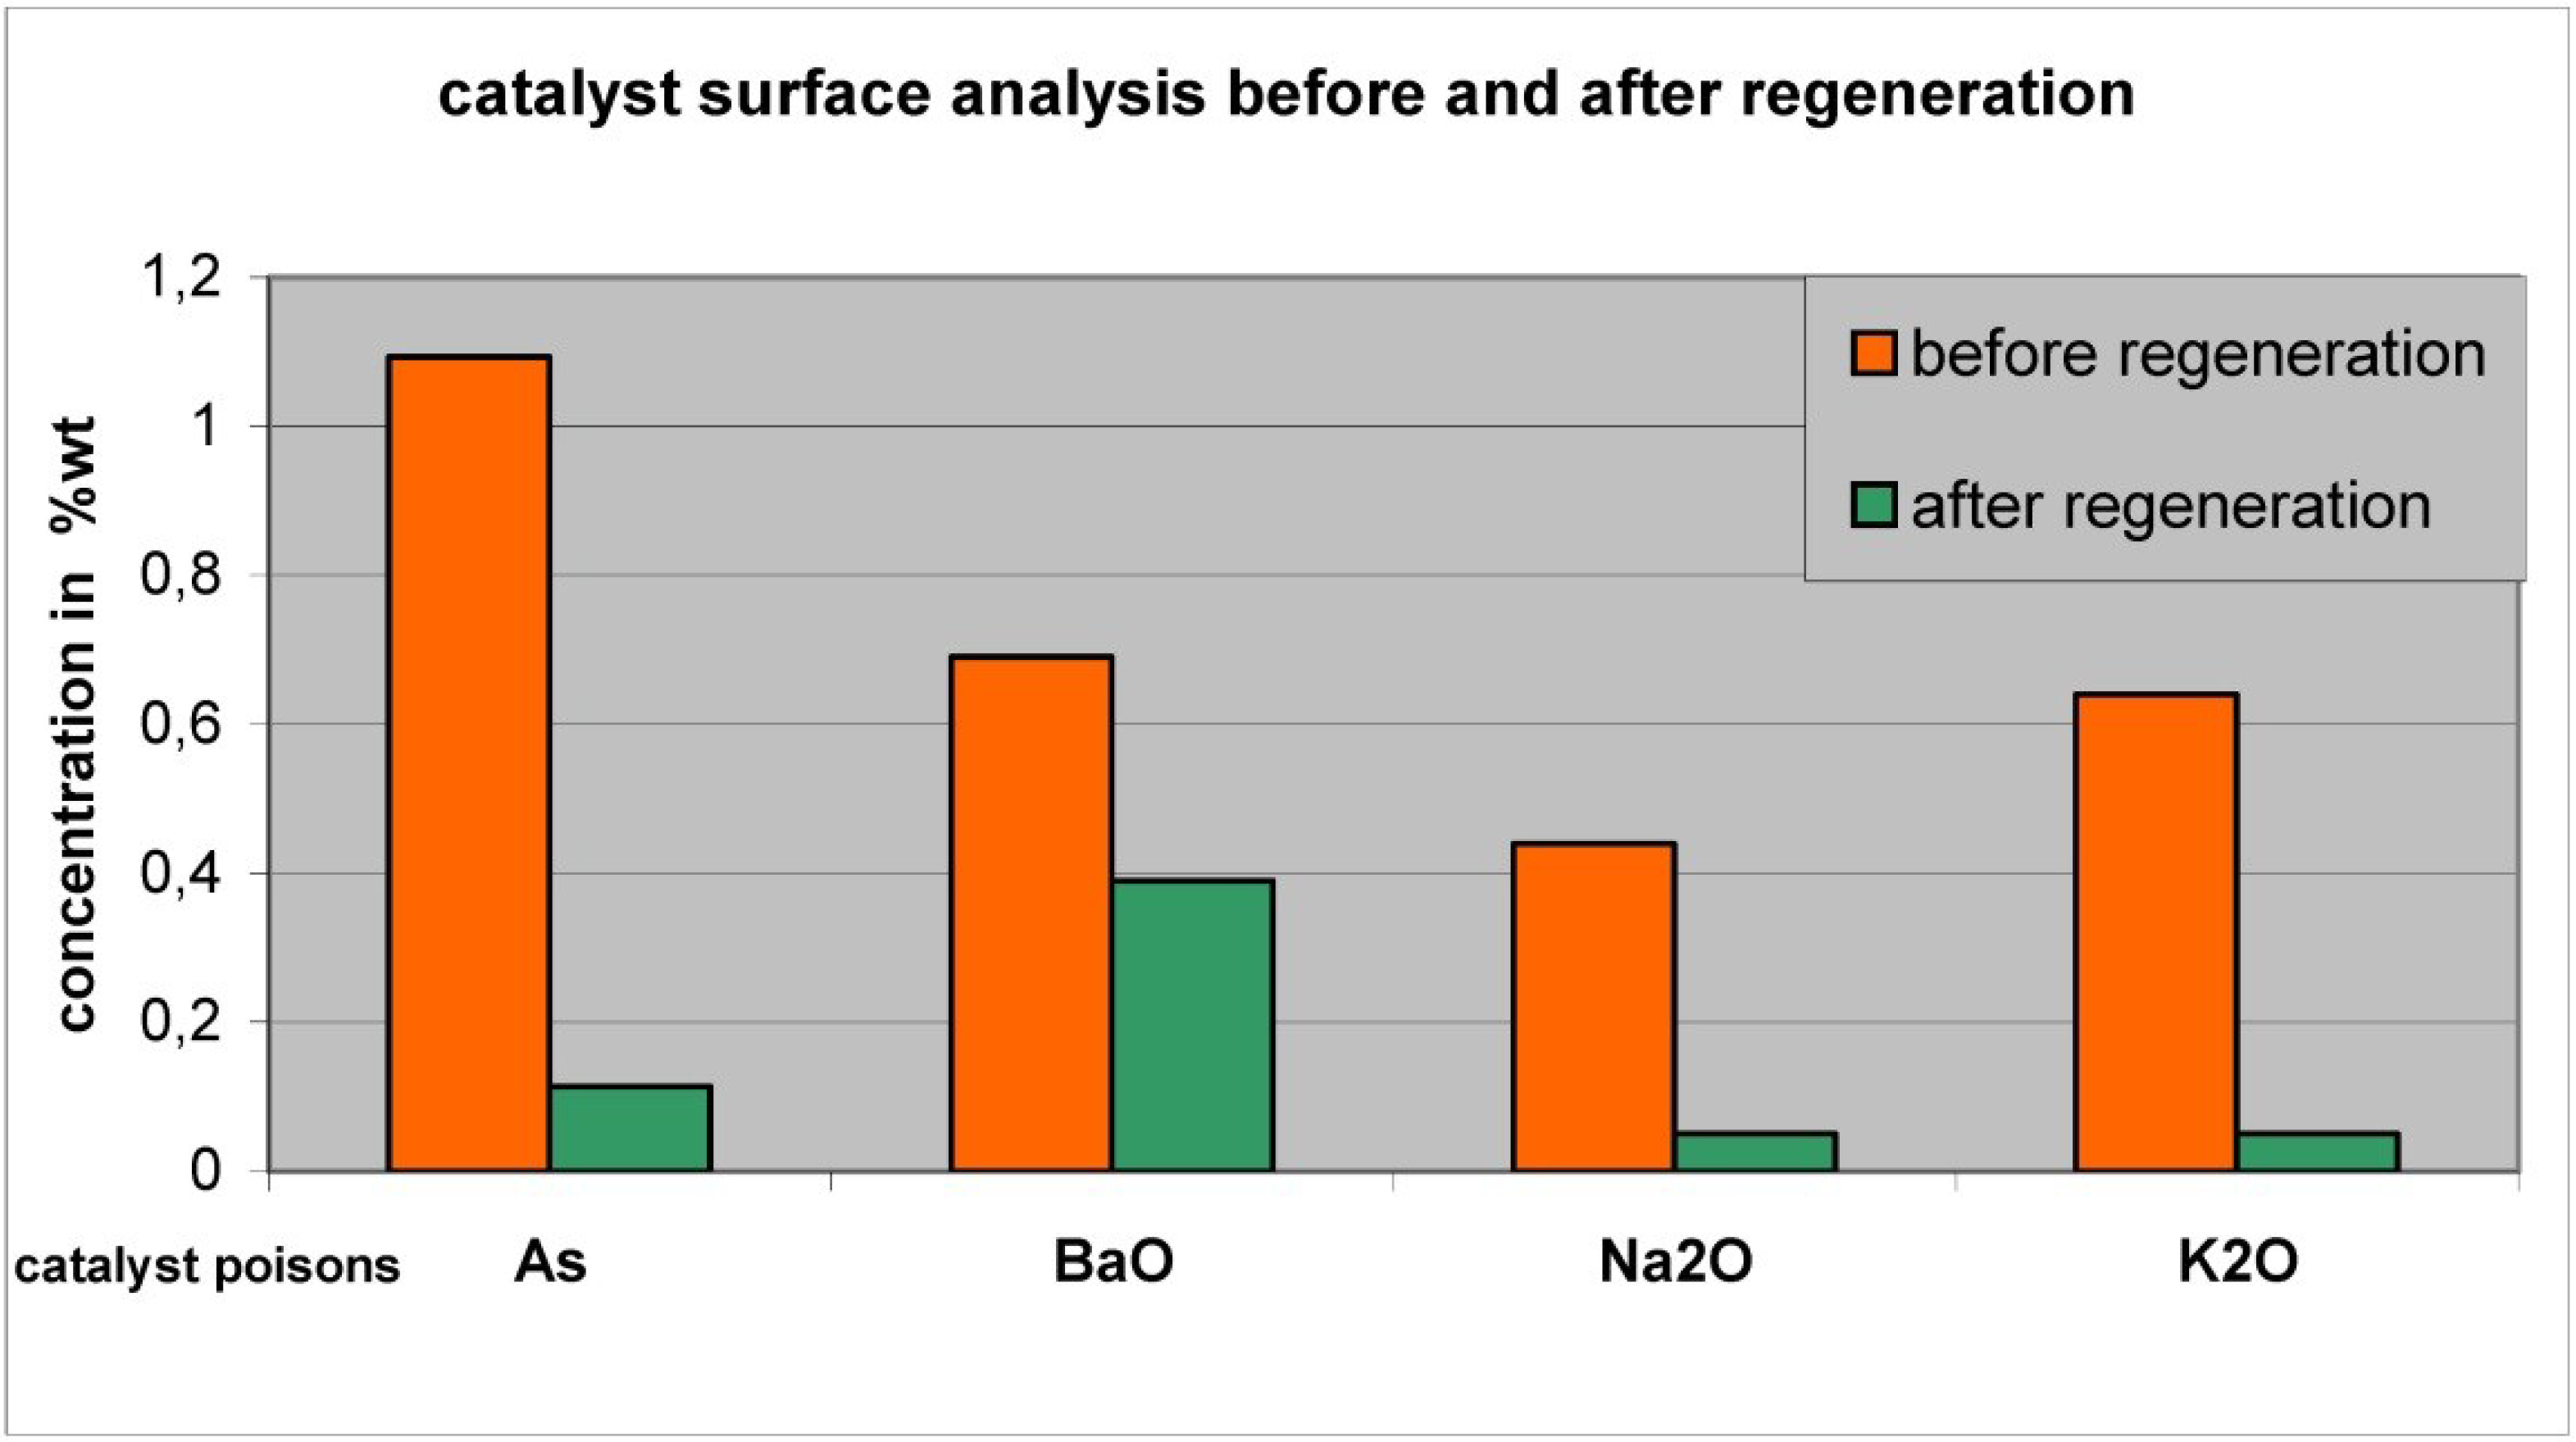
- Off-site regeneration processes are more sophisticated and demanding than on-site rejuvenation processes; the off-site regeneration processes provide significantly more efficient cleaning and reconstitution of the catalyst with full recovery of activity—sometimes greater than the fresh catalyst activity. Rejuvenation provides only partial (up to 85%) recovery of the original activity.
- The development of offsite processes for regeneration of SCR catalysts is relatively new, having occurred largely over the past 10–15 years. SCR-Tech was the first and until 2008 the only company to operate an off-site regeneration facility in the U.S.
- Because surface deposits are a primary deactivation mechanism, especially in HDU catalysts, extensive multi-step treatments are required, but rejuventation or regeneration appear to be a cost-effective method of catalyst management for SCR catalysts.
4.4. Redispersion of Sintered Catalysts
|

- (1)
- In cases involving a high degree of Pt sintering or poisoning, special regeneration procedures may be required. If large crystallites have been formed, several successive oxychlorinations are performed [256].
- (2)
- Introducing oxygen into reactors in parallel rather than in series results in a significant decrease in regeneration time [101].
- (3)
- Introduction of hydrocarbons present in the reactor recycle after regeneration is said to stabilize the catalyst; solvents such as ammonium acetate, dilute nitric acid containing lead nitrate, and EDTA and its diammonium salt are reported to dissolve out metal aggregates without leaching out the dispersed metal [101].
- (4)
- The procedures for redispersion of Pt/alumina are not necessarily applicable to Pt on other supports or to other metals. For example, Pt/silica is redispersed at lower temperature and higher Cl2 concentration (150–200 °C and 25% Cl2). Pd/alumina can be redispersed in pure O2 at 500 °C. While Pt–Re/alumina is readily redispersed by oxychlorination at 500 °C, Pt–Ir/alumina is not redispersed in the presence of O2, unless the catalyst is pretreated with HCl [266].
| Dispersing agent class | Dispersing agent | Metals/support | Patent No. | Ref. |
|---|---|---|---|---|
| Chlorine-Containing | ||||
| Cl2, Cl + halogen | Pt/zeolite | U.S. 4,645,751 | [338] | |
| Cl, H2O, O2 | Pt/zeolite | U.S. 4,657,874 | [339] | |
| HCl, Cl–O | Ir | U.S. 4,491,636 | [340] | |
| Cl, O2 | Pt–Ir, Ir | U.S. 4,467,045 | [341] | |
| HCl, Cl | Pt–Ir–Re, Pt–Ir/zeolites | U.S. 4,359,400 | [342] | |
| Cl, halogen | Ir, Pt–Ir/Al2O3 | U.S. 4,480,046 | [343] | |
| Cl–H2O | Pt–Ir–Se/Al2O3 | U.S. 4,492,767 | [344] | |
| HCl–O–He | Pt–Ir–Se/Al2O3 | U.S. 4,491,635 | [345] | |
| Cl, O2 | Pt/zeolite | U.S. 4,855,269 | [346] | |
| HCl, Cl, H2O, O | Pt/zeolite | U.S. 4,925,819 | [347] | |
| HCl, O | Ir, Pt–Ir/Al2O3 | U.S. 4,444,896 | [348] | |
| Cl, halogen | Ir, Pt–Ir/Al2O3 | U.S. 4,444,895 | [349] | |
| HCl | Ir, Pt–Ir/Al2O3 | U.S. 4,517,076 | [350] | |
| Oxygen | ||||
| O2 | Pt, Re/Al2O3 | U.S. 4,482,637 | [351] | |
| Oxygen/N2 | ||||
| O2, N2 | Cu/Cr, Mn, Ru, Pd, Zn, Si, Mg, Ca, Sr, Ba | U.S. 4,855,267 | [352] | |
| Other | ||||
| NO, NO + halogen | Pt, Pd/zeolite | Eu 0,306,170 | [353] | |
| Halogen | Ru, Os, Rh, Pd/Al2O3 | U.S. 4,891,346 | [354] | |
| Halide | Ir, Pt–Ir/Al2O3 | U.S. 4,447,551 | [355] | |
| Halide, halogen/H2O | Ir, Pt–Ir/Al2O3 | U.S. 4,472,514 | [356] | |
| Halogen | Ir, Pt–Ir/Al2O3 | U.S. 4,473,656 | [357] | |
| NO, NO + halogen, Cl | Group VIII metals/Al2O3, SiO2, zeolites | U.S. 4,952,543 | [358] | |
| H2-halides, O2 | Ir, Pt–Ir/Al2O3 | U.S. 4,444,897 | [359] | |
| Halogen, H2O | Ir, Pt–Ir/Al2O3 | U.S. 4,472,515 | [360] | |

4.4.1. Case Study: Cobalt based Fischer-Tropsch (FT) Catalyst Regeneration
5. Summary
- (1)
- The causes of deactivation are basically of three kinds: chemical, mechanical, and thermal. The five intrinsic mechanisms of catalyst decay, (a) poisoning, (b) fouling, (c) thermal degradation, (d) chemical degradation, and (e) mechanical failure, vary in their reversibility and rates of occurrence. Poisoning and thermal degradation are generally slow, irreversible processes, while fouling with coke and carbon is generally rapid and reversible by regeneration with O2 or H2.
- (2)
- Catalyst deactivation is more easily prevented than cured. Poisoning by impurities can be prevented through careful purification of reactants or mitigated to some extent by adding traps or “getters” as components of the catalyst. Carbon deposition and coking can be prevented by minimizing the formation of carbon or coke precursors through gasification, careful design of catalysts and process conditions, and by controlling reaction rate regimes, e.g., mass transfer regimes, to minimize effects of carbon and coke formation on activity. Sintering is best avoided by minimizing and controlling the temperature of reaction, although recent developments have focused on encapsulating metal crystallites to eliminate mobility, while still allowing access for reactants and products.
- (3)
- Catalyst regeneration is feasible in some circumstances, especially to recover activity loss due to rapid coking or longer term deactivation associated with loss of active metal dispersion. Typically, regeneration or rejuvenation strategies are dictated by process or economic necessity to obtain desired process run lengths. Life cycle operating strategies are important considerations when evaluating catalyst regeneration/rejuvenation versus replacement decisions. Rejuvenation treatments can extend the useful life of catalysts. Selective catalytic reduction catalysts provide an example of rejuvenation practiced in a commercial process.
Acknowledgments
Author Contributions
Conflicts of Interest
References
- Figueiredo, J.L. Carbon formation and gasification on nickel. In Progress in Catalyst Deactivation; (NATO Advanced Study Institute Series E, No. 54); Martinus Nijhoff Publishers: Boston, MA, USA, 1982; pp. 45–63. [Google Scholar]
- Hughes, R. Deactivation of Catalysts; Academic Press: London, UK, 1984. [Google Scholar]
- Oudar, J.; Wise, H. Deactivation and Poisoning of Catalysts; Marcel Dekker: New York, NY, USA, 1985. [Google Scholar]
- Butt, J.B.; Petersen, E.E. Activation, Deactivation, and Poisoning of Catalysts; Academic Press: San Diego, CA, USA, 1988. [Google Scholar]
- Denny, P.J.; Twigg, M.V. Factors determining the life of industrial heterogeneous catalysts. In Catalyst Deactivation 1980 (Studies in Surface Science and Catalysis); Delmon, B., Froment, G.F., Eds.; Elsevier: Amsterdam, The Nerthelands, 1980; Volume 6, pp. 577–599. [Google Scholar]
- Bartholomew, C.H. Catalyst Deactivation. Chem. Eng. 1984, 91, 96–112. [Google Scholar]
- Butt, J.B. Catalyst deactivation and regeneration. In Catalysis—Science and Technology; Anderson, J.R., Boudart, M., Eds.; Springer-Verlag: New York, NY, USA, 1984; Volume 6, pp. 1–63. [Google Scholar]
- Bartholomew, C.H.; Farrauto, R.J. Fundamentals of Industrial Catalytic Processes, 2nd ed.; Wiley-Interscience: Hoboken, NJ, USA, 2006. [Google Scholar]
- Delmon, B.; Froment, G.F. Catalyst Deactivation 1980 (Studies in Surface Science and Catalysis); Elsevier: Amsterdam, The Nerthelands, 1980; Volume 6. [Google Scholar]
- Delmon, B.; Froment, G.F. Catalyst Deactivation 1987 (Studies in Surface Science and Catalysis); Elsevier: Amsterdam, The Nerthelands, 1987; Volume 34. [Google Scholar]
- Bartholomew, C.H.; Butt, J.B. Catalyst Deactivation 1991 (Studies in Surface Science and Catalysis); Elsevier: Amsterdam, The Nerthelands, 1991; Volume 68. [Google Scholar]
- Delmon, B.; Froment, G.F. Catalyst Deactivation 1994 (Studies in Surface Science and Catalysis); Elsevier: Amsterdam, The Nerthelands, 1994; Volume 88. [Google Scholar]
- Bartholomew, C.H.; Fuentes, G.A. Catalyst Deactivation 1997 (Studies in Surface Science and Catalysis); Elsevier: Amsterdam, The Nethelands, 1997; Volume 111. [Google Scholar]
- Delmon, B.; Froment, G.F. Catalyst Deactivation 1999 (Studies in Surface Science and Catalysis); Elsevier: Amsterdam, The Nethelands, 1999; Volume 126. [Google Scholar]
- Moulijn, J.A. Catalyst Deactivation. Appl. Catal. A 2001, 212, 1–255. [Google Scholar] [CrossRef]
- Maxted, E.B. The poisoning of metallic catalysts. Adv. Catal. 1951, 3, 129–177. [Google Scholar]
- Hegedus, L.L.; McCabe, R.W. Catalyst poisoning. In Catalyst Deactivation 1980 (Studies in Surface Science and Catalysis); Delmon, B., Froment, G.F., Eds.; Elsevier: Amsterdam, The Nethelands, 1980; Volume 6, pp. 471–505. [Google Scholar]
- Hegedus, L.L.; McCabe, R.W. Catalyst Poisoning; Marcel Dekker: New York, NY, USA, 1984. [Google Scholar]
- Butt, J.B. Catalyst poisoning and chemical process dynamics. In Progress in Catalyst Deactivation (NATO Advanced Study Institute Series E, No. 54); Figueiredo, J.L., Ed.; Martinus Nijhoff Publishers: Boston, MA, USA, 1982; pp. 153–208. [Google Scholar]
- Barbier, J. Effect of poisons on the activity and selectivity of metallic catalysts. In Deactivation and Poisoning of Catalysts; Oudar, J., Wise, H., Eds.; Marcel Dekker: New York, NY, USA, 1985; pp. 109–150. [Google Scholar]
- Bartholomew, C.H. Mechanisms of nickel catalyst poisoning. In Catalyst Deactivation 1987 (Studies in Surface Science and Catalysis); Delmon, B., Froment, G.F., Eds.; Elsevier: Amsterdam, The Nethelands, 1987; Volume 34, pp. 81–104. [Google Scholar]
- Rostrup-Nielsen, J.R. Promotion by poisoning. In Catalyst Deactivation 1991 (Studies in Surface Science and Catalysis); Bartholomew, C.H., Butt, J.B., Eds.; Elsevier: Amsterdam, The Nethelands, 1991; Volume 68, pp. 85–101. [Google Scholar]
- Inga, J.; Kennedy, P.; Leviness, S. A1 Fischer-tropsch process in the presence of nitrogen contaminants. WIPO Patent WO 2005/071044, 4 August 2005. [Google Scholar]
- Völiter, V.J.; Hermann, M. Katalytische Wirksamkeit van reinem und von CO-vergiftetem Platin bei der p-H2-Umwandlung. Z. Anorg. Allg. Chem. 1974, 405, 315. [Google Scholar] [CrossRef]
- Baron, K. Carbon monoxide oxidation on platinum-lead films. Thin Solid Films 1978, 55, 449–462. [Google Scholar] [CrossRef]
- Clay, R.D.; Petersen, E.E. Catalytic activity of an evaporated platinum film progressively poisoned with arsine. J. Catal. 1970, 16, 32–43. [Google Scholar]
- Madon, R.J.; Seaw, H. Effect of Sulfur on the Fischer-Tropsch Synthesis. Catal. Rev.—Sci. Eng. 1977, 15, 69–106. [Google Scholar]
- Bartholomew, C.H.; Agrawal, P.K.; Katzer, J.R. Sulfur poisoning of metals. Adv. Catal. 1982, 31, 135–242. [Google Scholar]
- Rostrup-Nielsen, J.R. Sulfur Poisoning. In Progress in Catalyst Deactivation (NATO Advanced Study Institute Series E, No. 54); Figueiredo, J.L., Ed.; Martinus Nijhoff Publishers: Boston, MA, USA, 1982; pp. 209–227. [Google Scholar]
- Wise, H.; McCarty, J.; Oudar, J. Sulfur and carbon interactions with metal surfaces. In Deactivation and Poisoning of Catalysts; Oudar, J., Wise, H., Eds.; Marcel Dekker: New York, NY, USA, 1985; pp. 1–50. [Google Scholar]
- Rostrup-Nielsen, J.R.; Nielsen, P.E.H. Catalyst deactivation in synthesis gas production, and important syntheses. In Deactivation and Poisoning of Catalysts; Oudar, J., Wise, H., Eds.; Marcel Dekker: New York, NY, USA, 1985; pp. 259–323. [Google Scholar]
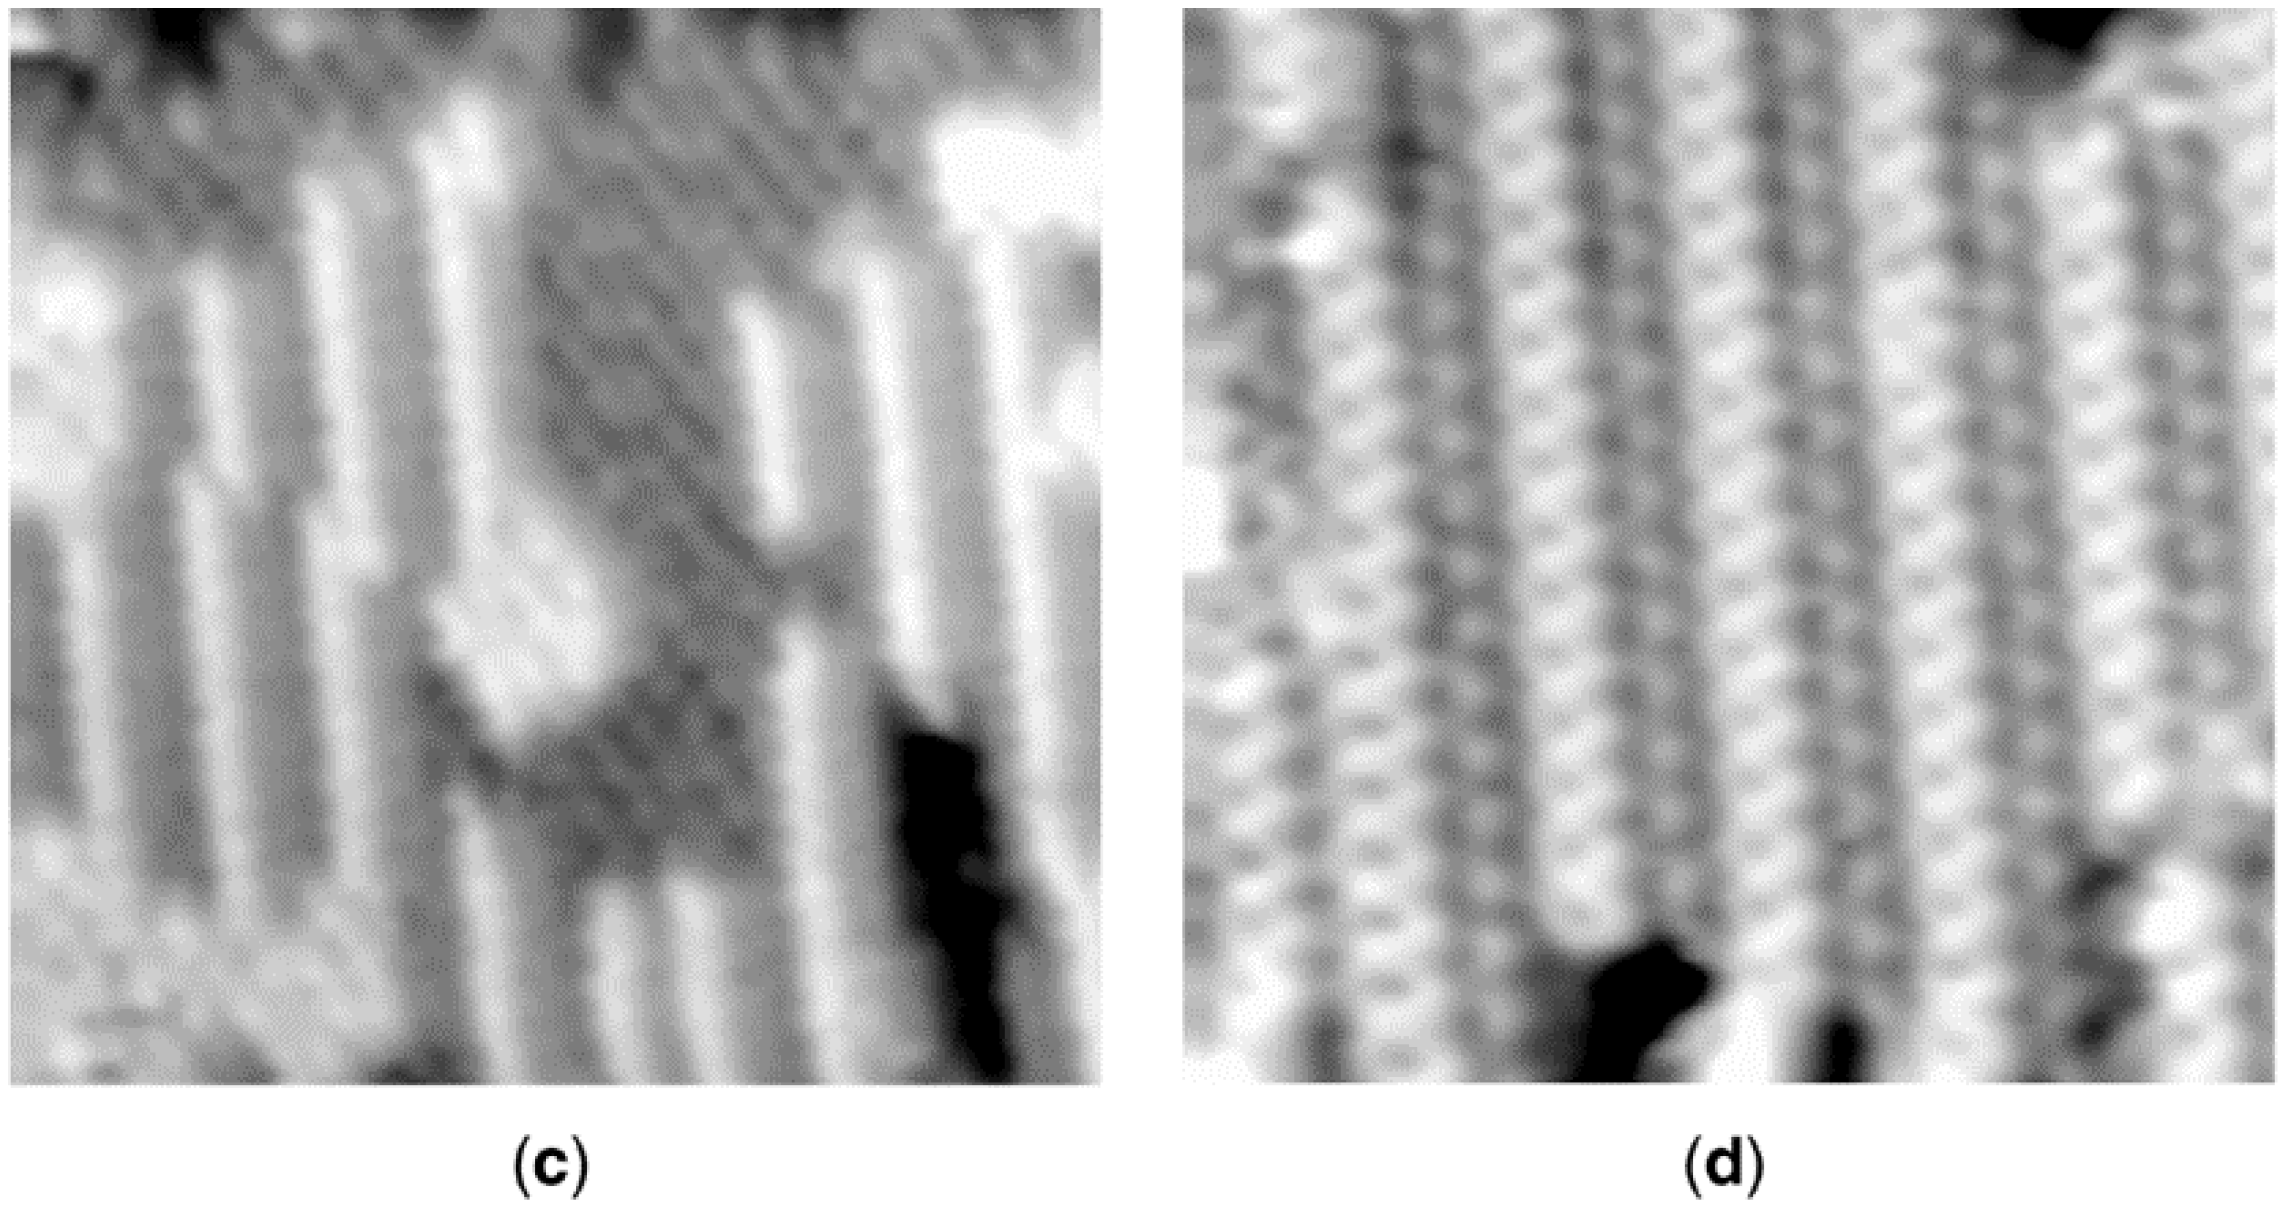
- Grossmann, A.; Erley, W.; Ibach, H. Adsorbate-induced surface stress and surface reconstruction: oxygen, sulfur and carbon on Ni(111). Surf. Sci. 1995, 337, 183–189. [Google Scholar]
- Ruan, L.; Stensgaard, I.; Besenbacher, F.; Lægsgaard, E. Observation of a missing-row structure on an fcc (111) surface: The (5 √3 ×2)S phase on Ni(111) studied by scanning tunneling microscopy. Phys. Rev. Lett. 1993, 71, 2963–2966. [Google Scholar]
- Kitajima, Y.; Yokoyama, T.; Ohta, T.; Funabashi, M.; Kosugi, N.; Kuroda, H. Surface EXAFS and XANES studies of (5v3× 2)S/Ni(111). Surf. Sci. 1989, 214, L261–L269. [Google Scholar] [CrossRef]
- Perdereau, M.; Oudar, J. Structure, mécanisme de formation et stabilité de la couche d'adsorption du soufre sur le nickel. Surf. Sci. 1970, 20, 80–98. [Google Scholar]
- Oudar, J. Sulfur adsorption and poisoning of metallic catalysts. Catal. Rev.—Sci. Eng. 1980, 22, 171–195. [Google Scholar]
- McCarroll, J.J.; Edmonds, T.; Pitkethly, R.C. Interpretation of a complex low energy electron diffraction pattern: Carbonaceous and sulphur-containing structures on Ni(111). Nature 1969, 223, 1260–1262. [Google Scholar]
- Edmonds, T.; McCarroll, J.J.; Pitkethly, R.C. Surface structures formed during the interaction of sulphur compounds with the (111) face of nickel. J. Vac. Sci. Technol. 1971, 8, 68–74. [Google Scholar]
- Bartholomew, C.H. Mechanisms of catalyst deactivation. Appl. Catal. A 2001, 212, 17–60. [Google Scholar]
- Ruan, L.; Besenbacher, F.; Stensgaard, I.; Lægsgaard, E. Atom-resolved studies of the reaction between H2S and O on Ni(110). Phys. Rev. Lett. 1992, 69, 3523–3526. [Google Scholar]
- Hepola, J.; McCarty, J.; Krishnan, G.; Wong, V. Elucidation of behavior of sulfur on nickel-based hot gas cleaning catalysts. Appl. Catal. B 1999, 20, 191–203. [Google Scholar]
- Erley, W.; Wagner, H. Sulfur poisoning of carbon monoxide adsorption on Ni(111). J. Catal. 1978, 53, 287–294. [Google Scholar]
- Rendulic, K.D.; Winkler, A. The initial sticking coefficient of hydrogen on sulfur- and oxygen-covered polycrystalline nickel surfaces. Surf. Sci. 1978, 74, 318–320. [Google Scholar]
- Goodman, D.W.; Kiskinova, M. Chemisorption and reactivity studies of H2 and CO on sulfided Ni(100). Surf. Sci. 1981, 105, L265–L270. [Google Scholar]
- Kiskinova, M.; Goodman, D.W. Modification of chemisorption properties by electronegative adatoms: H2 and CO on chlorided, sulfided, and phosphided Ni(100). Surf. Sci. 1981, 108, 64–76. [Google Scholar]
- Johnson, S.; Madix, R.S. Desorption of hydrogen and carbon monoxide from Ni(100), Ni(100)p(2 × 2)S, and Ni(100)c(2 × 2)S surfaces. Surf. Sci. 1981, 108, 77–98. [Google Scholar]
- Madix, R.J.; Thornberg, M.; Lee, S.B. CO-sulfur interaction on Ni(110); evidence for local interactions, not long range electronic effects. Surf. Sci. 1983, 133, L447–L451. [Google Scholar]
- Hardegree, E.L.; Ho, P.; White, J.M. Sulfur adsorption on Ni(100) and its effect on CO chemisorption: I. TDS, AES and work function results. Surf. Sci. 1986, 165, 488–506. [Google Scholar]
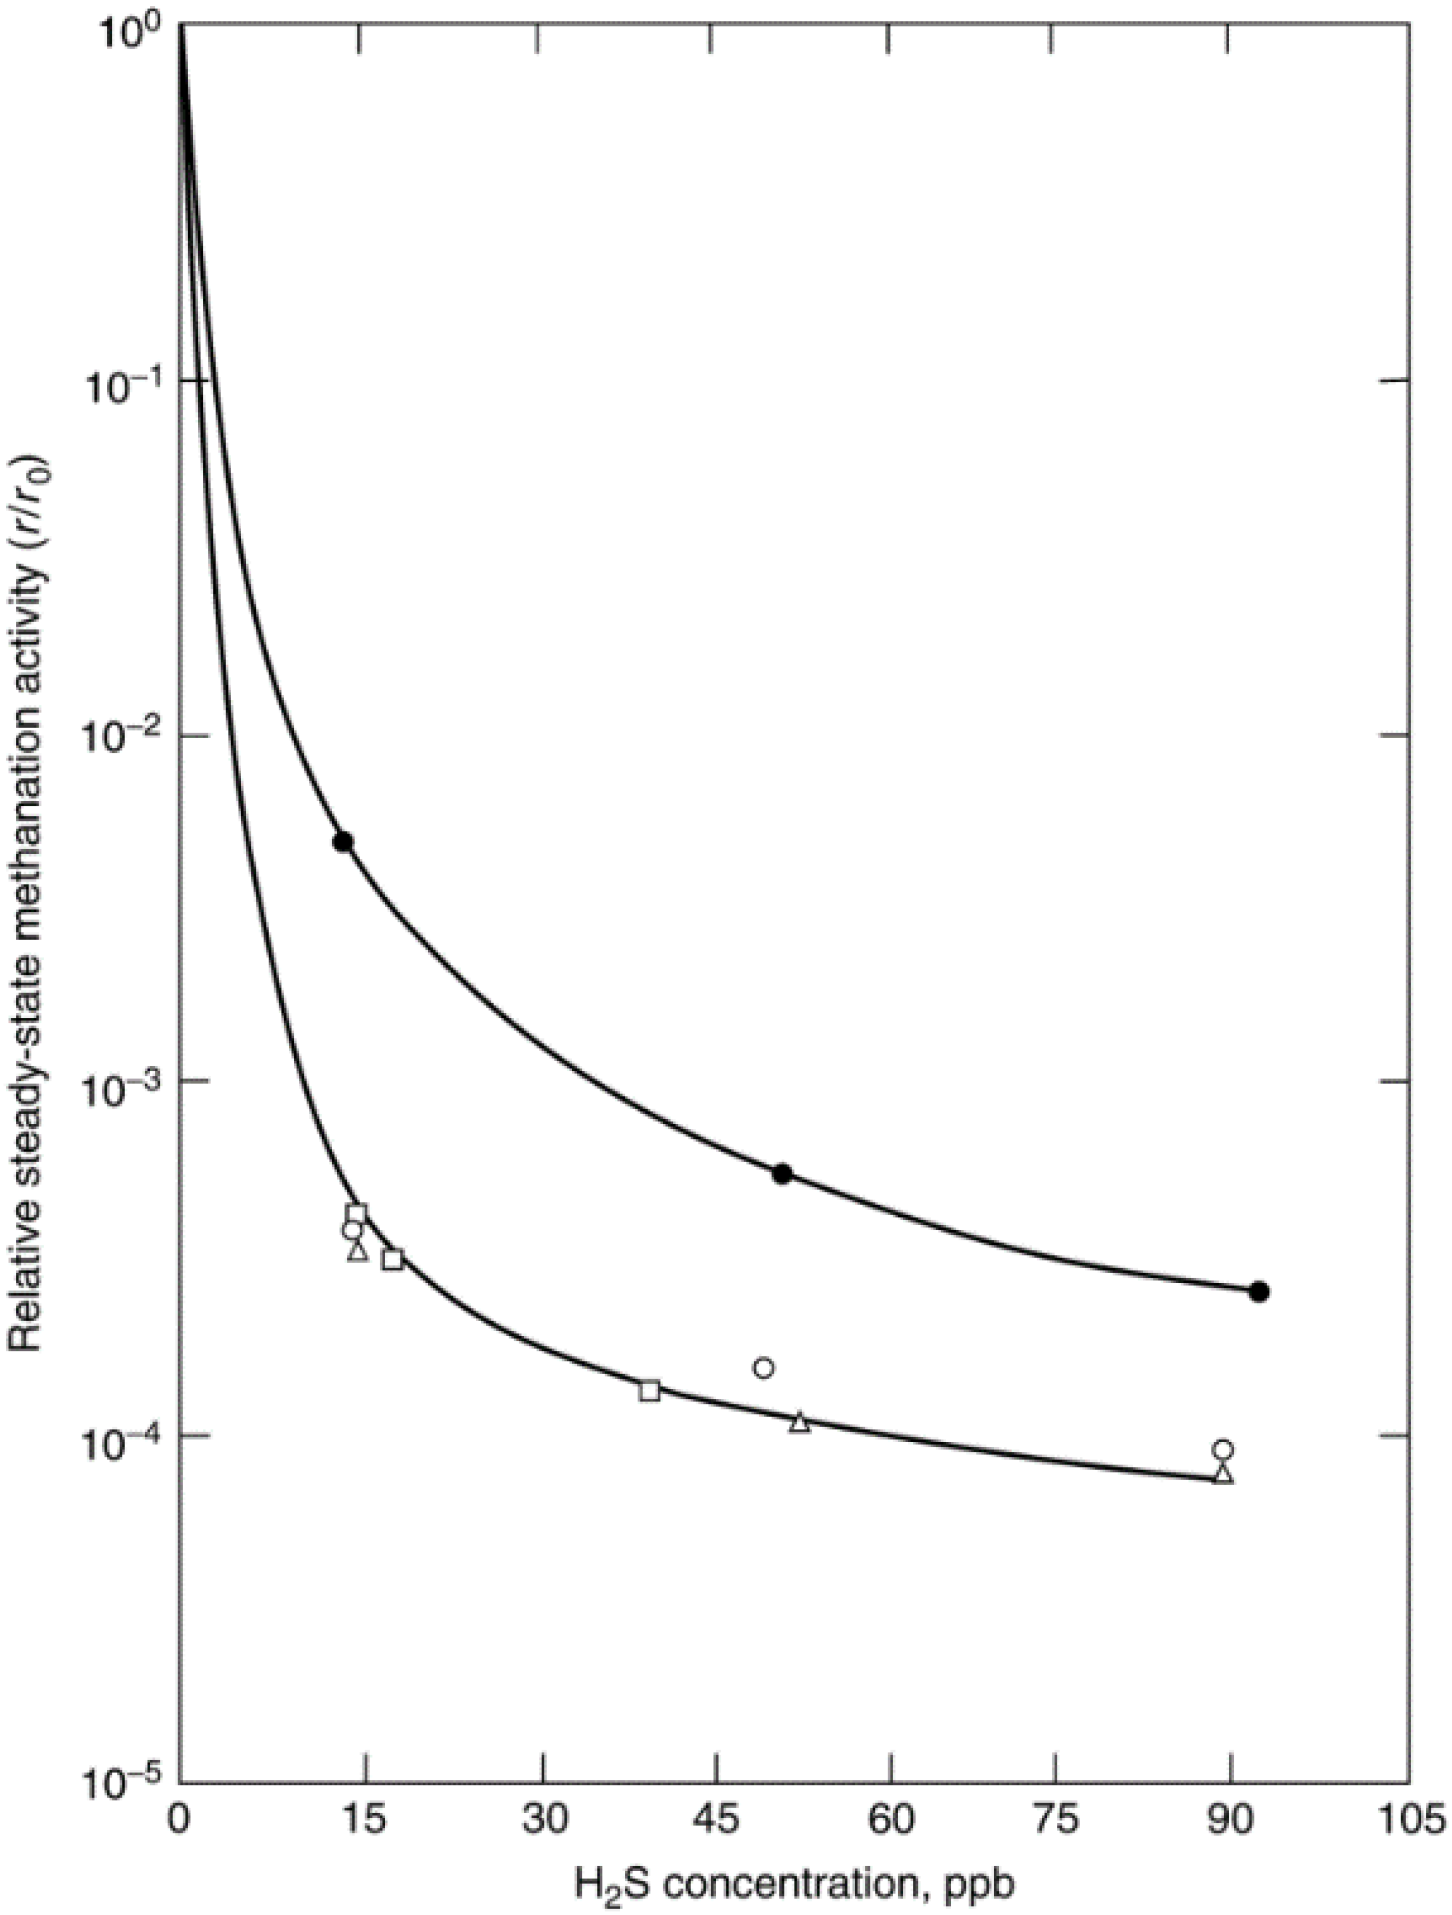
- Erekson, E.J.; Bartholomew, C.H. Sulfur poisoning of nickel methanation catalysts: II. Effects of H2S concentration, CO and H2O partial pressures and temperature on reactivation rates. Appl. Catal. 1983, 5, 323–336. [Google Scholar]
- Jacobs, G.; Ghadiali, F.; Pisanu, A.; Padro, C.L.; Borgna, A.; Alvarez, W.E.; Resasco, D.E. Increased Sulfur Tolerance of Pt/KL Catalysts Prepared by Vapor-Phase Impregnation and Containing a Tm Promoter. J. Catal. 2000, 191, 116–127. [Google Scholar]
- Jongpatiwut, S.; Sackamduang, P.; Rirksomboon, T.; Osuwan, S.; Alvarez, W.E.; Resasco, D.E. Sulfur- and water-tolerance of Pt/KL aromatization catalysts promoted with Ce and Yb. Appl. Catal. A 2002, 230, 177–193. [Google Scholar]
- Jacobs, G.; Ghadiali, F.; Pisanu, A.; Borgna, A.; Alvarez, W.E.; Resasco, D.E. Characterization of the morphology of Pt clusters incorporated in a KL zeolite by vapor phase and incipient wetness impregnation. Influence of Pt particle morphology on aromatization activity and deactivation. Appl. Catal. A 1999, 188, 79–98. [Google Scholar]
- McVicker, G.B.; Kao, J.L.; Ziemiak, T.J.J.; Gates, W.E.; Robbins, J.L.; Treacy, M.M.J.; Rice, S.B.; Vanderspurt, T.H.; Cross, V.R.; Ghosh, A.K. Effect of Sulfur on the Performance and on the Particle Size and Location of Platinum in Pt/KL Hexane Aromatization Catalysts. J. Catal. 1993, 139, 48–61. [Google Scholar]
- Farbenindustrie, I.G. Improvements in the Manufacture and Production of Unsaturated Hydrocarbons of Low Boiling Point. British Patent 322,284, 5 December 1929. [Google Scholar]
- Kritzinger, J.A. The role of sulfur in commercial iron-based Fischer–Tropsch catalysis with focus on C2-product selectivity and yield. Catal. Today 2002, 71, 307–318. [Google Scholar]
- Sparks, D.E.; Jacobs, G.; Gnanamani, M.K.; Pendyala, V.R.R.; Ma, W.; Kang, J.; Shafer, W.D.; Keogh, R.A.; Graham, U.M.; Gao, P.; et al. Poisoning of cobalt catalyst used for Fischer–Tropsch synthesis. Catal. Today 2013, 215, 67–72. [Google Scholar]
- Rostrup-Nielsen, J.R.; Trimm, D.L. Mechanisms of carbon formation on nickel-containing catalysts. J. Catal. 1977, 48, 155–165. [Google Scholar]
- Trimm, D.L. The Formation and Removal of Coke from Nickel Catalyst. Catal. Rev.—Sci. Eng. 1977, 16, 155–189. [Google Scholar]
- Trimm, D.L. Catalyst design for reduced coking (review). Appl. Catal. 1983, 5, 263–290. [Google Scholar]
- Bartholomew, C.H. Carbon deposition in steam reforming and methanation. Catal. Rev.—Sci. Eng. 1982, 24, 67–112. [Google Scholar]
- Albright, L.F.; Baker, R.T.K. Coke Formation on Metal Surfaces (ACS Symposium Series 202); American Chemical Society: Washington, DC, USA, 1982. [Google Scholar]
- Menon, P.G. Coke on catalysts—harmful, harmless, invisible and beneficial types. J. Mol. Catal. 1990, 59, 207–220. [Google Scholar]
- Rostrup-Nielsen, J.R. Conversion of hydrocarbons and alcohols for fuel cells. Phys. Chem. Chem. Phys. 2001, 3, 283–288. [Google Scholar]
- Trane-Restrup, R.; Resasco, D.E.; Jensen, A.D. Steam reforming of light oxygenates. Catal. Sci. Technol. 2013, 3, 3292–3302. [Google Scholar]
- De Lima, S.M.; da Silva, A.M.; da Costa, L.O.O.; Assaf, J.M.; Jacobs, G.; Davis, B.H.; Mattos, L.V.; Noronha, F.B. Evaluation of the performance of Ni/La2O3 catalyst prepared from LaNiO3 perovskite-type oxides for the production of hydrogen through steam reforming and oxidative steam reforming of ethanol. Appl. Catal. A 2010, 377, 181–190. [Google Scholar]
- Deken, J.D.; Menon, P.G.; Froment, G.F.; Haemers, G. On the nature of carbon in Niα-Al2O3 catalyst deactivated by the methane-steam reforming reaction. J. Catal. 1981, 70, 225–229. [Google Scholar]
- Durer, W.G.; Craig, J.H., Jr.; Lozano, J. Surface carbon and its effects on hydrogen adsorption on Rh(100). Appl. Surf. Sci. 1990, 45, 275–277. [Google Scholar]
- Moeller, A.D.; Bartholomew, C.H. Deactivation by carbon of nickel and nickel-molybdenum methanation catalysts. Prepr.—Am. Chem. Soc., Div. Fuel Chem. 1980, 25, 54–70. [Google Scholar]
- Marschall, K.-J.; Mleczko, L. Short-contact-time reactor for catalytic partial oxidation of methane. Ind. Eng. Chem. Res. 1999, 38, 1813–1821. [Google Scholar]
- Rostrup-Nielsen, J.R. Catalytic steam reforming. In Catalysis—Science and Technology; Anderson, J.R., Boudart, M., Eds.; Springer-Verlag: New York, NY, USA, 1984; Volume 5, pp. 1–117. [Google Scholar]
- Besenbacher, F.; Chorkendorff, I.; Clausen, B.S.; Hammer, B.; Molenbroek, A.M.; Nørskov, J.K.; Stensgaard, I. Design of a surface alloy catalyst for steam reforming. Science 1998, 279, 1913–1915. [Google Scholar]
- Nemes, T.; Chambers, A.; Baker, R.T.K. Characteristics of carbon filament formation from the interaction of Cobalt−Tin particles with ethylene. J. Phys. Chem. B 1998, 102, 6323–6330. [Google Scholar]
- Bartholomew, C.H.; Strasburg, M.V.; Hsieh, H. Effects of support on carbon formation and gasification on nickel during carbon monoxide hydrogenation. Appl. Catal. 1988, 36, 147–162. [Google Scholar]
- Vance, C.K.; Bartholomew, C.H. Hydrogenation of carbon dioxide on group viii metals: III, Effects of support on activity/selectivity and adsorption properties of nickel. Appl. Catal. 1983, 7, 169–177. [Google Scholar]
- Baker, R.T.K.; Chludzinski, J.J., Jr. Filamentous carbon growth on nickel-iron surfaces: The effect of various oxide additives. J. Catal. 1980, 64, 464–468. [Google Scholar]
- Brown, D.E.; Clark, J.T.K.; Foster, A.I.; McCarroll, J.J.; Sims, M.L. Inhibition of coke formation in ethylene steam cracking. In Coke Formation on Metal Surfaces (ACS Symposium Series 202); Albright, L.F., Baker, R.T.K., Eds.; American Chemical Society: Washington, DC, USA, 1982; pp. 23–43. [Google Scholar]
- Bitter, J.H.; Seshan, K.; Lercher, J.A. Deactivation and coke accumulation during CO2/CH4 reforming over Pt catalysts. J. Catal. 1999, 183, 336–343. [Google Scholar]
- Rostrup-Nielsen, J.R. Coking on nickel catalysts for steam reforming of hydrocarbons. J. Catal. 1974, 33, 184–201. [Google Scholar]
- Saib, A.M.; Moodley, D.J.; Ciobica, I.M.; Hauman, M.M.; Sigwebela, B.H.; Weststrate, C.J.; Niemanstsverdriet, J.W.; van de Loosdrecht, J. Fundamental understanding of deactivation and regeneration of cobalt Fischer–Tropsch synthesis catalysts. Catal. Today 2010, 154, 271–282. [Google Scholar]
- Tsakoumis, N.E.; Rønning, M.; Borg, O.; Rytter, E.; Holmen, A. Deactivation of cobalt based Fischer–Tropsch catalysts: A review. Catal. Today 2010, 154, 162–182. [Google Scholar]
- Gates, B.C.; Katzer, J.R.; Schuit, G.C.A. Chemistry of Catalytic Processes; McGraw-Hill: New York, NY, USA, 1979. [Google Scholar]
- Naccache, C. Deactivation of acid catalysts. In Deactivation and Poisoning of Catalysts; Oudar, J., Wise, H., Eds.; Marcel Dekker: New York, NY, USA, 1985; pp. 185–203. [Google Scholar]
- Appleby, W.G.; Gibson, J.W.; Good, G.M. Coke Formation in Catalytic Cracking. Ind. Eng. Chem. Process Des. Dev. 1962, 1, 102–110. [Google Scholar] [CrossRef]
- Beuther, H.; Larson, O.H.; Perrotta, A.J. The mechanism of coke formation on catalysts. In Catalyst Deactivation 1980 (Studies in Surface Science and Catalysis); Delmon, B., Froment, G.F., Eds.; Elsevier: Amsterdam, The Nerthelands, 1980; Volume 6, pp. 271–282. [Google Scholar]
- Gayubo, A.G.; Arandes, J.M.; Aguayo, A.T.; Olazar, M.; Bilbao, J. Deactivation and acidity deterioration of a silica/alumina catalyst in the isomerization of cis-butene. Ind. Eng. Chem. Res. 1993, 32, 588–593. [Google Scholar]
- Augustine, S.M.; Alameddin, G.N.; Sachtler, W.M.H. The effect of Re, S, and Cl on the deactivation of Pt γ-Al2O3 reforming catalysts. J. Catal. 1989, 115, 217–232. [Google Scholar]
- Guisnet, M.; Magnoux, P. Coking and deactivation of zeolites: Influence of the Pore Structure. Appl. Catal. 1989, 54, 1–27. [Google Scholar]
- Bauer, F.; Kanazirev, V.; Vlaev, C.; Hanisch, R.; Weiss, W. Koksbildung in ZSM-5-Katalysatoren. Chem. Tech. 1989, 41, 297–301. [Google Scholar]
- Grotten, W.A.; Wojciechowski, B.W.; Hunter, B.K. On the relationship between coke formation chemistry and catalyst deactivation. J. Catal. 1992, 138, 343–350. [Google Scholar]
- Bellare, A.; Dadyburjor, D.B. Evaluation of modes of catalyst deactivation by coking for cumene cracking over zeolites. J. Catal. 1993, 140, 510–525. [Google Scholar]
- Uguina, M.A.; Serrano, D.P.; Grieken, R.V.; Vènes, S. Adsorption, acid and catalytic changes induced in ZSM-5 by coking with different hydrocarbons. Appl. Catal. A 1993, 99, 97–113. [Google Scholar]
- Li, C.; Chen, Y.-W.; Yang, S.-J.; Yen, R.-B. In-situ FTIR investigation of coke formation on USY zeolite. Appl. Surf. Sci. 1994, 81, 465–468. [Google Scholar]
- Buglass, J.G.; de Jong, K.P.; Mooiweer, H.H. Analytical studies of the coking of the zeolite ferrierite. J. Chem. Soc. Abstr. 1995, 210. 105-PETR. [Google Scholar]
- Chen, D.; Rebo, H.P.; Moljord, K.; Holmen, A. Effect of coke deposition on transport and adsorption in zeolites studied by a new microbalance reactor. Chem. Eng. Sci. 1996, 51, 2687–2692. [Google Scholar]
- Guisnet, M.; Magnoux, P.; Martin, D. Roles of acidity and pore structure in the deactivation of zeolites by carbonaceous deposits. In Catalyst Deactivation 1997 (Studies in Surface Science and Catalysis); Bartholomew, C.H., Fuentes, G.A., Eds.; Elsevier: Amsterdam, The Nethelands, 1997; Volume 111, pp. 1–19. [Google Scholar]
- Masuda, T.; Tomita, P.; Fujikata, Y.; Hashimoto, K. Deactivation of HY-type zeolite catalyst due to coke deposition during gas-oil cracking. In Catalyst Deactivation 1999 (Studies in Surface Science and Catalysis); Delmon, B., Froment, G.F., Eds.; Elsevier: Amsterdam, The Nethelands, 1999; Volume 126, pp. 89–96. [Google Scholar]
- Cerqueira, H.S.; Magnoux, P.; Martin, D.; Guisnet, M. Effect of contact time on the nature and location of coke during methylcyclohexane transformation over a USHY zeolite. In Catalyst Deactivation 1999 (Studies in Surface Science and Catalysis); Delmon, B., Froment, G.F., Eds.; Elsevier: Amsterdam, The Nethelands, 1999; Volume 126, pp. 105–112. [Google Scholar]
- Wanke, S.E.; Flynn, P.C. The sintering of supported metal catalysts. Catal. Rev.—Sci. Eng. 1975, 12, 93–135. [Google Scholar]
- Wynblatt, P.; Gjostein, N.A. Supported metal crystallites. Prog. Solid State Chem. 1975, 9, 21–58. [Google Scholar] [CrossRef]
- Ruckenstein, E.; Pulvermacher, B. Kinetics of crystallite sintering during heat treatment of supported metal catalysts. AIChE J. 1973, 19, 356–364. [Google Scholar]
- Ruckenstein, E.; Dadyburjor, D.B. Sintering and redispersion in supported metal catalysts. Rev. Chem. Eng. 1983, 1, 251–356. [Google Scholar]
- Wanke, S.E. Sintering of commercial supported platinum group metal catalysts. In Progress in Catalyst Deactivation (NATO Advanced Study Institute Series E, No. 54); Figueiredo, J.L., Ed.; Martin Nijhoff Publishers: Boston, MA, USA, 1982; pp. 315–328. [Google Scholar]
- Baker, R.T.; Bartholomew, C.H.; Dadyburjor, D.B. Sintering and Redispersion: Mechanisms and Kinetics. In Stability of Supported Catalysts: Sintering and Redispersion; Horsley, J.A., Ed.; Catalytica: Mountain View, CA, USA, 1991; pp. 169–225. [Google Scholar]
- Bartholomew, C.H. Model catalyst studies of supported metal sintering and redispersion kinetics. In Catalysis (Specialist Periodical Report); Spivey, J.J., Agarwal, S.K., Eds.; Royal Society of Chemistry: Cambridge, UK, 1993; Volume 10, pp. 41–82. [Google Scholar]
- Bartholomew, C.H. Sintering kinetics of supported metals: new perspectives from a unifying GPLE treatment. Appl. Catal. A 1993, 107, 1–57. [Google Scholar]
- Bartholomew, C.H. Sintering kinetics of supported metals: perspectives from a generalized power law approach. In Catalyst Deactivation 1994 (Studies in Surface Science and Catalysis); Delmon, B., Froment, G.F., Eds.; Elsevier: Amsterdam, The Nethelands, 1994; Volume 88, pp. 1–18. [Google Scholar]
- Bartholomew, C.H. Sintering and redispersion of supported metals: Perspectives from the literature of the past decade. In Catalyst Deactivation 1997 (Studies in Surface Science and Catalysis); Bartholomew, C.H., Fuentes, G.A., Eds.; Elsevier: Amsterdam, The Nethelands, 1997; Volume 111, pp. 585–592. [Google Scholar]
- Bartholomew, C.H.; Sorenson, W. Sintering kinetics of silica- and alumina-supported nickel in hydrogen atmosphere. J. Catal. 1983, 81, 131–141. [Google Scholar]
- Moulijn, J.A.; van Diepen, A.E.; Kapteijn, F. Catalyst deactivation: is it predictable?: What to do? Appl. Catal. A 2001, 212, 3–16. [Google Scholar]
- Bridger, G.W.; Spencer, M.S. Methanol synthesis. In Catalyst Handbook, 2nd ed.; Twigg, M.V., Ed.; Manson Publishing: London, UK, 1996; pp. 441–468. [Google Scholar]
- Fuentes, G.A. Catalyst deactivation and steady-state activity: A generalized power-law equation model. Appl. Catal. 1985, 15, 33–40. [Google Scholar]
- Fuentes, G.A.; Ruiz-Trevino, F.A. Towards a better understanding of sintering phenomena in catalysis. In Catalyst Deactivation 1991 (Studies in Surface Science and Catalysis); Bartholomew, C.H., Butt, J.B., Eds.; Elsevier: Amsterdam, The Nethelands, 1991; Volume 68, pp. 637–644. [Google Scholar]
- Bournonville, J.P.; Martino, G. Sintering of Alumina Supported Platinum. In Catalyst Deactivation 1980 (Studies in Surface Science and Catalysis); Delmon, B., Froment, G.F., Eds.; Elsevier: Amsterdam, The Nethelands, 1980; Volume 6, pp. 159–166. [Google Scholar]
- Somorjai, G.A. Small-Angle X-Ray Scattering and Low Energy Electron Diffraction Studies on Catalyst Surfaces. In X-ray and Electron Methods of Analysis (Progress in Analytical Chemistry); Van Olphen, H., Parrish, W., Eds.; Plenum Press: New York, NY, USA, 1968; Volume 1, pp. 101–126. [Google Scholar]
- Seyedmonir, S.R.; Strohmayer, D.E.; Guskey, G.J.; Geoffroy, G.L.; Vannice, M.A. Characterization of supported silver catalysts: III. Effects of support, pretreatment, and gaseous environment on the dispersion of Ag. J. Catal. 1985, 93, 288–302. [Google Scholar] [CrossRef]
- Trimm, D.L. Thermal stability of catalyst supports. In Catalyst Deactivation 1991 (Studies in Surface Science and Catalysis); Bartholomew, C.H., Butt, J.B., Eds.; Elsevier: Amsterdam, The Nethelands, 1991; Volume 68, pp. 29–51. [Google Scholar]
- Shastri, A.G.; Datye, A.K.; Schwank, J. Influence of chlorine on the surface area and morphology of TiO2. Appl. Catal. 1985, 14, 119–131. [Google Scholar] [CrossRef]
- Oberlander, R.K. Aluminas for catalysts: Their preparations and properties. In Applied Industrial Catalysis; Leach, B.E., Ed.; Academic Press: Orlando, FL, USA, 1984; Volume 3, pp. 64–112. [Google Scholar]
- Wefers, K.; Misra, C. Oxides and Hydroxides of Aluminum; Alcoa Technical Paper No. 19; Alcoa Laboratories: Pittsburg, PA, USA, 1987. [Google Scholar]
- Hegedus, L.L.; Baron, K. Phosphorus accumulation in automotive catalysts. J. Catal. 1978, 54, 115–119. [Google Scholar] [CrossRef]
- Summers, J.; Hegedus, L.L. Modes of catalyst deactivation in stoichiometric automobile exhaust. Ind. Eng. Chem. Prod. Res. Dev. 1979, 18, 318–324. [Google Scholar] [CrossRef]
- Peter-Hoblyn, J.D.; Valentine, J.M.; Sprague, B.N.; Epperly, W.R. Methods for reducing harmful emissions from a diesel engine. U.S. Patent 6,003,303, 21 December 1999. [Google Scholar]
- Manson, I. Self-regenerating diesel exhaust particulate filter and material. U.S. Patent 6,013,599, 11 January 2000. [Google Scholar]
- Deeba, M.; Lui, Y.K.; Dettling, J.C. Four-way diesel exhaust catalyst and method of use. U.S. Patent 6,093,378, 25 July 2000. [Google Scholar]
- Dry, M.E. The fischer-tropsch synthesis. In Catalysis—Science and Technology; Anderson, J., Boudart, M., Eds.; Springer-Verlag: New York, NY, USA, 1981; pp. 159–218. [Google Scholar]
- Huber, G.W.; Guymon, C.G.; Stephenson, B.C.; Bartholomew, C.H. Hydrothermal stability of Co/SiO2 Fischer-Tropsch synthesis catalysts. In Catalyst Deactivation 2001 (Studies in Surface Science and Catalysis); Spivey, J.J., Roberts, G.W., Davis, B.H., Eds.; Elsevier: Amsterdam, The Netheland, 2001; Volume 139, pp. 423–430. [Google Scholar]
- Busca, G.; Lietti, L.; Ramis, G.; Berti, F. Chemical and mechanistic aspects of the selective catalytic reduction of NOx by ammonia over oxide catalysts: A review. Appl. Catal. B 1998, 18, 1–36. [Google Scholar] [CrossRef]
- Kobylinski, T.P.; Taylor, B.W.; Yong, J.E. Stabilized ruthenium catalysts For NO x reduction. Proc. SAE, 1974; Paper 740250. [Google Scholar]
- Shelef, M.; Gandhi, H.S. The reduction of nitric oxide in automobile emissions: Stabilisation of catalysts containing ruthenium. Platinum Met. Rev. 1974, 18, 2–14. [Google Scholar]
- Gandhi, H.S.; Stepien, H.K.; Shelef, M. Optimization of ruthenium-containing, stabilized, nitric oxide reduction catalysts. Mat. Res. Bull. 1975, 10, 837–845. [Google Scholar] [CrossRef]
- Bartholomew, C.H. Reduction of nitric oxide by monolithic-supported palladium-nickel and palladium-ruthenium alloys. Ind. Eng. Chem. Prod. Res. Dev. 1975, 14, 29–33. [Google Scholar] [CrossRef]
- Clark, R.W.; Tien, J.K.; Wynblatt, P. Loss of palladium from model platinum-palladium supported catalysts during annealing. J. Catal. 1980, 61, 15–18. [Google Scholar] [CrossRef]
- Shen, W.M.; Dumesic, J.A.; Hill, C.G. Criteria for stable Ni particle size under methanation reaction conditions: Nickel transport and particle size growth via nickel carbonyl. J. Catal. 1981, 68, 152–165. [Google Scholar] [CrossRef]
- Pannell, R.B.; Chung, K.S.; Bartholomew, C.H. The stoichiometry and poisoning by sulfur of hydrogen, oxygen and carbon monoxide chemisorption on unsupported nickel. J. Catal. 1977, 46, 340–347. [Google Scholar] [CrossRef]
- Lohrengel, G.; Baerns, M. Determination of the metallic surface area of nickel and its dispersion on a silica support by means of a microbalance. Appl. Catal. 1981, 1, 3–7. [Google Scholar] [CrossRef]
- Qamar, I.; Goodwin, J.G. Fischer-Tropsch Synthesis over Composite Ru Catalysts. In Proceedings of 8th North American Catalysis Society Meeting, Philadelphia, PA, USA; 1983. Paper C-22. [Google Scholar]
- Goodwin, J.G.; Goa, D.O.; Erdal, S.; Rogan, F.H. Reactive metal volatilization from Ru/Al2O3 as a result of ruthenium carbonyl formation. Appl. Catal. 1986, 24, 199–209. [Google Scholar] [CrossRef]
- Watzenberger, O.; Haeberle, T.; Lynch, D.T.; Emig, G. Deactivation of Heteropolyacid Catalysts. In Catalyst Deactivation 1991 (Studies in Surface Science and Catalysis); Bartholomew, C.H., Butt, J.B., Eds.; Elsevier: Amsterdam, The Nethelands, 1991; Volume 68, pp. 441–448. [Google Scholar]
- Agnelli, M.; Kolb, M.; Mirodatos, C. Co hydrogenation on a nickel catalyst: 1. Kinetics and modeling of a low-temperature sintering process. J. Catal. 1994, 148, 9–21. [Google Scholar] [CrossRef]
- Lee, H.C.; Farrauto, R.J. Catalyst deactivation due to transient behavior in nitric acid production. Ind. Eng. Chem. Res. 1989, 28, 1–5. [Google Scholar] [CrossRef]
- Farrauto, R.J.; Lee, H.C. Ammonia oxidation catalysts with enhanced activity. Ind. Eng. Chem. Res. 1990, 29, 1125–1129. [Google Scholar] [CrossRef]
- Sperner, F.; Hohmann, W. Rhodium-platinum gauzes for ammonia oxidation. Platinum Met. Rev. 1976, 20, 12–20. [Google Scholar]
- Hess, J.M.; Phillips, J. Catalytic etching of Pt/Rh gauzes. J. Catal. 1992, 136, 149–160. [Google Scholar] [CrossRef]
- Kuo, C.L.; Hwang, K.C. Does morphology of a metal nanoparticle play a role in ostwald ripening processes? Chem. Mater. 2013, 25, 365–371. [Google Scholar] [CrossRef]
- Bartholomew, C.H. Hydrogen adsorption on supported cobalt, iron, and nickel. Catal. Lett. 1990, 7, 27–51. [Google Scholar] [CrossRef]
- Wu, N.L.; Phillips, J. Catalytic etching of platinum during ethylene oxidation. J. Phys. Chem. 1985, 89, 591–600. [Google Scholar] [CrossRef]
- Wu, N.L.; Phillips, J. Reaction‐enhanced sintering of platinum thin films during ethylene oxidation. J. Appl. Phys. 1986, 59, 769–779. [Google Scholar] [CrossRef]
- Wu, N.L.; Phillips, J. Sintering of silica-supported platinum catalysts during ethylene oxidation. J. Catal. 1988, 113, 129–143. [Google Scholar] [CrossRef]
- Bielanski, A.; Najbar, M.; Chrzaoszcz, J.; Wal, W. Deactivation of the V2O5-MoO3, catalysts in the selective oxidation of eenzene to maleic anhydride and the changes in its morphology and chemical composition. In Catalyst Deactivation 1980 (Studies in Surface Science and Catalysis); Delmon, B., Froment, G.F., Eds.; Elsevier: Amsterdam, The Nethelands, 1980; Volume 6, pp. 127–140. [Google Scholar]
- Burriesci, N.; Garbassi, F.; Petrera, M.; Petrini, G.; Pernicone, N. Solid state reactions in Fe-Mo oxide catalysts for methanol oxidation during aging in industrial plants. In Catalyst Deactivation 1980 (Studies in Surface Science and Catalysis); Delmon, B., Froment, G.F., Eds.; Elsevier: Amsterdam, The Nethelands, 1980; Volume 6, pp. 115–126. [Google Scholar]
- Xiong, Y.L.; Castillo, R.; Papadopoulou, C.; Dada, L.; Ladriere, J.; Ruiz, P.; Delmon, B. The protecting role of antimony oxide against deactivation of iron molybdate in oxidation catalysts. In Catalyst Deactivation 1991 (Studies in Surface Science and Catalysis); Bartholomew, C.H., Butt, J.B., Eds.; Elsevier: Amsterdam, The Nethelands, 1991; Volume 68, pp. 425–432. [Google Scholar]
- Farrauto, R.J.; Hobson, M.; Kennelly, T.; Waterman, E. Catalytic chemistry of supported palladium for combustion of methane. Appl. Catal. A 1992, 81, 227–237. [Google Scholar] [CrossRef]
- Gai-Boyes, P.L. Defects in Oxide Catalysts: Fundamental Studies of Catalysis in Action. Catal. Rev.—Sci. Eng. 1992, 34, 1–54. [Google Scholar] [CrossRef]
- Delmon, B. Solid-state reactions in catalysts during ageing: Beneficial role of spillover. In Catalyst Deactivation 1994 (Studies in Surface Science and Catalysis, Volume 88); Delmon, B., Froment, G.F., Eds.; Elsevier: Amsterdam, The Nethelands, 1994; pp. 113–128. [Google Scholar]
- Erickson, K.M.; Karydis, D.A.; Boghosian, S.; Fehrmann, R. Deactivation and compound formation in sulfuric-acid catalysts and model systems. J. Catal. 1995, 155, 32–42. [Google Scholar] [CrossRef]
- Delmon, B. Solid state reactions in catalysts: An approach to real active systems and their deactivation. In Catalyst Deactivation 1997 (Studies in Surface Science and Catalysis); Bartholomew, C.H., Fuentes, G.A., Eds.; Elsevier: Amsterdam, The Nethelands, 1997; Volume 111, pp. 39–51. [Google Scholar]
- Jackson, N.B.; Datye, A.K.; Mansker, L.; O’Brien, R.J.; Davis, B.H. Deactivation and attrition of iron catalysts in synthesis gas. In Catalyst Deactivation 1997 (Studies in Surface Science and Catalysis); Bartholomew, C.H., Fuentes, G.A., Eds.; Elsevier: Amsterdam, The Nethelands, 1997; Volume 111, pp. 501–516. [Google Scholar]
- Eliason, S.A.; Bartholomew, C.H. Temperature-programmed reaction study of carbon transformations on iron fischer-tropsch catalysts during steady-state synthesis. In Catalyst Deactivation 1997 (Studies in Surface Science and Catalysis); Bartholomew, C.H., Fuentes, G.A., Eds.; Elsevier: Amsterdam, The Nethelands, 1997; Volume 111, pp. 517–526. [Google Scholar]
- Baranski, A.; Dziembaj, R.; Kotarba, A.; Golebiowski, A.; Janecki, Z.; Pettersson, J.B.C. Deactivation of iron catalyst by water-potassium thermal desorption studies. In Catalyst Deactivation 1999 (Studies in Surface Science and Catalysis); Delmon, B., Froment, G.F., Eds.; Elsevier: Amsterdam, The Nethelands, 1999; Volume 126, pp. 229–236. [Google Scholar]
- Querini, C.A.; Ravelli, F.; Ulla, M.; Cornaglia, L.; Miró, E. Deactivation of Co, K catalysts during catalytic combustion of diesel soot: Influence of the support. In Catalyst Deactivation 1999 (Studies in Surface Science and Catalysis); Delmon, B., Froment, G.F., Eds.; Elsevier: Amsterdam, The Nethelands, 1999; Volume 126, pp. 257–264. [Google Scholar]
- Wilson, J.; de Groot, C. Atomic-scale restructuring in high-pressure catalysis. J. Phys. Chem. 1995, 99, 7860–7866. [Google Scholar] [CrossRef]
- Parkinson, G.S.; Novotny, Z.; Argentero, G.; Schmid, M.; Pavelec, J.; Kosak, R.; Blaha, P.; Diebold, U. Carbon monoxide-induced adatom sintering in a Pd–Fe3O4 model catalyst. Nat. Mater. 2013, 12, 724–728. [Google Scholar] [CrossRef] [PubMed]
- Pham, H.N.; Reardon, J.; Datye, A.K. Measuring the strength of slurry phase heterogeneous catalysts. Powder Technol. 1999, 103, 95–102. [Google Scholar] [CrossRef]
- Kalakkad, D.S.; Shroff, M.D.; Kohler, S.; Jackson, N.; Datye, A.K. Attrition of precipitated iron Fischer-Tropsch catalysts. Appl. Catal. A 1995, 133, 335–350. [Google Scholar] [CrossRef]
- Callister, W.D. Materials Science and Engineering: An Introduction; John Wiley, & Sons, Inc.: New York, NY, USA, 2000. [Google Scholar]
- Coble, R.L.; Kingery, W.D. Effect of porosity on physical properties of sintered alumina. J. Am. Ceram. Soc. 1956, 39, 377–385. [Google Scholar] [CrossRef]
- Deng, S.G.; Lin, Y.S. Granulation of sol-gel-derived nanostructured alumina. AIChE J. 1997, 43, 505–514. [Google Scholar] [CrossRef]
- Thoma, S.G.; Ciftcioglu, M.; Smith, D.M. Determination of agglomerate strength distributions: Part 1. Calibration via ultrasonic forces. Powder Technol. 1991, 68, 53–61. [Google Scholar] [CrossRef]
- Bankmann, M.; Brand, R.; Engler, B.H.; Ohmer, J. Forming of high surface area TiO2 to catalyst supports. Catal. Today 1992, 14, 225–242. [Google Scholar] [CrossRef]
- Kenkre, V.M.; Endicott, M.R. A theoretical model for compaction of granular materials. J. Am. Ceram. Soc. 1996, 79, 3045–3054. [Google Scholar] [CrossRef]
- Song, H.; Evans, J.R.G. A die pressing test for the estimation of agglomerate strength. J. Am. Ceram. Soc. 1994, 77, 806–814. [Google Scholar] [CrossRef]
- Werther, J.; Xi, W. Jet attrition of catalyst particles in gas fluidized beds. Powder Technol. 1993, 76, 39–46. [Google Scholar] [CrossRef]
- Bhatt, B.L.; Schaub, E.S.; Hedorn, E.C.; Herron, D.M.; Studer, D.W.; Brown, D.M. Liquid phase Fischer-Tropsch synthesis in a bubble column. In Proceedings of Liquefaction Contractors Review Conference; Stiegel, G.J., Srivastava, R.D., Eds.; U.S. Department of Energy: Pittsburgh, PA, USA, 1992; pp. 402–423. [Google Scholar]
- Pham, H.N.; Datye, A.K. The synthesis of attrition resistant slurry phase iron Fischer-Tropsch catalysts. Catal. Today 2000, 58, 233–240. [Google Scholar] [CrossRef]
- Bemrose, C.R.; Bridgewater, J. A review of attrition and attrition test methods. Powder Technol. 1987, 49, 97–126. [Google Scholar] [CrossRef]
- Ghadiri, M.; Cleaver, J.A.S.; Tuponogov, V.G.; Werther, J. Attrition of FCC powder in the jetting region of a fluidized bed. Powder Technol. 1994, 80, 175–178. [Google Scholar] [CrossRef]
- Weeks, S.A.; Dumbill, P. Method speeds FCC catalyst attrition resistance determinations. Oil Gas J. 1990, 88, 38–40. [Google Scholar]
- Zhao, R.; Goodwin, J.G.; Jothimurugesan, K.; Spivey, J.J.; Gangwal, S.K. Comparison of attrition test methods: ASTM standard fluidized bed vs jet cup. Ind. Eng. Chem. Res. 2000, 39, 1155–1158. [Google Scholar] [CrossRef]
- Doolin, P.K.; Gainer, D.M.; Hoffman, J.F. Laboratory testing procedure for evaluation of moving bed catalyst attrition. J. Test. Eval. 1993, 21, 481. [Google Scholar] [CrossRef]
- Oukaci, R.; Singleton, A.H.; Wei, D.; Goodwin, J.G. Attrition resistance of Al2O3-supported cobalt F-T catalysts. In Proceedings of the 217th National Meeting, ACS Division of Petroleum Chemistry, Anaheim, CA, USA, 21–25 March 1999; p. 91.
- Adams, M.J.; Mullier, M.A.; Seville, J.P.K. Agglomerate strength measurement using a uniaxial confined compression test. Powder Technol. 1994, 78, 5–13. [Google Scholar] [CrossRef]
- Emig, G.; Martin, F.G. Development of a fluidized bed catalyst for the oxidation of n-butane to maleic anhydride. Ind. Eng. Chem. Res. 1991, 30, 1110–1116. [Google Scholar] [CrossRef]
- Silver, R.G.; Summers, J.C.; Williamson, W.B. Catalysis and Automotive Pollution Control II; Elsevier: Amsterdam, The Nethelands, 1991; p. 167. [Google Scholar]
- Fisher, G.B.; Zammit, M.G.; LaBarge, J. Investigation of Catalytic Alternatives to Rhodium in Emissions Control; SAE Report 920846; SAE International: Warrendale, PA, USA, 1992. [Google Scholar]
- Farrauto, R.J.; Heck, R.M. Catalytic converters: state of the art and perspectives. Catal. Today 1999, 51, 351–360. [Google Scholar] [CrossRef]
- Beer, G.L. Extended catalyst life two stage hydrocarbon synthesis process. U.S. Patent 6,169,120, 2 January 2001. [Google Scholar]
- Bartholomew, C.H.; Stoker, M.W.; Mansker, L.; Datye, A. Effects of pretreatment, reaction, and promoter on microphase structure and Fischer-Tropsch activity of precipitated iron catalysts. In Catalyst Deactivation 1999 (Studies in Surface Science and Catalysis); Delmon, B., Froment, G.F., Eds.; Elsevier: Amsterdam, The Nethelands, 1999; Volume 126, pp. 265–272. [Google Scholar]
- Nagano, O.; Watanabe, T. Method for producing methacrolein. U.S. Patent 5,728,894, 17 March 1998. [Google Scholar]
- Maillet, T.; Barbier, J.; Duprez, D. Reactivity of steam in exhaust gas catalysis III. Steam and oxygen/steam conversions of propane on a Pd/Al2O3 catalyst. Appl. Catal. B 1996, 9, 251–266. [Google Scholar] [CrossRef]
- Mathys, G.M.K.; Martens, L.R.M.; Baes, M.A.; Verduijn, J.P.; Huybrechts, D.R.C. Alkene oligomerization. WIPO Patent WO 1993/016020 (A3), 16 September 1993. [Google Scholar]
- Mathys, G.M.K.; Martens, L.R.M.; Baes, M.A.; Verduijn, J.P.; Huybrechts, D.R.C. Alkene oligomerization. U.S. Patent 5,672,800, 30 September 1997. [Google Scholar]
- Stine, L.O.; Muldoon, B.S.; Gimre, S.C.; Frame, R.R. Process for oligomer production and saturation. U.S. Patent 6,080,903, 26 June 2000. [Google Scholar]
- Subramaniam, B.; Arunajatesan, V.; Lyon, C.J. Coking of solid acid catalysts and strategies for enhancing their activity. In Catalyst Deactivation 1999 (Studies in Surface Science and Catalysis); Delmon, B., Froment, G.F., Eds.; Elsevier: Amsterdam, The Nethelands, 1999; Volume 126, pp. 63–77. [Google Scholar]
- Ginosar, D.M.; Fox, R.V.; Kong, P.C. Solid catalyzed isoparaffin alkylation at supercritical fluid and near-supercritical fluid conditions. WIPO Patent WO 1999/033769 (A1), 8 July 1999. [Google Scholar]
- Ribeiro, F.H.; Bonivardi, A.L.; Kim, C. Transformation of platinum into a stable, high-temperature, dehydrogenation-hydrogenation catalyst by ensemble size reduction with rhenium and sulfur. J. Catal. 1994, 150, 186–198. [Google Scholar] [CrossRef]
- Ginosar, D.; Subramaniam, B. Coking and activity of a reforming catalyst in near-critical and dense supercritical reaction mixtures. In Catalyst Deactivation 1994 (Studies in Surface Science and Catalysis); Delmon, B., Froment, G.F., Eds.; Elsevier: Amsterdam, The Nethelands, 1994; Volume 88, pp. 327–334. [Google Scholar]
- Petersen, E.E. Catalyst deactivation: Opportunity amidst woe. In Catalyst Deactivation 1997 (Studies in Surface Science and Catalysis); Bartholomew, C.H., Fuentes, G.A., Eds.; Elsevier: Amsterdam, The Nethelands, 1997; Volume 111, pp. 87–98. [Google Scholar]
- Gosselink, J.W.; Veen, J.A.R.V. Coping with catalyst deactivation in hydrocarbon processing. In Catalyst Deactivation 1999 (Studies in Surface Science and Catalysis); Delmon, B., Froment, G.F., Eds.; Elsevier: Amsterdam, The Nethelands, 1999; Volume 126, pp. 3–16. [Google Scholar]
- Lin, L.; Zao, T.; Zang, J.; Xu, Z. Dynamic process of carbon deposition on Pt and Pt–Sn catalysts for alkane dehydrogenation. Appl. Catal. 1990, 67, 11–23. [Google Scholar] [CrossRef]
- Resasco, D.E.; Haller, G.L. Catalytic dehydrogenation of lower alkanes. In Catalysis (Specialist Periodiodical Report; Spivey, J.J., Agarwal, S.K., Eds.; Royal Society of Chemistry: Cambridge, UK, 1994; Volume 11, pp. 379–411. [Google Scholar]
- Cortright, R.D.; Dumesic, J.A. Microcalorimetric, Spectroscopic, and Kinetic Studies of Silica Supported Pt and Pt/Sn Catalysts for Isobutane Dehydrogenation. J. Catal. 1994, 148, 771–778. [Google Scholar] [CrossRef]
- Weyten, H.; Keizer, K.; Kinoo, A.; Luyten, J.; Leysen, R. Dehydrogenation of propane using a packed-bed catalytic membrane reactor. AIChE J. 1997, 43, 1819–1827. [Google Scholar] [CrossRef]
- Praserthdam, P.; Mongkhonsi, T.; Kunatippapong, S.; Jaikaew, B.; Lim, N. Determination of coke deposition on metal active sites of propane dehydrogenation catalysts. In Catalyst Deactivation 1997 (Studies in Surface Science and Catalysis); Bartholomew, C.H., Fuentes, G.A., Eds.; Elsevier: Amsterdam, The Nethelands, 1997; Volume 111, pp. 153–158. [Google Scholar]
- Rose, B.H.; Kiliany, T.R. Dual catalyst system. WIPO Pat. App. WO 2000/069993 (A1), 12 May 2000. [Google Scholar]
- Guerrero-Ruiz, A.; Sepulveda-Escribano, A.; Rodriguez-Ramos, I. Cooperative action of cobalt and MgO for the catalysed reforming of CH4 with CO2. Catal. Today 1994, 21, 545–550. [Google Scholar] [CrossRef]
- Qin, D.; Lapszewicz, J. Study of mixed steam and CO2 reforming of CH4 to syngas on MgO-supported metals. Catal. Today 1994, 21, 551–560. [Google Scholar] [CrossRef]
- Stagg, S.; Resasco, D. Effects of promoters and supports on coke formation on Pt catalysts during CH4 reforming with CO2. In Catalyst Deactivation 1997 (Studies in Surface Science and Catalysis); Bartholomew, C.H., Fuentes, G.A., Eds.; Elsevier: Amsterdam, The Nethelands, 1997; Volume 111, pp. 543–550. [Google Scholar]
- Fujimoto, K.; Tomishige, K.; Yamazaki, O.; Chen, Y.; Li, X. Development of catalysts for natural gas reforming: Nickel-magnesia solid solution catalyst. Res. Chem. Intermed. 1998, 24, 259–271. [Google Scholar] [CrossRef]
- Marshall, C.L.; Miller, J.T. Process for converting methanol to olefins or gasoline. U.S. Patent 5,191,142, 2 March 1993. [Google Scholar]
- Gayubo, A.G.; Aguayo, A.T.; Campo, A.E.S.D.; Benito, P.L.; Bilbao, J. The role of water on the attenuation of coke deactivation of a SAPO-34 catalyst in the transformation of methanol into olefins. In Catalyst Deactivation 1999 (Studies in Surface Science and Catalysis); Delmon, B., Froment, G.F., Eds.; Elsevier: Amsterdam, The Nethelands, 1999; Volume 126, pp. 129–136. [Google Scholar]
- Barger, P.T. SAPO catalysts and use thereof in methanol conversion processes. U.S. Patent 5,248,647, 28 Sepetember 1993. [Google Scholar]
- Cox, J.P.; Evans, J.M. Exhaust gas catalyst for two-stroke engines. WIPO Patent WO 1999/042202 (A1), 20 February 1998. [Google Scholar]
- Leviness, S.C.; Mart, C.J.; Behrmann, W.C.; Hsia, S.J.; Neskora, D.R. Slurry hydrocarbon synthesis process with increased catalyst life. WIPO Patent WO 1998/050487 (A1), 2 May 1997. [Google Scholar]
- Bartholomew, C.H. Catalyst deactivation in hydrotreating of residua: A review. In Catalytic Hydroprocessing of Petroleum and Distillates; Oballa, M., Shih, S., Eds.; Marcel Dekker: New York, NY, USA, 1993; pp. 1–32. [Google Scholar]
- Summers, J.; Williamson, W.B. Palladium-only catalysts for closed-loop control. In Environmental Catalysis 1993; Armor, J.N., Ed.; American Chemical Society: Washington, DC, USA, 1993; Volume 552, pp. 94–113. [Google Scholar]
- Dettling, J.; Hu, Z.; Lui, Y.K.; Smaling, R.; Wan, C.Z.; Punke, A. Smart Pd TWC technology to meet stringent standards. In Studies in Surface Science and Catalysis; Elsevier: Amsterdam, The Nethelands, 1995; Volume 96, pp. 461–472. [Google Scholar]
- Berndt, M.; Ksinsik, D. Catalyst and process for its preparation. U.S. Patent 4,910,180, 20 March 1990. [Google Scholar]
- Prigent, M.; Blanchard, G.; Phillippe, P. Catalyst supports/catalysts for the treatment of vehicular exhaust gases. U.S. Patent 4,985,387, 15 January 1991. [Google Scholar]
- Williamson, W.B.; Linden, D.G.; Summers, J.C., II. High-temperature three-way catalyst for treating automotive exhaust gases. U.S. Patent 5,041,407, 20 August 1991. [Google Scholar]
- Williamson, W.B.; Linden, D.G.; Summers, J.C., II. High durability and exhuast catalyst with low hydrogen sulfide emissions. U.S. Patent 5,116,800, 26 May 1992. [Google Scholar]
- Narula, C.K.; Watkins, W.L.H.; Chattha, M.S. Binary La-Pd oxide catalyst and method of making the catalyst. U.S. Patent 5,234,881, 10 August 1993. [Google Scholar]
- Wan, C.-Z.; Tauster, S.J.; Rabinowitz, H.N. Catalyst composition containing platinum and rhodium components. U.S. Patent 5,254,519, 19 October 1993. [Google Scholar]
- Argyle, M.D.; Frost, T.S.; Bartholomew, C.H. Modeling cobalt fischer tropsch catalyst deactivation with generalized power law expressions. Top. Catal. 2014, 57, 415–429. [Google Scholar] [CrossRef]
- Furuya, T.; Yamanaka, S.; Hayata, T.; Koezuka, J.; Yoshine, T.; Ohkoshi, A. Hybrid catalytic combustion for stationary gas turbine—Concept and small scale test results. In Proceedings of Gas Turbine Conference and Exhibition, Anaheim, CA, USA, 31 May–4 June 1987. ASME Paper 87-GT-99.
- Kawakami, T.; Furuya, T.; Sasaki, Y.; Yoshine, T.; Furuse, Y.; Hoshino, M. Feasibility study on honeycomb ceramics for catalytic combustor. In Proceedings of Gas Turbine and Aeroengine Congress and Exposition, Toronto, ON, Canada, 4–8 June 1989. ASME Paper 89-GT-41.
- Betta, R.D.; Ribeiro, F.; Shoji, T.; Tsurumi, K.; Ezawa, N.; Nickolas, S. Catalyst structure having integral heat exchange. U.S. Patent 5,250,489, 5 October 1993. [Google Scholar]
- Fujii, T.; Ozawa, Y.; Kikumoto, S. High pressure test results of a catalytic combustor for gas turbine. J. Eng. Gas Turbines Power 1998, 120, 509–513. [Google Scholar] [CrossRef]
- Borio, D.O.; Schbib, N.S. Simulation and optimization of a set of catalytic reactors used for dehydrogenation of butene into butadiene. Comput. Chem. Eng. 1995, 19, S345–S350. [Google Scholar] [CrossRef]
- Fiato, R.A. Two stage process for hydrocarbon synthesis. U.S. Patent 5,028,634, 2 July 1991. [Google Scholar]
- Zhao, R.; Goodwin, J.G., Jr.; Jothimurugesan, K.; Gangwal, S.K.; Spivey, J.J. Spray-dried Iron Fischer-Tropsch catalysts. 1. Effect of structure on the attrition resistance of the catalysts in the calcined state. Ind. Eng. Chem. Res. 2001, 40, 1065–1075. [Google Scholar] [CrossRef]
- Zhao, R.; Goodwin, J.G., Jr.; Jothimurugesan, K.; Gangwal, S.K.; Spivey, J.J. Spray-dried iron Fischer-Tropsch catalysts. 2. Effect of carburization on catalyst attrition resistance. Ind. Eng. Chem. Res. 2001, 40, 1320–1328. [Google Scholar] [CrossRef]
- Singleton, A.H.; Oukaci, R.; Goodwin, J.G. Processes and catalysts for conducting fischer-tropsch synthesis in a slurry bubble column reactor. U.S. Patent 5,939,350, 17 August 1999. [Google Scholar]
- Plecha, S.; Mauldin, C.H.; Pedrick, L.E. Titania catalysts, their preparation and use in Fischer-Tropsch synthesis. U.S. Patent 6,087,405, 11 July 2000. [Google Scholar]
- Plecha, S.; Mauldin, C.H.; Pedrick, L.E. Titania catalysts, their preparation and use in fischer-tropsch synthesis. U.S. Patent 6,124,367, 26 September 2000. [Google Scholar]
- Singleton, A.H.; Oukaci, R.; Goodwin, J.G. Reducing fischer-tropsch catalyst attrition losses in high agitation reaction systems. WIPO Patent WO 2000/071253 (A3), 30 November 2000. [Google Scholar]
- Seitz, M.; Klemm, E.; Emig, G. Poisoning and regeneration of NOx adsorbing catalysts for automotive applications. In Catalyst Deactivation 1999 (Studies in Surface Science and Catalysis); Delmon, B., Froment, G.F., Eds.; Elsevier: Amsterdam, The Nethelands, 1999; Volume 126, pp. 211–218. [Google Scholar]
- de Lima, S.M.; da Silva, A.M.; da Costa, L.O.O.; Assaf, J.M.; Mattos, L.V.; Sarkari, R.; Venugopal, A.; Noronha, F.B. Hydrogen production through oxidative steam reforming of ethanol over Ni-based catalysts derived from La1−xCexNiO3 perovskite-type oxides. Appl. Catal. B 2012, 121–122, 1–9. [Google Scholar]
- Song, H.; Ozkan, U.S. Ethanol steam reforming over Co-based catalysts: Role of oxygen mobility. J. Catal. 2009, 261, 66–74. [Google Scholar] [CrossRef]
- Masamune, S.; Smith, J.M. Performance of fouled catalyst pellets. AIChE J. 1966, 12, 384–394. [Google Scholar] [CrossRef]
- Murakami, Y.; Kobayashi, T.; Hattori, T.; Masuda, M. Effect of intraparticle diffusion on catalyst fouling. Ind. Eng. Chem. Fundam. 1968, 7, 599–605. [Google Scholar] [CrossRef]
- Stork, W.H.J. Molecules, catalysts and reactors in hydroprocessing of oil fractions. In Hydrotreatment and Hydrocracking of Oil Fractions (Studies in Surface Science and Catalysis); Froment, G.F., Delmon, B., Grange, P., Eds.; Elsevier: New York, NY, USA, 1997; Volume 106, pp. 41–67. [Google Scholar]
- Parks, G.D.; Schaffer, A.M.; Dreiling, M.J.; Shiblom, C.M. Surface Studies on the Interaction of Nickel and Antimony on Cracking Catalysts. Prepr.—Am. Chem. Soc., Div. Petr. Chem. 1980, 25, 335. [Google Scholar]
- Trimm, D.L. Introduction to Catalyst Deactivation. In Progress in Catalyst Deactivation (NATO Advanced Study Institute Series E, No. 54); Figueiredo, J.L., Ed.; Martinus Nijhoff Publishers: Boston, MA, USA, 1982; pp. 3–22. [Google Scholar]
- Becker, E.R.; Wei, J.J. Nonuniform distribution of catalysts on supports: I. Bimolecular Langmuir reactions. J. Catal. 1977, 46, 365–381. [Google Scholar] [CrossRef]
- Long, D.C. Staged hydrocarbon synthesis process. U.S. Patent 5,498,638, 12 March 1996. [Google Scholar]
- Powell, B.R., Jr. Stabilitzation of high surface area aluminas. In Proceedings of the Materials Research Society Annual Meeting, Boston, MA, USA, 16–21 November 1980. Paper H9.
- Dai, Y.; Lim, B.; Yang, Y.; Cobley, C.M.; Li, W.; Cho, E.C.; Grayson, B.; Fanson, P.T.; Campbell, C.T.; Sun, Y.; et al. A sinter-resistant catalytic system based on platinum nanoparticles supported on TiO2 nanofibers and covered by porous silica. Angew. Chem. Int. Ed. 2010, 49, 8165–8168. [Google Scholar] [CrossRef]
- Shang, L.; Bian, T.; Zhang, B.; Zhang, D.; Wu, L.-Z.; Tung, C.-H.; Yin, Y.; Zhang, T. Graphene-supported ultrafine metal nanoparticles encapsulated by mesoporous silica: Robust catalysts for oxidation and reduction reactions. Angew. Chem. Int. Ed. 2014, 53, 250–254. [Google Scholar] [CrossRef]
- Heck, R.; Farrauto, R. Catalytic Air Pollution Control: Commercial Technology; Van Nostrand Reinhold: New York, NY, USA, 1995. [Google Scholar]
- Trimm, D.L. The regeneration or disposal of deactivated heterogeneous catalysts. Appl. Catal. A 2001, 212, 153–160. [Google Scholar] [CrossRef]
- Berrebi, G.; Dufresne, P.; Jacquier, Y. Recycling of spent hydroprocessing catalysts: EURECAT technology. Environ. Prog. 1993, 12, 97–100. [Google Scholar] [CrossRef]
- D’Aquino, R.L. For catalyst regeneration, incentives anew. Chem. Eng. 2000, 107, 32–33, 35. [Google Scholar]
- Chang, T. Regeneration industry helps refiners control costs, limit liabilities. Oil Gas J. 1998, 96, 49. [Google Scholar]
- Blashka, S.R.; Duhon, W. Catalyst regeneration. Int. J. Hydrocarbon Eng. 1998, 4, 60–64. [Google Scholar]
- McCulloch, D.C. Catalytic hydrotreating in petroleum refining. In Applied Industrial Catalysis; Leach, B.E., Ed.; Academic Press: New York, NY, USA, 1983; pp. 69–121. [Google Scholar]
- Franck, J.P.; Martino, G. Deactivation and Regeneration of Catalytic-Reforming Catalysts. In Progress in Catalyst Deactivation (NATO Advanced Study Institute Series E., No. 54); Figueiredo, J.L., Ed.; Martinus Nijhoff Publishers: Boston, MA, USA, 1982; pp. 355–397. [Google Scholar]
- Spivey, J.J.; Roberts, G.W.; Davis, B.H. Catalyst Deactivation 2001 (Studies in Surface Science and Catalysis; Elsevier: Amsterdam, The Nethelands, 2001; Volume 139. [Google Scholar]
- Haddad, J.H.; Harandi, M.N.; Owen, H. Upgrading light olefin fuel gas in a fluidized bed catalyst reactor and regeneration of the catalyst. U.S. Patent 5,043,517, 27 August 1991. [Google Scholar]
- Ueda, M.; Murakami, T.; Shibata, S.; Hirabayashi, K.; Kondoh, T.; Adachi, K.; Hoshino, N.; Inoue, S. Process for the regeneration of coke-deposited, crystalline silicate catalyst. U.S. Patent 5,306,682, 26 April 1994. [Google Scholar]
- Zhang, S.Y.-F.; Gosling, C.D.; Sechrist, P.A.; Funk, G.A. Dual regeneration zone solid catalyst alkylation process. U.S. Patent 5,675,048, 7 October 1997. [Google Scholar]
- Panattoni, G.; Querini, C.A. Isobutane alkylation with C4 olefins: regeneration of metal-containing catalysts. In Catalyst Deactivation 2001 (Studies in Surface Science and Catalysis); Spivey, J.J., Roberts, G.W., Davis, B.H., Eds.; Elsevier: Amsterdam, The Nethelands, 2001; Volume 139, p. 181. [Google Scholar]
- Thompson, D.N.; Ginosar, D.M.; Burch, K.C. Regeneration of a deactivated USY alkylation catalyst using supercritical isobutene. Appl. Catal. A 2005, 279, 109–116. [Google Scholar] [CrossRef]
- Petkovic, L.M.; Ginosar, D.M.; Burch, K.C. Supercritical fluid removal of hydrocarbons adsorbed on wide-pore zeolite catalysts. J. Catal. 2005, 234, 328–339. [Google Scholar] [CrossRef]
- Dufresne, P.; Brahma, N. Offsite regeneration process for a catalyst containing at least one precious metal. U.S. Patent 5,854,162, 29 December 1998. [Google Scholar]
- Innes, R.A.; Holtermann, D.L.; Mulaskey, B.F. Low temperature regeneration of coke deactivated reforming catalysts. U.S. Patent 5,883,031, 16 March 1999. [Google Scholar]
- Fung, S.C. Regenerating a reforming catalyst—this bimetallic noble-metal catalyst is used in a refining process to convert saturated-hydrocarbons to aromatics - simply burning off the carbon was not enough—a procedure had to be found for redispersing the metals on the alumina support as well. Chemtech 1994, 24, 40–44. [Google Scholar]
- Alfonso, J.C.; Aranda, D.A.G.; Schmal, M.; Frety, R. Regeneration of a Pt-Sn/Al2O3 catalyst: Influence of heating rate, temperature and time of regeneration. Fuel Proc. Technol. 1997, 50, 35–48. [Google Scholar] [CrossRef]
- Arteaga, G.J.; Anderson, J.A.; Rochester, C.H. Effects of Catalyst Regeneration with and without Chlorine on Heptane Reforming Reactions over Pt/Al2O3 and Pt–Sn/Al2O3. J. Catal. 1999, 187, 219–229. [Google Scholar] [CrossRef]
- Pieck, C.L.; Vera, C.R.; Parera, J.M. Study of industrial and laboratory regeneration of Pt-Re/Al2O3 catalysts. In Catalyst Deactivation 2001 (Studies in Surface Science and Catalysis); Spivey, J.J., Roberts, G.W., Davis, B.H., Eds.; Elsevier: Amsterdam, The Nethelands, 2001; Volume 139, pp. 279–286. [Google Scholar]
- Acharya, D.R.; Hughes, R.; Kennard, M.A.; Liu, Y.P. Regeneration of fixed beds of coked chromia—alumina catalyst. Chem. Eng. Sci. 1992, 47, 1687–1693. [Google Scholar] [CrossRef]
- Sikkenga, D.L.; Zaenger, I.C.; Williams, G.S. Palladium catalyst reactivation. U.S. Patent 4,999,326, 12 March 1991. [Google Scholar]
- Ekstrom, A.; Lapszewicz, J. On the role of metal carbides in the mechanism of the Fischer-Tropsch reaction. J. Phys. Chem. 1984, 88, 4577–4580. [Google Scholar] [CrossRef]
- Ekstrom, A.; Lapszewicz, J. The reactions of cobalt surface carbides with water and their implications for the mechanism of the Fischer-Tropsch reaction. J. Phys. Chem. 1987, 91, 4514–4619. [Google Scholar] [CrossRef]
- Pedrick, L.E.; Mauldin, C.H.; Behrmann, W.C. Draft tube for catalyst rejuvenation and distribution. U.S. Patent 5,268,344, 7 December 1993. [Google Scholar]
- Owen, H.; Schipper, P.H. Process and apparatus for regeneration of FCC catalyst with reduced NOx and or dust emissions. U.S. Patent 5,338,439, 16 August 1994. [Google Scholar]
- Raterman, M.F. Two-stage fluid bed regeneration of catalyst with shared dilute phase. U.S. Patent 5,198,397, 30 March 1993. [Google Scholar]
- Apelian, M.R.; Fung, A.S.; Hatzikos, G.H.; Kennedy, C.R.; Lee, C.-H.; Kiliany, T.R.; Ng, P.K.; Pappal, D.A. Regeneration of noble metal containing zeolite catalysts via partial removal of carbonaceous deposits. U.S. Patent 5,393,717, 28 February 1995. [Google Scholar]
- Clark, D.E. Hydrocracking process using a reactivated catalyst. U.S. Patent 5,340,957, 23 August 1994. [Google Scholar]
- Yoshimura, Y.; Sato, T.; Shimada, H.; Matsubayashi, N.; Imamura, M.; Nishijima, A.; Yoshitomi, S.; Kameoka, T.; Yanase, H. Oxidative regeneration of spent molybdate and tungstate hydrotreating catalysts. Energy Fuels 1994, 8, 435–445. [Google Scholar] [CrossRef]
- Oh, E.-S.; Park, Y.-C.; Lee, I.-C.; Rhee, H.-K. Physicochemical changes in hydrodesulfurization catalysts during oxidative regeneration. J. Catal. 1997, 172, 314–321. [Google Scholar] [CrossRef]
- Aquavo, A.T.; Gayubo, A.G.; Atutxa, A.; Olazar, M.; Bilbao, J. Regeneration of a catalyst based on a SAPO-34 used in the transformation of methanol into olefins. J. Chem. Tech. Biotech. 1999, 74, 1082–1088. [Google Scholar] [CrossRef]
- Forbus, N.P.; Wu, M.M.-S. Regeneration of methanol/methyl ether conversion catalysts. U.S. Patent 4,777,156, 11 October 1988. [Google Scholar]
- Krishna, A.; Hsieh, C.; English, A.E.; Pecoraro, T.; Kuehler, C. Additives improve FCC process; increase catalyst life, lower regeneration temperatures and improve yield and quality of products cost effectively. Hydrocarbon Processing 1991, 59–66. [Google Scholar]
- Altomare, C.; Koermer, G.; Schubert, P.; Suib, S.; Willis, W. A designed fluid cracking catalyst with vanadium tolerance. Chem. Mater. 1989, 1, 459–463. [Google Scholar] [CrossRef]
- Aguinaga, A.; Montes, M. Regeneration of a nickel/silica catalyst poisoned by thiophene. Appl. Catal. A 1992, 90, 131–144. [Google Scholar] [CrossRef]
- Lowry, G.V.; Reinhard, M. Pd-Catalyzed TCE Dechlorination in Groundwater: Solute Effects, Biological Control, and Oxidative Catalyst Regeneration. Environ. Sci. Technol. 2000, 34, 3217–3223. [Google Scholar] [CrossRef]
- Trinh, D.C.; Desvard, A.; Martino, G. Process for regenerating used catalysts by means of hydrogen peroxide aqueous solution stabilized with an organic compound. U.S. Patent 4,830,997, 16 May 1989. [Google Scholar]
- Sherwood, D.E. Process for the reactivation of spent alumina-supported hydrotreating catalysts. U.S. Patent 5,230,791, 27 July 1993. [Google Scholar]
- Fung, S.C. Deactivation and regeneration/redispersion chemistry of Pt/KL-zeolite. In Catalyst Deactivation 2001 (Studies in Surface Science and Catalysis); Spivey, J.J., Roberts, G.W., Davis, B.H., Eds.; Elsevier: Amsterdam, The Nethelands, 2001; Volume 139, pp. 399–406. [Google Scholar]
- Didillon, B. Catalyst regeneration process and use of the catalyst in hydrocarbon conversion processes. U.S. Patent 5,672,801, 30 September 1997. [Google Scholar]
- Tsao, Y.-Y.P.; von Ballmoos, R. Reactivating catalysts containing noble metals on molecular sieves containing oxides of aluminum and phosphorus. U.S. Patent 4,929,576, 29 May 1990. [Google Scholar]
- Dufresne, P.; Brahma, N.; Girardier, F. Off-site regeneration of hydroprocessing catalysts. Rev. Inst. Fr. Pet. 1995, 50, 283–293. [Google Scholar]
- Clark, F.T.; Hensley, A.L., Jr. Process for regenerating a spent resid hydroprocessing catalyst using a group IIA metal. U.S. Patent 5,275,990, 4 January 1994. [Google Scholar]
- Brito, A.; Arvelo, R.; Gonzalez, A.R. Variation in structural characteristics of a hydrotreatment catalyst with deactivation/regeneration cycles. Ind. Eng. Chem. Res. 1998, 37, 374–379. [Google Scholar] [CrossRef]
- Teixeira-da-Silva, V.L.S.; Lima, F.P.; Dieguez, L.C. Regeneration of a deactivated hydrotreating catalyst. Ind. Eng. Chem. Res. 1998, 37, 882–886. [Google Scholar] [CrossRef]
- Snape, C.E.; Diaz, M.C.; Tyagi, Y.R.; Martin, S.C.; Hughes, R. Characterisation of coke on deactivated hydrodesulfurisation catalysts and a novel approach to catalyst regeneration. In Catalyst Deactivation 2001 (Studies in Surface Science and Catalysis); Spivey, J.J., Roberts, G.W., Davis, B.H., Eds.; Elsevier: Amsterdam, The Nethelands, 2001; Volume 139, pp. 359–365. [Google Scholar]
- Sherwood, D.E., Jr.; Hardee, J.R., Jr. Method for the reactivation of spent alumina-supported hydrotreating catalysts. U.S. Patent 5,445,728, 29 August 1995. [Google Scholar]
- Maholland, M.K.; Fu, C.-M.; Lowery, R.E.; Kubicek, D.H.; Bertus, B.J. Demetallization and passivation of spent cracking catalysts. U.S. Patent 5,021,377, 4 June 1991. [Google Scholar]
- Kubicek, D.H.; Fu, C.-M.; Lowery, R.E.; Maholland, K.M. Reactivation of spent cracking catalysts. U.S. Patent 5,141,904, 25 August 1992. [Google Scholar]
- Fu, C.-M.; Maholland, M.; Lowery, R.E. Reactivation of spent, metal-containing cracking catalysts. U.S. Patent 5,151,391, 29 September 1992. [Google Scholar]
- Hu, Y.; Luo, B.; Sun, K.; Yang, Q.; Gong, M.; Hu, J.; Fang, G.; Li, Y. Dry regeneration-demetalization technique for catalyst for residuum and/or heavy oil catalytic cracking. U.S. Patent 6,063,721, 16 May 2000. [Google Scholar]
- Walker, P.L., Jr.; Rusinko, F., Jr.; Austin, L.G. Gas Reactions of Carbon. Adv. Catal. 1959, 11, 133–221. [Google Scholar]
- Fulton, J.W. Regenerating Spent Catalyst. Chem. Eng. 1988, 96, 111–114. [Google Scholar]
- Richardson, J.T. Experimental determination of catalyst fouling parameters. Carbon profiles. Ind. Eng. Chem. Process Des. Dev. 1972, 11, 8–11. [Google Scholar] [CrossRef]
- Weisz, P.B.; Goodwin, R.B. Combustion of carbonaceous deposits within porous catalyst particles: II. Intrinsic burning rate. J. Catal. 1966, 6, 227–236. [Google Scholar] [CrossRef]
- Rostrup-Nielsen, J.R. Some principles relating to the regeneration of sulfur-poisoned nickel catalyst. J. Catal. 1971, 21, 171–178. [Google Scholar] [CrossRef]
- Hartenstein, H. Feasibility of SCR Technology for NOx Control Technology for the Milton R. Young Station, Center, North Dakota; Expert Report on behalf of the United States Department of Justice: Washington, DC, USA, July 2008. [Google Scholar]
- Hartenstein, H.; Ehrnschwender, M.; Sibley, A.F. SCR Regeneration-10 Years of R&D and Commercial Application. In Proceedings of Power Plant Air Pollution Control Mega Symposium, Baltimore, MD, USA, 24–28 August 2008. Paper No. 104.
- EPA; Office of Air and Radiation. Update on Cap and Trade Programs for SO2 and NOx. In Presented at the Enviornmental Markets Association, 12 Annual Spring Conference, Miami, FL, USA, 29 April–2 May 2008.
- EPA. NOx Budget Trading Program—Basic Information. Available online: http://www.epa.gov/airmarkt/progsregs/nox/docs/NBPbasicinfo.pdf (accessed on 31 October 2014).
- McIlvaine Company. News Release: Coal to Play Bigger Role in Future Power Generation With World Capacity of 1450 GW by 2012. Available online: http://www.mcilvainecompany.com/brochures/Alerts_for_Internet/s9%20moni/1104coal%20to%20play%20bigger%20role%20in%20future%20power%20generation.htm (accessed on 31 October 2014).
- Hjalmarsson, A.-K. NOx Control Technologies for Coal Combustion; IEACR/24; IEA Coal Research: Lexington, KY, USA, 1990. [Google Scholar]
- U.S. Department of Energy; Southern Company Services. Control of Nitrogen Oxide Emissions: Selective Catalytic Reduction. In Clean Coal Technology; Topical Report 9; U.S. Department of Energy: Pittsburgh, PA, USA; Southern Company Services: Birmingham, AL, USA, 1997. [Google Scholar]
- Janssen, F.; Meijer, R. Quality control of DeNOx catalysts: Performance testing, surface analysis and characterization of DeNOx catalysts. Catal. Today 1993, 16, 157–185. [Google Scholar] [CrossRef]
- Ashton, J.; Nackos, A.; Bartholomew, C.H.; Hecker, W.C.; Baxter, L. Poisoning/Deactivation of Vanadia/Titanium Dioxide SCR Catalysts in Coal Systems. In Presented at the 19th Annual Western States Catalysis Club Symposium, Albuquerque, NM, USA, 25 February 2005.
- Guo, X.; Nackos, A.; Ashton, J.; Bartholomew, C.H.; Hecker, W.C.; Baxter, L. Poisoning Study of V2O5-WO3/TiO2 Catalysts by Na, K, and Ca. In Presented at 19th Annual Western States Catalysis Club Symposium; Albuquerque, NM, USA: 25 February 2005.
- Forzatti, P.; Lietti, L.; Tronconi, E. Nitrogen Oxides Removal–Industrial. In Encyclopedia of Catalysis; Horváth, T.I., Ed.; Wiley: Hoboken, NJ, USA, 2003. [Google Scholar]
- Rubin, E.S.; Kalagnanam, J.R.; Frey, C.H.; Berkenpas, M.B. Integrated Environmental Control Modeling of Coal-Fired Power Systems. Journal of the Air and Waste Management Association 1997, 47, 1180–1188. [Google Scholar] [CrossRef]
- Cochran, J.R.; Ferguson, A.W. Selective Catalytic Reduction for NOx Emission Control. In Proceedings of the First International Conference on Air Pollution, Monterrey, Mexico, 16-18 Feb. 1993; Zannetti, P., Brebbia, C.A., Garcia Gardea, J.E., Ayala Milian, G., Eds.; Volume 1, pp. 703–718.
- Bullock, P.E.; Hartenstein, H.U. O&M Cost Reduction of a Coal-Fired US Merchant Plant Through an Optimized SCR Management Strategy Involving Catalyst Regeneration. In Proceedings of the Conference on Selective Catalytic Reduction and Selective Non-Catalytic Reduction for NOx Control, Pittsburgh, PA, USA, 15–17 May 2002.
- Babcock Hitachi’s Rejuvenation of Mehrum SCR Catalyst. In FGD and DeNOx Newsletter; No. 315; The McIlvaine Company: Northfield, IL, USA, 2004.
- McMahon, B. Catalyst regeneration: The business case. Power 2006, 150, 36–39. [Google Scholar]
- Zheng, Y.; Jensen, A.; Johnsson, J. Laboratory investigation of selective catalytic reduction catalysts: Deactivation by potassium compounds and catalyst regeneration. Ind. Eng. Chem. Res. 2004, 43, 941–947. [Google Scholar] [CrossRef]
- Khodayari, R.; Odenbrand, C. Regeneration of commercial SCR catalysts by washing and sulphation: effect of sulphate groups on the activity. Appl. Catal. B 2001, 33, 277–291. [Google Scholar] [CrossRef]
- Khodayari, R.; Odenbrand, C. Regeneration of commercial TiO2-V2O5-WO3 SCR catalysts used in bio fuel plants. Appl. Catal. B 2001, 30, 87–89. [Google Scholar] [CrossRef]
- Dörr, H.-K.; Koch, G.; Bastuck, W. Method for renewed activation of honeycomb-shaped catalyst elements for denitrating flue gases. U.S. Patent 6,387,836 (B1), 14 May 2002. [Google Scholar]
- Schneider, P.; Bastuck, W. Method to re-enable honeycomb catalyst elements constructed for the denitrification of flue gases. DE Patent 10222915 (B4), 15 January 2004. [Google Scholar]
- Budin, R.; Krotla, K.; Rabitsch, H. Process for regenerating used deNOx or dedioxin catalytic converters. U.S. Patent 6,484,733 (B2), 26 November 2002. [Google Scholar]
- Cooper, M.; Harrison, K.; Lin, C. An Experimental Program to Optimize SCR Catalyst Regeneration for Lower Oxidation of SO2 to SO3. In Proceedings of the 2006 Environmental Controls Conference, Pittsburgh, PA, USA, 16–18 May 2006.
- Patel, N.; Hartenstein, H.-U.; Wenz, F. Process for decoating a washcoat catalyst substrate. U.S. Patent 7,559,993 (B1), 14 July 2009. [Google Scholar]
- Patel, N.; Hartenstein, H.-U.; Wenz, F. Process for decoating a washcoat catalyst substrate. U.S. Patent 6,929,701, 16 August 2005. [Google Scholar]
- Tate, A.; Skipper, J.; Wenz, F. Environmentally sound handling of deactivated SCR catalyst. Coal Power, 31 July 2008. [Google Scholar]
- Hartenstein, H.U.; Hoffman, T. Method of regeneration of SCR catalyst. U.S. Patent 7,723,251, 25 May 2010. [Google Scholar]
- Servatius, P.; Schluttig, A. Lifetime extension of SCR-DeNOx catalysts using SCR-Tech’s high efficiency ultrasonic regeneration process. In Proceedings of 2001 Conference of Selective Catalytic Reduction and Selective Non-Catalytic Reduction for NOx Control, Pittsburgh, PA, USA, 16–18 May 2001.
- Hartenstein, H.; Gutberlet, H. Catalyst Regeneration—An Integral Part of Proper Catalyst Management. In Proceedings of the 2001 Workshop on Selective Catalytic Reduction, Baltimore, MD, USA, 13–15 November 2001.
- Wenz, F.; Deneault, R.; Franklin, H.N. The Goals, Challenges and Successes of Regenerating Selective Catalytic Reduction Catalyst. In Proceedings of the Electric Power 2006 Conference–NOx Control III–SCR Technologies, Atlanta, GA, USA, 2–4 May 2006.
- CoaLogix. Available online: http://www.coalogix.com (accessed on 31 October 2014).
- McCullen, S.B.; Wong, S.S.; Huang, T.J. Regeneration of noble metal-highly siliceous zeolite with sequential hydrogen halide and halogen or organic-halogen compound treatment. U.S. Patent 4,645,751, 24 February 1987. [Google Scholar]
- Borghard, W.S.; Huang, T.J.; McCullen, S.B.; Schoennagel, H.J.; Tsao, Y.-.P.; Wong, S.S. Redispersion of agglomerated noble metals on zeolite catalysts. U.S. Patent 4,657,874, 14 April 1987. [Google Scholar]
- Fung, S.C.; Rice, R.W. Process using halogen/oxygen for reactivating iridium and selenium containing catalysts. U.S. Patent 4,491,636, 1 January 1985. [Google Scholar]
- Fung, S.C. Redispersion of Ir catalysts by low temperature reduction step. U.S. Patent 4,467,045, 21 August 1984. [Google Scholar]
- Landolt, G.R.; McHale, W.D.; Schoennagel, H.J. Catalyst regeneration procedure. U.S. Patent 4,359,400, 16 November 1982. [Google Scholar]
- Fung, S.C.; Weissman, W.; Carter, J.L. Reactivation process for iridium-containing catalysts using low halogen flow rates. U.S. Patent 4,480,046, 30 October 1984. [Google Scholar]
- Fung, S.C. Low temperature decoking process for reactivating iridium and selenium containing catalysts. U.S. Patent 4,492,767, 8 January 1985. [Google Scholar]
- Fung, S.C.; Weissman, W.; Carter, J.L.; Kmak, W.S. Reactivating iridium and selenium containing catalysts with hydrogen halide and oxygen. U.S. Patent 4,491,635, 1 January 1985. [Google Scholar]
- Mohr, D.H. Process for regenerating a monofunctional large-pore zeolite catalyst having high selectivity for paraffin dehydrocyclization. U.S. Patent 4,855,269, 8 August 1989. [Google Scholar]
- Fung, S.C.; Tauster, S.J.; Koo, J.Y. Method of regenerating a deactivated catalyst. U.S. Patent 4,925,819, 15 May 1990. [Google Scholar]
- Fung, S.C.; Kmak, W.S. Reactivation of iridium-containing catalysts by halide pretreat and oxygen redispersion. U.S. Patent 4,444,896, 24 April 1984. [Google Scholar]
- Fung, S.C.; Weissman, W.; Carter, J.L. Reactivation process for iridium-containing catalysts using low halogen flow rates. U.S. Patent 4,444,895, 24 April 1984. [Google Scholar]
- Boyle, J.P.; Gilbert, J.B. Reactivation of iridium-containing catalysts. U.S. Patent 4,517,076, 14 May 1985. [Google Scholar]
- Buss, W.D.; Hughes, T.R. In situ hydrocarbon conversion catalyst regeneration and sulfur decontamination of vessels communicating with catalyst reactor. U.S. Patent 4,482,637, 13 November 1984. [Google Scholar]
- Cheng, W.-H. Regeneration of methanol dissociation catalysts. U.S. Patent 4,855,267, 8 August 1989. [Google Scholar]
- Huang, Y.-Y.; LaPierre, R.B.; McHale, W.D. Process for dispersing or redispersing a group VIII noble metal species on a porous inorganic support. European Patent 0,306,170 (B1), 8 March 1989. [Google Scholar]
- Hucul, D.A. Redispersal of Ru, Os, Rh and Pd catalysts and processes therewith. U.S. Patent 4,891,346, 2 January 1990. [Google Scholar]
- Fung, S.C.; Rice, R.W. Process for reactivating iridium-containing catalysts. U.S. Patent 4,447,551, 8 May 1984. [Google Scholar]
- Fung, S.C. Process for reactivating iridium-containing catalysts in series. U.S. Patent 4,472,514, 18 September 1984. [Google Scholar]
- Fung, S.C.; Rice, R.W. Process for reactivating iridium-containing catalysts. U.S. Patent 4,473,656, 25 September 1984. [Google Scholar]
- Huang, Y.-Y.; LaPierre, R.B.; McHale, W.D. Process for dispersing or redispersing a Group VIII noble metal species on a porous inorganic support. U.S. Patent 4,952,543, 28 August 1990. [Google Scholar]
- Fung, S.C.; Weissman, W.; Carter, J.L.; Kmak, W.S. Reactivating iridium-containing catalysts with hydrogen halide and oxygen. U.S. Patent 4,444,897, 24 April 1984. [Google Scholar]
- Fung, S.C. Low temperature decoking process for reactivating iridium containing catalysts. U.S. Patent 4,472,515, 18 September 1984. [Google Scholar]
- Dadyburjor, D.B. Regions of validity for models of regeneration of sintered supported metal catalysts. In Catalyst Deactivation (Studies in Surface Science and Catalysis); Delmon, B., Froment, G.F., Eds.; Elsevier: Amsterdam, The Nethelands, 1980; Volume 6, pp. 341–351. [Google Scholar]
- Jacobs, G.; Ma, W.; Gao, P.; Todic, B.; Bhatelia, T.; Bukur, D.B.; Davis, B.H. The application of synchrotron methods in characterizing iron and cobalt Fischer–Tropsch synthesis catalysts. Catal. Today 2013, 214, 100–139. [Google Scholar] [CrossRef]
- Van Steen, E.; Claeys, M.; Dry, M.E.; van de Loosdrecht, J.; Viljoen, E.L.; Visagie, J.L. Stability of nanocrystals: Thermodynamic analysis of oxidation and re-reduction of cobalt in water/hydrogen mixtures. J. Phys. Chem. B 2005, 109, 3575–3577. [Google Scholar]
- Ma, W.; Jacobs, G.; Ji, Y.; Bhatelia, T.; Bukur, D.B.; Khalid, S.; Davis, B.H. Fischer–Tropsch synthesis: Influence of CO conversion on selectivities, H2/CO usage ratios, and catalyst stability for a Ru promoted Co/Al2O3 catalyst using a slurry phase reactor. Top. Catal. 2011, 54, 757–767. [Google Scholar] [CrossRef]
- Jacobs, G.; Sarkar, A.; Ji, Y.; Patterson, P.M.; Das, T.K.; Luo, M.; Davis, B.H. Fischer-Tropsch synthesis: Characterization of interactions between reduction promoters and Co for Co/Al2O3–based GTL catalysts. In Proceedings of AIChE Annual Meeting, San Francisco, CA, USA, 12–17 November 2006.
- Das, T.K.; Jacobs, G.; Patterson, P.M.; Conner, W.A.; Davis, B.H. Fischer–Tropsch synthesis: characterization and catalytic properties of rhenium promoted cobalt alumina catalysts. Fuel 2003, 82, 805–815. [Google Scholar] [CrossRef]
- Jacobs, G.; Das, T.K.; Patterson, P.M.; Luo, M.; Conner, W.A.; Davis, B.H. Fischer–Tropsch synthesis: Effect of water on Co/Al2O3 catalysts and XAFS characterization of reoxidation phenomena. Appl. Catal. A 2004, 270, 65–76. [Google Scholar] [CrossRef]
- Moodley, D.J.; Saib, A.M.; van de Loosdrecht, J.; Welker-Nieuwoudt, C.A.; Sigwebela, B.H.; Niemanstsverdriet, J.W. The impact of cobalt aluminate formation on the deactivation of cobalt-based Fischer–Tropsch synthesis catalysts. Catal. Today 2011, 171, 192–200. [Google Scholar] [CrossRef]
- Jermwongratanachai, T.; Jacobs, G.; Shafer, W.D.; Ma, W.; Pendyala, V.R.R.; Davis, B.H.; Kitiyanan, B.; Khalid, S.; Cronauer, D.C.; Kropf, A.J.; Marshall, C.L. Fischer–Tropsch synthesis: Oxidation of a fraction of cobalt crystallites in research catalysts at the onset of FT at partial pressures mimicking 50% CO conversion. Top. Catal. 2014, 57, 479–490. [Google Scholar] [CrossRef]
- Azzam, K.; Jacobs, G.; Ma, W.; Davis, B.H. Effect of cobalt particle size on the catalyst intrinsic activity for Fischer–Tropsch synthesis. Catal. Lett. 2014, 144, 389–394. [Google Scholar] [CrossRef]
- Saib, A.M.; Borgna, A.; van de Loosdrecht, J.; van Berge, P.J.; Niemanstsverdriet, J.W. XANES study of the susceptibility of nano-sized cobalt crystallites to oxidation during realistic Fischer–Tropsch synthesis. Appl. Catal. A 2006, 312, 12–19. [Google Scholar] [CrossRef]
- Dalai, A.K.; Davis, B.H. Fischer–Tropsch synthesis: A review of water effects on the performances of unsupported and supported Co catalysts. Appl. Catal. A 2008, 348, 1–15. [Google Scholar] [CrossRef]
- Sadeqzadeh, M.; Chambrey, S.; Piché, S.; Fongarland, P.; Luck, F.; Curulla-Ferré, D.; Schweich, D.; Bousquet, J.; Khodakov, A.Y. Deactivation of a Co/Al2O3 Fischer–Tropsch catalyst by water-induced sintering in slurry reactor: Modeling and experimental investigations. Catal. Today 2013, 215, 52–59. [Google Scholar] [CrossRef]
- Sadeqzadeh, M.; Hong, J.; Fongarland, P.; Curulla-Ferre, D.; Luck, F.; Bousquet, J.; Schweich, D.; Khodakov, A.Y. Mechanistic modeling of cobalt based catalyst sintering in a fixed bed reactor under different conditions of Fischer–Tropsch synthesis. Ind. Eng. Chem. Res. 2012, 51, 11955–11964. [Google Scholar] [CrossRef]
- Soled, S.L.; Kiss, G.; Kliewer, C.; Baumgartner, J.; El-Malki, E.-M. Learnings from Co Fischer-Tropsch catalyst studies. In Present at 245th ACS National Meeting & Exposition, New Orleans, LA, USA, 7–11 April 2013.
- Hauman, M.M.; Saib, A.M.; Moodley, D.J.; Plessis, E.D.; Claeys, M.; van Steen, E. Re-dispersion of cobalt on a model fischer–tropsch catalyst during reduction–oxidation–reduction cycles. Chem. Catal. Chem. 2012, 4, 1411–1419. [Google Scholar]
- Weststrate, C.J.; Kizilkaya, A.C.; Rossen, E.T.R.; Verhoeven, M.W.G.M.; Ciobica, I.M.; Saib, A.M.; Niemanstsverdriet, J.W. Atomic and Polymeric Carbon on Co(0001): Surface Reconstruction, Graphene Formation, and Catalyst Poisoning. J. Phys. Chem. C 2012, 116, 11575–11583. [Google Scholar] [CrossRef]
- Weststrate, C.J.; Hauman, M.M.; Moodley, D.J.; Saib, A.M.; van Steen, E.; Niemanstsverdriet, J.W. Cobalt Fischer–Tropsch catalyst regeneration: The crucial role of the kirkendall effect for cobalt redispersion. Top. Catal. 2011, 54, 811–816. [Google Scholar] [CrossRef]
- Moodley, D.J.; van de Loosdrecht, J.; Saib, A.M.; Overett, M.J.; Datye, A.K.; Niemanstsverdriet, J.W. Carbon deposition as a deactivation mechanism of cobalt-based Fischer–Tropsch synthesis catalysts under realistic conditions. Appl. Catal. A 2009, 354, 102–110. [Google Scholar] [CrossRef]
- van de Loosdrecht, J.; Balzhinimaev, B.; Dalmon, J.-A.; Niemanstsverdriet, J.W.; Tsybulya, S.V.; Saib, A.M.; van Berge, P.J.; Visagie, J.L. Cobalt Fischer-Tropsch synthesis: Deactivation by oxidation? Catal. Today 2007, 123, 293–302. [Google Scholar]
- Saib, A.M.; Borgna, A.; van de Loosdrecht, J.; van Berge, P.J.; Niemanstsverdriet, J.W. In Situ surface oxidation study of a planar Co/SiO2/Si(100) model catalyst with nanosized cobalt crystallites under model Fischer−Tropsch synthesis conditions. J. Phys. Chem. B 2006, 110, 8657–8664. [Google Scholar] [CrossRef] [PubMed]
- Moodley, D.J.; van de Loosdrecht, J.; Saib, A.M.; Niemanstsverdriet, J.W. The formation and influence of carbon on cobalt-based Fischer-Tropsch synthesis catalysts: An integrated review. In Advances in Fischer-Tropsch Synthesis, Catalysts, and Catalysis; Davis, B.H., Occelli, M.L., Eds.; CRC Press Taylor & Francis Group: Boca Raton, FL, USA, 2010; pp. 49–81. [Google Scholar]
- Bezemer, G.L.; Herman, J.H.; Kuipers, P.C.E.; Oosterbeek, H.; Holewign, J.E.; Xu, X.; Kapteijn, F.; van Dillen, A.J.; de Jong, K.P. Cobalt particle size effects in the Fischer−Tropsch reaction studied with carbon nanofiber supported catalysts. J. Am. Chem. Soc. 2006, 128, 3956–3964. [Google Scholar] [CrossRef] [PubMed]
- Jacobs, G.; Ribeiro, M.C.; Ma, W.; Ji, Y.; Khalid, S.; Sumodjo, P.T.A.; Davis, B.H. Group 11 (Cu, Ag, Au) promotion of 15%Co/Al2O3 Fischer–Tropsch synthesis catalysts. Appl. Catal. A 2009, 361, 137–151. [Google Scholar] [CrossRef]
© 2015 by the authors; licensee MDPI, Basel, Switzerland. This article is an open access article distributed under the terms and conditions of the Creative Commons Attribution license (http://creativecommons.org/licenses/by/4.0/).
Share and Cite
Argyle, M.D.; Bartholomew, C.H. Heterogeneous Catalyst Deactivation and Regeneration: A Review. Catalysts 2015, 5, 145-269. https://doi.org/10.3390/catal5010145
Argyle MD, Bartholomew CH. Heterogeneous Catalyst Deactivation and Regeneration: A Review. Catalysts. 2015; 5(1):145-269. https://doi.org/10.3390/catal5010145
Chicago/Turabian StyleArgyle, Morris D., and Calvin H. Bartholomew. 2015. "Heterogeneous Catalyst Deactivation and Regeneration: A Review" Catalysts 5, no. 1: 145-269. https://doi.org/10.3390/catal5010145
APA StyleArgyle, M. D., & Bartholomew, C. H. (2015). Heterogeneous Catalyst Deactivation and Regeneration: A Review. Catalysts, 5(1), 145-269. https://doi.org/10.3390/catal5010145